Chemical and structural control of the partitioning of Co, Ce, and Pb in marine ferromanganese oxides Yoshio Takahashi a,b, * , Alain Manceau c , Nicolas Geoffroy c , Matthew A. Marcus d , Akira Usui e a Department of Earth and Planetary Systems Science, Graduate School of Science, Hiroshima University, Higashi-Hiroshima, Hiroshima 739-8526, Japan b Laboratory for Multiple Isotope Research for Astro- and Geochemical Evolution (MIRAGE), Hiroshima University, Hiroshima 739-8526, Japan c Environmental Geochemistry Group, LGIT, University J. Fourier and CNRS, BP 53, 38041 Grenoble Cedex 9, France d Advanced Light Source, Lawrence Berkeley National Laboratory, One Cyclotron Road, Berkeley, CA 94720, USA e Department of Natural Environmental Science, Faculty of Science, Kochi University, Kochi-shi, Kochi 780-8520, Japan Received 21 July 2006; accepted in revised form 1 November 2006 Abstract The oxidation state and mineral phase association of Co, Ce, and Pb in hydrogenetic, diagenetic, and hydrothermal marine ferroman- ganese oxides were characterized by X-ray absorption near-edge structure (XANES) and extended X-ray absorption fine structure (EXAFS) spectroscopy and chemical extraction. Cobalt is trivalent and associated exclusively with the Mn oxide component (vernadite). Cerium is tetravalent in all genetic-type oxides (detection limit for Ce(III) 5 at. %), including Fe-rich areas (ferrihydrite) of hydroge- netic oxides, and is associated primarily with vernadite. Thus, the extent of a Ce anomaly does not result from variations in redox con- ditions, but appears to be kinetically controlled, decreasing when the growth rate increases from hydrogenetic to diagenetic to hydrothermal oxides. Lead is divalent and associated with Mn and Fe oxides in variable proportions. According to EXAFS data, Pb is mostly sorbed on edge sites at chain terminations in Fe oxide and at layer edges in Mn oxide (ES complex), and also on interlayer vacancy sites in Mn oxide (TCS complex). Sequential leaching experiments, spectroscopic data, and electrochemical considerations sug- gest that the geochemical partitioning in favor of the Mn oxide component decreases from Co to Ce to Pb, and depends on their oxi- dative scavenging by Mn and Fe oxides. Ó 2006 Elsevier Inc. All rights reserved. 1. Introduction Marine ferromanganese oxides are found in a variety of environments and forms, such as hydrogenetic nodules and crusts on the deep-sea floor, diagenetic precipitates in sed- iments, hydrothermal deposits near oceanic ridges, and sinking Fe–Mn colloidal particles in the water column (Glasby, 2000). A common trait to all ferromanganese oxi- des is their enrichment in trace elements relative to seawa- ter. Their ubiquity, abundance, and importance in the cycling of trace elements has aroused the interest of scien- tists for several decades, in particular with respect to the geochemical partitioning and incorporation mechanisms of trace elements. These questions often have been addressed by interelement correlations using bulk chemical analysis (e.g., Moorby and Cronan, 1981; Calvert and Piper, 1984; Aplin and Cronan, 1985a,b; De Carlo and McMurtry, 1992; Wen et al., 1997), and selective dissolution (Moorby and Cronan, 1981; Aplin and Cronan, 1985b; Koschinsky and Halbach, 1995; Koschinsky and Hein, 2003). Few studies have used non-invasive spectroscopic methods, although they offer direct, and often unique, access to the problem (e.g., Dillard et al., 1982; Takahashi et al., 2000; Kuhn et al., 2003; Marcus et al., 2004a). In this paper, the oxidation states of Co, Ce, and Pb in hydrogenetic, diagenetic, and hydrothermal ferromanga- nese oxides were determined by X-ray absorption near-edge 0016-7037/$ - see front matter Ó 2006 Elsevier Inc. All rights reserved. doi:10.1016/j.gca.2006.11.016 * Corresponding author. Fax: +81 82 424 0735. E-mail address: [email protected](Y. Takahashi). www.elsevier.com/locate/gca Geochimica et Cosmochimica Acta 71 (2007) 984–1008
Transcript
www.elsevier.com/locate/gca
Geochimica et Cosmochimica Acta 71 (2007) 984–1008
Chemical and structural control of the partitioning of Co, Ce,and Pb in marine ferromanganese oxides
Yoshio Takahashi a,b,*, Alain Manceau c, Nicolas Geoffroy c,Matthew A. Marcus d, Akira Usui e
a Department of Earth and Planetary Systems Science, Graduate School of Science, Hiroshima University, Higashi-Hiroshima, Hiroshima 739-8526, Japanb Laboratory for Multiple Isotope Research for Astro- and Geochemical Evolution (MIRAGE), Hiroshima University, Hiroshima 739-8526, Japan
c Environmental Geochemistry Group, LGIT, University J. Fourier and CNRS, BP 53, 38041 Grenoble Cedex 9, Franced Advanced Light Source, Lawrence Berkeley National Laboratory, One Cyclotron Road, Berkeley, CA 94720, USA
e Department of Natural Environmental Science, Faculty of Science, Kochi University, Kochi-shi, Kochi 780-8520, Japan
Received 21 July 2006; accepted in revised form 1 November 2006
Abstract
The oxidation state and mineral phase association of Co, Ce, and Pb in hydrogenetic, diagenetic, and hydrothermal marine ferroman-ganese oxides were characterized by X-ray absorption near-edge structure (XANES) and extended X-ray absorption fine structure(EXAFS) spectroscopy and chemical extraction. Cobalt is trivalent and associated exclusively with the Mn oxide component (vernadite).Cerium is tetravalent in all genetic-type oxides (detection limit for Ce(III) � 5 at. %), including Fe-rich areas (ferrihydrite) of hydroge-netic oxides, and is associated primarily with vernadite. Thus, the extent of a Ce anomaly does not result from variations in redox con-ditions, but appears to be kinetically controlled, decreasing when the growth rate increases from hydrogenetic to diagenetic tohydrothermal oxides. Lead is divalent and associated with Mn and Fe oxides in variable proportions. According to EXAFS data, Pbis mostly sorbed on edge sites at chain terminations in Fe oxide and at layer edges in Mn oxide (ES complex), and also on interlayervacancy sites in Mn oxide (TCS complex). Sequential leaching experiments, spectroscopic data, and electrochemical considerations sug-gest that the geochemical partitioning in favor of the Mn oxide component decreases from Co to Ce to Pb, and depends on their oxi-dative scavenging by Mn and Fe oxides.� 2006 Elsevier Inc. All rights reserved.
1. Introduction
Marine ferromanganese oxides are found in a variety ofenvironments and forms, such as hydrogenetic nodules andcrusts on the deep-sea floor, diagenetic precipitates in sed-iments, hydrothermal deposits near oceanic ridges, andsinking Fe–Mn colloidal particles in the water column(Glasby, 2000). A common trait to all ferromanganese oxi-des is their enrichment in trace elements relative to seawa-ter. Their ubiquity, abundance, and importance in thecycling of trace elements has aroused the interest of scien-tists for several decades, in particular with respect to the
0016-7037/$ - see front matter � 2006 Elsevier Inc. All rights reserved.
geochemical partitioning and incorporation mechanismsof trace elements. These questions often have beenaddressed by interelement correlations using bulk chemicalanalysis (e.g., Moorby and Cronan, 1981; Calvert and Piper,1984; Aplin and Cronan, 1985a,b; De Carlo and McMurtry,1992; Wen et al., 1997), and selective dissolution (Moorbyand Cronan, 1981; Aplin and Cronan, 1985b; Koschinskyand Halbach, 1995; Koschinsky and Hein, 2003). Fewstudies have used non-invasive spectroscopic methods,although they offer direct, and often unique, access to theproblem (e.g., Dillard et al., 1982; Takahashi et al., 2000;Kuhn et al., 2003; Marcus et al., 2004a).
In this paper, the oxidation states of Co, Ce, and Pb inhydrogenetic, diagenetic, and hydrothermal ferromanga-nese oxides were determined by X-ray absorption near-edge
Co, Ce, and Pb in marine ferromanganese oxides 985
structure (XANES) spectroscopy to evaluate the impor-tance of redox reactions in trace element partitioning (Gold-berg, 1961, 1965; Goldberg et al., 1963; Piper, 1974; Burns,1976). Dillard et al. (1982) concluded using X-ray photoelec-tron spectroscopy (XPS) that cobalt is trivalent in marineferromanganese oxides, and Takahashi et al. (2000) thatcerium is tetravalent using XANES spectroscopy. Thesetwo studies were limited to metal-rich hydrogenetic samples.Pb enrichment in ferromanganese oxides has been suggestedto result from Pb(II) to Pb(IV) oxidation (Goldberg, 1965;Murray and Dillard, 1979), but this hypothesis has receivedlittle experimental support (Dillard et al., 1981). The abun-dances of Co, Ce, and Pb decrease on average from hydro-genetic to diagenetic to hydrothermal deposits (Usui et al.,1997), and the possibility that this evolution is associatedwith a variation of their oxidation state has not been inves-tigated. Such a relationship would provide insight intochemical processes responsible for the enrichment of re-dox-sensitive trace elements in ferromanganese oxides. Inparticular, questions remain as to the reasons for the vari-ability of the Ce anomaly in REE (rare earth elements) pat-terns, and its possible link to Ce oxidation state.
When considering redox reactions in ferromanganeseoxides, elemental distribution among Mn and Fe oxidesis an important issue. The nature of the trace element hostphases were investigated by electron microprobe, micro-XANES spectroscopy (l-XANES), and Pb LIII-edgeextended X-ray absorption fine structure (EXAFS) spec-troscopy, and the results compared to those from sequen-tial leaching to assess the usefulness of chemicalextraction to speciate trace metals in ferromanganesematrices.
2. Materials and methods
2.1. Samples
Seventeen samples collected during several researchcruises in the Central to NW Pacific Ocean and the CentralIndian Ocean were selected for this study (Table 1). Theywere classified into hydrogenetic (HG), diagenetic (DG),and hydrothermal (HT) origins on the basis of the mineral-ogy of the Mn oxide, as summarized in Table 1 (Takema-tsu, 1998). Samples 31GTV2-3 and 31GTV6-11 have amixed hydrogenetic and hydrothermal origin (Kuhnet al., 1998). The two samples had fast growth rates (10–20 mm/Myr) due to the supply of Mn and Fe from hydro-thermal plumes, but their trace elements are considered tobe derived mainly from seawater. Thus, they are labeledHT + HG in Table 1. Nodule D465 has a hydrogeneticcore and a diagenetic rim and the two parts were analyzedseparately. Samples containing P-rich layers were disre-garded because secondary phosphatization may modifythe original distribution of trace elements (Koschinskyet al., 1997). According to this reference, P concentrationin phosphatized crusts is higher than 2.5 wt%, a value wellabove the P content of our samples (see Section 3).
(>99.5%), and CeO2 (>99.9%) from Wako Pure ChemicalIndustries, Ltd., Katayama Chemicals, and Rare MetallicCo., Ltd. were used as references for XANES measure-ments. Powders were diluted to 0.5 wt% in boron nitrideand pressed into pellets. A Ce(OH)4 gel was prepared byhydrolyzing a Ce(NH4)2(NO3)6 solution at pH 7 in contactwith air (Sumaoka et al., 2000). No Ce(IV) reduction oc-curs at this Eh–pH condition (Brookins, 1988). TheCe(OH)4 gel recovered by filtration was re-suspended inwater at pH 7 and adjusted to a 0.5 wt% Ce concentrationfor XANES analysis.
Ferrihydrite (HFO) and d-MnO2 used in Co, Ce, and Pbsorption experiments for XANES measurements were syn-thesized according to Schwertmann and Cornell (2000) andMurray (1974), respectively. Sorption samples were pre-pared by adding 10 mL of 17.0 lM Co(II), 7.15 lM Ce(III),or 4.83 lM Pb(II) solutions (pH 5) prepared from nitratesalts to 1 mg ferrihydrite or d-MnO2 in suspension in syn-thetic seawater (Nishimura, 1983) at equilibrium with air. Fi-nal pH was adjusted to 7.0 (Co), 6.6 (Ce), and 6.5 (Pb) byincremental addition of HCl. The final pH was lower thanthat of seawater (8.2 ± 0.1) to prevent metal precipitation.The solid phases were recovered by filtration (0.45 lm;hydrophilic PTFE) after 1 h of reaction time, washed withbidistilled water (Milli-Q), and packed wet into polyethylenebags for XANES measurements. A Ce-sorbed ferrihydritesample was equilibrated for 120 h. The Ce, Co, and Pb con-centrations in the solid phases are about 0.1 wt%.
A separate series of Pb-sorbed d-MnO2 samples wereprepared as follows for EXAFS measurements. d-MnO2
was prepared by reducing at pH 7 a KMnO4 solution withMnCl2 (Villalobos et al., 2005). The precipitate waswashed, dialyzed, and stored at 5 �C in polypropylene con-tainers for several days at the synthesized solid concentra-tion (21.7 g/L). Pb-sorption samples were prepared byaddition of a Pb(NO3)2 solution to a d-MnO2 suspension(2 g/L, 0.1 M NaNO3) that had been pre-equilibrated atthe desired pH with an automatic titrator. After allowingseveral hours for equilibration at constant pH, the sorptionsample was filtered on a 0.1 lm cellulose nitrate membrane,washed with Milli-Q water to prevent the precipitation ofmetal salt, and freeze-dried. We know from previous stud-ies, and from the similarity of our Pb-EXAFS data (seeSection 3) with those collected on wet pastes (Villaloboset al., 2005) and powders frozen to 10–20 K (Morinet al., 2001), that the binding mechanism of hydrolyzablecations on phyllomanganates is not modified by freeze-dry-ing, probably because they form multidentate inner-spherecomplexes (Lanson et al., 2002a; Manceau et al., 2002a).Also, the stability in vacuum of the layer of water inthe interlayer of d-MnO2 and birnessite, which is attestedby the persistence of the basal X-ray reflection at �7 A,supports the view that data collected on freeze-dried
Table 1List of the samples of ferromanganese oxides studied in this work
Sample name Sampling site Cruise name Type of deposition Mineralogy of Mn oxidesa
a Turbostratic (i.e., c-disordered) phyllomanganates found in marine ferromanganese oxides have been named d-MnO2, buserite and birnessite in theliterature on the basis of the intensity and position of basal reflections by XRD. Today, it appears that there is no fundamental structural differencebetween all these phyllomanganate varieties. As discussed in Manceau et al. (2006), the use of the generic term vernadite, which dates back to long beforethe three others (Betekhtin, 1940), is preferred to describe natural turbostratic phyllomanganates. In sample D12-X2, the phyllomanganate layers arestacked regularly with a hexagonal sequence as in synthetic HBi (Silvester et al., 1997). Diffraction patterns are presented in Electronic Annex.
986 Y. Takahashi et al. 71 (2007) 984–1008
samples are representative of surface complexes at thewater-mineral interface. Four samples were prepared atpH 5 and Pb/Mn molar ratios, as measured by inductivelycoupled plasma-atomic emission spectrometry (ICP-AES),of 0.002 (PbdBi2), 0.044 (PbdBi44), 0.112 (PbdBi112), and0.197 (PbdBi197). One sample was prepared at pH 7 andintermediate surface loading to test the influence of pHon the structure of the Pb surface complex on d-MnO2.Its EXAFS spectrum was almost identical to the PbdBi44spectrum (data not shown). The effect of crystallinity wasinvestigated by comparing the data with those for Pbsorbed on well-crystalline hexagonal birnessite at pH 4and Pb/Mn molar ratio of 0.031 (sample PbBi31 in Lansonet al., 2002a). This reference had been characterized by EX-AFS spectroscopy previously (Manceau et al., 2002a), buta higher quality spectrum was recorded for this study.
2.3. Chemical compositions
The Mn, Fe, Co, Ni, Cu, and Zn concentrations in thenatural samples were measured by ICP-AES (YanacoUOP-1S) after acid digestion using HF/HCl/HNO3, andPb concentration was measured by inductively coupledplasma-mass spectrometry (ICP-MS) (VG PQ-3) using Bias an internal standard. The precision and accuracy ofthe analytical values were better than 10%, based on theanalysis of the JMn-1 reference prepared from ferromanga-nese oxide deposits distributed by the Geological Survey ofJapan (GSJ; Terashima et al., 1995). REE abundances weremeasured by ICP-MS using In and Bi as internal standards(Takahashi et al., 2000). Repeated analyses on JB-1a stan-
dard rock prepared by GSJ showed that the precision andaccuracy of the REE analyses were generally better than5%. REE abundances for D513 are from Ohta et al.(1999), and major and minor (including REE) element con-centrations for 31GTV2-3 and 31GTV6-11 are from Kuhnet al. (1998). Major elements and Co, Ni, Cu, Zn, Ce, andPb concentrations in samples CD25, D535, AD14, D465,D514, and FG352 were measured also with an electronprobe microanalyzer (EPMA, JXA-8200, JEOL), runningat 15 keV acceleration voltage and using a 5 lm-sized beam.
2.4. Sequential leaching experiments
Sequential leaching experiments were performed onpowdered samples, following the procedure described inKoschinsky and Hein (2003) and Koschinsky and Halbach(1995). Briefly, 0.5 g of powder was mixed with 15 mL of1 M acetic acid/Na acetate buffer (pH 5) at room tempera-ture for 5 h. The filtrate (fraction 1) was considered to in-clude exchangeable cations and cations initially present incarbonates. The residue was suspended in 25 mL of Milli-Q water and stirred with 87.5 mL of a 0.1 M hydroxyl-amine hydrochloride (NH3OHCl) solution (pH 2) for24 h. The filtrate at this step (fraction 2) contained cationsoriginally in Mn oxides. The new residue was suspended in100 mL of Milli-Q water and stirred with 87.5 mL of 0.2 Moxalic acid/ammonium oxalate buffer (pH 3.5) for 12 h.The filtrate (fraction 3) contained cations originally associ-ated with Fe oxides. The final residue, mainly consisting ofsilicates and aluminosilicates (fraction 4), was digested forbulk chemical analyses. The Mn, Co, Pb, and Ce concen-
Co, Ce, and Pb in marine ferromanganese oxides 987
trations in all filtrates were measured by ICP-MS after dilu-tion by a factor >100 in 2% HNO3, and the Fe concentra-tions were measured by ICP-AES. For each element, thesum of concentrations from fractions 1 to 4 divided bythe bulk concentrations (i.e., recovery of the leachingexperiments) was better than 82%.
Re-adsorption of dissolved ions on residual solid phasesmay occur during sequential leaching experiments (Rendellet al., 1980; Sholkovitz, 1989; Gilmore et al., 2001). Thefractions of metals re-adsorbed on Fe oxides and insolublephases (silicate and aluminosilicates) in the hydroxylaminehydrochloride extraction step were determined using 54Mn,58Co, 139Ce, and 146Gd radioisotope tracers (Ambe et al.,1995; Takahashi et al., 1997, 1999). Lead radioisotopes werenot included in the multitracer solution, and thus Pb was notanalyzed. The amounts of re-adsorbed radioisotopes wereobtained by measuring the c-ray spectrum of the filtrate witha Ge solid-state detector. Counting was stopped when the to-tal number of counts was at least 10,000 for each radioiso-tope. Measurements of the peak area and corrections of thedecay of each isotope were carried out by a routine procedure.
2.5. XANES and EXAFS measurements and analyses
Cerium LIII-edge and Co K-edge XANES spectra wererecorded on beamline BL12C at the KEK Photon Factoryin Tsukuba, Japan (Nomura and Koyama, 1996), and Pb-LIII-edge XANES spectra on beamline BL01B1 at SPring-8in Hyogo, Japan (Uruga et al., 1999). The two beamlineshave similar layouts. The X-rays were monochromatizedwith a pair of Si(111) crystals. The beam size at the sampleposition was about 1 · 1 mm2, and its intensity (I0) moni-tored with an ionization chamber. The sample was placedat 45� from the incident beam, and the fluorescent X-raysmeasured with a 19 element Ge solid-state detector. Atthe Co K-edge, the intensity of the unwanted fluorescencesignal from Mn and Fe was reduced by mounting a vana-dium filter (l t = 3 or 6) in front of the detector. Deadtimecorrection was done by the method of Nomura (1998).Energy was calibrated by assigning the energy of the firstpeak of CeO2 at 5730.5 eV (Ce LIII-edge), the absorptionmaximum of CoO (Co K-edge) at 7730.3 eV, and theabsorption maximum of PbO2 (Pb LIII-edge) at13061.5 eV (the first maximum of the derivative of elemen-tal Pb was at 13029 eV). XANES spectra were recordedwith a 0.25–1 eV step size and 1–5 s counting per step.One to five scans were summed to improve the signal-to-noise ratio, and all spectra were normalized to unit stepin the absorption coefficient. No radiation damage wasdetected during the data acquisition.
Bulk XANES measurements were complemented by mi-cro-XANES and X-ray fluorescence (XRF) mapping mea-surements for the hydrogenetic ferromanganese noduleCD25. The experiments were carried out on beamline10.3.2 at the Advanced Light Source (ALS), LawrenceBerkeley National Laboratory, USA (Manceau et al.,2002b; Marcus et al., 2004b). The sample was embedded
in a high purity resin (Eposet, Maruto Co., Ltd.), polishedon one face, and glued on a glass slide with a wax product(Skywax 415, Maruto Co., Ltd.). After polishing the otherface of the sample to a thickness of about 30 lm, the thinsection was removed from the glass support by dissolvingthe wax in o-xylene. An area of 1.2 · 1.1 mm2 from thefree-standing specimen was scanned under a 5 · 5 lm2
beam using steps of 5 lm. The distribution of Co and Cewere imaged by recording, for each element, one mapabove and another below their absorption K edges (7659and 7759 eV for Co; 5718 and 5730.5 eV for Ce, respective-ly) and calculating the difference maps. From visual com-parison of these elemental distributions, and from theMn/Fe ratio, specific points-of-interest (POIs) were select-ed for Co K-edge and Ce LIII-edge micro XANES mea-surements. To avoid the possibility of radiation damage,only one spectrum was collected at each spot, and spectrafrom nearby spots having similar compositions as seenfrom the XRF maps were averaged.
Fluorescence-yield Pb-EXAFS spectra of the two hydro-genetic samples AD14, D1-X1 and D21-m3 before treat-ment and after dissolution of the Mn oxides, as describedin Section 2.4, were recorded on the FAME (BM 30B)beamline at the European synchrotron radiation facility(ESRF) in Grenoble, France. The white X-ray beam wascollimated vertically to 3 mm with a bent Rh-coated Si mir-ror, monochromatized with a two-crystal Si (220) mono-chromator, sagitally focused to 300 lm with the secondcrystal, and vertically focused to 150 lm with a second bentRh-coated Si mirror downstream of the monochromator(Hazemann et al., 1995; Proux et al., 2006). X-ray fluores-cence was detected with a 30-Ge solid-state detector, andthe output signal processed with a fast amplifier (0.125 lsshaping time, 300 eV FWHM resolution). Multiple scanswere performed to improve statistics. To avoid the possibil-ity of radiation damage, the sample pellet was moved by0.5 mm after each scan.
The EXAFS data analysis was carried out using the codesfrom the WinXAS package (Ressler, 1998). Phase shifts andamplitude functions for the simulation of data were calcu-lated by FEFF7 (Ankudinov and Rehr, 1997) with quensel-ite as a structural model (Rouse, 1971). The experimentalEXAFS function, v (k), was obtained after subtracting theembedded-atom absorption background from the Pb–Lafluorescence signal normalized to the intensity of the inci-dent beam (I0), and normalizing the signal by the edge step.EXAFS spectra were Fourier transformed with a Besselapodization function to real (R) space, and backtrans-formed to k space for spectral simulation.
3. Results
3.1. Chemical composition
Abundances of Mn, Fe, Co, Ni, Cu, Zn, and Pb in bulksamples and in the local areas measured by EPMA arelisted in Tables 2 and 3. The contents of Co and Pb against
Table 2Bulk chemical analyses
Mn (wt %) Fe (wt %) Mn/Fe (wt ratio) Co (mg/kg) Cu (mg/kg) Ni (mg/kg) Zn (mg/kg) Pb (mg/kg)
d.l., below detection limit.a Data from Kuhn et al. (1998).
988 Y. Takahashi et al. 71 (2007) 984–1008
the Mn/Fe ratio are plotted in Fig. 1. We know from pre-vious studies (e.g., Moorby and Cronan, 1981; Calvert andPiper, 1984; Aplin and Cronan, 1985a,b; De Carlo andMcMurtry, 1992; Usui et al., 1997 Wen et al., 1997) thatthe Mn/Fe ratio increases, and Co and Pb concentrationsgenerally decrease, from hydrogenetic to diagenetic tohydrothermal Mn formations. Aside from samples31GTV2-3 and 31GTV6-11, our data are consistent withthis general trend, which confirms that the series of samplesincludes the three genetic types of ferromanganese oxide.The singularity of the two GTV samples, classified as amixture of hydrogenetic and hydrothermal oxides, is ex-plained by the incorporation of trace elements from seawa-ter (hydrogenetic characteristic) at a fast growth rate(hydrothermal characteristic) (Kuhn et al., 1998).
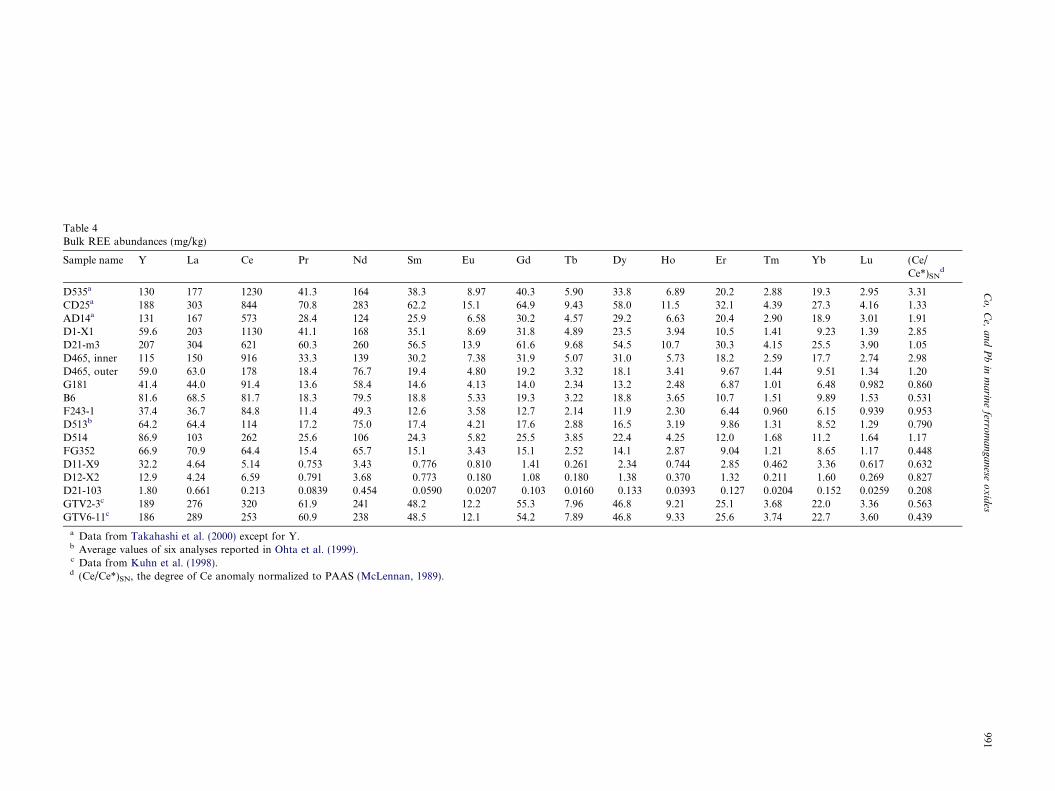
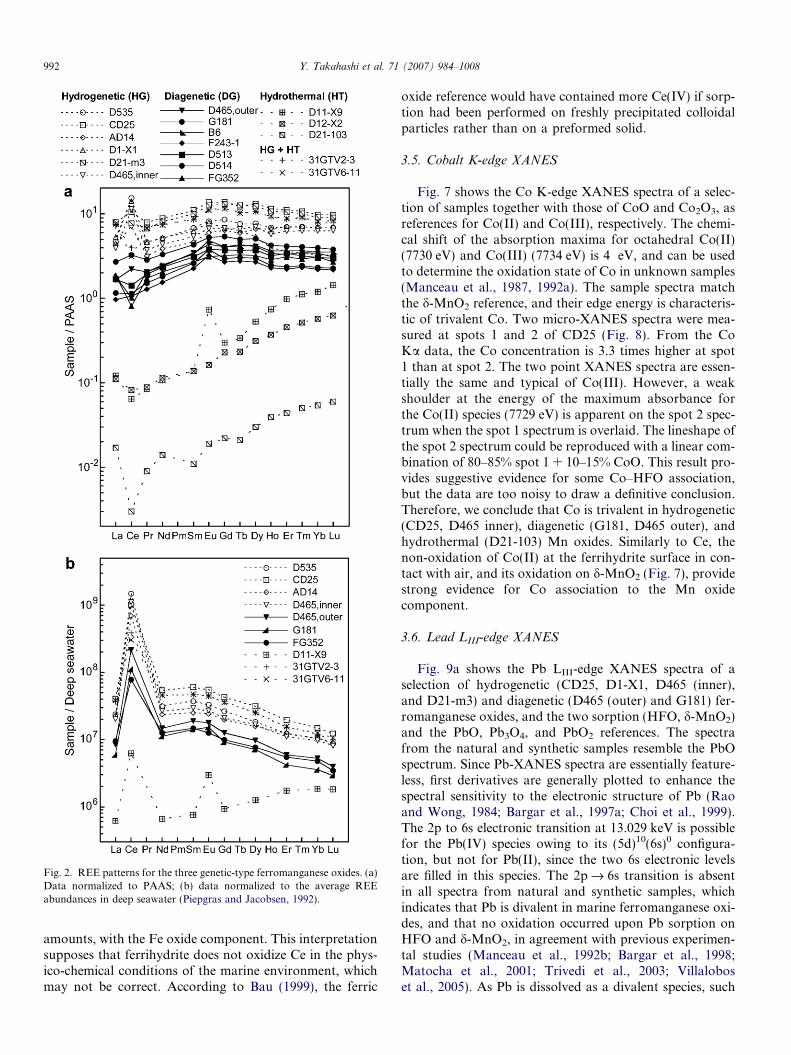
REE abundances are listed in Table 4, and values nor-malized to those of the Post-Archean Australian Shale,PAAS (McLennan, 1989) are plotted in Fig. 2a. REE areabundant in hydrogenetic oxides, intermediate in diagenet-ic oxides, and low in hydrothermal oxides. The Ce anomaly(Ce/Ce*)SN reported in Table 4 was calculated by defining(Ce*)SN = (La1/2Pr1/2)SN (Akagi and Masuda, 1998), wherethe subscript SN denotes the abundance normalized toPAAS. The Ce anomaly is referred to as positive ([Ce/Ce*]SN > 1) in hydrogenetic and negative ([Ce/Ce*]SN < 1)in hydrothermal oxides. Diagenetic samples have interme-diate values that are close to 1. The decrease in REE abun-dance and inversion of the Ce anomaly along thehydrogenetic–diagenetic–hydrothermal series is consistentwith previous studies (e.g., Usui et al., 1997), confirmingthat the series of samples is representative of the threegenetic types of marine ferromanganese oxide.
3.2. Sequential leaching experiments
The correlation of Co, Ce, and Pb with Fe, and theiranti-correlation with Mn in Fig. 1 do not necessarily imply
that they are chemically bound to or included in the struc-ture of the Fe oxide component (ferrihydrite). To gain fur-ther insight, sequential dissolution experiments wereconducted on four hydrogenetic samples (D535, AD14,D1-X1, and D21-m3) and two diagenetic samples (FG352and G181). The extent of Mn, Co, Ce, and Gd re-adsorp-tion on the Fe oxide after dissolution of the Mn oxide com-ponent was evaluated with the multitracer technique onD535 and AD14. Mn and Co were marginally readsorbed(<3%), but Ce (35 ± 24%) and Gd (46 ± 21%) were sub-stantially readsorbed.
From 59% (G181) up to 97% (D535 and D1-X1) of to-tal Co, and from 71% (G181) up to 95% (AD14 and D21-m3) of total Mn were leached in fraction 2 (hydroxyl-amine hydrochloride treatment, Fig. 3), while the ratioof dissolved Fe to total Fe remained low (7–24%). Thus,Mn oxides were preferentially dissolved over Fe oxidesduring the second extraction step, and this chemical treat-ment also released most of Co. The Co–Mn association,confirmed below by EPMA and XANES spectroscopy,indicates that the positive Co–Fe/Mn correlation inFig. 1 is misleading about the nature of the Co hostphase. From 75% (D535) to 99% (D21-m3) of total Pbwas leached out with Fe in fraction 3 (oxalate treatment).The co-extraction of Pb and Fe in ferromanganese oxideshas been interpreted as indicating Pb uptake on Fe oxides(e.g., Koschinsky and Halbach, 1995; Koschinsky andHein, 2003). This interpretation should be viewed cau-tiously, however, because Pb is prone to re-adsorption(Gilmore et al., 2001), and this side-effect is expected tobe larger than for REE, such as Ce and Gd (Sholkovitz,1989). Cerium extraction data are conclusive for D535and D1-X1 because Ce and Mn were eluviated together:75% Ce and 89% Mn in D535, 62% Ce and 87% Mn inD1-X1. In the other samples, Ce was eluviated predomi-nantly with Fe. Thus, re-adsorption of Mn oxide-boundCe on Fe oxides may artificially enhance the proportion
Table 3Electron microprobe analyses (wt%) in main growth structures
Samplename
Mn Fe Mn/Fe Al Si P Ti Co Ce Pb N (number of analyzedpoints); observed minorphase
D535 20.5–34.4 10.4–22.2 0.92–3.29 0.353–2.10 0.244–2.61 0.109–0.266 0.713–1.15 0.228–1.33 0.134–0.294 0.001–0.169 N = 30; Opal with high Fecontent27.9 16.4 1.81 0.69 0.645 0.217 0.904 0.679 0.208 0.087
(3.6) (3.1) (0.64) (0.42) (0.674) (0.045) (0.123) (0.428) (0.041) (0.044)CD25 15.5–36.3 9.35–27.8 0.570–3.82 0.044–0.654 0.167–4.40 0.150–0.379 0.829–2.88 0.243–1.32 0.028–0.825 d.l.–0.393 N = 90; opal with high Fe
content and particle withhigh contents of Fe and Ti
First row, range of concentrations; second row, average values, third row (in parentheses), standard deviations of the measured values. In some cases, the standard deviation exceeds the average valuedue to chemical heterogeneity. d.l., below detection limit; n.m., not measured.
Co
,C
e,a
nd
Pb
inm
arin
eferro
ma
nga
nese
ox
ides
989
Fig. 1. Co (a) and Pb (b) abundances as a function of the Mn/Fe ratio forthe series of ferromanganese oxides studied here and by Usui et al. (1997).Concentrations are from bulk and average EPMA analyses.
990 Y. Takahashi et al. 71 (2007) 984–1008
of Ce initially held by the Fe phase. Therefore, Ce is atleast partly associated with Mn, and perhaps also with Fe.
3.3. Electron microprobe
The micrometer-scale variability of the Co, Ce, and Pbcorrelations with Fe and Mn was examined by analyzingwith EPMA the main growth structures of three hydroge-netic samples (CD25, D535, and AD14). Fair to strong cor-relations were measured between Co and the Mn to Feratio: r2 = 0.64 for CD25, r2 = 0.76 for D535, and
r2 = 0.80 for AD14 (Fig. 4). In contrast, Pb and Ce lackedclear correlation with Fe and Mn.
3.4. Cerium LIII-edge XANES
The excitation energy of an element increases with itsoxidation state, due to an increase in binding energy of coreelectrons and the destabilization of antibonding states asthe formal valency of the metal ion increases (Bianconi,1988). The chemical shift at the Ce LIII-edge is illustratedin Fig. 5 with CeCl3 as Ce(III) reference, and CeO2,Ce(OH)4 gel, and Ce(SO4)2 as Ce(IV) references. The triva-lent species has an absorption maximum at 5726.5 eVattributed to a single electronic excitation from the 2p3/2
to the 5d states. The tetravalent species have two maximaat 5730 and 5738 eV attributed to a double electronic exci-tation in the final states, owing to a strong hybridization ofthe 4f states of Ce and the ligand orbitals (Jo and Kotani,1985; Kotani et al., 1987; Soldatov et al., 1994). The absor-bance of CeO2 and Ce(OH)4 is higher at 5730 eV than at5738 eV, and the two spectra have a shoulder at about5727 eV. These two features are attributed to many-bodyeffects and to the covalent nature of the Ce–O–Ce bond(Kaindl et al., 1988; Hu et al., 1994; Soldatov et al.,1994; Takahashi et al., 2002a). They are not observed inCe(SO4)2 and Ce-sorbed d-MnO2 because of the more ioniccharacter of the Ce(IV)–O bond in these compounds(Takahashi et al., 2002a). Apart from D465 (outer), allthe sample spectra are similar to those of Ce(SO4)2 andCe-sorbed d-MnO2, which indicates that Ce is exclusivelytetravalent in all genetic-types of ferromanganese oxide.The maximum amount of Ce(III), as estimated from spec-tral combinations of CeCl3 and Ce(SO4)2, is 5% for all sam-ples except for D465 (outer).
The previous set of bulk XANES spectra was comple-mented by a micro-XANES spectrum at a Mn-rich spot(spot 1) and an Fe-rich spot (spot 2) of CD25 (Fig. 6). Spot1 is within the main growth structure, and spot 2 is in theFe-rich region on the rim of the main growth structure.From the relative intensities of the Mn Ka and Fe Kb sig-nals, the Mn/Fe ratio at spot 1 is about 5.6 times higherthan that at spot 2. EPMA analysis of spot 2 gave31 wt% Fe, 16 wt% Si, and 0.32 wt% Mn. The Fe–Si asso-ciation may be due to nontronite (Sorem and Fewkes,1977; Halbach et al., 1988; Takematsu, 1998). Si may bespeciated also as amorphous silica (opal). Regardless ofthe contrasted chemical composition of the two analyzedspots, their XANES spectra were similar and indicativeof Ce(IV) only.
The nature of the main Ce host phase can be inferredfrom data on the two sorption references. Fig. 5 shows thatCe(III) was oxidized completely to Ce(IV) on d-MnO2, butnot on ferrihydrite (HFO). The small absorption feature at5738 eV in the HFO spectra is suggestive of Ce(IV), butthis species clearly is minor. Therefore, since Ce is tetrava-lent in all samples, it should be associated primarily withthe Mn oxide component and not, or in subordinate
Table 4Bulk REE abundances (mg/kg)
Sample name Y La Ce Pr Nd Sm Eu Gd Tb Dy Ho Er Tm Yb Lu (Ce/Ce*)SN
a Data from Takahashi et al. (2000) except for Y.b Average values of six analyses reported in Ohta et al. (1999).c Data from Kuhn et al. (1998).d (Ce/Ce*)SN, the degree of Ce anomaly normalized to PAAS (McLennan, 1989).
Co
,C
e,a
nd
Pb
inm
arin
eferro
ma
nga
nese
ox
ides
991
7
Fig. 2. REE patterns for the three genetic-type ferromanganese oxides. (a)Data normalized to PAAS; (b) data normalized to the average REEabundances in deep seawater (Piepgras and Jacobsen, 1992).
992 Y. Takahashi et al. 71 (2007) 984–1008
amounts, with the Fe oxide component. This interpretationsupposes that ferrihydrite does not oxidize Ce in the phys-ico-chemical conditions of the marine environment, whichmay not be correct. According to Bau (1999), the ferric
oxide reference would have contained more Ce(IV) if sorp-tion had been performed on freshly precipitated colloidalparticles rather than on a preformed solid.
3.5. Cobalt K-edge XANES
Fig. 7 shows the Co K-edge XANES spectra of a selec-tion of samples together with those of CoO and Co2O3, asreferences for Co(II) and Co(III), respectively. The chemi-cal shift of the absorption maxima for octahedral Co(II)(7730 eV) and Co(III) (7734 eV) is 4 eV, and can be usedto determine the oxidation state of Co in unknown samples(Manceau et al., 1987, 1992a). The sample spectra matchthe d-MnO2 reference, and their edge energy is characteris-tic of trivalent Co. Two micro-XANES spectra were mea-sured at spots 1 and 2 of CD25 (Fig. 8). From the CoKa data, the Co concentration is 3.3 times higher at spot1 than at spot 2. The two point XANES spectra are essen-tially the same and typical of Co(III). However, a weakshoulder at the energy of the maximum absorbance forthe Co(II) species (7729 eV) is apparent on the spot 2 spec-trum when the spot 1 spectrum is overlaid. The lineshape ofthe spot 2 spectrum could be reproduced with a linear com-bination of 80–85% spot 1 + 10–15% CoO. This result pro-vides suggestive evidence for some Co–HFO association,but the data are too noisy to draw a definitive conclusion.Therefore, we conclude that Co is trivalent in hydrogenetic(CD25, D465 inner), diagenetic (G181, D465 outer), andhydrothermal (D21-103) Mn oxides. Similarly to Ce, thenon-oxidation of Co(II) at the ferrihydrite surface in con-tact with air, and its oxidation on d-MnO2 (Fig. 7), providestrong evidence for Co association to the Mn oxidecomponent.
3.6. Lead LIII-edge XANES
Fig. 9a shows the Pb LIII-edge XANES spectra of aselection of hydrogenetic (CD25, D1-X1, D465 (inner),and D21-m3) and diagenetic (D465 (outer) and G181) fer-romanganese oxides, and the two sorption (HFO, d-MnO2)and the PbO, Pb3O4, and PbO2 references. The spectrafrom the natural and synthetic samples resemble the PbOspectrum. Since Pb-XANES spectra are essentially feature-less, first derivatives are generally plotted to enhance thespectral sensitivity to the electronic structure of Pb (Raoand Wong, 1984; Bargar et al., 1997a; Choi et al., 1999).The 2p to 6s electronic transition at 13.029 keV is possiblefor the Pb(IV) species owing to its (5d)10(6s)0 configura-tion, but not for Pb(II), since the two 6s electronic levelsare filled in this species. The 2p fi 6s transition is absentin all spectra from natural and synthetic samples, whichindicates that Pb is divalent in marine ferromanganese oxi-des, and that no oxidation occurred upon Pb sorption onHFO and d-MnO2, in agreement with previous experimen-tal studies (Manceau et al., 1992b; Bargar et al., 1998;Matocha et al., 2001; Trivedi et al., 2003; Villaloboset al., 2005). As Pb is dissolved as a divalent species, such
Fig. 3. Results from sequential dissolution of D535, AD14, D1-X1, and D21-m3 (hydrogenetic), and FG352 and G181 (diagenetic) ferromanganeseoxides. Metal speciation has been operationally defined by Koschinsky and Halbach (1995) and Koschinsky and Hein (2003) as follows. Fraction 1:exchangeable cations and Ca carbonate fraction; fraction 2: Mn oxide fraction; fraction 3: Fe oxyhydroxide fraction; fraction 4: residual fraction, mainlyconsisting of silicates and aluminosilicates.
Co, Ce, and Pb in marine ferromanganese oxides 993
as PbCln2�n and PbCO3
0, in seawater (Byrne, 2002), and asmany redox reactions are catalyzed at mineral surfaces(Wehrli, 1990), it has been conjectured that the oxidationof Pb(II) to Pb(IV) is the main enrichment mechanism ofPb in marine ferromanganese oxides (Goldberg, 1965;Hem, 1978; Murray and Dillard, 1979; Nishimura, 1983;Halbach et al., 1988). This hypothesis is not supportedby our data.
Since Pb is not oxidized by Mn oxides, XANES data donot allow determining whether Pb is associated with the Feor Mn oxide component. Based on sequential extractiondata, Pb is associated with Fe, but this macroscopic tech-nique for determining metal speciation has pitfalls, as men-tioned previously. To answer this question, the threehydrogenetic samples AD14, D1-X1 and D21-m3 wereexamined by EXAFS spectroscopy.
3.7. Lead LIII-edge EXAFS
3.7.1. Pb mineral host
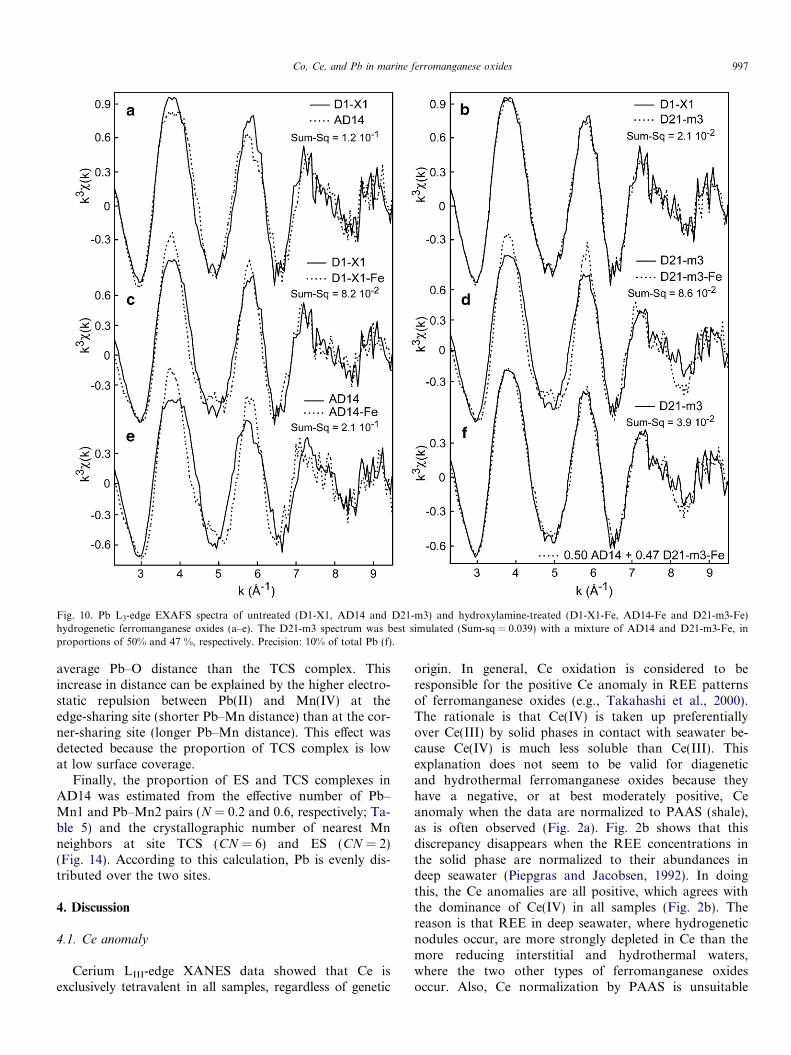
The mineralogical nature of the Pb host in AD14, D1-X1 and D21-m3 was determined by recording the EXAFSspectra of the untreated and hydroxylamine hydrochloridetreated (fraction 2) samples. The spectra can be classified inthree groups on the basis of their shape and frequency:AD14, D1-X1 and D21-m3, and the three treated samples(Fig. 10a–e). The spectra within each of the second andthird groups are statistically invariant, as illustrated inFig. 10b with D1-X1 and D21-m3. These two spectra couldbe reconstructed with a linear combination of untreatedAD14 and either of the treated samples (Fig. 10f). Conse-quently, the whole data set forms a binary system whichis bounded by AD14 and the Mn-free samples (fraction2). Comparison of the fraction 2 spectra with Pb-sorbed
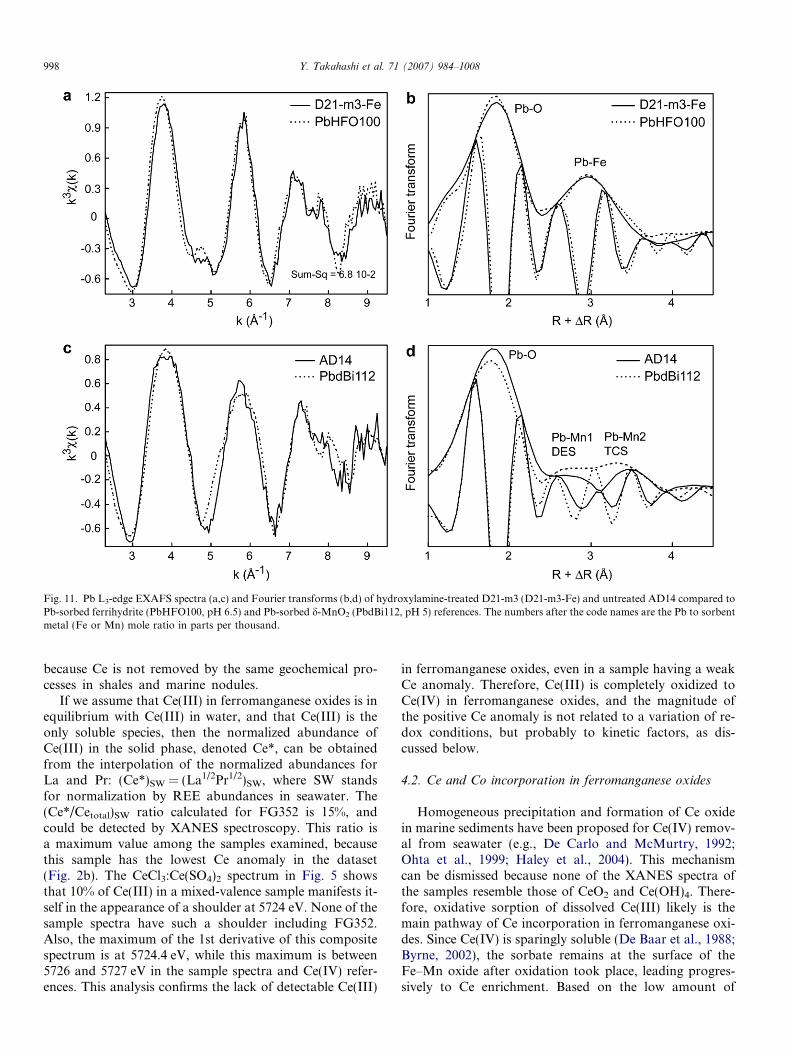
Fe (oxyhydr)oxides references from a database showed thatthe treated spectra matched best the ferrihydrite spectrum(PbHFO100), (Fig. 11a and b). This result is consistentwith chemistry and diffraction data, since Fe is speciatedas ferrihydrite in these samples.
The nature of the Pb host in AD14 was determined bycomparing its spectrum with those from the Pb-sorbed d-MnO2 references. The PbdBi112 spectrum provided thebest match to the data (Fig. 11c and d). The ferromanga-nese and reference spectra are similar, differing only inthe shape of the ascending part of the second oscillation.Qualitatively, one may conclude that Pb has a similarbinding environment, and hence likely occupies the samecrystallographic sites, in the natural and synthetic phyllo-manganates. This interpretation is supported by the Fouri-er transforms, which show that Pb has a similar localstructure in the two solids. Linear combinations of Mnand Fe (oxyhydr)oxide references verified that Pb is associ-ated only with the Mn oxide phase in AD14, with a detec-tion limit for Pb-ferrihydrite estimated at 10%. Since AD14and the fraction 2 spectra are from pure species, the frac-tional amounts of Fe- and Mn-bound Pb in D1-X1 andD21-m3 can be estimated from their spectral reconstructionwith the two single species spectra. The best fits to the D1-X1 and D21-m3 spectra were obtained with 50 ± 10% Mn-bound Pb and 47 ± 10% Fe-bound Pb (Fig. 10f).
3.7.2. Uptake mechanism of Pb
The nature of the polyhedral connectivity between Pband the Fe(O,OH)6 octahedra in ferrihydrite was deter-mined by least-squares fitting the reference rather thanthe sample data because the former had a highersignal-to-noise ratio. The Fourier transform of PbHFO100exhibits a Pb–O peak at R + D = 1.8 A and a Pb–Fe peak
Fig. 4. Co, Ce, and Pb abundances against Mn/Fe ratio in CD25, D535,and AD14. Data from electron microprobe analyses. Numbers inparenthesis are correlation coefficients (r2).
ig. 5. Cerium LIII-edge XANES spectra of a selection of ferromanganesexides and references. Ce-sorption reaction times are 1 h on d-MnO2 andFO-1 and 120 h on HFO-2. An overlay plot of the CeCl3 spectrum ispresented in dotted line for comparison. In some spectra, the position ofe maximum of the 1st derivative is indicated by an arrow. CeO2 ande(OH)4 have a shoulder at 5727 eV pointed out by an asterisk.
994 Y. Takahashi et al. 71 (2007) 984–1008
FoHrethC
at R + D = 2.9–3.0 A, or R � 2.3 A and 3.3–3.4 A, respec-tively, after semi-quantitative correction of the phase-shifteffect (Manceau et al., 1992b; Ford et al., 1999; Scheinostet al., 2001; Trivedi et al., 2003) (Fig. 11b). More preciseinteratomic distances were obtained from spectral fits.The best fit structural parameters derived from a two-shellfit model were 2.8 O atoms at 2.36 A and 1.6 Fe at 3.39 A(Fig. 12a; Table 5). This model failed to reproduce thewave node at 4.8 A�1 and the shape of the third oscillationat 7 A�1. Splitting the first oxygen shells in two subshellsmoderately improved the simulation, but splitting the iron
Fig. 7. Cobalt K-edge XANES spectra of a selection of ferromanganeseoxides and references. The CD25 spectrum is plotted over the spectra ofD465 inner and outer, G181, D21-103, and Co sorbed on d-MnO2 to guidethe eyes.
Fig. 6. Cerium LIII-edge micro XANES spectra at spot 1 in the growth structure and at spot 2 in the Fe-rich area of CD25. The locations of the analyzedspots are indicated by a cross in the X-ray fluorescence maps. White = high concentration.
Fig. 8. Cobalt K-edge micro XANES spectra at spots 1 and 2 on theX-ray fluorescence map presented in Fig. 6. The difference spectrumsuggests that 10–15 % of Co is divalent at spot 2.
Co, Ce, and Pb in marine ferromanganese oxides 995
shell improved it quite significantly as it halved thegoodness-of-fit parameter (Fig. 12b–d, Table 5). An opti-mal fit to the data was obtained with a four-shell model
consisting of about 3 O at 2.38 A, 1 O at 2.65 A, 2 Fe at3.32 A and 2 Fe at 3.50 A (Fig. 12d). The Pb–O distancesare characteristic of divalent Pb (Manceau et al., 1996),and the Pb–Fe distances of a bidentate edge-sharing com-plex (ES) between the Pb and Fe coordination polyhedra.
In contrast to ferrihydrite, the Pb-metal shell peak is adoublet (Mn1 and Mn2) in the Fourier transform ofAD14 (Fig. 11d), which is evidence for at least two Pb–Mn distances. Since the two Pb–Mn peaks are weak, thegeometry of the Pb surface complex and nature of the sorp-tion site in AD14 were determined from the analysis of the
Fig. 9. (a) Lead LIII-edge XANES spectra of hydrogenetic and diageneticferromanganese oxides and reference compounds. (b) First derivative ofsome XANES spectra.
996 Y. Takahashi et al. 71 (2007) 984–1008
Pb sorption reference spectra. The five phyllomanganatespectra intersect at the same k values, which signifies thatthe system is binary (Manceau et al., 1998), and thus thatthe local structure of Pb varies continuously between twowell-defined configurations (Fig. 13a). On the Fouriertransforms, the Mn2 peak has a high amplitude and theMn1 peak a weak amplitude at high surface loading inthe d-MnO2 series, and even more so in well-crystallizedbirnessite (PbBi31). Decreasing the surface loading downto Pb/Mn = 0.002 (sample PbdBi2) on d-MnO2 increasedthe amplitude of the Pb–Mn1 peak and concomitantly de-creased that of the Pb–Mn2 peak (Fig. 13b). The depen-dence of the relative amplitude of the two Pb–Mn peaks
on the Pb/Mn ratio and crystallinity demonstrates the pres-ence of two surface complexes having a different affinity forthe phyllomanganate surface, as shown previously for Znon phyllomanganate (Manceau et al., 2002a; Toner et al.,2006) and Cd on goethite (Spadini et al., 1994). Whenthe surface coverage is low and the surface area high (i.e.,d-MnO2), the short distance Pb species prevails, meaningthat it has a high affinity for the mineral surface, while itis outnumbered by the long distance and lower affinityPb species at high surface coverage.
Good spectral agreement between theory and experi-ment for the d-MnO2 series was obtained by consideringonly one shell of oxygens at 2.3 A and two Mn shells(Mn1 and Mn2) at 3.2 and 3.7 A (Fig. 12; Table 5). TheMn1 shell has been observed previously in d-MnO2 andmanganite (c-MnOOH), and was interpreted as an edge-sharing (ES) complex (Matocha et al., 2001; Morin et al.,2001). In ferrihydrite, in which the ES complex also occurs,the Pb–Fe interaction is about 0.1 A larger (i.e., 3.3 A) thanthe Pb–Mn interaction in d-MnO2, a value that matches thedifference in effective ionic radii between Mn(IV) andFe(III) (0.53 vs 0.64 A). Since d-MnO2 has a layered struc-ture and its crystallites have a small lateral extension (i.e.,low crystallinity), the ES complex is located probably atlayer edges and is presumably tridentate (Fig. 14). TheMn2 shell has been reported previously in well-crystallizedbirnessite and attributed to a tridentate corner-sharingcomplex (TCS) in the interlayer (Manceau et al., 1999,2002a; Morin et al., 1999; Matocha et al., 2001). This struc-tural interpretation was confirmed subsequently by elec-tron and X-ray diffraction (Drits et al., 2002; Lansonet al., 2002a). At this interlayer position, the Pb atomsare bonded to three O atoms from a vacant octahedral siteof the Mn oxide layer, thus helping to balance the chargedeficiency of the layer created by Mn(IV) vacancy sites(Fig. 14).
Consideration of a Mn3 shell at 4.09 A in PbBi31 betterreplicated the data than the single Mn2 shell model, in par-ticular in the 9 < k < 11 A�1 interval (Fig. 12k, Table 5).This second shell was not resolved in our previous study(Manceau et al., 2002a) because the EXAFS data were lim-ited to k < 10 A�1. The magnitude of the distance separa-tion between the Mn2 and Mn3 shells (4.09–3.70 =0.39 A) is similar to that in quenselite (3.96 � [(3.57 +3.43)/2] = 0.46 A; PbMnO2OH) (Rouse, 1971) and, byanalogy with the structure of this mineral, the six nearestPb–Mn distances from the TCS complex likely are un-equal. The incoherency of the Pb–Mn distances in Pb-sorbed birnessite explains the apparent loss of coordinationsince an effective number of N = 1.0 + 0.8 = 1.8 Mn atomsare detected instead of a crystallographic number ofCN = 6 (Fig. 14).
Another distinction among the reference spectra is a0.04 A reduction of the average Pb–O distance in PbBi31and PbdBi197 relative to PbdBi2, PbdBi44, and PbdBi112(Table 5). Since the first group of samples has a higherES/TCS ratio, the ES complex presumably has a longer
Fig. 10. Pb L3-edge EXAFS spectra of untreated (D1-X1, AD14 and D21-m3) and hydroxylamine-treated (D1-X1-Fe, AD14-Fe and D21-m3-Fe)hydrogenetic ferromanganese oxides (a–e). The D21-m3 spectrum was best simulated (Sum-sq = 0.039) with a mixture of AD14 and D21-m3-Fe, inproportions of 50% and 47 %, respectively. Precision: 10% of total Pb (f).
Co, Ce, and Pb in marine ferromanganese oxides 997
average Pb–O distance than the TCS complex. Thisincrease in distance can be explained by the higher electro-static repulsion between Pb(II) and Mn(IV) at theedge-sharing site (shorter Pb–Mn distance) than at the cor-ner-sharing site (longer Pb–Mn distance). This effect wasdetected because the proportion of TCS complex is lowat low surface coverage.
Finally, the proportion of ES and TCS complexes inAD14 was estimated from the effective number of Pb–Mn1 and Pb–Mn2 pairs (N = 0.2 and 0.6, respectively; Ta-ble 5) and the crystallographic number of nearest Mnneighbors at site TCS (CN = 6) and ES (CN = 2)(Fig. 14). According to this calculation, Pb is evenly dis-tributed over the two sites.
4. Discussion
4.1. Ce anomaly
Cerium LIII-edge XANES data showed that Ce isexclusively tetravalent in all samples, regardless of genetic
origin. In general, Ce oxidation is considered to beresponsible for the positive Ce anomaly in REE patternsof ferromanganese oxides (e.g., Takahashi et al., 2000).The rationale is that Ce(IV) is taken up preferentiallyover Ce(III) by solid phases in contact with seawater be-cause Ce(IV) is much less soluble than Ce(III). Thisexplanation does not seem to be valid for diageneticand hydrothermal ferromanganese oxides because theyhave a negative, or at best moderately positive, Ceanomaly when the data are normalized to PAAS (shale),as is often observed (Fig. 2a). Fig. 2b shows that thisdiscrepancy disappears when the REE concentrations inthe solid phase are normalized to their abundances indeep seawater (Piepgras and Jacobsen, 1992). In doingthis, the Ce anomalies are all positive, which agrees withthe dominance of Ce(IV) in all samples (Fig. 2b). Thereason is that REE in deep seawater, where hydrogeneticnodules occur, are more strongly depleted in Ce than themore reducing interstitial and hydrothermal waters,where the two other types of ferromanganese oxidesoccur. Also, Ce normalization by PAAS is unsuitable
Fig. 11. Pb L3-edge EXAFS spectra (a,c) and Fourier transforms (b,d) of hydroxylamine-treated D21-m3 (D21-m3-Fe) and untreated AD14 compared toPb-sorbed ferrihydrite (PbHFO100, pH 6.5) and Pb-sorbed d-MnO2 (PbdBi112, pH 5) references. The numbers after the code names are the Pb to sorbentmetal (Fe or Mn) mole ratio in parts per thousand.
998 Y. Takahashi et al. 71 (2007) 984–1008
because Ce is not removed by the same geochemical pro-cesses in shales and marine nodules.
If we assume that Ce(III) in ferromanganese oxides is inequilibrium with Ce(III) in water, and that Ce(III) is theonly soluble species, then the normalized abundance ofCe(III) in the solid phase, denoted Ce*, can be obtainedfrom the interpolation of the normalized abundances forLa and Pr: (Ce*)SW = (La1/2Pr1/2)SW, where SW standsfor normalization by REE abundances in seawater. The(Ce*/Cetotal)SW ratio calculated for FG352 is 15%, andcould be detected by XANES spectroscopy. This ratio isa maximum value among the samples examined, becausethis sample has the lowest Ce anomaly in the dataset(Fig. 2b). The CeCl3:Ce(SO4)2 spectrum in Fig. 5 showsthat 10% of Ce(III) in a mixed-valence sample manifests it-self in the appearance of a shoulder at 5724 eV. None of thesample spectra have such a shoulder including FG352.Also, the maximum of the 1st derivative of this compositespectrum is at 5724.4 eV, while this maximum is between5726 and 5727 eV in the sample spectra and Ce(IV) refer-ences. This analysis confirms the lack of detectable Ce(III)
in ferromanganese oxides, even in a sample having a weakCe anomaly. Therefore, Ce(III) is completely oxidized toCe(IV) in ferromanganese oxides, and the magnitude ofthe positive Ce anomaly is not related to a variation of re-dox conditions, but probably to kinetic factors, as dis-cussed below.
4.2. Ce and Co incorporation in ferromanganese oxides
Homogeneous precipitation and formation of Ce oxidein marine sediments have been proposed for Ce(IV) remov-al from seawater (e.g., De Carlo and McMurtry, 1992;Ohta et al., 1999; Haley et al., 2004). This mechanismcan be dismissed because none of the XANES spectra ofthe samples resemble those of CeO2 and Ce(OH)4. There-fore, oxidative sorption of dissolved Ce(III) likely is themain pathway of Ce incorporation in ferromanganese oxi-des. Since Ce(IV) is sparingly soluble (De Baar et al., 1988;Byrne, 2002), the sorbate remains at the surface of theFe–Mn oxide after oxidation took place, leading progres-sively to Ce enrichment. Based on the low amount of
Fig. 12. Model fits of the Pb-EXAFS data for lead sorbed on ferrihydrite (PbHFO), d-MnO2 (PbdBi) and well-crystallized birnessite (PbBi). The data arein solid lines, and the models in dashed lines, and the best-fit parameters for each model are listed in Table 5. The contributions from the Pb–O, Pb–Fe(ferrihydrite), and Pb–Mn (d-MnO2 and birnessite) nearest shells have been filtered by Fourier transformation.
Co, Ce, and Pb in marine ferromanganese oxides 999
Ce in seawater and the nanometer size of the ferrihydriteand manganese particles (Villalobos et al., 2006), satura-tion of reactive surface sites by Ce(IV) is unlikely to occur.Also, the exposed surface is progressively buried during thegrowth of the ferromanganese oxide. This process controlsthe Ce enrichment, and prevents poisoning of the surface,as observed in the laboratory at high sorbate–metal sorbent
ratio (Manceau et al., 1997). Therefore, Ce enrichmentmust be controlled by the growth rate of the ferromanga-nese oxide, as suggested for Co (Halbach et al., 1983;Mannheim and Lane-Bostwick, 1988; Takematsu et al.,1989). Consistent with this interpretation, the growth rateof ferromanganese oxides increases in the order hydroge-netic < diagenetic < hydrothermal oxides (Dymond et al.,
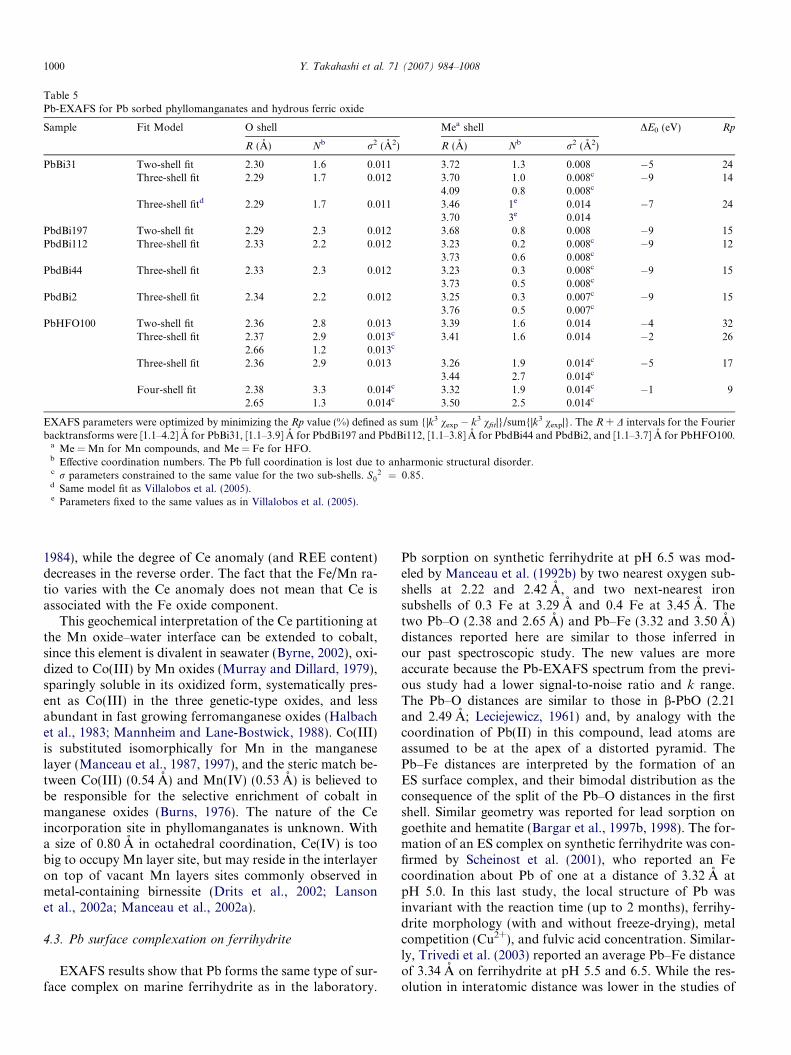
Table 5Pb-EXAFS for Pb sorbed phyllomanganates and hydrous ferric oxide
Sample Fit Model O shell Mea shell DE0 (eV) Rp
R (A) Nb r2 (A2) R (A) Nb r2 (A2)
PbBi31 Two-shell fit 2.30 1.6 0.011 3.72 1.3 0.008 �5 24Three-shell fit 2.29 1.7 0.012 3.70 1.0 0.008c �9 14
4.09 0.8 0.008c
Three-shell fitd 2.29 1.7 0.011 3.46 1e 0.014 �7 243.70 3e 0.014
EXAFS parameters were optimized by minimizing the Rp value (%) defined as sum {|k3 vexp � k3 vfit|}/sum{|k3 vexp|}. The R + D intervals for the Fourierbacktransforms were [1.1–4.2] A for PbBi31, [1.1–3.9] A for PbdBi197 and PbdBi112, [1.1–3.8] A for PbdBi44 and PbdBi2, and [1.1–3.7] A for PbHFO100.
a Me = Mn for Mn compounds, and Me = Fe for HFO.b Effective coordination numbers. The Pb full coordination is lost due to anharmonic structural disorder.c r parameters constrained to the same value for the two sub-shells. S0
2 ¼ 0:85.d Same model fit as Villalobos et al. (2005).e Parameters fixed to the same values as in Villalobos et al. (2005).
1000 Y. Takahashi et al. 71 (2007) 984–1008
1984), while the degree of Ce anomaly (and REE content)decreases in the reverse order. The fact that the Fe/Mn ra-tio varies with the Ce anomaly does not mean that Ce isassociated with the Fe oxide component.
This geochemical interpretation of the Ce partitioning atthe Mn oxide–water interface can be extended to cobalt,since this element is divalent in seawater (Byrne, 2002), oxi-dized to Co(III) by Mn oxides (Murray and Dillard, 1979),sparingly soluble in its oxidized form, systematically pres-ent as Co(III) in the three genetic-type oxides, and lessabundant in fast growing ferromanganese oxides (Halbachet al., 1983; Mannheim and Lane-Bostwick, 1988). Co(III)is substituted isomorphically for Mn in the manganeselayer (Manceau et al., 1987, 1997), and the steric match be-tween Co(III) (0.54 A) and Mn(IV) (0.53 A) is believed tobe responsible for the selective enrichment of cobalt inmanganese oxides (Burns, 1976). The nature of the Ceincorporation site in phyllomanganates is unknown. Witha size of 0.80 A in octahedral coordination, Ce(IV) is toobig to occupy Mn layer site, but may reside in the interlayeron top of vacant Mn layers sites commonly observed inmetal-containing birnessite (Drits et al., 2002; Lansonet al., 2002a; Manceau et al., 2002a).
4.3. Pb surface complexation on ferrihydrite
EXAFS results show that Pb forms the same type of sur-face complex on marine ferrihydrite as in the laboratory.
Pb sorption on synthetic ferrihydrite at pH 6.5 was mod-eled by Manceau et al. (1992b) by two nearest oxygen sub-shells at 2.22 and 2.42 A, and two next-nearest ironsubshells of 0.3 Fe at 3.29 A and 0.4 Fe at 3.45 A. Thetwo Pb–O (2.38 and 2.65 A) and Pb–Fe (3.32 and 3.50 A)distances reported here are similar to those inferred inour past spectroscopic study. The new values are moreaccurate because the Pb-EXAFS spectrum from the previ-ous study had a lower signal-to-noise ratio and k range.The Pb–O distances are similar to those in b-PbO (2.21and 2.49 A; Leciejewicz, 1961) and, by analogy with thecoordination of Pb(II) in this compound, lead atoms areassumed to be at the apex of a distorted pyramid. ThePb–Fe distances are interpreted by the formation of anES surface complex, and their bimodal distribution as theconsequence of the split of the Pb–O distances in the firstshell. Similar geometry was reported for lead sorption ongoethite and hematite (Bargar et al., 1997b, 1998). The for-mation of an ES complex on synthetic ferrihydrite was con-firmed by Scheinost et al. (2001), who reported an Fecoordination about Pb of one at a distance of 3.32 A atpH 5.0. In this last study, the local structure of Pb wasinvariant with the reaction time (up to 2 months), ferrihy-drite morphology (with and without freeze-drying), metalcompetition (Cu2+), and fulvic acid concentration. Similar-ly, Trivedi et al. (2003) reported an average Pb–Fe distanceof 3.34 A on ferrihydrite at pH 5.5 and 6.5. While the res-olution in interatomic distance was lower in the studies of
Fig. 13. Pb L3-edge EXAFS spectra (a) and Fourier transforms (b) of Pb sorbed on d-MnO2 (PbdBi series) and well-crystallized birnessite (PbBi) atdifferent Pb/Mn ratio.
Fig. 14. Structural model for the uptake mechanism of Pb on Mn3+-free phyllomanganate. TCS and DES are triple-corner and double-edge sharingcomplexes. At low surface loading, Pb occupies both lateral (DES) and basal (TCS) sites of the MnO2 layer. On the lateral site, the base of the Pb pyramidis formed by two conjoined edges from two neighboring Mn(IV) octahedra (tridendate edge-sharing complex). On the basal site, the base of the Pbpyramid is formed by the face of a vacant Mn(IV) layer octahedron and, therefore, is parallel to the layer plane (tridendate corner-sharing complex).
Co, Ce, and Pb in marine ferromanganese oxides 1001
1002 Y. Takahashi et al. 71 (2007) 984–1008
Scheinost et al. (2001) and Trivedi et al. (2003), all of theabove results collectively support the formation of edge-sharing lead complex on ferrihydrite, regardless of its ori-gin and formation conditions. In particular, there is nospectroscopic evidence for the existence of Pb–Cl pairs innatural samples and, hence, for the formation of a Pb–Cl–Fe ternary surface complex, despite the high activityof chlorine (0.54 M) in seawater. This finding was predictedfrom laboratory studies (Balistrieri and Murray, 1982; Bar-gar et al., 1998).
4.4. Pb surface complexation on phyllomanganate
Two short distance Pb–Mn pairs were identified, one at3.2 A and another at 3.7 A, corresponding to ES and TCScomplexes, respectively. The ES complex occurs at layeredges (Morin et al., 2001) and the TCS complex in theinterlayer (Manceau et al., 1999, 2002a,b; Morin et al.,1999; Matocha et al., 2001). The detection of the ES com-plex at low Pb loading in d-MnO2 indicates that it has ahigh affinity for the phyllomanganate surface. This com-plex likely occurs in PbBi31, but its fractional amount rel-ative to the TCS complex is negligible because PbBi31contains 15 times more Pb than PbdBi2, and its particleshave a larger lateral size (i.e., better crystallinity). Their lat-eral dimension, as estimated by X-ray diffraction from thesize of coherent scattering domains (CSD), is �200 A (Lan-son et al., 2002a) compared to 60 A for d-MnO2 (Villaloboset al., 2003), consistent with Brunauer–Emmett–Teller(BET) measurements, showing that the well-crystallizedbirnessite particles have an external (N2) specific surfacearea of 27 m2/g (Manceau and Charlet, 1992) vs. 120–150 m2/g for d-MnO2 (Villalobos et al., 2003).
The higher affinity of lead for lateral sites cannot be ex-plained by a higher number of Pb–O–Mn bonds at thesesites since in the proposed structural model (Fig. 14) leadis coordinated to three surface oxygens on both interlayerand external sites (i.e., formation of a tridentate complexon both sites). The reason may be electrostatic in nature.Because the three oxygens from a vacant octahedral siteare doubly coordinated to layer Mn, the total charge deficitat a TCS site is 3· [(�2) + 2· (4+/6)] = �2 v.u. Thus, sorp-tion of two protons or one Pb2+ at a TCS site compensatesthe charge deficit on either side of a Mn(IV) vacancy (Sil-vester et al., 1997). In contrast, the ES site has two oxygenssingly coordinated to bulk Mn atoms and one doubly coor-dinated (Fig. 14). The total charge at an ES site is2· [(�2) + (4+/6)] + [(�2) + 2· (4+/6)] = �3.3 v.u. Itscharge compensation requires the sorption of one Pb2+
and one or two protons. Then, the high reactivity of lateralsites towards metal sorption can be viewed as the conse-quence of the lamellar structure of d-MnO2 and the nano-meter size of the particles (high external to internal surfaceratio). One may argue that basal sites should be preferredover lateral sites since conjoined edges have significantlymore Pb2+–Mn4+ repulsion (shorter Pb–Mn distance) thanTCS sites. However, lateral sites have less steric restriction
than basal sites because two of the three surface oxygensare singly coordinated in the first case, whilst they are alldoubly coordinated in the second.
4.5. Evaluation of the formation of DCS complexes at layer
edges
The progressive reduction in amplitude of the TCS Pb–Mn peak (d(Pb–Mn2) = 3.7 A) with decreasing Pb/Mn ra-tio (Fig. 13b) is interpreted as the preponderance of a highsurface-affinity ES complex (d(Pb–Mn1) = 3.2 A) at lowsurface coverage. This evolution also has been interpretedby the existence of a double-corner sharing (DCS) complexon layer edges with a Pb–Mn distance of 3.50–3.55 A (Vill-alobos et al., 2005). In this alternative model, the TCS andDCS sites were supposed to be occupied concurrently andindependently of the Pb/Mn ratio, meaning that Pb had thesame affinity for external (DCS) and internal (TCS) sites.As explained below, this structural interpretation isproblematic.
In the DCS + TCS model of Villalobos et al. (2005), thedata were fit with the following assumptions. First, Pbforms a DCS complex (CN = 2) at layer edges and aTCS complex (CN = 6) in interlayers. This predeterminedstructural model was used in the spectral simulationsto constrain the EXAFS numbers (N) of Mnneighbors at each site to the Pb occupancy (fext and fint,with fext + fint = 1), such that N(DCS) = 2 · fext andN(TCS) = 6 · fint. For example, if Pb was evenlydistributed among the two sorption sites, thenN(DCS) = 2 · 0.5 = 1.0, and N(TCS) = 6 · 0.5 = 3. Sec-ond, the structural disorder is anharmonic in the O shell(N(EXAFS) < CN) and harmonic in the Mn shells (N(EX-AFS) = CN). This assumption is incorrect for the immensemajority of Pb compounds, including sorption complexes(Manceau et al., 1996; Bargar et al., 1997a). In practice,this model reproduced the data fairly well (Fig. 12j), butwith generally meaningless values (e.g., r = 0.16 A) forthe Debye–Waller parameter (the harmonic model be-comes questionable when r is higher than �0.10 A; Teo,1986; Crozier, 1997). With one exception this disorderparameter was arbitrarily fixed to a lower value for themore distant TCS shell than for the DCS shell, as if thestructural disorder in solid matter could decrease with radi-al distance. Still another problem with the DCS + TCSmodel is the unrealistically large interval of variation ofthe energy threshold parameter (�21 6 D E0 6 �13 eV).In a binary system, this parameter should be constant, bothfor physical reasons and to decrease the degree of freedom(Schlegel et al., 2001), otherwise non-linear least-squaresfits converge to local minima and, hence, to erroneousstructural solution.
Consequently, the physical and mathematical problemswith the DCS + TCS model are believed to be the reasonsfor the misidentification of the ES complex at 3.2 A as aDCS complex at 3.50–3.55 A. To test this hypothesis, thePbBi31 spectrum was fit successively with the TCS
Fig. 15. Electronic waves from the two Mn shells at R = 3.46 (N = 1.0,r2 = 0.014 A2) and R = 3.70 A (N = 3.0, r2 = 0.014 A2) for PbBi31 in themodel fit of Pb-sorbed phyllomanganate proposed by Villalobos et al.(2005). The two waves are out-of-phase at 6.5 A�1 (DE0 = 0 eV).
Co, Ce, and Pb in marine ferromanganese oxides 1003
(Fig. 12i) and the DCS + TCS (Fig. 12j) models. This samplecontains major TCS and minor ES complexes because it has15 times more Pb than PbdBi2, and its particles have a largelateral dimension. The TCS model (R = 3.72 A, N = 1.3,r2 = 0.008 A2) and the DCS + TCS model (R = 3.46 A,N = 1.0, r2 = 0.014 A2 + R = 3.70 A, N = 3.0, r2 =0.014 A2) equally reproduced the data (Rp = 24, Table 5),and accounted for the major spectral features. This appar-ently anomalous result has a simple explanation.
Consider an EXAFS signal consisting of waves fromtwo shells as in the DCS + TCS model, with the shells dif-fering only in distance and coordination number. A simpli-fied representation of this signal is given by
v ¼ AðkÞ expð2ikRþ dðkÞÞð1þ a expð2ikDrÞÞ
where A and d are the usual single-scattering EXAFS terms,a is the ratio of amplitudes of the two shells, R the distancefor the stronger shell (TCS), and Dr the distance difference.In our case, a = 1/3 since fext = fint, R = 3.70 A, andDr = �0.24 A. For these values, the phase difference 2kDr
is p at k = 6.5 A�1 and, the two waves interfere destructivelyover most of the data range (Fig. 15). This makes the coordi-nation number appear small, and the FT peak low in ampli-tude. However, it is not obvious that the sum of the twowaves really looks like a single wave. We can show that itdoes by considering the phase difference between the com-bined signal (DCS + TCS model) and that from a singlewave (TCS model) with distance R:
D/ ¼ argð1þ a expð2ikDrÞÞ
If we draw an Argand diagram (phasor plot), we see that asa function of k, this phase difference oscillates between lim-its of ± sin�1a, which is about 19� (0.34 rad) here. Theextrema occur when 2kDr = p ± (p/2 � sin�1 a). In ourcase, DR = 0.24 A, so these points occur at k = 4 and9.1 A�1, approximately bracketing the range where the sig-nal is largest. Thus, within that range, there is an approxi-mately linear phase difference between the DCS + TCS andTCS-only signals, which can be compensated for in thedata fitting by adjusting the assumed distance (i.e., 3.70
vs. 3.72 A) and energy origin (i.e., DE0 = �7 vs �5 eV, Ta-ble 5). The above argument even accounts for the distancein the TCS model fit (3.72 A) being greater than the greaterof the two distances in the DCS + TCS model (3.70 A).The phase difference D/ is negative for k < p/(2DR), zeroat k = p/(2DR), where the shells are exactly out of phase,and positive for k > p/(2DR), which is the effect providedby a distance increase over R, plus a small adjustment ofthe energy origin DE0. Similarly, the amplitude can beshown to be approximately (within the goodness of thefit to TCS-only) described by a change of mean-square rel-ative deviation (i.e., r value). We see that unless the dataare taken over a large k-range and fit to very good models,it can be impossible to tell the difference between a singleshell (TCS model) and a pair of shells (DCS + TCS model)of different coordination numbers and distances. Here, thecorrect model (ES + TCS) was determined by varyingexperimentally the Pb/Mn ratio over two orders of magni-tude (0.002 <Pb/Mn < 0.197 in the d-MnO2 series) com-pared to a factor of 5 (0.035 6 Pb/Mn 6 0.174) inVillalobos et al. (2005), and by constraining the variationrange of the fit parameters to physically meaningful values.
4.6. Pb partitioning among Mn and Fe oxide
With a Mn/Fe weight ratio of 1.04 (Table 2) and a Mn-to Fe-bound lead ratio of approximately 1, lead is unfrac-tionated between the two oxides in D21-m3. In contrast, itis moderately partitioned in the Mn oxide in D1-X1 (Mn/Fe = 0.3; Mn-bound/Fe-bound �1), and strongly parti-tioned in AD14 (Mn/Fe = 1.1; Mn-bound/Fe-bound > 9).The sorption of Pb on both Fe and Mn oxide in D21-m3and D1-X1 can be explained by the fact that conjoinededge sites also exist at chain terminations in ferrihydrite(Drits et al., 1993) which also have a high affinity for cat-ions (Spadini et al., 1994). Therefore, tridentate sites atchain terminations in Fe oxide and at layer edges in Mnoxide may sorb lead equally in marine ferromanganese oxi-des. The similarity of the O–O conjoined edge distances forFeO6 octahedra (2.59 A; Szytula et al., 1968) and MnO6
octahedra (2.62 A; Lanson et al., 2002b) also explains theability of the two oxides to complex Pb(II) adions in triden-tate edge-sharing geometries. Fe oxides may also bind met-al adions in bidentate edge-sharing geometries (i.e., sharingof only one edge with a single octahedron), but apparentlythe energy stabilization gained from forming multiple edgebonds to the Fe oxide surface is higher (Spadini et al.,2003). In summary, from a structural standpoint, leadmay sorb on either oxide, and its strong partitioning inAD14 does not have a simple structural explanation.
It has been suggested that lead is associated with the Feoxide component in marine ferromanganese oxides becausePb is speciated as neutral or negatively charged moieties,such as PbðCO3Þð2�2nÞ�
n ðn > 1Þ and because Fe oxides havea net positive charge and Mn oxides a net negative chargeat circumneutral pH (Stumm, 1993; Koschinsky and Hal-bach, 1995; Langmuir, 1997; Koschinsky and Hein,
1004 Y. Takahashi et al. 71 (2007) 984–1008
2003). This electrostatic explanation to geochemical parti-tioning on Fe oxide is satisfying for anionic species, suchas AsO3
3� and AsO43� (e.g., Smedley and Kinniburgh,
2002; Koschinsky and Hein, 2003), but not for Pb becausecationic moieties (Pb2+, PbCl+, and PbOH+) co-exist withneutral and negative species in seawater according to chem-ical equilibrium calculations. Three explanations can beproposed for Pb sorption on Fe and Mn oxides in seawa-ter. First, cationic lead species preferentially sorb on Mnoxide and anionic lead species on Fe oxide. Second, sorp-tion of cationic Pb species on Mn oxide shifts chemicalequilibrium in direction of the dissociation of anionic Pbcomplexes, thus leading to Pb enrichment on Mn oxide.Third, the chemical (i.e., binding) component of the freeenergy for tridentate Pb(II) sorption to octahedral edgeson both oxides is much larger than the electrostatic compo-nent. In this case a charged adion is sorbed specificallyregardless of the sign of the surface charge (Andersonand Rubin, 1981). Since Pb can be taken up by Mn andFe oxides in the marine environment, the Pb–Fe/Mn corre-lation in Fig. 1b does not mean that Pb is chemically boundto the Fe oxide component, but that its enrichment de-pends on the growth rate of the ferromanganese oxide, asfor Ce and Co.
Independent of the geochemical partitioning of Pb be-tween Mn and Fe oxide, both oxides have strong bindingsites that must be able to retain Pb over long periods oftime because ferromanganese deposits have a slow growthrate (mm/Myr) (e.g., Halbach et al., 1983, 1988; Takema-tsu, 1998). Knowing the molecular mechanism of Pbsequestration in these deposits is essential to understandits marine geochemistry, and in particular its enrichmentby up to a factor of 200 relative to its crustal abundance(8.0 mg/kg; Faure, 1998) and 7 · 108 relative to seawaterconcentration (1.3 · 10�11 M; Schaule and Patterson,1981). This knowledge is also important for environmentalcontamination issues because ferrihydrite and vernadite(the generic term for natural turbostratic phyllomanganate;Manceau et al., 2006) are ubiquitous in soils and continen-tal sediments (Chukhrov and Gorshkov, 1981; Dixon andSkinner, 1992; Davison, 1993; Manceau et al., 2003,2005; Vodyanitskii and Sivtsov, 2004; Hochella et al.,2005a), and because the lead-ferrihydrite/lead-vernaditeco-association (D21-m3, D1-X1) and the lead-vernaditepartitioning (AD14) described here are common (McKen-zie, 1989; Hudson-Edwards, 2000; Latrille et al., 2001;Liu et al., 2002; Cornu et al., 2005; Hochella et al.,2005b). Therefore, this work provides context for furtherstudies on the sequestration mechanism of Pb at Earth’ssurface.
4.7. Redox reactions of Ce, Co, and Pb sorbed on
ferromanganese oxides
Although Co and Ce have similar geochemical behaviorin the marine environment (Addy, 1979; Ohta et al., 1999),some differences exist that are related to their redox prop-
erties. Ce and Co are both readily oxidized by manganates,but while Ce may be oxidized also by Fe oxyhydroxides(e.g., Bau, 1999; Kawabe et al., 1999), Co is not (e.g.,Coughlin and Stone, 1995; Angove et al., 1999; Jeonet al., 2003; Pozas et al., 2004). The redox potential ofthe Ce(III)/CeO2 couple in seawater is about Eh = 178–237 mV (pe = 3–4; De Baar et al., 1988). The redox poten-tial of the Co2+/CoOOH couple at pH 8,Co2þðaqÞ ¼ 2:0� 10�11 M (the dissolved Co concentration in
seawater; Martin et al., 1989), and E0 = 1.48 V (Moffettand Ho, 1996), is 689 mV. Thus, Ce(III) is easily oxidizedin seawater, even by dissolved oxygen (De Baar et al.,1988), whereas Co(II) is only oxidized by MnO2 (Murrayand Dillard, 1979; Manceau et al., 1997).
Thermodynamic considerations also help understandthe lack of oxidation of Pb(II) to Pb(IV) in marine ferro-manganese oxides. The potential of the Pb2+/PbO2 coupleis 837 mV, based on Brookins (1988, data) and a Pb(aq)
concentration in seawater of 1.3 · 10�11 M (Schaule andPatterson, 1981). This value is greater than the potentialof H2O/O2 at P O2
¼ 1 atm and pH 8 (756 mV), meaningthat Pb(II) cannot be oxidized to Pb(IV) in homogeneouscondition within the stability field of water. CatalyticPb(II) oxidation at the phyllomanganate surface could oc-cur (Murray and Dillard, 1979), but XANES and EXAFSspectroscopic data show that it does not (Matocha et al.,2001; Manceau et al., 2002a; Takahashi et al., 2002b; Vill-alobos et al., 2005). According to thermodynamic calcula-tions, Pb(II) oxidation could be mediated by hausmannite(Mn3O4; Hem, 1978), but this mixed-valence Mn oxidewith a spinel structure has never been identified in marineferromanganese oxides.
Thus, it can be argued that the partitioning of the threeredox-sensitive trace metals depends on their redox poten-tial. Since Co(II) is oxidized exclusively by Mn(III) andMn(IV), and is present as Co(III) in marine ferromanga-nese oxides, then this element can be anticipated to bestrictly associated with Mn oxides, as is shown by ampleexperimental evidence. Ce, which is immobilized also inits oxidized form, probably is associated predominantlywith Mn oxides because Mn(IV) is a strong oxidant atpH 8.3. However, Ce(IV)–Fe oxide associations may alsooccur, as Ce(III) can be oxidized by oxygen and freshlyprecipitated Fe oxides (Bau, 1999). This association isnot widespread because it is inhibited kinetically by theslow rate of Ce(III) to Ce(IV) oxidation by O2 and Fe(III).Of the three trace metals studied here, Pb probably has thelowest affinity for Mn oxides, since it is always divalent.This hypothesis is supported by EXAFS data, which showthat Pb is associated partly with Fe in two of the three sam-ples examined, and re-adsorbed on the Fe component whenthe Mn component is dissolved. The lesser affinity of Ceand Pb for the Mn oxide component compared to Co likelyaccounts for the weak Ce–Mn/Fe and Pb–Mn/Fe correla-tions measured by EPMA (Fig. 4). Consistent with ourhypothesis, the correlation between Co and Mn/Fe isstrong.
Co, Ce, and Pb in marine ferromanganese oxides 1005
Acknowledgments
We thank Dr. T. Kuhn for providing GTV samples andfor his comments on an earlier version of the manuscript.The following colleagues are also thanked for their adviceand technical assistance in the laboratory and at synchro-tron facilities: S. Fakra, M. Fukukawa, J.L. Hazemann,H. Ishisako, N. Kishikawa M. Murakami, M. Nomura,O. Proux, N. Sakakibara, Y. Shibata, Y. Shimamoto,and T. Uruga. The final version of the manuscript benefitedfrom the careful reviews by three anonymous referees. Wethank the Geological Survey of Japan (GSJ), the US Geo-logical Survey (USGS), and the Metal Mining Agency ofJapan for providing samples. This research was supportedby a Grant-in-Aid for scientific research from the Ministryof Education, Science, Sports, and Culture of Japan. Thiswork has been performed with the approval of KEK (Pro-posal No. 2000G267), JASRI (Proposal No. 2000B0276),and the French-CRG program of the CNRS at ESRF.The ALS is supported by the Director, Office of Energy Re-search, Office of Basic Energy Sciences, Materials SciencesDivision of the U.S. Department of Energy, under Con-tract No. DE-AC02-05CH11231.
Associate editor: George R. Helz
Appendix A. Supplementary data
Supplementary data associated with this article can befound, in the online version, at doi:10.1016/j.gca.2006.11.016.
References
Addy, S.K., 1979. Rare earth element patterns in manganese nodules andmicronodules from northwest Atlantic. Geochim. Cosmochim. Acta 43,1105–1115.
Akagi, T., Masuda, A., 1998. A simple thermodynamic interpretation ofCe anomaly. Geochem. J. 32, 301–314.
Ambe, S., Chen, S.Y., Ohkubo, Y., Kobayashi, Y., Maeda, H., Iwamoto,M., Yanokura, M., Takematsu, N., Ambe, F., 1995. ‘‘Multitracer’’ anew tracer technique—its principle, features, and application. J.
Radioanal. Nucl. Chem. 195, 297–303.Anderson, M.A., Rubin, A.J., 1981. Adsorption of Inorganics at Solid–
Liquid Interfaces. Ann Arbor Science Publishers, Inc.Angove, M.J., Wells, J.D., Johnson, B.B., 1999. The influence of
temperature on the adsorption of cadmium(II) and cobalt(II) ongoethite. J. Colloid Interface Sci. 211, 281–290.
Aplin, A.C., Cronan, D.S., 1985a. Ferromanganese oxide deposits fromthe Central Pacific Ocean. I. Encrustrations from the Line IslandsArchipelago. Geochim. Cosmochim. Acta 49, 427–436.
Aplin, A.C., Cronan, D.S., 1985b. Ferromanganese oxide deposits fromthe Central Pacific Ocean. II. Nodules and associated sediments.
Geochim. Cosmochim. Acta 49, 437–451.Balistrieri, L.S., Murray, J.W., 1982. The adsorption of copper, lead, zinc,
and cadmium on goethite from major ion seawater. Geochim.
of Pb(II) at oxide–water interfaces: I. XAFS and bond-valencedetermination of mononuclear and polynuclear Pb(II) sorption
products on aluminum oxides. Geochim. Cosmochim. Acta 61, 2617–2637.
Bargar, J.R., Brown Jr., G.E., Parks, G.A., 1997b. Surface complexationof Pb(II) at oxide–water interfaces: II. XAFS and bond-valencedetermination of mononuclear and polynuclear Pb(II) sorption prod-ucts on iron oxides. Geochim. Cosmochim. Acta 61, 2639–2652.
Bargar, J.R., Brown Jr., G.E., Parks, G.A., 1998. Surface complexation ofPb(II) at oxide–water interfaces: III. XAFS determination of Pb(II)and Pb(II)-chloro adsorption complexes on goethite and alumina.
Goochim. Cosmochim. Acta 62, 193–207.Bau, M., 1999. Scavenging of dissolved yttrium and rare earths by
precipitating iron oxyhydroxide: experimental evidence for Ce oxida-tion, Y–Ho fractionation, and lanthanide tetrad effect. Goochim.
Cosmochim. Acta 63, 67–77.Betekhtin, A.G. 1940. South Urals manganese deposits as a raw material
base for the Magnitogorsk mettallurgic plant. Trudi Inst. Geol. Scien.
from DOMES Site A, Northern Equatorial Pacific: multiple diageneticmetal sources in the deep sea. Geochim. Cosmochim. Acta 48, 1913–1928.
Choi, Y.G., Kim, K.H., Chernov, V.A., Heo, J., 1999. Pb LIII-edgeEXAFS and XANES analyses on the structural environment of lead inPbO–Ga2O3 glasses. J. Non-Cryst. Solids 246, 128–135.
Chukhrov, F.V., Gorshkov, A.I., 1981. Iron and manganese oxideminerals in soils. Trans. R. Soc. Edinb. 72, 195–200.
Cornu, S., Deschatrettes, W., Salvador-Blanes, S., Clozel, B., Hardy, M.,Branchut, S., Le Forestier, L., 2005. Trace element accumulationin Mn–Fe-oxide nodules of a planosolic horizon. Geoderma 125, 11–24.
Coughlin, B.R., Stone, A.T., 1995. Nonreversible adsorption of divalentmetal ions (MnII, CoII, NiII, CdII, and PbII) onto goethite: effects ofacidification, FeII addition, and picolinic acid addition. Environ. Sci.
Technol. 29, 2445–2455.Crozier, E.D., 1997. A review of the current status of XAFS spectroscopy.
Nucl. Instrum. Meth. Phys. Res. B 133, 134–144.Davison, W., 1993. Iron and manganese in lakes. Earth Sci. Rev. 34, 119–
Rare earth elements distributions in anoxic waters of the CariacoTrench. Geochim. Cosmochim. Acta 52, 1203–1219.
De Carlo, E.H., McMurtry, G.M., 1992. Rare-earth element geochemistryof ferromanganese crusts from the Hawaiian Archipelago, CentralPacific. Chem. Geol. 95, 235–250.
Dillard, J.G., Koppelman, M.H., Crowther, D.L., Schenk, C.V., Murray,J.W., Balistrieri, L., 1981. X-ray photoelectron spectroscopic (XPS)studies on the chemical nature of metal ions adsorbed on clays andminerals. In: Tewari, P.H. (Ed.), Adsorption From Aqueous Solutions.Plenum Press, New York, pp. 227–240.
Dillard, J.G., Crowther, D.L., Murray, J.W., 1982. The oxidation states ofcobalt and selected metals in the Pacific ferromanganese nodules.
Drits, V.A., Sakharov, B.A., Salyn, A.L., Manceau, A., 1993. Structuralmodel for ferrihydrite. Clay Miner. 28, 185–208.
Drits, V.A., Lanson, B., Bougerol-Chaillout, C., Gorshkov, A.I., Man-ceau, A., 2002. Structure of heavy metal sorbed birnessite. Part 2.Results from electron diffraction. Am. Mineral. 87, 1646–1661.
Dymond, J., Lyle, B., Finney, B., Piper, D.Z., Murphy, K., Conard, R.,Pisias, N., 1984. Ferromanganese nodules from MANOP Sites H, S, andR—control of mineralogical and chemical composition by multipleaccretionary processes. Geochim. Cosmochim. Acta 48, 931–949.
Faure, G., 1998. Principles and Applications of Geochemistry, second ed.Princeton Hall, New Jersey, pp. 513.
Ford, R.G., Kemner, K.M., Bertsch, P.M., 1999. Influence of sorbate–sorbent interactions on the crystallization kinetics of nickel- and lead-ferrihydrite coprecipitates. Geochim. Cosmochim. Acta 63, 39–48.
Gilmore, E.A., Evans, G.J., Ho, M.D., 2001. Radiochemical assessment ofthe readsorption and redistribution of lead in the SM&T sequentialextraction procedure. Anal. Chim. Acta 439, 139–151.
Glasby, G.P., 2000. Manganese: predominant role of nodules and crusts.In: Schulz, H.D., Zabe, M. (Eds.), Marine Geochemistry. Springer,Berlin, pp. 335–372.
Goldberg, E.D., 1961. Chemistry in the Oceans. In: Sears, M. (Ed.),Oceanography, vol. 67. Am. Assoc. Adv. Sci. Publ., pp. 583–597.
Goldberg, E.D., Koide, M., Schmitt, R., Smith, R., 1963. Rare-earthdistributions in the marine environment. J. Geophys. Res. 68, 4209–4217.
Goldberg, E.D., 1965. Minor elements in sea-water. In: Riley, J.P.,Skirrow, G. (Eds.), Chemical Oceanography, vol. 1. Academic Press,pp. 163–196.
Halbach, P., Segl, M., Puteanus, D., Mangini, A., 1983. Co-fluxes andgrowth rates in ferromanganese deposits from central Pacific seamountareas. Nature 304, 716–719.
Halbach, P., Friendrich, G., von Stackelberg, U., 1988. The Manganese
Nodule Belt of the Pacific Ocean. Enke, Stuttgart.Haley, B.A., Klinkhammer, G.P., McManus, J., 2004. Rare earth elements
in pore waters of marine sediments. Geochim. Cosmochim. Acta 68,1265–1279.
Hazemann, J.L., Nayouf, K., Debergevin, F., 1995. Modelization byfinite-elements of sagittal focusing. Nucl. Instr. Meth. Phys. Res. B97,547–550.
Hem, J.D., 1978. Redox processes at surfaces of manganese oxide andtheir effects on aqueous metal ions. Chem. Geol. 21, 199–218.
Hochella, M.F., Kasama, T., Putnis, A., Putnis, C.V., Moore, J.N., 2005a.Environmentally important, poorly crystalline Fe/Mn hydrous oxides:ferrihydrite and a possibly new vernadite-like mineral from the ClarkFork River Superfund Complex. Am. Mineral. 90, 718–724.
Hochella, M.F., Kasama, T., Putnis, A., Putnis, C.V., Moore, J.N., 2005b.Direct observation of heavy metal-mineral association from the ClarkFork River Superfund Complex: implications for metal transport andbioavailability. Geochim. Cosmochim. Acta 69, 1651–1663.
Hu, Z., Bertram, S., Kaindl, G., 1994. X-ray-absorption study of PrO2 athigh pressure. Phys. Rev. B 49, 39–43.
Hudson-Edwards, K.A., 2000. Heavy metal-bearing Mn oxides in riverchannel and floodplain sediments. In: Cotter-Howells, J.D., Campbell,L.S., Valsami-Jones, E., Batchelder, M. (Eds.), Environmental Miner-
Pressure-induced changes in LIII X-ray-absorption near-edge structureof CeO2 and CeF4: Relevance to 4f-electronic structure. Phys. Rev. B
38, 10174–10177.Kawabe, I., Ohta, A., Miura, N., 1999. Distribution coefficients of REE
between Fe oxyhydroxide precipitates and NaCl solutions affected byREE-carbonate complexation. Geochem. J. 33, 181–197.
Koschinsky, A., Halbach, P., 1995. Sequential leaching of marineferromanganese precipitates: genetic implications. Geochim. Cosmo-
chim. Acta 59, 5113–5132.Koschinsky, A., Hein, J.R., 2003. Uptake of elements from seawater by
ferromanganese crusts: solid-phase associations and seawater specia-tion. Mar. Geol. 198, 331–351.
Koschinsky, A., Stascheit, A., Bau, M., Halbach, P., 1997. Effects ofphosphatization on the geochemical and mineralogical composition ofmarine ferromanganese crusts. Geochim. Cosmochim. Acta 61, 4079–4094.
Kotani, A., Okada, K., Okada, M., 1987. Theory of 3d-XPS and L3-XASin CeF4. Solid State Commun. 64, 1479–1482.
Kuhn, T., Bau, M., Blum, N., Halbach, P., 1998. Origin of negative Ceanomalies in mixed hydrothermal-hydrogenetic Fe–Mn crusts from theCentral Indian Ridge. Earth Planet Sci. Lett. 163, 207–220.
Kuhn, T., Bostick, B.C., Koschinsky, A., Halbach, P., Fendorf, S., 2003.Enrichment of Mo in hydrothermal Mn precipitates: possible Mosources, formation process and phase associations. Chem. Geol. 199,29–43.
Langmuir, D., 1997. Aqueous Environmental Geochemistry. Prentice-Hall,New Jersey, 350 pp.
Lanson, B., Drits, V.A., Gaillot, A.C., Silvester, E., Plancon, A.,Manceau, A., 2002a. Structure of heavy metal sorbed birnessite. PartI. Results from X-ray diffraction. Am. Mineral. 87, 1631–1645.
Lanson, B., Drits, V.A., Feng, Q., Manceau, A., 2002b. Crystal structuredetermination of synthetic Na-rich birnessite: evidence for a triclinicone-layer cell. Am. Mineral. 87, 1662–1671.
Latrille, C., Elsass, F., van Oort, F., Denaix, L., 2001. Physical speciationof trace metals in Fe–Mn concretions from a rendzic lithosol developedon Sinemurian limestones (France). Geoderma 100, 127–146.
Leciejewicz, J., 1961. On the crystal structure of tetragonal (red) PbO.
elements in manganese-iron nodules from a Chinese Alfisol. Soil Sci.
Soc. Am. J. 66, 661–670.Manceau, A., Llorca, S., Calas, G., 1987. Crystal chemistry of cobalt and
nickel in lithiophorite and asbolane from New Caledonia. Geochim.
Cosmochim. Acta 51, 105–113.Manceau, A., Charlet, L., 1992. X-ray absorption spectroscopic study of
the sorption of Cr(III) at the oxide/water interface. I Molecularmechanism of Cr(III) oxidation on Mn oxides. J. Colloid Interface Sci.
148, 443–458.Manceau, A., Gorshkov, A.I., Drits, V.A., 1992a. Structural chemistry of
Mn, Fe, Co, and Ni in manganese hydrous oxides: Part I. Informationfrom XANES spectroscopy. Am. Mineral. 77, 1133–1143.
Manceau, A., Charlet, L., Boisset, M.C., Didier, B., Spadini, L., 1992b.Sorption and speciation of heavy metals on Fe and Mn hydrous oxides.From microscopic to macroscopic. Appl. Clay Sci. 7, 201–223.
Manceau, A., Boisset, M.C., Sarret, G., Hazemann, J.L., Mench, M.,Cambier, P., Prost, R., 1996. Direct determination of lead speciation incontaminated soils by EXAFS spectroscopy. Environ. Sci. Technol. 30,1540–1552.
Manceau, A., Drits, V.A., Silverster, E., Bartoli, C., Lanson, B., 1997.Structural mechanism of Co2+ oxidation by the phyllomanganatebuserite. Am. Mineral. 82, 1150–1175.
Manceau, A., Chateigner, D., Gates, W.P., 1998. Polarized EXAFS,distance-valence least-squares modeling (DVLS) and quantitativetexture analysis approaches to the structural refinement of Garfieldnontronite. Phys. Chem. Miner. 25, 347–365.
Manceau, A., Lanson, B., Drits, V.A., Hazemann, J.L., Gorshkov, A.,Chaillout-Bougerol, C., 1999. Sorption mechanism of Zn, Cu, and Pbon birnessite by X-ray and electron diffraction, and powder andpolarized EXAFS spectroscopy. EUG10, March 28-April 1, Journal of
Conference Abstracts 4, 666.Manceau, A., Lanson, B., Drits, V.A., 2002a. Structure of heavy metal
sorbed birnessite. Part III. Results from powder and polarizedextended X-ray absorption fine structure spectroscopy. Geochim.
Cosmochim. Acta 66, 2639–2663.
Co, Ce, and Pb in marine ferromanganese oxides 1007
Manceau, A., Marcus, M.A., Tamura, N., 2002b. Quantitative speciationof heavy metals in soils and sediments by synchrotron X-raytechniques. Rev. Miner. Geochem. 49, 341–428.
Manceau, A., Tamura, N., Celestre, R.S., MacDowell, A.A., Geoffroy,N., Sposito, G., Padmore, H.A., 2003. Molecular-scale speciation ofZn and Ni in soil ferromanganese nodules from loess soils of theMississippi basin. Environ. Sci. Technol. 37, 75–80.
Manceau, A., Tommaseo, C., Rihs, S., Geoffroy, N., Chateigner, D.,Schlegel, M., Tisserand, D., Marcus, M.A., Tamura, N., Chen, Z.S.,2005. Natural speciation of Mn, Ni and Zn at the micrometer scale in aclayey paddy soil using X-ray fluorescence, absorption, and diffraction.
Geochim. Cosmochim. Acta 69, 4007–4034.Manceau, A., Lanson, M., Geoffroy, N., 2007. Natural speciation of Ni,
Zn, Ba and As in ferromanganese coatings on quartz using X-rayfluorescence, absorption, and diffraction. Geochim. Cosmochim. Acta,
71, 95–128.Mannheim, F.T., Lane-Bostwick, C.M., 1988. Cobalt in ferromanganese
crusts as a monitor of hydrothermal discharge on the Pacific seafloor.Nature 335, 59–62.
Marcus, M.A., Manceau, A., Kersten, M., 2004a. Mn, Fe, Zn and Asspeciation in a fast-growing ferromanganese marine nodule. Geochim.
Cosmochim. Acta 68, 3125–3136.Marcus, M., MacDowell, A.A., Celestre, R., Manceau, A., Miller, T.,
Padmore, H.A., Sublett, R.E., 2004b. Beamline 10.3.2 at ALS: a hardX-ray microprobe for environmental and materials sciences. J.
G.E.Jr., 1999. XAFS determination of the chemical form of lead insmelter-contaminated soils and mine tailings: importance of adsorp-tion processes. Am. Mineral. 84, 420–434.
Morin, G., Juillot, F., Ildefonse, P., Calas, G., Samama, J.C., Chevallier, P.,Brown, G.E. Jr., 2001. Mineralogy of lead in a soil developed on a Pb-mineralized sandstone (Largentiere, France). Am. Mineral. 86, 92–104.
Murray, J.W., 1974. The surface chemistry of hydrous manganese dioxide.
J. Colloid Interface Sci. 46, 357–371.Murray, J.W., Dillard, J.G., 1979. The oxidation of cobalt(II) adsorbed on
manganese dioxide. Geochim. Cosmochim. Acta 43, 781–787.Nishimura, M., 1983. Marien Chemistry. Sangyo Tosho, Tokyo, pp. 82–83
(in Japanese).Nomura, M., Koyama, A., 1996. Design and performance of a new XAFS
beamline at the photon factory; BL-12C. KEK Report 95–15.Nomura, M., 1998. Dead-time correction of a multi-element SSD for
fluorescent XAFS. J. Synchrotron Radiat. 5, 851–853.Ohta, A., Ishii, S., Sakakibara, M., Mizxuno, A., Kawabe, I., 1999.
Systematic correlation of the Ce anomaly with the Co/(Ni + Cu) ratioand Y fractionation from Ho in distinct types of Pacific deep-seanodules. Geochem. J. 33, 399–417.
Piepgras, D.J., Jacobsen, S.B., 1992. The behavior of rare earth elementsin seawater: precise determination of variations in the North Pacificwater column. Geochim. Cosmochim. Acta 56, 1851–1862.
Piper, D.Z., 1974. Rare earth elements in ferromanganese nodules andother marine phases. Geochim. Cosmochim. Acta 38, 1007–1022.
Pozas, R., Rojas, T.C., Ocana, M., Serna, C.J., 2004. The nature ofCo in synthetic Co-substituted goethites. Clay Clay Miner. 52, 760–766.
Proux, O., Nassif, V., Prat, A., Ulrich, O., Lahera, E., Biquard, X.,Menthonnex, J.J., Hazemann, J.L., 2006. Feedback system of a liquid-nitrogen-cooled double-crystal monochromator: design and perfor-mances. J. Synchrotron Rad. 13, 59–68.
Rao, K.J., Wong, J., 1984. A XANES investigation of the bonding ofdivalent lead in solids. J. Chem. Phys. 81, 4832–4843.
Rendell, P.S., Batley, G.E., Cameron, A.J., 1980. Adsorption as a controlof metal concentrations in sediment extracts. Environ. Sci. Tehnol. 14,314–318.
Ressler, J., 1998. WinXAS: a program for x-ray absorption spectroscopydata analysis under MS-Windows. J. Synchrotron Rad. 5, 118–122.
Rouse, R.C., 1971. The crystal structure of quenselite. Zeit. Krist. 134,321–332.
Schaule, B.K., Patterson, C.C., 1981. Lead concentrations in the northeastPacific: evidence for global anthropogenic perturbations. Earth Planet.
controls on Cu and Pb sorption by ferrihydrite. Environ. Sci. Technol.
35, 1090–1096.Schlegel, M.L., Manceau, A., Charlet, L., Chateigner, D., Hazemann,
J.L., 2001. Sorption of metal ions on clay minerals. III. Nucleation andepitaxial growth of Zn phyllosilicate on the edges of hectorite.
Geochim. Cosmochim. Acta 65, 4155–4170.Schwertmann, U., Cornell, R.M., 2000. Iron Oxides in the Laboratory.
Wiley-VCH, Weinheim, pp. 67–112.Sholkovitz, E.R., 1989. Artifacts associated with the chemical leaching of
sediments for rare-earth elements. Chem. Geol. 77, 47–51.Silvester, E., Manceau, A., Drits, V.A., 1997. The structure of synthetic
monoclinic Na-rich birnessite and hexagonal birnessite. Part 2. Resultsfrom chemical studies and EXAFS spectroscopy. Am. Mineral. 82,962–978.
Smedley, P.L., Kinniburgh, D.G., 2002. A review of the source, behaviourand distribution of arsenic in natural waters. Appl. Geochem. 17, 517–568.
Soldatov, A.V., Ivanchenko, T.S., Longa, S.D., Kotani, A., Iwamoto, Y.,Bianconi, A., 1994. Crystal-structure effects in the Ce L3-edge X-rayabsorption spectrum of CeO2: multiple-scattering resonances andmany-body final states. Phys. Rev. B 50, 5074–5080.
Spadini, L., Manceau, A., Schindler, P.W., Charlet, L., 1994. Structureand stability of Cd2+ surface complexes on ferric oxides. I. Resultsfrom EXAFS spectroscopy. J. Colloid Interface Sci. 168, 73–86.
Spadini, L., Schindler, P.W., Charlet, L., Manceau, A., Ragnarsdottir,K.V., 2003. Hydrous ferric oxide: evaluation of Cd–HFO surfacecomplexation models combining CdK EXAFS data, potentiometrictitration results, and surface site structures identified from mineralog-ical knowledge. J. Colloid Interface Sci. 266, 1–18.
Stumm, W., 1993. Chemistry of the Solid–Water Interface. John Wiley &Sons.
Sumaoka, J., Igawa, T., Furuki, K., Komiyama, M., 2000. HomogeneousCe(IV) complexes for efficient hydrolysis of plasmid DNA. Chem. Lett.
29, 56–57.Szytula, A., Burewicz, A., Dimitrijevic, Z., Krasnicki, S., Rzany, H.,
Todorovic, J., Wanic, A., Wolski, W., 1968. Neutron diffractionstudies of a-FeOOH. Phys. Stat. Sol. 26, 429–434.
Takahashi, Y., Minai, Y., Ambe, H., Makide, Y., Ambe, F., Tominaga,T., 1997. Simultaneous determination of stability constants of humatecomplexes with various metal ions using multitracer technique. Sci.
1999. Comparison of adsorption behavior of multiple inorganic
1008 Y. Takahashi et al. 71 (2007) 984–1008
ions on kaolinite and silica in the presence of humic acidusing the multitracer technique. Geochim. Cosmochim. Acta 63,815–836.
Takahashi, Y., Shimizu, H., Usui, A., Kagi, H., Nomura, M., 2000. Directobservation of tetravalent cerium in ferromanganese nodules andcrusts by X-ray absorption near-edge structure (XANES). Geochim.
Cosmochim. Acta 64, 2929–2935.Takahashi, Y., Sakami, H., Nomura, M., 2002a. Determination of the
oxidation state of cerium in rocks by Ce LIII-edge X-ray absorptionnear-edge structure. Anal. Chim. Acta 468, 345–354.
Takahashi, Y., Usui, A., Okumura, K., Uruga, T., Nomura, M.,Murakami, M., Shimizu, H., 2002b. Application of XANES for thedetermination of oxidation states of Co and Pb in natural ferroman-ganese nodules. Chem. Lett. 31, 366–367.
Takematsu, N., Sato, Y., Okabe, S., 1989. Factors controlling thechemical composition of marine manganese nodules and crusts: areview and synthesis. Mar. Chem. 26, 41–56.
Takematsu, N., 1998. Manganese nodule. Koseisha Kouseikaku, Tokyo (inJapanese).
Teo, B.K., 1986. EXAFS: Basic Principles and Data Analysis. Springer-Verlag.
Terashima, S., Usui, A., Imai, N., 1995. 2 new GSJ geochemical referencesamples—syenite JSy-1 and manganese-nodule JMn-1. Geostandards
Newslett. 19, 221–229.Toner, B., Manceau, A., Webb, S.M., Sposito, G., 2006. Zinc sorption to
biogenic hexagonal-birnessite particles within a hydrated bacterialbiofilm. Geochim. Cosmochim. Acta 70, 27–43.
Trivedi, P., Dyer, J.A., Sparks, D.L., 2003. Lead sorption onto ferrihy-drite. 1. A macroscopic and spectroscopic assessment. Environ. Sci.
M., Harada, M., Nishihata, Y., Kubozono, Y., Tanaka, T., Yamam-oto, T., Maeda, H., Kamishima, O., Takabayashi, Y., Nakata, Y.,Kimura, H., Goto, S., Ishikawa, T., 1999. The XAFS beamlineBL01B1 at SPring-8. J. Synchrotron Rad. 6, 143–145.
Usui, A., Bau, M., Yamazaki, T., 1997. Manganese microchimneys buriedin the Central Pacific pelagic sediments: evidence of intraplate watercirculation? Mar. Geol. 141, 269–285.
Villalobos, M., Toner, B., Bargar, J., Sposito, G., 2003. Characterizationof the manganese oxide produced by Pseudomonas putida strain MnB1.
Geochim. Cosmochim. Acta 67, 2649–2662.Villalobos, M., Bargar, J., Sposito, G., 2005. Mechanisms of Pb(II) sorption
on a biogenic manganese oxide. Environ. Sci. Technol. 39, 569–576.Villalobos, M., Lanson, B., Manceau, A., Toner, B., Sposito, G., 2006.
Structural model for the biogenic Mn oxide produced by Pseudomonas
ferroxyhyte, and vernadite in soil. Eurasian Soil Sci. 37, 863–875.Wehrli, B., 1990. Redox reactions of metal ions at mineral surfaces. In:
Stumm, W. (Ed.), Aquatic Chemical Kinetics. Wiley, New York, pp.311–336.
Wen, X., De Carlo, E.H., Li, Y.H., 1997. Interelement relationships inferromanganese crusts from the central Pacific ocean: their implica-tions for crust genesis. Mar. Geol. 136, 277–297.