NASA/CR. _ 207466 JOURNAL OF GEOPHYSICAL RESEARCH, VOL. 101, NO. DI, PAGES 1713-1725, JANUARY 20, 1996 Chemical characteristics of continental outflow from Asia to the troposphere over the western Pacific Ocean during September-October 1991: Results from PEM-West A R. W. Talbot, I J. E. Dibb, _ K. I. Klemm, 1'2 J. D. Bradshaw, 3 S. T. Sandholm, 3 D. R. Blake, 4 G. W. Sachse, 5 J. Collins, 5 B. G. Heikes, 6 G. L. Gregory, 5 B. E. Anderson, 5 H. B. Singh, 7 D. C. Thornton, s and J. T. Merrill 6 Abstract. An important objective of the Pacific Exploratory Mission-West A (PEM-West A) was the chemical characterization of the outflow of tropospheric trace gases and aerosol particles from the Asian continent over the western Pacific Ocean. This paper summarizes the chemistry of this outflow during the period September - October 1991. The vertical distributions of CO, C2H6, and NO× showed regions of outflow at altitudes below 2 km and from 8 to 12 km. Mixing ratios of CO were =130 parts per billion by volume (ppbv), =1000 parts per trillion by volume (pptv) for C2H6, and =100 pptv for NOx in both of these regions. Direct outflow of Asian industrial materials was clearly evident at altitudes below 2 kin, where halocarbon tracer compounds such as CH3CCI 3 and C2C14 were enhanced about threefold compared to aged Pacific air. The source attribution of species outflowing from Asia to the Pacific at 8 -12 km altitude was not straightforward. Above l0 km altitude there were substantial enhancements of NOy, 03, CO, CH 4 SO2, C2H6, C3H 8, C2H 2, and aerosol 21°pb but not halocarbon industrial tracers. These air masses were rich in nitrogen relative to sulfur and contained ratios of C2H2/CO and C3Hs/C2H6 (=1.5 and 0.1 respectively) indicative of several- day-old combustion emissions. It is unclear if these emissions were of Asian origin, or if they were rapidly transported to this region from Europe by the high wind speeds in this tropospheric region (60 - 70 m s_). The significant cyclonic activity over Asia at this time could have transported to the upper troposphere emissions from biomass burning in Southeast Asia or emissions from the extensive use of various biomass materials for cooking and space heating. Apparently, the emissions in the upper troposphere were brought there by wet convective systems since water-soluble gases and aerosols were depleted in these air masses. Near 9 km altitude there was a distinct regional outflow that appeared to be heavily influenced by biogenic processes on the Asian continent, especially from the southeastern area. These air masses contained CH4 in excess of 1800 ppbv, while CO 2 and OCS were significantly depleted (349 - 352 ppmv and 450 - 500 pptv, respectively). This signature seemingly reflected CH 4 emissions from wetlands and rice paddies with coincident biospheric uptake of tropospheric CO 2 and OCS. 1. Introduction The mineralogy of sediments collected from the North Pacific Ocean between 30° and 40"N latitude is identical to that of aeolian mineral particles originating on the Asian continent [Blank et al., 1985]. The transport and deposition of Asian dust materials can, qnstitute for the Study of Earth, Oceans, and Space, University of New Hampshire, Durham. 2Now at Fraunhofer Institut ft_r Atmospharische Umweltforschung, Garmisch-Partenkirchen, Germany. _School of Earth and Atmospheric Sciences, Georgia Institute of Technology, Atlanta. 4Department of Chemistry, University of Califomia-lrvine, Irvine. 5NASA Langley Research Center, Hampton, Virginia. 6Center for Atmospheric Chemistry, University of Rhode Island, Narragansett. 7NASA Ames Research Center, Moffett Field, California. 8Department of Chemistry, Drexel University, Philadelphia, Pennsylvania. Copyright 1996 by the American Geophysical Union. Paper number95JD01044. 0148-0227/96/95JD-01044505.00 in fact, account for a substantial fraction of the nonbiogenic portion of Pacific sediments in this region. Atmospheric studies in the marine boundary layer at numerous island stations in the Pacific confirm the impact of long-range transport of aeolian materials from the Asian continent, that is particularly strong in the February through May time period [Duce et al., 1980]. This seasonal impact is most evident at higher latitudes, presumably resulting from the westerly wind regime there in the large-scale meteorological features [Merrill et al., 1985]. It is well documented that atmospheric nitrate (HNO 3 vapor + aerosol NO3) mixing ratios in the boundary layer are consistently larger and more variable over the North Pacific compared to its equatorial and southern counterparts [Savoie et at., 1989; Prospero and Savoie, 1989]. Furthermore, the significant correlation of 21°Pb and nitrate over the North Pacific suggests a continental source for both species [Balkanski et al., 1993]. Indeed, the transport of 21°pb over the Pacific Ocean appears to be closely tied to aeolian transport of mineral aerosols derived from the extensive arid regions of Asia [Turekian and Cochran, 1981; Uematsu et al., 1983; Prospero et al., 1985]. These atmospheric components show a pronounced annual seasonal cycle in their abundance in boundary layer air over the North Pacific that 1713 https://ntrs.nasa.gov/search.jsp?R=19980025482 2018-07-15T00:29:37+00:00Z
Transcript
NASA/CR._ 207466
JOURNAL OF GEOPHYSICAL RESEARCH, VOL. 101, NO. DI, PAGES 1713-1725, JANUARY 20, 1996
Chemical characteristics of continental outflow from Asia
to the troposphere over the western Pacific Ocean during
September-October 1991: Results from PEM-West A
R. W. Talbot, I J. E. Dibb, _ K. I. Klemm, 1'2 J. D. Bradshaw, 3 S. T. Sandholm, 3 D. R.
Blake, 4 G. W. Sachse, 5 J. Collins, 5 B. G. Heikes, 6 G. L. Gregory, 5 B. E. Anderson, 5
H. B. Singh, 7 D. C. Thornton, s and J. T. Merrill 6
Abstract. An important objective of the Pacific Exploratory Mission-West A (PEM-West A)was the chemical characterization of the outflow of tropospheric trace gases and aerosol
particles from the Asian continent over the western Pacific Ocean. This paper summarizes thechemistry of this outflow during the period September - October 1991. The verticaldistributions of CO, C2H6, and NO× showed regions of outflow at altitudes below 2 km andfrom 8 to 12 km. Mixing ratios of CO were =130 parts per billion by volume (ppbv), =1000parts per trillion by volume (pptv) for C2H6, and =100 pptv for NOx in both of these regions.Direct outflow of Asian industrial materials was clearly evident at altitudes below 2 kin, wherehalocarbon tracer compounds such as CH3CCI 3 and C2C14 were enhanced about threefoldcompared to aged Pacific air. The source attribution of species outflowing from Asia to thePacific at 8 -12 km altitude was not straightforward. Above l0 km altitude there weresubstantial enhancements of NOy, 03, CO, CH 4 SO2, C2H6, C3H 8, C2H 2, and aerosol 21°pb butnot halocarbon industrial tracers. These air masses were rich in nitrogen relative to sulfur and
contained ratios of C2H2/CO and C3Hs/C2H6 (=1.5 and 0.1 respectively) indicative of several-day-old combustion emissions. It is unclear if these emissions were of Asian origin, or if theywere rapidly transported to this region from Europe by the high wind speeds in thistropospheric region (60 - 70 m s_). The significant cyclonic activity over Asia at this timecould have transported to the upper troposphere emissions from biomass burning in SoutheastAsia or emissions from the extensive use of various biomass materials for cooking and space
heating. Apparently, the emissions in the upper troposphere were brought there by wetconvective systems since water-soluble gases and aerosols were depleted in these air masses.Near 9 km altitude there was a distinct regional outflow that appeared to be heavily influencedby biogenic processes on the Asian continent, especially from the southeastern area. These airmasses contained CH4 in excess of 1800 ppbv, while CO 2 and OCS were significantly depleted
(349 - 352 ppmv and 450 - 500 pptv, respectively). This signature seemingly reflected CH 4emissions from wetlands and rice paddies with coincident biospheric uptake of tropospheric
CO 2 and OCS.
1. Introduction
The mineralogy of sediments collected from the North PacificOcean between 30° and 40"N latitude is identical to that of aeolian
mineral particles originating on the Asian continent [Blank et al.,1985]. The transport and deposition of Asian dust materials can,
qnstitute for the Study of Earth, Oceans, and Space, University of NewHampshire, Durham.
2Now at Fraunhofer Institut ft_r Atmospharische Umweltforschung,Garmisch-Partenkirchen, Germany.
_School of Earth and Atmospheric Sciences, Georgia Institute ofTechnology, Atlanta.
4Department of Chemistry, University of Califomia-lrvine, Irvine.5NASA Langley Research Center, Hampton, Virginia.6Center for Atmospheric Chemistry, University of Rhode Island,
Narragansett.7NASA Ames Research Center, Moffett Field, California.8Department of Chemistry, Drexel University, Philadelphia,
Pennsylvania.
Copyright 1996by the American Geophysical Union.
Paper number95JD01044.0148-0227/96/95JD-01044505.00
in fact, account for a substantial fraction of the nonbiogenic
portion of Pacific sediments in this region. Atmospheric studies
in the marine boundary layer at numerous island stations in the
Pacific confirm the impact of long-range transport of aeolian
materials from the Asian continent, that is particularly strong in
the February through May time period [Duce et al., 1980]. This
seasonal impact is most evident at higher latitudes, presumably
resulting from the westerly wind regime there in the large-scale
meteorological features [Merrill et al., 1985].
It is well documented that atmospheric nitrate (HNO 3 vapor +
aerosol NO3) mixing ratios in the boundary layer are consistently
larger and more variable over the North Pacific compared to its
equatorial and southern counterparts [Savoie et at., 1989;
Prospero and Savoie, 1989]. Furthermore, the significant
correlation of 21°Pb and nitrate over the North Pacific suggests a
continental source for both species [Balkanski et al., 1993].
Indeed, the transport of 21°pb over the Pacific Ocean appears to be
closely tied to aeolian transport of mineral aerosols derived from
the extensive arid regions of Asia [Turekian and Cochran, 1981;
Uematsu et al., 1983; Prospero et al., 1985]. These atmospheric
components show a pronounced annual seasonal cycle in their
abundance in boundary layer air over the North Pacific that
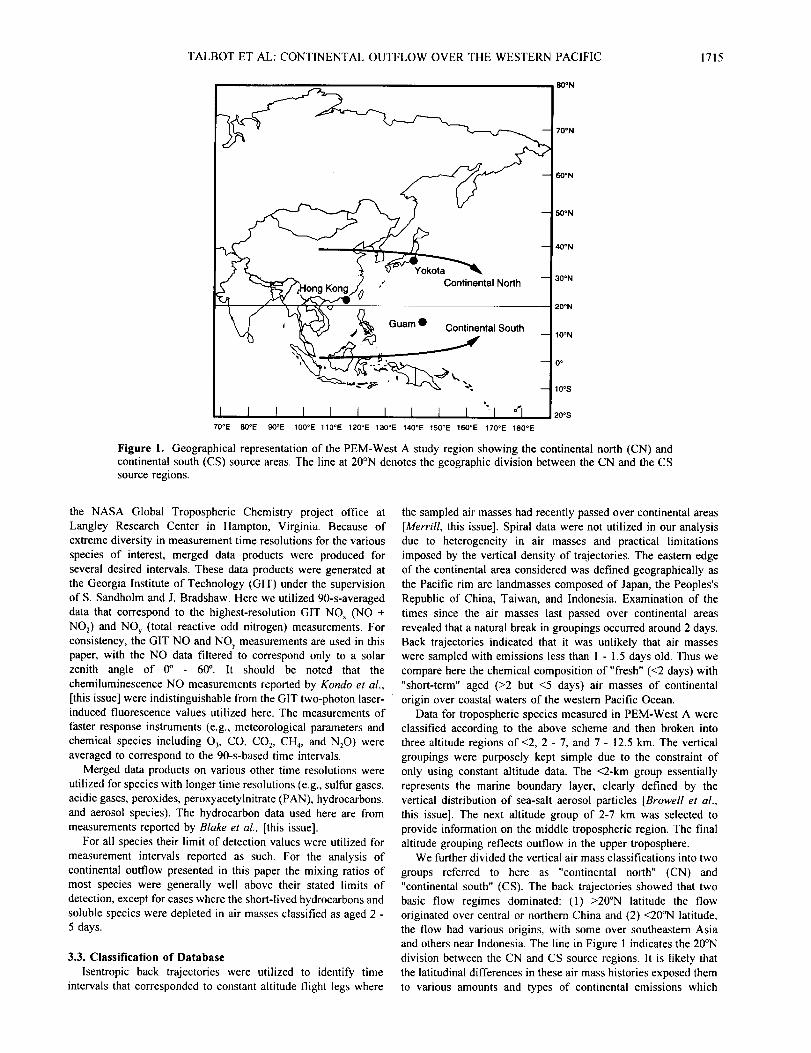
Mixing ratios are stated in parts per trillion by volume; except for CO, CH4, NzO and O3 that are in pa.qs per billion by volume; CO 2 in parts per million by volume, andradioisotopes in femto curies per standard cubic meter. Ratio of C2H2/CO is stated in pptv/ppbv. _/A means not available.
we sampled them. It appears that much of the outflowing air had
already undergone significant atmospheric processing before we
intercepted it over the coastal western Pacific Ocean.
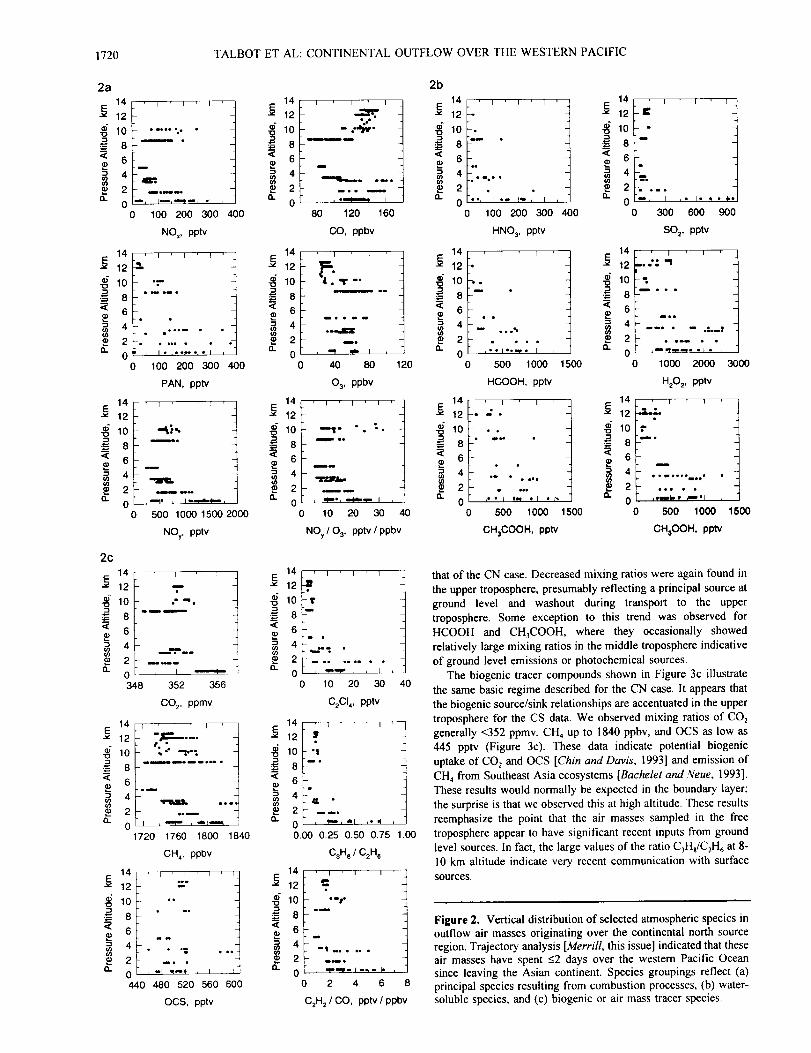
4.3. Vertical Distribution
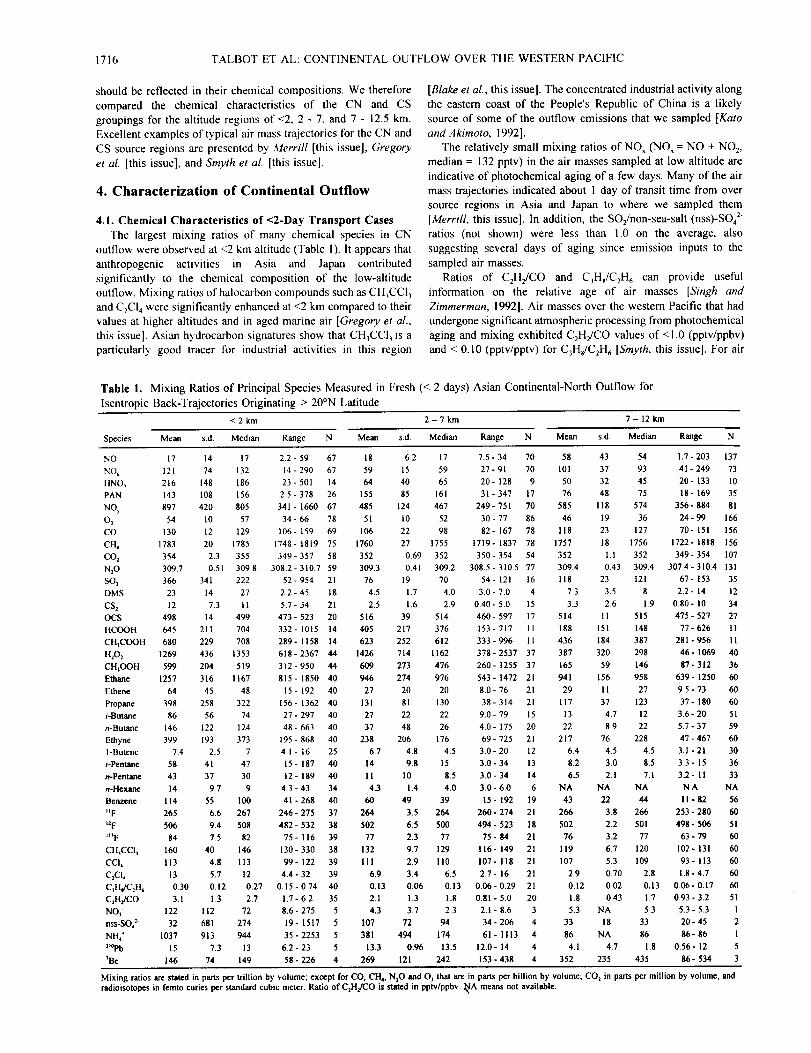
Plots of species vertical distribution shown in this section are
organized into three categories: (1) principal species emitted from
combustion processes, (2) water-soluble species, and (3) biogenic
or air mass tracer species. The vertical distribution of selected
species in CN air masses with transport times of <2 days is shown
in Figures 2a,2b, and 2c. These plots illustrate some interesting
characteristics of the continental outflow. The CO data. for
example, indicate a probable combustion influence on the
chemistry below 4 km and above 10 km altitudes (Figure 2a). The
median CO mixing ratio in the upper troposphere and in the
boundary layer were essentially equal at t30 pans per billion by
volume (ppbv) (Table 1). There also appeared to be an altitude
region between 4 and 8 km containing cleaner air masses with
mixing ratios of CO _, 100 ppbv.
These values of CO are very similar to the ones determined in81
November 1981 by a gas filter radiometer operating in the53
5 experiment "Measurement of Air Pollution from Satellites"
26 (MAPS) flown on the NASA space shuttle [Newell et al., 1988].
43 Over China the MAPS instrument recorded CO mixing ratios as
99 large as I 15 ppbv with an average of 102 ppbv. Since the MAPS
84 instrument responds to CO in the middle to upper troposphere, it
84 was concluded by Newell et al. [1988] that this CO was derivedfrom surface sources and brought to higher altitudes by active63convection or large-scale rising motions. Vertical transport of CO70
18 from the boundary layer to 9 km altitude by convective systems
16 has also been reported over North America [Kleinman and Daum,
19 1991]. The PEM-West A experiment was conducted in the fall
14 time period, when the meteorological regime over China wasdominated by cyclonic activity [Bachmeier et al., this issue[. Thus5it is likely that vertical transport was quite active over Asian5continental source regions.16
11 In the CN air masses the NO_ vertical distribution was very
46 similar to that of CO, but in this case the enhanced mixing ratios
46 above 10 krn could either be due to combustion emissions or
46 other source inputs such as from the stratosphere [Liu et al., this
43 issue[. Interestingly, there was no significant enhancement of NOy
44 above 10 km and, in fact, PAN exhibited its smallest mixing ratio
46 values there (<50 parts per trillion by volume (pptv)). The 03 and
20 aerosol distributions also showed low concentrations in this
41 altitude region [Browell et al., this issue[. These decreased vertical
42 trends in PAN and 03 suggest a limited photochemical influence
10 on the chemistry at high altitude.
44 The middle tropospheric data appear to show chemical
46 characteristics that indicate a ground level source over Asia. Near
4 9 km altitude, there appears to be significant outflow of 2_°Pb,
46 PAN, and 03 that are likely to be of Asian continental origin
46 [Dibb et al., this issue[. The relatively small mixing ratios of
46 water-soluble species (i.e., HCOOH, CH3COOH, HNO 3, H202,
46 CH3OOH, and SO2) at 9 km altitude suggests that the outflowing
46 materials were transported to this height by wet convective
37 activity over Asia (Figure 2b). The strong correlation with 2_°pb
4 but not 7Be indicates that the elevated mixing ratios of O3 at 9 km
4 altitude may have originated from a photochemical rather than a
3 stratospheric source [Dibbet al., this issue]. However, significant
4 photochemical production of other species such as the carboxylic
4 acids in the upper troposphere would seem unlikely, based on the
O 3 and PAN vertical distributions. The ratio HCOOH/CH3COOH
exhibited decreased values with increased altitude (Table 1),
indicative of a combustion influence in the upper troposphere
[Talbot et al., 1988].
Outflow below 5 km altitude contained clear signals of
industrial contamination, as evidenced by enhanced mixing ratios
of the tracer species C2C14 (Figure 2c). In the middle to upper
troposphere, mixing ratios of C2CI 4 were near values typical of
aged marine air [Gregory et al., this issue]. This observation
suggests that the air masses sampled in the boundary layer and at
high altitude might have different source regions.
Examination of the vertical distribution of biogenic tracer
species can facilitate the interpretation of air mass sources. In
Figure 2c we show plots of CO 2, CH4, and OCS. Although these
species are ambiguous biogenic tracers, their vertical distributions
indicate some possible scenarios. Carbon dioxide mixing ratios
TALBOT ET AL: CONTINENTAL OUTFLOW OVER THE WESTERN PACIFIC
Table 4. Mixing Ratios of Principal Species Measured in Aged (2-5 days) Asian Continental-South
Outflow for Isentropic Back-Trajectories Originating < 20°N Latitude
1719
2-7km 7-12km
Species Mean s.d. Median Range N Mean s.d. Median Range N
were centered around 352 parts per million by volume (ppmv),
with a likely anthropogenic enhancement in the boundary layer.
From 2 to 9 km altitude, decreased values of CO 2 probably reflect
its uptake by the biosphere and suggest that these air masses had
recent inputs of near-surface air. The relatively large values of
C2H2/CO and C3Hs/C2H6 at all altitudes lend further support to the
idea that these air masses had recently acquired inputs from
surface sources.
One could argue that the values of OCS below about 520 pptv
are indicative of biogenic or soil uptake of this species [Chin and
Davis, 1993]. The situation is a bit more complicated for CH4,
where various ecosystems can either be a source or a sink of it.
In addition, CH 4 has clear anthropogenic signals from various
combustion and waste treatment processes [Harriss et al., 1994].
Undoubtedly, a combination of source/sink relationships have
produced the complex CH 4 distribution shown in Figure 2c
[Matsueda et al., 1993].
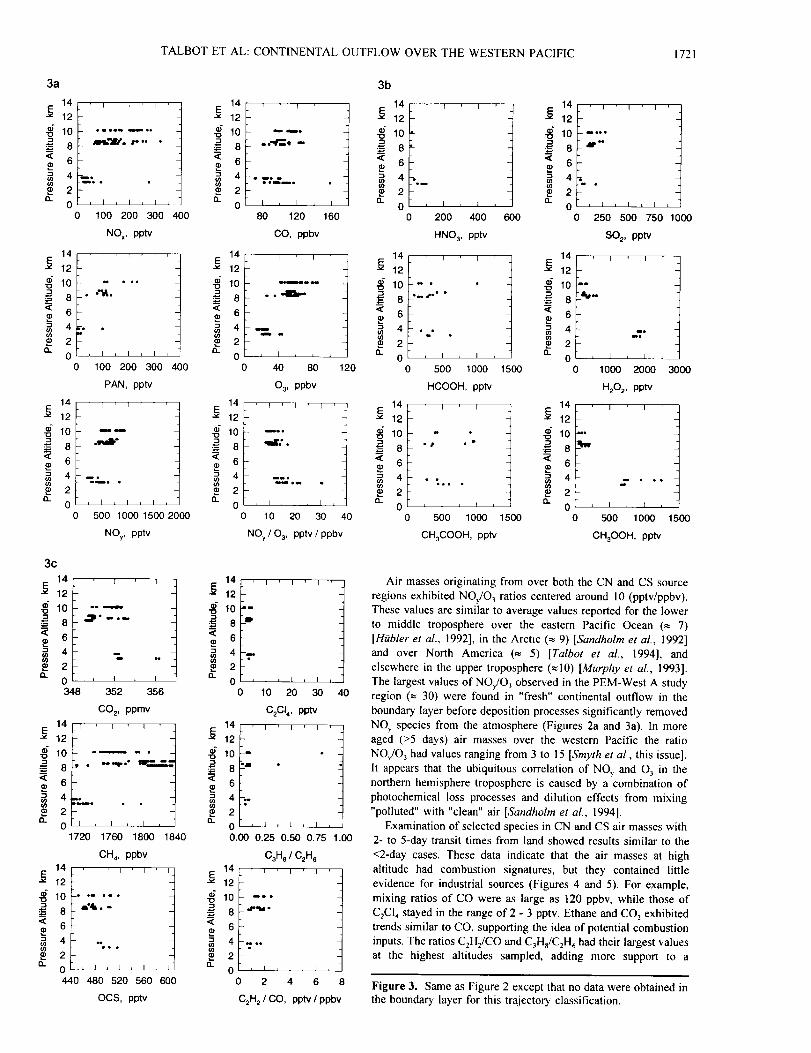
For comparison to the CN data, the vertical distribution of the
same ensemble of species in CS air masses with transit times of
<2 days is depicted in Figures 3a, 3b, and 3c. Here we find a
picture not significantly different from the CN case. Mixing ratios
of CO were moderately elevated in the upper troposphere (100 -
120 ppbv) but not so much as in the CN air masses (120 - 160
ppbv). Very similar mixing ratios of NO x, PAN, NO:, and 03
were observed in the middle and upper troposphere in both airmass classifications.
Although the data for the CS case were sparse, the vertical
distribution of water-soluble species (Figure 3b) was similar to
1720 TALBOT ET AL: CONTINENTAL OUTFLOW OVER THE WESTERN PACIFIC
2a14
_ 12
__ 8< 6
_ 4
_ 2n
oo
1412
-_ 8
_ 2
0
14•-_ 12
__ 8< 6
_ 2Q.
o0
2c
14E-_ 12
__ 8< 6
_ 2
0348
14E-_ 12
__ 8< 6
B 4
_ 2
0
14E-_ 12
__ 8< 6
G.
i + i r
• oeee "+e
i
m
100 200 300 400
NOx, pptv
' 1 l F
Iooo_ •
• w|+ •
I t +e+l_o_o I n
100 200 300 400
PAN, pptv
__.:,..
m
m w_
500 1000 1500 2000
NO T pptv
I I
=o roll l
m I ,inll_l
um. ml
m_u
+ I m
352 356
CO2, ppmv
_- ' I [
ooe
1720 1760 1800 1840
CH4, ppbv
' I ' i ' i
m
II
mw
• ° °_ e =4
m• •
4
2
440 480 520 560 600
OCS, pptv
1412
_ to__ 8< 6
4_ 2
0
1412
8 lO
_ a
4_ 2
00
1412
•_ 8< 6
1412
103
8< 6
Q-
E
n
<
I I ' I
_lllllllllll = =m•
80 120 160
CO, ppbv
I I
mille . _ m
•+etm_
, _ "P" I ,
40 80 120
03, ppbv
m11- ". ;•
2
0 _ "_'=', "H'b'P I
0 10 20 30 40
NOy / 03, pptv / ppbv
' I I I
:T
1412
10
8
6
14
12
10
8
6
4
2 -... ..... •
0 , "i=..._ t _ t ,
0 10 20 30 40
C_CI4, pptv
[ I I '
•ti•
4 ¢¢2 Dme
0 _ _,i, 61 ,o ,_
0.00 0.25 0.50 0.75 .00
C3H 8 / C2H 6
' I I I
2 ._•
0 _ "P'PoI- o I,,
0 2 4 6 8
C_H2/ CO, pptv/ ppbv
2b14
-_ 12
_ _o__ 8
_ 4
el0
14
-_ 12
_ lO
< 13
ID
14E-_ 12
_ _o3
._ 8< 6
_ 4_ 2
n0
0
I I I
°+ I •P I" i I +
100 200 300 400
HNO3, pptv
4 ,i ...,.2 - • . .
0 , ° ° I •."P • I
0 500 1000
HCOOH, pptv
I I
.:.
el,
k
1500
14
10
_. 8
n
14E
-_ 12
_ _o__ 8< 6
4_-_2 % •.+
0 300 600 900
SO_, pptv
_ I I
•..-=i
-,_"_ • • o
4--'° ° -- .'-_I
2 • eom •
0 "f "+ "+ '
0 1000 2000
H202, ppW
I I
_e
14E-_ 12
8 lO
< 6
2
00
D
._ • • • • • e•_•o.emlo • •
.... :-:... :,• " I o_ • I • _ I el +
500 1000 1500 500 1000
CH_COOH, pptv CH_OOH, ppt_
3000
1500
that of the CN case. Decreased mixing ratios were again found in
the upper troposphere, presumably reflecting a principal source at
ground level and washout during transport to the upper
troposphere. Some exception to this trend was observed for
HCOOH and CH3COOH, where they occasionally showed
relatively large mixing ratios in the middle troposphere indicative
of ground level emissions or photochemical sources.
The biogenic tracer compounds shown in Figure 3c illustrate
the same basic regime described for the CN case. It appears that
the biogenic source/sink relationships are accentuated in the upper
troposphere for the CS data. We observed mixing ratios of CO_
generally <352 ppmv, CH 4 up to 1840 ppbv, and OCS as low as
445 pptv (Figure 3c). These data indicate potential biogenic
uptake of CO_ and OCS [Chin and Davis, 1993] and emission of
CH4 from Southeast Asia ecosystems [Bachelet and +Veue, 1993].
These results would normally be expected in the boundary layer;
the surprise is that we observed this at high altitude. These results
reemphasize the point that the air masses sampled in the free
troposphere appear to have significant recent inputs from ground
level sources. In fact, the large values of the ratio C31t,/C_H 6 at 8-
10 km altitude indicate very recent communication with surface
sources.
Figure 2. Vertical distribution of selected atmospheric species in
outflow air masses originating over the continental north source
region. Trajectory analysis [Merrill, this issue] indicated that these
air masses have spent _<2 days over the western Pacific Ocean
since leaving the Asian continent. Species groupings reflect (a)
principal species resulting from combustion processes, (b) water-
soluble species, and (c) biogenic or air mass tracer species.
TALBOT ET AL: CONTINENTAL OUTFLOW OVER THE WESTERN PACIFIC 1721
3a
14E
12
_ lO__ a< 6
2 2
00
14E
-_ 12
lO
< 6
_ 2Q.
00
14E-_ 12
lO_. 8< 6
_ 2
00
3c14
-_ 12
_ lO__ 8< 6
_ 4• 2n
0:?48
14E-_ 12
lO-_-- 8< 6
• 2
0
14E•-_ 12
_ lO._=- 8< 6
4_ 2
0
I I r
eoeo_ _Jo
_Sb"dlV° t" ""
=1
. I J I t I
100 200 300 400
NO x, pptv
u • =.
• *We
, I J I i I J
100 200 300 400
PAN, pptv
I F r
in
olql_ D°
_oQm • •
i I L I , I L
500 1000 1500 2000
NOy, pptv
14
12
_ lO
_ 2
0
14E-_ 12
_ lO__ 8
• 2Q.
00
14E
-_ 12
_ lO
__ 8
Q-
I f I
i it I
80 120 160
CO, ppbv
im
40 80 120
03, ppbv
I I I '
1
_L'.
nm •
2
0 I _ I _ I
0 10 20 30 40
NOy / 03, pptv / ppbv
3b
14
-_ 12
8 lO"-t
_. 8
14E
1210
N 8
4om
2 -
0 , I , I
0 200 400
HNO3, pptv
' I I
4 • •Q
2
0 _ I J I ,
0 500 1000
HCOOH, pptv
14E-_ 12
_ lO__ 8
20
0
I I
• # • o
14
12
8 lO_. 8< 6
= 4
_ 2
0600
1500
14E
12
_ lON 8
Q.
14E
10
__ 8
n
i
d_ ee
L
4
2
0 ,0
I I
4
2
00
, 1 , I i I i
250 500 750 1000
SO_, pptv
' ' t
'11000 2000 3000
H202, pptv
I I
• _.. . ." • ..
500 1000 1500 500 1000 1500
CH3COOH , pptv CH3OOH, pptv
1 I
o• e_mm_
en_J • e_ • me
, ! , I
352 356
CO 2, ppmv
I I
I , I , I .
1720 1760 1800 1840
CH4, ppbv
440 480 520 560 600
OCS, pptv
14 ,
10
#_ 8
42
a_ 00
14E
i 1210
8
< 6I1)
_ 4
14E-'_ 12
toN 8
I I I
I , I i I i
10 20 30
C2Cl4, pptv
' I I I
2
0 , t , I . [
0.00 025 0.50 075 1.00
C3H e / C2H 6
I I ' I
_Pq.I •
2-
0 _ I , I , I ,
0 2 4 6
C_H2 / CO, pptv / ppbv
40
Air masses originating from over both the CN and CS source
regions exhibited NO:/O3 ratios centered around 10 (pptv/ppbv).
These values are similar to average values reported for the lower
to middle troposphere over the eastern Pacific Ocean (>, 7)
IHiibler et al., 1992], in the Arctic (= 9) [Sandholm et aL, 1992]
and over North America (_, 5) [Talbot et al., 1994], and
elsewhere in the upper troposphere (=10) [Murphy et aL, 1993].
The largest values of NO/O 3 observed in the PEM-West A study
region (_ 30) were found in "fresh" continental outflow in the
boundary layer before deposition processes significantly removed
NO, species from the atmosphere (Figures 2a and 3a). In more
aged (>5 days) air masses over the western Pacific the ratio
NO,:/O_ had values ranging from 3 to 15 [Smyth et al., this issue].
It appears that the ubiquitous correlation of NO v and O_ in the
northern hemisphere troposphere is caused by a combination of
photochemical loss processes and dilution effects from mixing
"polluted" with "clean" air [Sandholm et al., 1994].
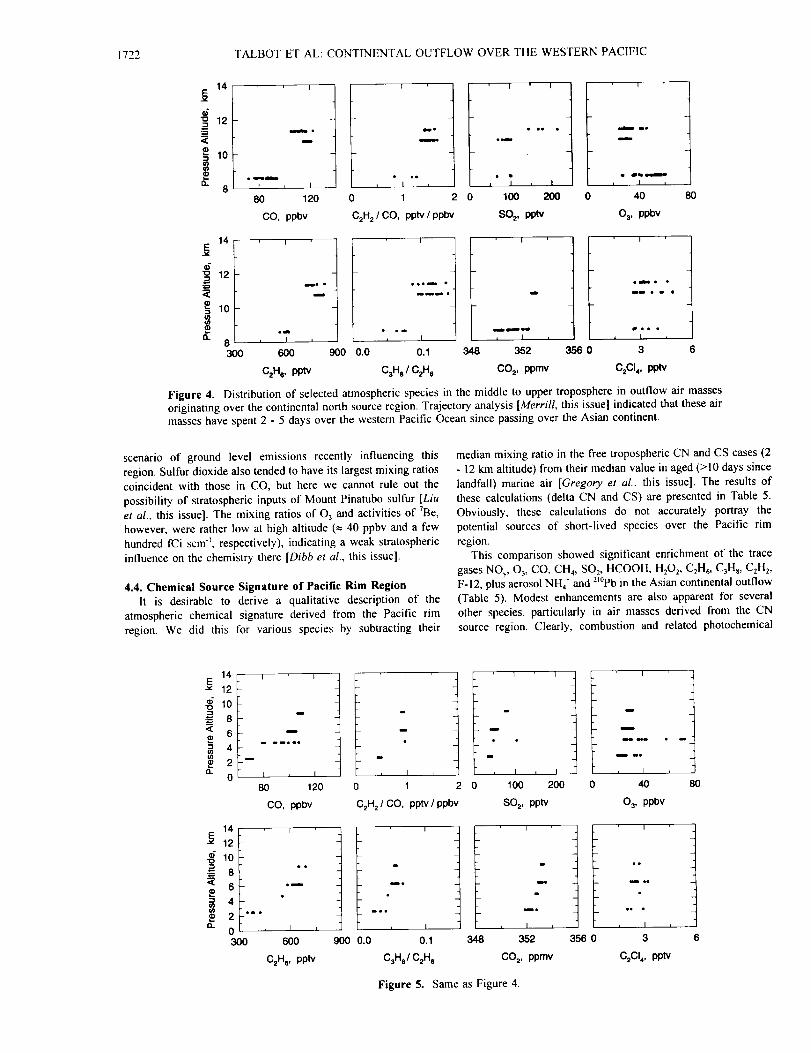
Examination of selected species in CN and CS air masses with
2- to 5-day transit times from land showed results similar to the
<2-day cases. These data indicate that the air masses at high
altitude had combustion signatures, but they contained little
evidence for industrial sources (Figures 4 and 5). For example,
mixing ratios of CO were as large as 120 ppbv, while those of
C_C14 stayed in the range of 2 - 3 pptv. Ethane and CO_ exhibited
trends similar to CO, supporting the idea of potential combustion
inputs. The ratios CzHJCO and C3Hs/C_H 6 had their largest values
at the highest altitudes sampled, adding more support to a
Figure 3. Same as Figure 2 except that no data were obtained in
the boundary layer for this trajectory classification.
1722 TALBOT ET AL: CONTINENTAL OUTFLOW OVER THE WESTERN PACIFIC
14
d
:,=
a)10
8
14
_= 12
10
83o0
I I
_e
I
I I
, ]_I
Ii
n
2 0
C2Hz / CO, ppW / ppbv
• ie • Ili! lie
iii
•?-', , , , , ; , , ,'°T'_,80 120 0 1 100 200 0
CO, ppbv SO2, _ 03, ppbv
8O
I
I
**llh
IIl l "
t I
t oi_l* •Ii ! i !
I I
r
, --'7 ,348 352
CO=, ppmv
F356 0
"7 .... ;" "i i i [ i i
900 0.0 0.1 3
C2He, ppW C3H8/ C2He C=CI4, _W
Figure 4. Distribution of selected atmospheric species in the middle to upper troposphere in outflow air massesoriginating over the continental north source region. Trajectory analysis ]Merrill, this issue] indicated that these air
masses have spent 2 - 5 days over the western Pacific Ocean since passing over the Asian continent.
scenario of ground level emissions recently influencing this
region. Sulfur dioxide also tended to have its largest mixing ratios
coincident with those in CO, but here we cannot rule out the
possibility of stratospheric inputs of Mount Pinatubo sulfur [Liu
et al., this issue]. The mixing ratios of 03 and activities of 7Be,
however, were rather low at high altitude (_ 40 ppbv and a few
hundred fCi scm -_, respectively), indicating a weak stratospheric
influence on the chemistry there [Dibbet al., this issue].
4.4. Chemical Source Signature of Pacific Rim Region
It is desirable to derive a qualitative description of the
atmospheric chemical signature derived from the Pacific rim
region. We did this for various species by subtracting their
median mixing ratio in the free tropospheric CN and CS cases (2- 12 km altitude) from their median value in aged (>10 days since
landfall) marine air [Gregory et al., this issue]. The results of
these calculations (delta CN and CS) are presented in Table 5.
Obviously, these calculations do not accurately portray the
potential sources of short-lived species over the Pacific rim
region.
This comparison showed significant enrichment of the trace
F-12, plus aerosol NH4" and 2_°Pb in the Asian continental outflow
(Table 5). Modest enhancements are also apparent for several
other species, particularly in air masses derived from the CN
source region. Clearly, combustion and related photochemical
14E 12
< 6
= 4
_ 2
I I
I
I
omeoe
I
80 120
CO, ppbv
1412
10el
8
6 = ,._.,,
4
2 ooo
0 = I ,
300 600
C2He, ppW
m
I
i
t
i
F"0 1 2 0
C2H2/ CO, pptv / ppbv
I i I
1o0 200
S02, pptv
i
I.
Ill
, I
900 0.0 0.1
C3Ha/C2H e
I
i
II
L I I
348 352
C02, ppmv
Figure 5. Same as Figure 4.
t1
0
J"4
]
356 0
i
i
I II
z I ,
40
03, ppbv
ee
i .l
ee *
I n
3
C_CI_, ppW
80
TALBOT ET AL: CONTINENTAL OUTFLOW OVER THE WESTERN PACIFIC
Table 5. Comparison of Principal Species in Asian Continental-North (CN)
and Continental-South (CS) Outflow in the Altitude Range of 2-12 km
CN CS
Species Median +95% C.I. Median +95% C.I. aCN nCS
NO 44 5.5 71 11 32* 59*
NO x 80 5.8 121 15 40* 81"
HNO3 56 17 53 32 39* 36*
PAN 102 20 86 22 88* 72*
NOy 539 21 572 33 428* 461 *
03 48 2.0 50 2.4 25* 27*
CO 114 3.0 102 2.4 37* 25*
CH4 1758 2.8 1780 6.5 67* 89*
CO s 352 0.15 351 0.24 -1.0' -2.0*
N20 309.3 0.06 309.5 0.06 0.2 0.4
SO: 105 8.3 183 94 47* 125"
DMS 6.6 1.8 4.7 3.6 1.2 -0.70
CS z 3.1 0.68 2.5 2.1 2.2 1.6
OCS 515 7.7 479 7.6 18" -18'
HCOOH 297 95 325 102 241" 269*
CH3COOH 529 104 632 190 139 242
H_O 2 886 171 663 207 524* 301'
CH_OOH 390 70 305 109 9 -76
Ethane 943 42 714 48 483* 254*
Ethene 28 3.0 23 6.6 16' 1 I*
Propane 120 12 67 9.9 101' 48*
/-Butane 16 3.1 9.8 3.6 _> 16 > 10
n-Butane 26 5.8 14 4.7 >- 26 _> 14
Ethyne 223 27 162 24 260* 123"
1-Butene 6.5 1.4 6.6 3.3 1.8 2.0
i-Pentane 9.7 1.7 8.6 4.2 > 10 >_ 9
n-Pentane 7.9 1.8 5.7 2. I >_8 _>6
n-Hexane 4.3 1.4 5.1 8.6 _>4 > 5
Benzene 48 7.3 30 5.5 40* 20*
_tF 266 0.85 264 1.2 4.0* 2.0*
_2F 502 0.92 561 1.7 6.0* 5.0*
t_F 77 0.69 77 0+63 1+0 1.0
CH3CCI 3 122 2.1 t25 3.6 3.0 4.0
CCI 4 108 1.1 109 1.3 -1.0 0
C2CI 4 3.9 0.56 3. I 0.29 1.7' 0.90*
C3H_/C2H6 0.12 0.008 0.14 0.07 _ 0.08* _ 0.10'
CzH2/CO 1.9 0.18 1.5 0.18 1.5" 1.1'
NO 3 42 68 28 9.5 29* 15
nss-SO42" 82 71 34 23 58* 10
NH4 + 121 83 43 9.0 _ 300 _ 20
21°Pb 8.2 4.5 6.1 2.4 7.7* 5.6*
7Be 304 154 243 207 NA NA
Significant enrichment or depletion of species in outflow relative to aged (south) marine
air illustrates the asian emission signature. C.I., Confidence Interval.
*Indicates species significantly (p = 0.05) enriched or depleted in continental outflow
comparied to aged (south) marine air.
1723
activity are probably sources for many of these species [Kato and
Akimoto, 1992].
Biogenic activities on the Asian continent may exert important
influence on the atmospheric distribution of several trace gases
over the western Pacific Ocean [Matsueda et al., 1993]. For
example, the CO 2 data indicate uptake of it over the continents,
with the strongest sink over the heavily vegetated CS region. This
also appears to be the case for OCS, where it appears to have a
net atmospheric sink over the CS region but be released from the
CN area. Asia is also implicated to be a net source of CH 4, with
the strongest sources over the Southeastern continent. At least part
of the CH 4 enhancement is undoubtedly due to its release from
wetland ecosystems in southeast Asia [Bache/et and Neue, 1993;
Khalil et al., 1990]. However, anthropogenic activities are also
likely sources of CH 4 in Asia [Khalil et aL, 1990].
Recent estimates of Asian atmospheric emissions of SO 2 and
NO x reveal that Chinese sources are rich in sulfur (10 Tg S yr _)
and lower in nitrogen (2.24 Tg N yr -_) content (H. Akimoto et al.,
Atmospheric chemistry of the East-Asian northwest Pacific region,
submitted to Proceedings of the 37th Conference in the OHOLO
1724 TALBOT ET AL: CONTINENTAL OUTFLOW OVER THE WESTERN PACIFIC
Conference series, 1994]. The other Pacific rim countries,
including Japan, together release annually 1.62 Tg S and 1.02 Tg
N to the atmosphere. The resultant nss-SO4/NO 3 emission ratio
should range from 3.01 over China to 0.57 near Japan [Arimoto
et al., this issue]. Values within this range were observed at the
PEM-West A ground level sampling stations and in aerosol
samples collected from the DC-8 at 0.3 km altitude near Taiwan
[Arimoto et al., this issue].
Examination of the NO_. signals from air masses originating
over the CN and CS source regions shows the potential for similar
emission strengths from each. In fact, the PEM-West A aircraft
data indicate a somewhat different picture than that observed at
the ground level stations. The aircraft data set indicates a Pacific
rim region that is regionally rich in atmospheric emissions of
nitrogen relative to sulfur. Ground level studies, however, clearly
show a strong infuence of anthropogenic sulfur emissions relative
to nitrogen in this area [Zhao andXiong, 1988; Galloway, 1989;
Arimoto et al., this issue]. Since we do not know the initial
composition of the air masses feeding eastward into the CN and
CS source regions, it is not possible to determine with our present
data set how much of the NO r (or any other species) originated
from Asia compared to what was already in the "background" air.
Particularly in the middle to upper tropospheric region, it is
possible that other source regions contributed substantially to the
chemistry. The wind speeds are very large in the upper
troposphere (60 - 70 m sl), and this could bring several-day-old
emissions from Europe into our study region [Newell et al., this
issue]. The so-called "Japan jet" is coupled to this rapid upper
tropospheric transport and it is known to carry Asian continental
emissions across the North Pacific to California on a timescale of
3 days or less [Kritz et al., 1990].
The PEM-West A upper tropospheric data are not inconsistent
with a biomass-burning source signature. Species such as CO,
C2H 6, and NO r. should be enhanced in such emissions with little
likelihood of inputs of industrial tracer compounds. Biomass
burning in southeastern Asia and on the various islands chains to
the south may have been active during our study period. We did,
in fact, encounter over the Celebes Sea what appeared to be a
biomass fire plume emerging from the Borneo region [Blake et
al., this issue]. In addition, there is extensive use of biomass
materials for household cooking and space heating in Asia
[Galloway, 1989]. Convective activity could transport these
combustion emissions to high altitude where they would have a
good opportunity to be rapidly swept into our study region
[Newell et al., this issue].
European emissions could also contribute to the chemistry at
high altitude, but they should contain significant amounts of
industrial tracer compounds. The fact that the mixing ratios of
industrial tracers (e.g., C2C14 and CH3CCI3) at high altitude were
near those of aged marine air over the Pacific argues against a
European influence.
The PEM-West A data indicate that Asian sources are
significant contributors of chemical species to the atmosphere over
the western Pacific. The direct outflow at low altitude was clearly
of Asian origin. It is a complicated issue, however, to confidently
identify a unique Asian signature from other potential long-range
sources to the free troposphere over the western Pacific.
5. Conclusions
We have presented the chemical characteristics of Asian
continental outflow over the western Pacific Ocean. Mixing ratios
of most species and the ratios C2HJCO and C3Hs/C2H 6 were very
similar in air masses classified as <2 and 2 - 5 days of transport
from over the Pacific rim landmasses. It appears that much of the
outflowing air had already undergone significant photochemical
processing before being advected over the western Pacific Ocean.
At low altitude the chemistry was clearly dominated by Asian
source emissions under outflow conditions. In the free troposphere
the situation was much more complex, with the possibility of a
mixture of Asian and long-range transport influencing the
distribution of trace gases and aerosol species. In addition,
biogenic metabolism processes on the Asian continent appear to
be important for influencing the distribution of CO 2, CH 4, andOCS over the western Pacific.
Acknowledgments. We appreciate the support provided by the
DC-8 flight and ground crews at the NASA Ames Research
Center. This research was supported by the NASA Global
Tropospheric Chemistry program.
References
Atlas, E., and C. S. Giam, Global transport of organic pollutants:Ambient concentrations in the remote marine atmosphere, Science, 211,163-165, 1981.
Arimoto, R., R. A. Duce, D. L. Savoie, J. M. Prospero, R. Talbot, J. D.Cullen, U. Tomza, N. F. Lewis, and B. J. Ray, Relationships amongaerosol constituents from Asia and the North Pacific during PEM-WestA, _ Geophys. Res., this issue.
Bachelet, D., and H. U. Neue, Methane emissions from wetland rice areasof Asia, Chemosphere, 26, 219-238, 1993.
Bachmeier, A. S., R. E. Newell, M. C. Shipham, Y. Zhu, D. R. Blake, and
E. V. Browell, PEM-West A: Metoeorological overview, J. Geophys.Res., this issue.
Balkanski, Y. J., D. J. Jacob, G. M. Gardner, W. C. Graustein, and K. K.Turekian, Transport and residence time of tropospheric aerosolsinferred from a global three-dimensional simulation of _"Pb, J.Geophys. Res., 98, 20,573-20,586, 1993.
Blake, D. R., T.-Y. Chen, T. W. Smith, Jr., C. J.-L. Wang, O. W.Wingenter, N. J. Blake, F. S. Rowland, and E. W. Mayer, Three-dimensional distributions of nonmethane hydrocarbons (NMHCs) and
halocarbons over the northwestern Pacific during the 1991 PacificExploratory Missions (PEM-West A), J Geophys. Res., this issue.
Blank, M, M. Leinen, and J. M. Prospero, Major Asian aeolian inputsindicated by the mineralogy of aerosols and sediments in the westernNorth Pacific, Nature, 314, 84-86, 1985_
Browell, E. V., et al., Large-scale air mass characteristics observed overthe western Pacific during the summertime, J. Geophys. Res., thisissue.
Buat-Menard, P., V. Ezat, and A. Gaudichet, Size distribution andmineralogy of aluminosilicate dust particles in tropical Pacific air andrain, in Precipitation Scavenging, Dry Deposition and Resuspension,vol. 2, edited by H. R. Prupracher, R. G. Semonin, and W. G. N.Slinn, pp. 1259-1269, Elseiver, New York, 1983.
Chin, M., and D. D. Davis, Global sources and sinks of OCS and CS 2 andtheir distributions, Global Biogeochem. Cycles, 2, 321-338, 1993.
Dibb, J. E., R. W. Talbot, K. I. Klemm, G. L. Gregory, H B. Singh, J. D.Bradshaw, and S. T. Sandholm, Asian influence over the western NorthPacific during the fall season: Inferences from lead 210, soluble ionicspecies, and ozone, J. Geophys. Res., this issue.
Duce, R. A., C. K. Unni, B. J. Ray, J. M. Prospero, and J. T. Merrill,Long-range atmospheric transport of soil dust from Asia to the tropicalNorth Pacific: Temporal variability, Science, 209, 1522-1524, 1980.
Duce, R. A., R. Arimoto, B. J. Ray, C. K. Unni, and P. J. Harder,Atmospheric trace elements at Enewetak Atoll: Concentrations,sources, and temporal variability, J. Geophys. Res., 88, 5321-5342,1983.
Gagosian, R. B., E. T. Peltzer, and O. C. Zafiriou, Atmospheric transportof continentally derived lipids to the tropical North Pacific, Nature,291, 312-314, 1981.
Gagosian, R. B., O. C. Zafiriou, E. T. Peltzer, and J. B. Alford, Lipids inaerosols from the tropical Noah Pacific: Temporal variability, ,£Geophys. Res., 87, 11,133-11,144, 1982.
TALBOT ET AL: CONTINENTAL OUTFLOW OVER THE WESTERN PACIFIC 1725
Galloway, J. N., Atmospheric acidification: Projections for the future,Ambio, 18, 161-166, 1989.
Gregory, G. L., A. S. Bachmeier, D. R. Blake, B. G. Heikes, D. C.
Thornton, A. R. Bandy, J. D. Bradshaw, and Y. Kondo, Chemical
signatures of aged Pacific marine air: Mixed layer and free troposphere
as measured during PEM-West A, d. Geophys. Res., this issue.
Harriss, R. C., G. W. Sachse, J. E. Collins Jr., L. Wade, K. B. Bartlett, R.
W. Talbot, E. V. Browell, L. A. Barrie, G. F. Hill, and L. G. Burney,
Carbon monoxide and methane over Canada: July - August 1990, d.
Geophys. Res., 99, 1659-1669, 1994.
Hoell, J. M., Jr., D. D. Davis, S. C. Liu, R. Newell, M. Shipham, K.
Akimoto, R. J. McNeal, R. J. Bendura, and J. W. Drewry, The Pacific
Exploratory Mission-West A: September-October 1991, J. Geophys.Res., this issue.
H0bler, G., et al., Total reactive oxidized nitrogen 0SlOy) in the remotePacific troposphere and its correlation with 03 and CO: Manna Loa
Observatory, J. Geophys. Res., 97, 10,427-10,447, 1992.
Kato, N., and H. Akimoto, Anthropogenic emissions of SO2 and NOx in


![Granot STFC2008.ppt [Read-Only] - herts.ac.ukstar.herts.ac.uk/summerschool/resources/GRBsandHighEnergy... · Dynamics 1. A spherical outflow (relativistic analog of SNR) The outflow](https://static.documents.pub/doc/80x56/5b5cc85a7f8b9a65028c8361/granot-read-only-hertsacukstarhertsacuksummerschoolresourcesgrbsandhighenergy.jpg)


