Chemical Characterization of Summertime Dust Events at Kanpur: Insight into the Sources and Level of Mixing with Anthropogenic Emissions Subhasish Ghosh1, Tarun Gupta1*, Nikhil Rastogi1, Abhishek Gaur1, Amit Misra1, Sachchida N. Tripathi1, Debajyoti Paul1, Vinod Tare1, Om Prakash1, Deepika Bhattu1, Anubhav K. Dwivedi1, Daya S.Kaul1, Rosalin Dalai1, Sumit K. Mishra2 1 Department of Civil Engineering, Indian Institute of Technology Kanpur, India 2 National Physical Laboratory, New Delhi, India
ABSTRACT
The aim of this study conducted at Kanpur (26.51°N, 80.23°E), India, was to quantify chemical properties of dust and the intensity of mixing, due to its interaction with various emissions from anthropogenic activities, during its long range transport. Aerosol mass was collected at Indian Institute of Technology, Kanpur (IIT-K) located in the Indo-Gangetic Plain from April–July 2011, a period marked by intense dust storms and onset of monsoon. The sampling days were classified as Dust, Polluted Dust1 (PD1), Polluted Dust2 (PD2) and Continental days. PM10 (coarse mode) and PM2.5 (fine mode) collected on filter substrates were analysed for chemical composition. Elemental concentrations were measured using Inductively Coupled Plasma-Optical Emission Spectroscopy (ICP-OES). The results show that crustal elements like Ca, Fe, K, Na and Mg were dominant in coarse mode during dusty days, whereas, elements of anthropogenic origin like Cu, Ni, Se and V were mostly concentrated in fine mode during PD1 as well as PD2. Very low elemental concentrations were found during continental days. SO4
2–, Cl– and NO3– were found to be high during PD1 and PD2 days. Very good correlations of NH4
+ with Cl– and SO4
2– ions in PD1 days indicate their common sources of origin and formation of ammonium chloride and ammonium sulphate. Water Soluble Inorganic Carbon (WSIC) was found during all dust days, Water Soluble Organic Carbon (WSOC) was found to be highest during PD1 and PD2 days. Keywords: Mixing; Enrichment factor; WSOC; WSIC; PM2.5. INTRODUCTION
The atmospheric aerosols, also known as particulate
matter (PM), comprises of both solids and liquids internally mixed at various levels and suspended in air. Out of the atmospheric aerosol types (like sea salt, trace metals, carbonaceous material, secondary particles), mineral dust is a key constituent of total aerosol concentration, especially during the pre-monsoon period (April–May). Chemical composition of mineral dust is similar to the Earth’s crust, as they originate due to weathering and erosion of the upper crust leading to formation of soil. Hence, chemistry of mineral dust is largely controlled by soil types that vary from place to place. Generally, coarser particles are comprised of quartz, feldspar, and carbonates whereas mica and clay minerals are dominant in finer particles. As it moves away from the source of origin, the mineral dust becomes enriched in clay and mica whereas coarser particles * Corresponding author. E-mail address: [email protected]
get removed due to gravitational settling (Usher et al., 2003). On a local scale, especially in a polluted environment
like Kanpur, dust originating from roads, and industrial and agricultural activities plays an important role in influencing the atmospheric chemistry (Usher et al., 2003). Mineral dust reduces atmospheric visibility (Kim et al., 2001) and disperse harmful micro-organisms that cause various pulmonary diseases and allergies (Griffin and Kellogg, 2004). Dust also affects the climate directly by influencing radiative budget (scattering and absorption of radiation) and indirectly by acting as Cloud Condensation Nuclei (CCN) (Zhang et al., 2007).
Dust storms in which sand or mineral dust are carried away or entrained into the atmosphere by strong-blowing winds, occur predominantly in arid and semiarid regions e.g., Thar Desert in India (Dey et al., 2004). A large number of studies on mineral dust and dust storms have been carried out in different parts of India (Kumar and Sarin, 2009; Rastogi and Sarin, 2009) but most of these studies (Dey et al., 2004; Mishra et al., 2012) have only discussed the optical properties of mineral dust in the Indo-Gangetic Plain. Very little investigation has been carried out on the chemical properties of crustal/mineral dust in Kanpur region
Ghosh et al., Aerosol and Air Quality Research, 14: 879–891, 2014 880
(Chinnam et al., 2006; Chakraborty and Gupta, 2010). Kanpur city, one of the most polluted cities in the World, has a variety of industries like cotton, wool, jute and tanneries. The sources of air pollution are mainly categorized into industrial, commercial, transport, domestic, institutional and fugitive (Behera and Sharma, 2010; Gupta and Mandariya, 2013).
This study mainly focuses on the chemical characterization of crustal dust, which is subsequently used to analyze intensity of mixing with anthropogenic-origin aerosols and dominant sources affecting this region. The sampling days were classified into Dust, Polluted Dust1 (PD1), Polluted Dust2 (PD2) and Continental Days. Days affected by severe dust storms were classified as dusty days. Those days where mineral dust was mixed with anthropogenic pollutants were grouped as PD1 days while those dominated by Biomass burning events were PD2 days. Cleaner days were called continental days composed of background concentration only. Details about classification with appropriate justification is provided in our companion paper, (Misra et al. (manuscript under preparation)). To get an in-depth knowledge of the dominant sources and mixing of anthropogenic pollutants with mineral dust, various methods like enrichment factor, elemental and ions signatures, NOAA back trajectory analysis etc. were used.
SAMPLING PROCEDURE Description of Sampling Site
Sampling was carried out at 30 m above ground level, on the roof of the atmospheric monitoring tower inside the campus of Indian Institute of Technology, Kanpur (IIT-K, 26.51°N, 80.23°E) located about 15 km N-W of the central part of Kanpur city. The local climate is mainly humid subtropical, characterized by extremely hot summer and cold winters. The pre-monsoon period is very hot and dry in which temperature reaches up to a monthly mean maximum of 41.3°C and monthly mean minimum of 26.4°C (Indian Meteorological Dept., Govt. of India). Dust storms during this period bring copious amount of mineral dust from various arid regions of Western India. Wind was blowing from South–West towards North–East for most part of the sampling periods; April–May were hot and dry while June–July were relatively cooler but more humid due to onset of monsoon (Misra et al. (manuscript under preparation)).
Sampling Schedule
Sampling of coarse (PM10) and fine (PM2.5) aerosols were carried out for 8 h daily (0900 h to 1700h), every 3rd
day starting from 1st April to 15th July 2011 using PM10 (APM 541, Envirotech) and PM2.5 (APM550, Envirotech) samplers. Flow rate of 16.7 LPM for both the samplers was controlled via a critical orifice. Additionally, eight field blanks were also collected. The sampling period covers the pre-monsoon and a part of monsoon seasons. To minimize PM mass loss, precautionary steps were taken in the preparation of filter paper, sample collection and weighing as reported earlier (Chakraborty and Gupta, 2010).
ANALYTICAL METHODS Collection, Gravimetric and Chemical Analysis of Aerosols
PM were collected using 47 mm quartz fiber filters (Whatman QM-A) preconditioned and post conditioned to equilibrate for 24 h at 21 ± 2°C (room temperature) and (35 ± 5%) humidity. The filters were weighed gravimetrically thrice before and after sampling using a 1 µg least count micro balance (Metler 440). The mass of the sampled aerosols divided by the volume of the sampled air gives the PM mass concentration (µg/m3).
For elemental analyses, a punch of 16.5 mm diameter from the sampled quartz filter was taken and then shredded into smaller pieces which were then mixed with 20 mL of HNO3 acid (65%, GR Merck Suprapure) in a 100 mL round bottom digestion flask. It was digested over a hot plate for 2 h at 180°C, till only a small amount of nitric acid was left. The digestion flask was cooled to room temperature and the wall of the flask was rinsed with Milli-Q water (resistivity of 18 MΩcm at 25°C). The residue was then filtered through a 0.22 µm pore size filter paper (Millipore), diluted to 100 mL with Milli-Q water and stored in 100 mL reagent bottles. The samples were subsequently analyzed for 14 elements, namely Ca, Cd, Cr, Cu, Fe, K, Mg, Mn, Na, Ni, Pb, Se, V and Zn, using ICP-OES (ICAP 6300 Thermo Inc.), following detailed procedure described by Chakraborty and Gupta, (2010). The method detection limit (MDL in ng/m3) values for various elements analyzed are reproduced here: As = 2.12, Ca = 0.11, Cd = 1.33, Cr = 4.13, Cu = 10.42, Fe = 6.25, K = 0.11, Mg = 0.1, Mn = 2.08, Na = 0.11, Ni = 2.08, Pb = 22.93, Se = 2.08, Ti = 2.08, V = 2.08, Zn = 2.08, respectively (Chakraborty and Gupta 2010; Gupta and Mandariya, 2013).
For ionic measurements, another punch of 16.5 mm diameter was also shredded into small fragments and mixed with 20 mL of Milli Q water in a 50 mL test tube and ultrasonicated (Fast Clean Ultrasonic cleaner, 2k909008). The aliquots were then filtered using a 0.22 µm pore filter paper and analyzed for three anions (Cl–, NO3
– and SO42–)
and one cation (NH4+) using an Ion Chromatograph (882
Compact IC plus, Metrohm). MDL (in ng/m3) values for various ions analyzed are reproduced here: F– = 3.0, Cl– = 3.0, NO3
– = 8.7, SO42– = 12.0, NH4
+ = 17.0, respectively (Chakraborty and Gupta 2010; Gupta and Mandariya, 2013).
Total Organic Carbon TOC analysis in all filter samples was carried out by a (TOC) analyser (Model No: TOC-V CPN, Shimadzu Corporation) (Kaul et al., 2012). The water soluble organic carbon (WSOC) was analysed with a TOC equipped with a highly sensitive catalyst. The non-purgeable organic carbon method (NPOC) used in the TOC analyser has been described in detail by Timonen et al. (2008). Briefly, the sample is extracted with deionised water, acidified and injected into an oven. In the oven, the carbon is catalytically oxidized to CO2 at 680°C which is subsequently detected by a sensitive Non-Dispersive Infra-Red (NDIR) detector.
Quality Control and Quality Assurance
All the glassware used for the ionic and elemental analysis were washed with acids (chromic acid for ions and 5% nitric acid for elemental analysis) and dried in oven at
Ghosh et al., Aerosol and Air Quality Research, 14: 879–891, 2014 881
180°C. Calibrations of the instruments were carried out with the standards of known concentrations. Two commercially available standards (Multielement Standard Solution 4 and 5, Sigma Aldrich) were used for the calibration of the instrument and generation of standard calibration curves. Replicate analyses of selected samples and standards suggest reproducibility within 5%. In both the instruments, standards of known concentrations were spiked after the analysis of every 10 samples and if the elements/ions concentrations were not found within ± 5% of known concentration, the instruments were recalibrated. Blanks were also subjected to the same procedure (Chakraborty and Gupta, 2010). All the measured values reported in the manuscript were blank corrected. RESULTS AND DISCUSSION Temporal Variability of PM Mass Concentrations
The temporal variations in mass concentration of PM10 and PM2.5 aerosols are shown in Fig. 1(a). Each data point shows the aerosol mass on a particular sampling day. PM10 average mass concentration for the entire sampling duration was found to be 101.91 µg/m3 which varied from 25.64 to 254.19 µg/m3. PM2.5 mass concentration varied from 11.41 to 66.28 µg/m3 with an average value of 37.61 µg/m3. PM coarse fraction presented as the abundance of coarse mode (PM10–PM2.5) with respect to PM10, is plotted in Fig. 1(b). The highest concentrations were observed on 13 May and 10 April for PM10 and PM2.5, respectively. The highest PM
mass observed during the period (April–May) was due to the strong winds and presence of dry atmospheric condition which re-suspended the road dust and soil. The concentration decreased during June and July because dust particles settled down due to wet removal by rain and due to the presence of high relative humidity.
The temporal variations of PM coarse fraction shows that the highest PM coarse fraction was observed on 13 May, 10 May, 1 May and 25 April (Fig. 1) during which the coarse particles were abundant in PM10. These days were classified either as Dust or Polluted Dust. The details for CO and BC measurements and complete analysis are provided in our companion paper (Misra et al. (manuscript under preparation)). The values for BC for two different periods were measured as: April–May (avg. = 1.249 µg/m3, std = 0.715 µg/m3), June–July (avg = 0.789 µg/m3, std = 0.2430 µg/m3). Whereas, CO ranged between 360–953 ppb for the complete sampling duration with highest values reported for PD2 days (avg. = 789 ppb, std = 214 ppb).
Chemical Composition of Aerosols
The air masses may mix with different aerosols of natural and anthropogenic origin during their transportation. Along the air mass trajectory, contribution from different sources can vary depending on factors such as meteorological condition, chemical processes, and type of sources.
The chemical composition of aerosols in PM10 and PM2.5 are summarised in Table 1. Statistically significant linear correlation coefficients (R2 > 0.6) between two elements
Fig. 1. Temporal variations of (a) Mass Concentration of PM10 and PM2.5 and (b) PM Factor or PM Coarse Fraction ((PM10 – PM2.5)/PM10). The missing two data points in PM10 are due to the rain, when sampling had to be stopped.
Ghosh et al., Aerosol and Air Quality Research, 14: 879–891, 2014 882
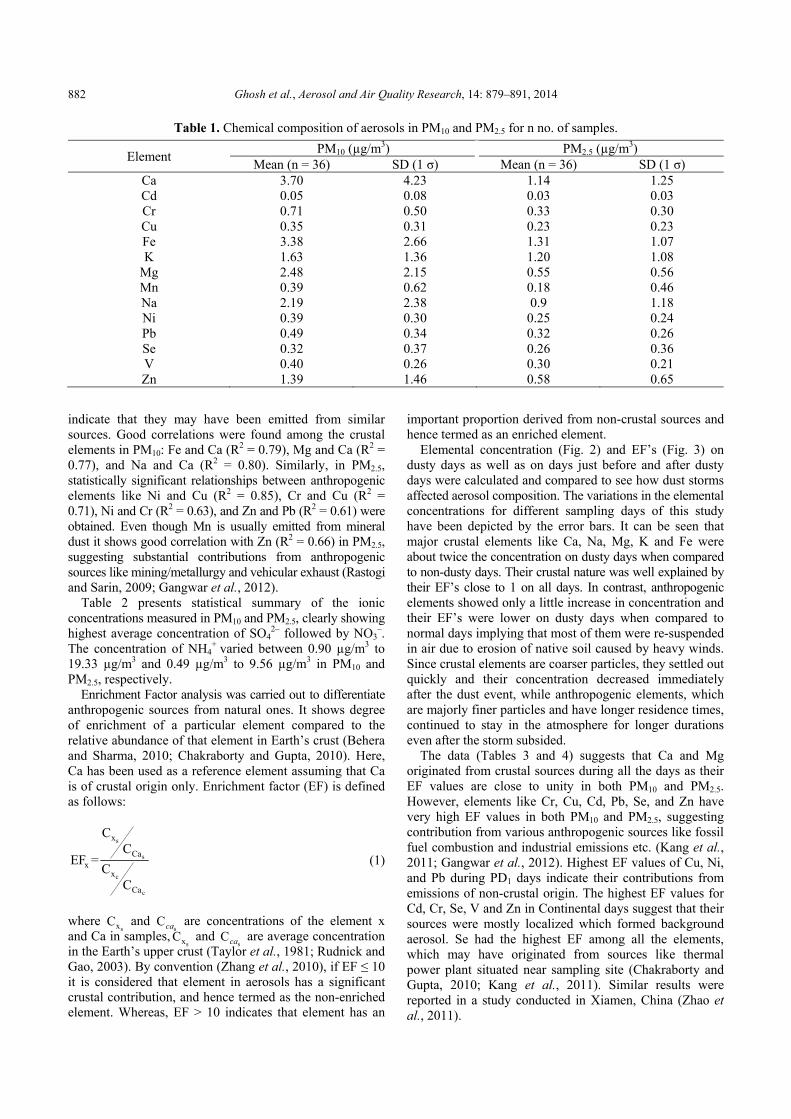
Table 1. Chemical composition of aerosols in PM10 and PM2.5 for n no. of samples.
Element PM10 (µg/m3) PM2.5 (µg/m3)
Mean (n = 36) SD (1 σ) Mean (n = 36) SD (1 σ) Ca 3.70 4.23 1.14 1.25 Cd 0.05 0.08 0.03 0.03 Cr 0.71 0.50 0.33 0.30 Cu 0.35 0.31 0.23 0.23 Fe 3.38 2.66 1.31 1.07 K 1.63 1.36 1.20 1.08
Mg 2.48 2.15 0.55 0.56 Mn 0.39 0.62 0.18 0.46 Na 2.19 2.38 0.9 1.18 Ni 0.39 0.30 0.25 0.24 Pb 0.49 0.34 0.32 0.26 Se 0.32 0.37 0.26 0.36 V 0.40 0.26 0.30 0.21 Zn 1.39 1.46 0.58 0.65
indicate that they may have been emitted from similar sources. Good correlations were found among the crustal elements in PM10: Fe and Ca (R2 = 0.79), Mg and Ca (R2 = 0.77), and Na and Ca (R2 = 0.80). Similarly, in PM2.5, statistically significant relationships between anthropogenic elements like Ni and Cu (R2 = 0.85), Cr and Cu (R2 = 0.71), Ni and Cr (R2 = 0.63), and Zn and Pb (R2 = 0.61) were obtained. Even though Mn is usually emitted from mineral dust it shows good correlation with Zn (R2 = 0.66) in PM2.5, suggesting substantial contributions from anthropogenic sources like mining/metallurgy and vehicular exhaust (Rastogi and Sarin, 2009; Gangwar et al., 2012).
Table 2 presents statistical summary of the ionic concentrations measured in PM10 and PM2.5, clearly showing highest average concentration of SO4
2– followed by NO3–.
The concentration of NH4+ varied between 0.90 µg/m3 to
19.33 µg/m3 and 0.49 µg/m3 to 9.56 µg/m3 in PM10 and PM2.5, respectively.
Enrichment Factor analysis was carried out to differentiate anthropogenic sources from natural ones. It shows degree of enrichment of a particular element compared to the relative abundance of that element in Earth’s crust (Behera and Sharma, 2010; Chakraborty and Gupta, 2010). Here, Ca has been used as a reference element assuming that Ca is of crustal origin only. Enrichment factor (EF) is defined as follows:
s
s
c
c
x
Cax
x
Ca
CC
EF =C
C
(1)
where
sxC and s
Cca are concentrations of the element x and Ca in samples,
sxC and s
Cca are average concentration in the Earth’s upper crust (Taylor et al., 1981; Rudnick and Gao, 2003). By convention (Zhang et al., 2010), if EF ≤ 10 it is considered that element in aerosols has a significant crustal contribution, and hence termed as the non-enriched element. Whereas, EF > 10 indicates that element has an
important proportion derived from non-crustal sources and hence termed as an enriched element.
Elemental concentration (Fig. 2) and EF’s (Fig. 3) on dusty days as well as on days just before and after dusty days were calculated and compared to see how dust storms affected aerosol composition. The variations in the elemental concentrations for different sampling days of this study have been depicted by the error bars. It can be seen that major crustal elements like Ca, Na, Mg, K and Fe were about twice the concentration on dusty days when compared to non-dusty days. Their crustal nature was well explained by their EF’s close to 1 on all days. In contrast, anthropogenic elements showed only a little increase in concentration and their EF’s were lower on dusty days when compared to normal days implying that most of them were re-suspended in air due to erosion of native soil caused by heavy winds. Since crustal elements are coarser particles, they settled out quickly and their concentration decreased immediately after the dust event, while anthropogenic elements, which are majorly finer particles and have longer residence times, continued to stay in the atmosphere for longer durations even after the storm subsided.
The data (Tables 3 and 4) suggests that Ca and Mg originated from crustal sources during all the days as their EF values are close to unity in both PM10 and PM2.5. However, elements like Cr, Cu, Cd, Pb, Se, and Zn have very high EF values in both PM10 and PM2.5, suggesting contribution from various anthropogenic sources like fossil fuel combustion and industrial emissions etc. (Kang et al., 2011; Gangwar et al., 2012). Highest EF values of Cu, Ni, and Pb during PD1 days indicate their contributions from emissions of non-crustal origin. The highest EF values for Cd, Cr, Se, V and Zn in Continental days suggest that their sources were mostly localized which formed background aerosol. Se had the highest EF among all the elements, which may have originated from sources like thermal power plant situated near sampling site (Chakraborty and Gupta, 2010; Kang et al., 2011). Similar results were reported in a study conducted in Xiamen, China (Zhao et al., 2011).
Ghosh et al., Aerosol and Air Quality Research, 14: 879–891, 2014 883
Table 2. Summary table depicting ionic concentration in PM10 and PM2.5 for n no. of samples.
Ions PM10 (µg/m3) PM2.5 (µg/m3)
Mean (n = 36) SD (1 σ) Mean (n = 36) SD (1 σ) NH4
+ 4.11 3.76 2.54 1.87 Cl– 2.68 2.86 2.06 1.82
NO3– 4.97 3.86 3.10 2.83
SO42– 6.54 3.61 5.38 2.51
Fig. 2. Elemental concentration comparison between dusty and non dusty days in PM10. Error bars shown represent one standard deviation.
Fig. 3. Enrichment Factor comparison between dusty and non-dusty days in PM10.
0.1
1
10
100
1000
Ca Cr Cu Fe K Mg Mn Na Ni V
Enr
ichm
ent F
acto
r
Before Dusty Day During Dusty Day After Dusty Day
1
10
100
1000
10000
100000
1000000
Cd Pb Se Zn
Enr
ichm
ent F
acto
r
Ghosh et al., Aerosol and Air Quality Research, 14: 879–891, 2014 884
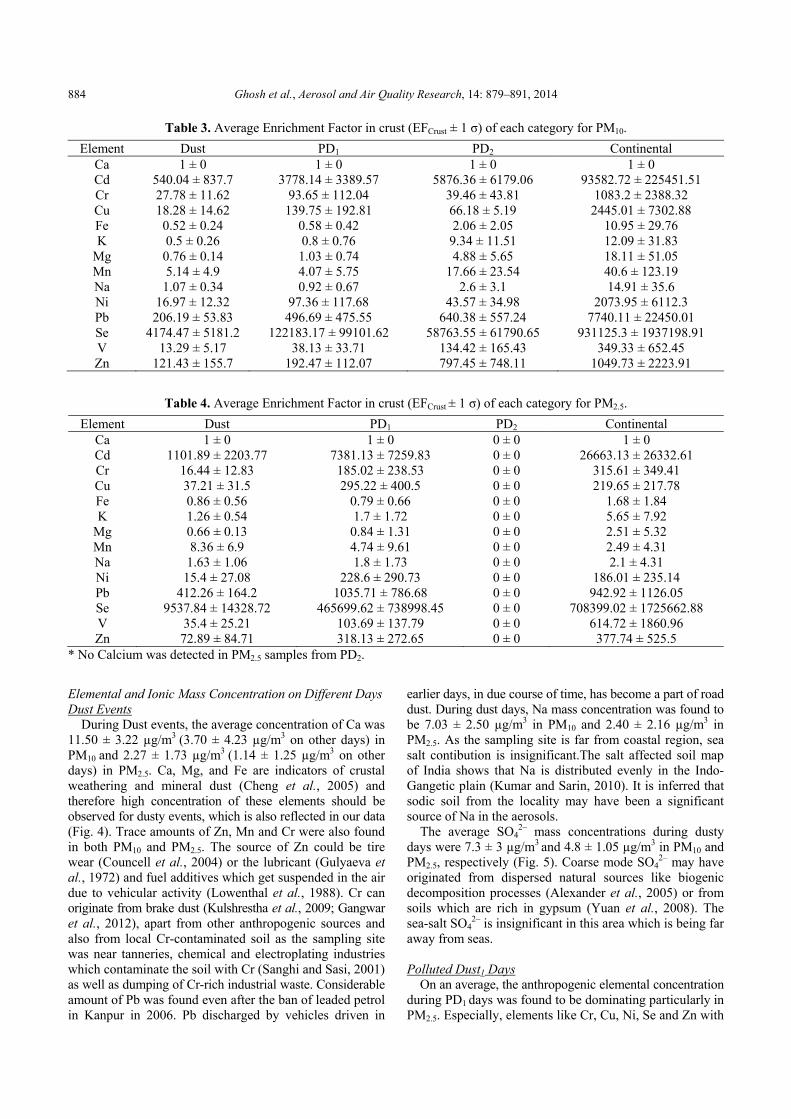
Table 3. Average Enrichment Factor in crust (EFCrust ± 1 σ) of each category for PM10.
* No Calcium was detected in PM2.5 samples from PD2.
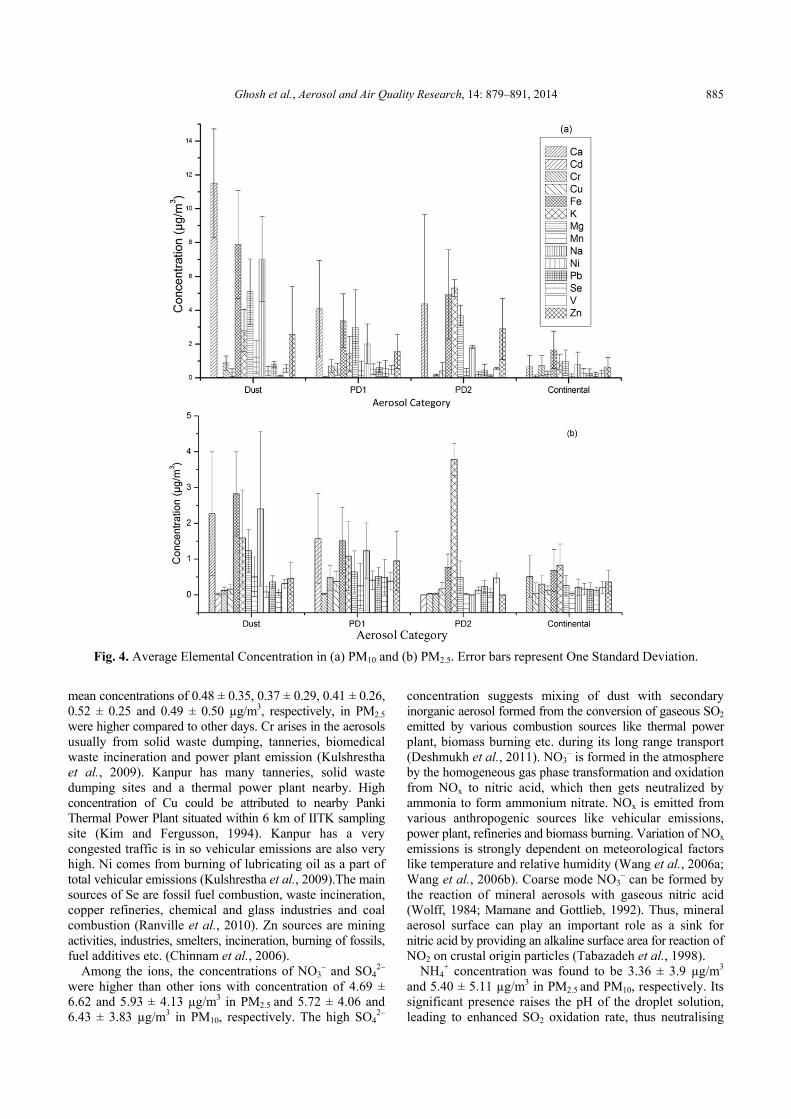
Elemental and Ionic Mass Concentration on Different Days Dust Events
During Dust events, the average concentration of Ca was 11.50 ± 3.22 µg/m3 (3.70 ± 4.23 µg/m3 on other days) in PM10 and 2.27 ± 1.73 µg/m3 (1.14 ± 1.25 µg/m3 on other days) in PM2.5. Ca, Mg, and Fe are indicators of crustal weathering and mineral dust (Cheng et al., 2005) and therefore high concentration of these elements should be observed for dusty events, which is also reflected in our data (Fig. 4). Trace amounts of Zn, Mn and Cr were also found in both PM10 and PM2.5. The source of Zn could be tire wear (Councell et al., 2004) or the lubricant (Gulyaeva et al., 1972) and fuel additives which get suspended in the air due to vehicular activity (Lowenthal et al., 1988). Cr can originate from brake dust (Kulshrestha et al., 2009; Gangwar et al., 2012), apart from other anthropogenic sources and also from local Cr-contaminated soil as the sampling site was near tanneries, chemical and electroplating industries which contaminate the soil with Cr (Sanghi and Sasi, 2001) as well as dumping of Cr-rich industrial waste. Considerable amount of Pb was found even after the ban of leaded petrol in Kanpur in 2006. Pb discharged by vehicles driven in
earlier days, in due course of time, has become a part of road dust. During dust days, Na mass concentration was found to be 7.03 ± 2.50 µg/m3 in PM10 and 2.40 ± 2.16 µg/m3 in PM2.5. As the sampling site is far from coastal region, sea salt contibution is insignificant.The salt affected soil map of India shows that Na is distributed evenly in the Indo-Gangetic plain (Kumar and Sarin, 2010). It is inferred that sodic soil from the locality may have been a significant source of Na in the aerosols.
The average SO42– mass concentrations during dusty
days were 7.3 ± 3 µg/m3 and 4.8 ± 1.05 µg/m3 in PM10 and PM2.5, respectively (Fig. 5). Coarse mode SO4
2– may have originated from dispersed natural sources like biogenic decomposition processes (Alexander et al., 2005) or from soils which are rich in gypsum (Yuan et al., 2008). The sea-salt SO4
2– is insignificant in this area which is being far away from seas.
Polluted Dust1 Days
On an average, the anthropogenic elemental concentration during PD1 days was found to be dominating particularly in PM2.5. Especially, elements like Cr, Cu, Ni, Se and Zn with
Ghosh et al., Aerosol and Air Quality Research, 14: 879–891, 2014 885
Fig. 4. Average Elemental Concentration in (a) PM10 and (b) PM2.5. Error bars represent One Standard Deviation.
mean concentrations of 0.48 ± 0.35, 0.37 ± 0.29, 0.41 ± 0.26, 0.52 ± 0.25 and 0.49 ± 0.50 µg/m3, respectively, in PM2.5 were higher compared to other days. Cr arises in the aerosols usually from solid waste dumping, tanneries, biomedical waste incineration and power plant emission (Kulshrestha et al., 2009). Kanpur has many tanneries, solid waste dumping sites and a thermal power plant nearby. High concentration of Cu could be attributed to nearby Panki Thermal Power Plant situated within 6 km of IITK sampling site (Kim and Fergusson, 1994). Kanpur has a very congested traffic is in so vehicular emissions are also very high. Ni comes from burning of lubricating oil as a part of total vehicular emissions (Kulshrestha et al., 2009).The main sources of Se are fossil fuel combustion, waste incineration, copper refineries, chemical and glass industries and coal combustion (Ranville et al., 2010). Zn sources are mining activities, industries, smelters, incineration, burning of fossils, fuel additives etc. (Chinnam et al., 2006).
Among the ions, the concentrations of NO3– and SO4
2– were higher than other ions with concentration of 4.69 ± 6.62 and 5.93 ± 4.13 µg/m3 in PM2.5 and 5.72 ± 4.06 and 6.43 ± 3.83 µg/m3 in PM10, respectively. The high SO4
2–
concentration suggests mixing of dust with secondary inorganic aerosol formed from the conversion of gaseous SO2 emitted by various combustion sources like thermal power plant, biomass burning etc. during its long range transport (Deshmukh et al., 2011). NO3
– is formed in the atmosphere by the homogeneous gas phase transformation and oxidation from NOx to nitric acid, which then gets neutralized by ammonia to form ammonium nitrate. NOx is emitted from various anthropogenic sources like vehicular emissions, power plant, refineries and biomass burning. Variation of NOx emissions is strongly dependent on meteorological factors like temperature and relative humidity (Wang et al., 2006a; Wang et al., 2006b). Coarse mode NO3
– can be formed by the reaction of mineral aerosols with gaseous nitric acid (Wolff, 1984; Mamane and Gottlieb, 1992). Thus, mineral aerosol surface can play an important role as a sink for nitric acid by providing an alkaline surface area for reaction of NO2 on crustal origin particles (Tabazadeh et al., 1998).
NH4+ concentration was found to be 3.36 ± 3.9 µg/m3
and 5.40 ± 5.11 µg/m3 in PM2.5 and PM10, respectively. Its significant presence raises the pH of the droplet solution, leading to enhanced SO2 oxidation rate, thus neutralising
Ghosh et al., Aerosol and Air Quality Research, 14: 879–891, 2014 886
Fig. 5. Average ions concentration (µg/m3) in (a) PM10 and (b) PM2.5. Error bars represent one standard deviation.
the acidity of the aerosols (Wang et al., 2006b). It comes into the aerosols by reaction of ammonia gas with acidic species such as H2SO4, HNO3 and HCl or sometimes ammonia vapour may react or condense on an acidic particle/droplet surface of anthropogenic origin. The different sources of ammonia are animal waste, ammonification of humus, loss of ammonia from the fertilizers added into the soil, and emissions from industries, incineration of waste, biomass burning and also from the internal combustion engines (Seinfeld and Pandis, 2012).
Internal mixing and meteorological conditions play an important role for good correlations. High correlation was found between NH4
+ and SO42– (R2 = 0.91 in PM2.5), NO3
– and SO4
2– (R2 = 0.65 in PM2.5 and R2 = 0.77 in PM10) and NH4
+ and NO3– (R2 = 0.6 in PM2.5) which shows the
formation of ammonium sulphate, ammonium bisulphate (NH4HSO4) and ammonium nitrate (Gupta and Mandariya, 2013). Coal burning, vehicle emissions and industries are the common sources of NO3
– and SO42–.
Polluted Dust2 Days
High K concentration with mean value of 3.78 ± 0.45
µg/m3 and trace amounts of V and Pb with average concentrations of 0.47 ± 0.14 µg/m3 and 0.23 ± 0.17 µg/m3, respectively, in PM2.5 were found in PD2 type of aerosols. Whereas, PM10 was found to be enriched with Ca, Fe, K, Mg and Zn, with mean values of 4.38 ± 5.29, 4.94 ± 2.64, 5.31 ± 0.50, 3.69 ± 0.60 and 2.90 ± 1.81 µg/m3, respectively. Echalar et al. (1995) found that K is a major cation in fine mode and that aerosols are generated during biomass burning by soil particles re-suspension, incompletely burnt plant tissues and as a result of condensation or coagulation of fine mode particles.Therefore, K can be used as a diagnostic tracer for biomass burning and thus it implies that the aerosols collected on these days got mixed with various pollutants from anthropogenic sources like burning of dry leaves, grasses and crop residue which is a common practice after crop harvesting in India. Similarly, Zn can come from biomass burning, coal and wood combustion (Rastogi and Sarin, 2009; Chakraborty and Gupta, 2010). V is present in heavy fuel oils, which is released into the atmosphere at concentrations of 10–50 mg/g as fly ashwhen oils get combusted (Mamane and Pirrone, 1998). There was no Ca found in PM2.5 which suggests that the Ca in PD2 were mainly associated with the
Ghosh et al., Aerosol and Air Quality Research, 14: 879–891, 2014 887
coarser particles. The crustal minerals can also come into the aerosols during burning by two ways: crustal matter can be resuspended from the ground during extreme fires creating uplift conditions and the minerals that had accumulated earlier on the flora (dry deposition) get entrained in the intense fire and are emitted as aerosols (Li et al., 2003).
Overall, the mean concentration of ions was found to be highest during these days. SO4
2– was the dominant ion and was found to be 11.3 ± 1.01 and 6.24 ± 0.98 µg/m3 in PM10
and PM2.5, respectively. Mean NO3– concentration was
found to be 10.27 ± 10.18 and 4.73 ± 5.10 µg/m3 in PM10
and PM2.5, respectively. High concentration of Cl– was also observed which was 7.71 ± 10.29 and 4.39 ± 6.09 µg/m3in PM10 and PM2.5, respectively. Cl– comes from burning of fossil fuel (coal combustion), brick kilns, biomass burning, etc. It gets transformed from gas to particle phase due to the neutralization of ammonia by HCl which is released from above mentioned sources (Gupta and Mandariya, 2013).
Continental Days
Crustal elements like Fe and Mg, were found along with some other elements like Cd, Cr, Cu, K, Ni, Pb, V and Se (especially in the fine mode) from anthropogenic activities but their concentrations were quite low. These days were mainly affected by local sources. Among the ions only SO4
2–, NH4+ and Cl– with concentrations 5.62 ± 1.64, 2.64
± 1.27, and 1.79 ± 1.18 µg/m3, respectively in PM2.5 were found to be higher than dust events. However, their concentration in PM10 was found to be lower than all the other days. A fair correlation between Cl– and SO4
2– (R2 = 0.64) in PM2.5 was also observed.
Variations in Water Soluble Organic Carbon (WSOC) and Water Soluble Inorganic Carbon (WSIC)
WSOC is a major fraction of water soluble constituent and contributes to the CCN number density (Ram and Sarin, 2011). WSOC concentration varied from 0.70 to 24.18 µg/m3 in PM10 and 0.28 to 17.98 µg/m3 in PM2.5 (Fig. 6). The ratio of WSOC in PM2.5 to that in PM10 ranged between 0.05 to 0.91, indicating a wide variability in the carbonaceous aerosols in coarse and fine particle modes. WSOC mostly existed as oxygenated organic compounds like ketones, carboxylic acids, aldehydes, and peroxide emanating from biomass burning (burning of wood and agricultural waste) and emissions from vehicles and industries or through secondary heterogeneous oxidation (Pathak et al., 2011). WSOC was found to be higher during PD2 and PD1 days especially on 10th, 16th and 25th April; 4th and 13th May; 6th and 15th June and 15th July which results from enhanced formation of biogenic and anthropogenic secondary organic aerosols (SOA). It is formed by oxidation of volatile organic compounds (VOCs) in the presence of oxidizing agents such as O3, OH–, peroxide and NO3
– radicals (Ram et al., 2010; Kaul et al., 2011). During summertime, a strong photochemical oxidation takes place forming functional groups containing oxygen which increases hygroscopicity of the aerosol (Viana et al., 2006). The WSIC ranged between 0.32 to 15.64 µg/m3 in PM10 (Fig. 6(a)) and 0.02 to 4.28 µg/m3 in PM2.5 (Fig. 6(b)). The contribution of WSIC to that of total mass was only 2% in PM2.5 and 1.7% in PM10. WSIC was found during all the dusty days and on some PD1 days which may have originated from carbonate and hydrogen bicarbonates formed mainly from crustal matter;
Fig. 6. Temporal variations of Water Soluble Inorganic Carbon (WSIC) and Water Soluble Organic Carbon (WSOC) in (a) PM10 and (b) PM2.5.
Ghosh et al., Aerosol and Air Quality Research, 14: 879–891, 2014 888
(Khare et al., 2011). It was high on 1st, 13th and 28th April 1st, 10th, 22nd, 25th and 28th May; 3rd and 6th June and 15th July. During most of the continental days the WSIC was lower suggesting lesser contribution from dust. Case Study 25 May
25 May, classified as a dusty day, had mass concentrations of 176.16 µg/m3 in PM10. The concentration of elements Ca, Fe, Mg and Na was 16.81, 9.96, 7.54, and 8.34 µg/m3, respectively in PM10, were the highest amongst all the days. Also, the SO4
2– and NO3– concentrations were 7.54
and 6.32 µg/m3 in PM10 and 4.81 and 3.63 µg/m3 in PM2.5, respectively, which show that 1.6 times of SO4
2– was in coarse mode. This suggests that SO4
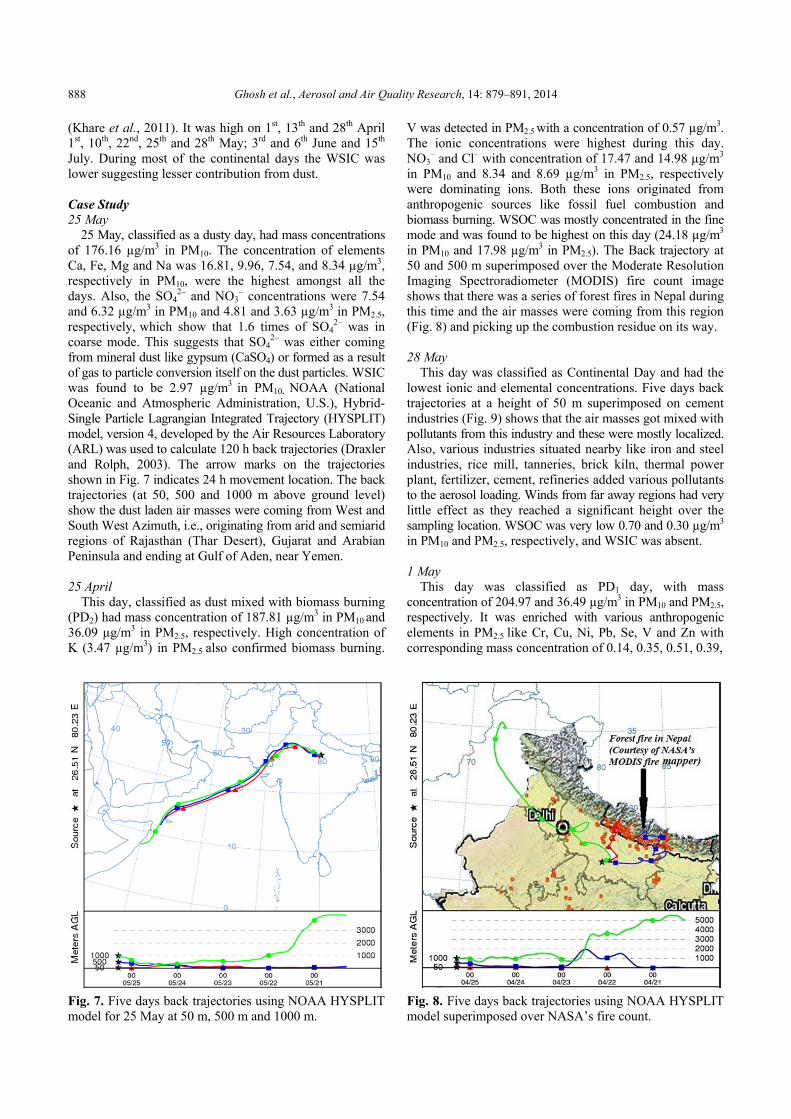
2– was either coming from mineral dust like gypsum (CaSO4) or formed as a result of gas to particle conversion itself on the dust particles. WSIC was found to be 2.97 µg/m3 in PM10. NOAA (National Oceanic and Atmospheric Administration, U.S.), Hybrid-Single Particle Lagrangian Integrated Trajectory (HYSPLIT) model, version 4, developed by the Air Resources Laboratory (ARL) was used to calculate 120 h back trajectories (Draxler and Rolph, 2003). The arrow marks on the trajectories shown in Fig. 7 indicates 24 h movement location. The back trajectories (at 50, 500 and 1000 m above ground level) show the dust laden air masses were coming from West and South West Azimuth, i.e., originating from arid and semiarid regions of Rajasthan (Thar Desert), Gujarat and Arabian Peninsula and ending at Gulf of Aden, near Yemen. 25 April
This day, classified as dust mixed with biomass burning (PD2) had mass concentration of 187.81 µg/m3 in PM10 and 36.09 µg/m3 in PM2.5, respectively. High concentration of K (3.47 µg/m3) in PM2.5 also confirmed biomass burning.
Fig. 7. Five days back trajectories using NOAA HYSPLIT model for 25 May at 50 m, 500 m and 1000 m.
V was detected in PM2.5 with a concentration of 0.57 µg/m3. The ionic concentrations were highest during this day. NO3
– and Cl– with concentration of 17.47 and 14.98 µg/m3 in PM10 and 8.34 and 8.69 µg/m3 in PM2.5, respectively were dominating ions. Both these ions originated from anthropogenic sources like fossil fuel combustion and biomass burning. WSOC was mostly concentrated in the fine mode and was found to be highest on this day (24.18 µg/m3
in PM10 and 17.98 µg/m3 in PM2.5). The Back trajectory at 50 and 500 m superimposed over the Moderate Resolution Imaging Spectroradiometer (MODIS) fire count image shows that there was a series of forest fires in Nepal during this time and the air masses were coming from this region (Fig. 8) and picking up the combustion residue on its way. 28 May
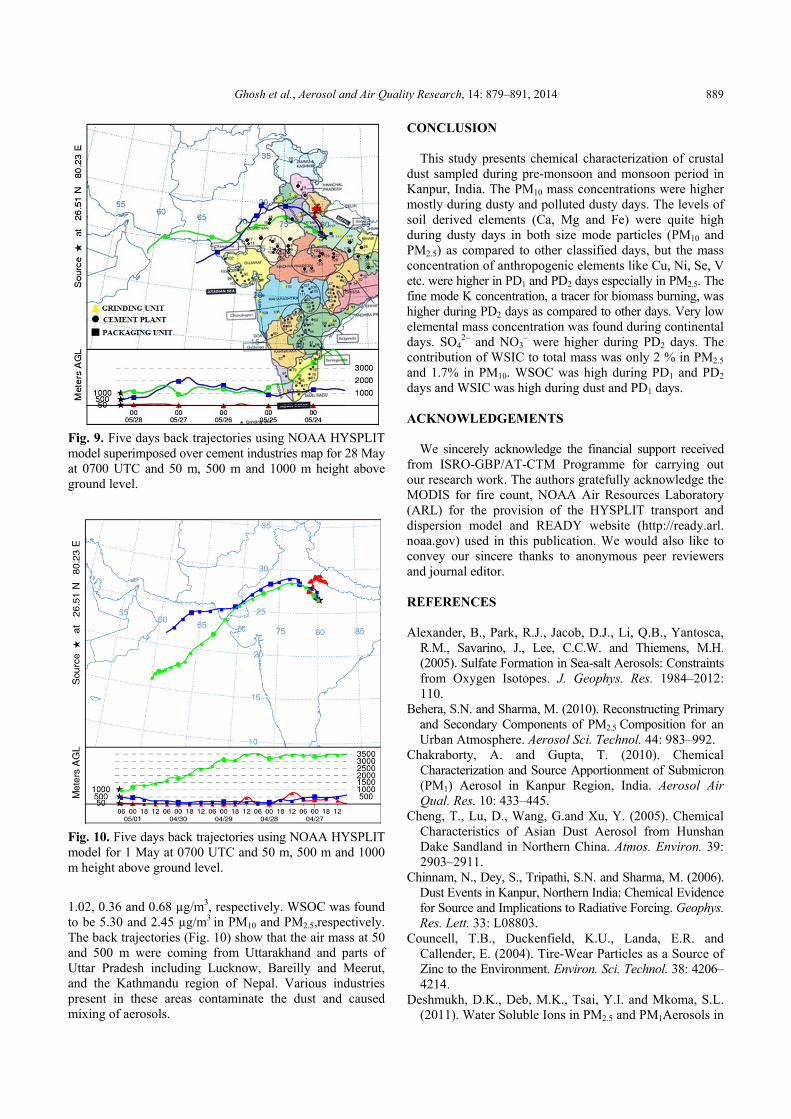
This day was classified as Continental Day and had the lowest ionic and elemental concentrations. Five days back trajectories at a height of 50 m superimposed on cement industries (Fig. 9) shows that the air masses got mixed with pollutants from this industry and these were mostly localized. Also, various industries situated nearby like iron and steel industries, rice mill, tanneries, brick kiln, thermal power plant, fertilizer, cement, refineries added various pollutants to the aerosol loading. Winds from far away regions had very little effect as they reached a significant height over the sampling location. WSOC was very low 0.70 and 0.30 µg/m3 in PM10 and PM2.5, respectively, and WSIC was absent. 1 May
This day was classified as PD1 day, with mass concentration of 204.97 and 36.49 µg/m3 in PM10 and PM2.5, respectively. It was enriched with various anthropogenic elements in PM2.5 like Cr, Cu, Ni, Pb, Se, V and Zn with corresponding mass concentration of 0.14, 0.35, 0.51, 0.39,
Fig. 8. Five days back trajectories using NOAA HYSPLIT model superimposed over NASA’s fire count.
Ghosh et al., Aerosol and Air Quality Research, 14: 879–891, 2014 889
Fig. 9. Five days back trajectories using NOAA HYSPLIT model superimposed over cement industries map for 28 May at 0700 UTC and 50 m, 500 m and 1000 m height above ground level.
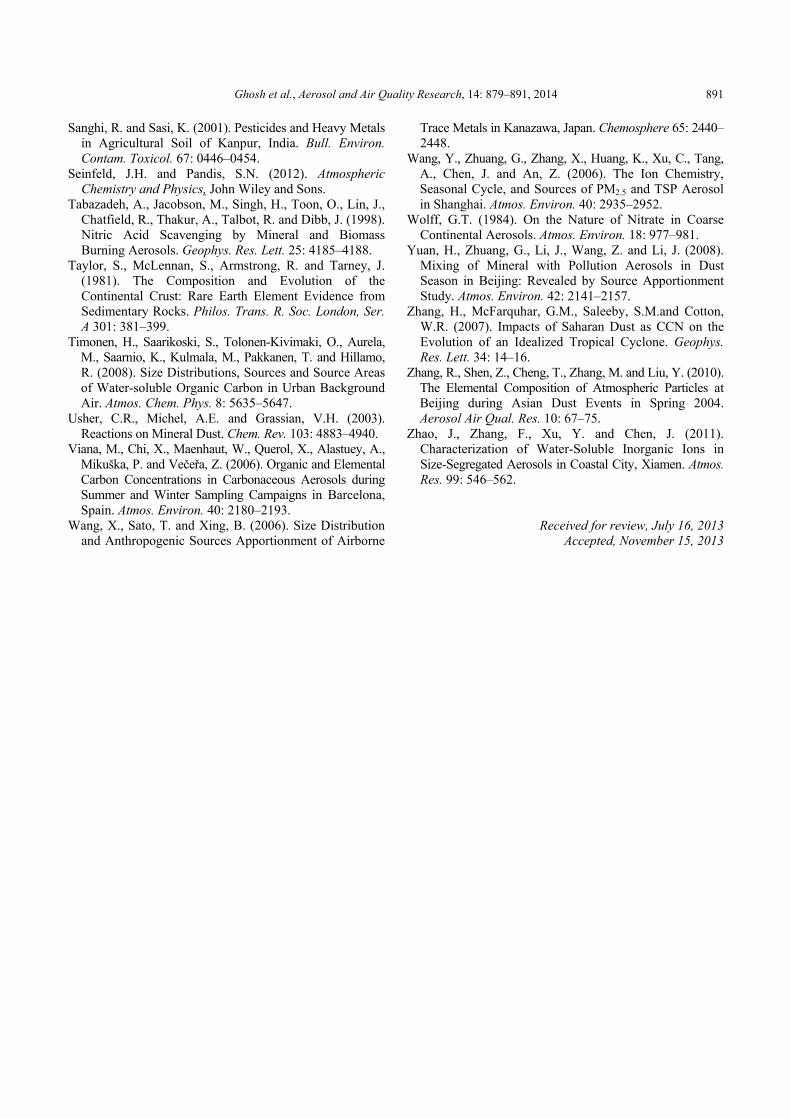
Fig. 10. Five days back trajectories using NOAA HYSPLIT model for 1 May at 0700 UTC and 50 m, 500 m and 1000 m height above ground level.
1.02, 0.36 and 0.68 µg/m3, respectively. WSOC was found to be 5.30 and 2.45 µg/m3 in PM10 and PM2.5,respectively. The back trajectories (Fig. 10) show that the air mass at 50 and 500 m were coming from Uttarakhand and parts of Uttar Pradesh including Lucknow, Bareilly and Meerut, and the Kathmandu region of Nepal. Various industries present in these areas contaminate the dust and caused mixing of aerosols.
CONCLUSION
This study presents chemical characterization of crustal dust sampled during pre-monsoon and monsoon period in Kanpur, India. The PM10 mass concentrations were higher mostly during dusty and polluted dusty days. The levels of soil derived elements (Ca, Mg and Fe) were quite high during dusty days in both size mode particles (PM10 and PM2.5) as compared to other classified days, but the mass concentration of anthropogenic elements like Cu, Ni, Se, V etc. were higher in PD1 and PD2 days especially in PM2.5. The fine mode K concentration, a tracer for biomass burning, was higher during PD2 days as compared to other days. Very low elemental mass concentration was found during continental days. SO4
2– and NO3– were higher during PD2 days. The
contribution of WSIC to total mass was only 2 % in PM2.5
and 1.7% in PM10. WSOC was high during PD1 and PD2 days and WSIC was high during dust and PD1 days. ACKNOWLEDGEMENTS
We sincerely acknowledge the financial support received from ISRO-GBP/AT-CTM Programme for carrying out our research work. The authors gratefully acknowledge the MODIS for fire count, NOAA Air Resources Laboratory (ARL) for the provision of the HYSPLIT transport and dispersion model and READY website (http://ready.arl. noaa.gov) used in this publication. We would also like to convey our sincere thanks to anonymous peer reviewers and journal editor. REFERENCES Alexander, B., Park, R.J., Jacob, D.J., Li, Q.B., Yantosca,
R.M., Savarino, J., Lee, C.C.W. and Thiemens, M.H. (2005). Sulfate Formation in Sea-salt Aerosols: Constraints from Oxygen Isotopes. J. Geophys. Res. 1984–2012: 110.
Behera, S.N. and Sharma, M. (2010). Reconstructing Primary and Secondary Components of PM2.5 Composition for an Urban Atmosphere. Aerosol Sci. Technol. 44: 983–992.
Chakraborty, A. and Gupta, T. (2010). Chemical Characterization and Source Apportionment of Submicron (PM1) Aerosol in Kanpur Region, India. Aerosol Air Qual. Res. 10: 433–445.
Cheng, T., Lu, D., Wang, G.and Xu, Y. (2005). Chemical Characteristics of Asian Dust Aerosol from Hunshan Dake Sandland in Northern China. Atmos. Environ. 39: 2903–2911.
Chinnam, N., Dey, S., Tripathi, S.N. and Sharma, M. (2006). Dust Events in Kanpur, Northern India: Chemical Evidence for Source and Implications to Radiative Forcing. Geophys. Res. Lett. 33: L08803.
Councell, T.B., Duckenfield, K.U., Landa, E.R. and Callender, E. (2004). Tire-Wear Particles as a Source of Zinc to the Environment. Environ. Sci. Technol. 38: 4206–4214.
Deshmukh, D.K., Deb, M.K., Tsai, Y.I. and Mkoma, S.L. (2011). Water Soluble Ions in PM2.5 and PM1Aerosols in
Ghosh et al., Aerosol and Air Quality Research, 14: 879–891, 2014 890
Durg City, Chhattisgarh, India. Aerosol Air Qual. Res. 11: 696–708.
Dey, S., Tripathi, S.N., Singh, R.P. and Holben, B. (2004). Influence of Dust Storms on the Aerosol Optical Properties Over the IndoGangetic Basin. J. Geophys. Res. 1984–2012: 109.
Draxler, R. and Rolph, G. (2003). HYSPLIT (HYbrid Single-Particle Lagrangian Integrated Trajectory) Model Access via NOAA ARL READY Website (http://www. arl. noaa. gov/ready/hysplit4. html). NOAA Air Resources Laboratory, Silver Spring: Md.
Echalar, F., Gaudichet, A., Cachier, H. and Artaxo, P. (1995). Aerosol Emissions by Tropical Forest and Savanna Biomass Burning: Characteristic Trace Elements and Fluxes. Geophys. Res. Lett. 22: 3039–3042.
Gangwar, J.N., Gupta, T. and Agarwal, A.K. (2012). Composition and Comparative Toxicity of Particulate Matter Emitted from a Diesel and Biodiesel Fuelled CRDI Engine. Atmos. Environ. 46: 472–481.
Griffin, D.W. and Kellogg, C.A. (2004). Dust Storms and Their Impact on Ocean and Human Health: Dust in Earth’s Atmosphere. EcoHealth 1: 284–295.
Gulyaeva, A., Ilchenko, T., Kuznetsov, V. and Simashko, V. (1972). Determination of the Zinc Content in Hydrocarbon Lubricants: DTIC Document.
Gupta, T. and Mandariya, A. (2013). Sources of Submicron Aerosol during Fog-Dominated Wintertime at Kanpur. Environ. Sci. Pollut. Res. 20: 5615–5629.
Kang, C.M., Gupta, T., Ruiz, P.A., Wolfson, J.M., Ferguson, S.T., Lawrence, J.E., Rohr, A.C., Godleski, J. and Koutrakis, P. (2011). Aged Particles Derived from Emissions of Coal-Fired Power Plants: The TERESA Field Results. Inhalation Toxicol. 23: 11–30.
Kaul, D.S., Gupta, T., Tripathi, S.N., Tare, V. and Collett, J.L. (2011). Secondary Organic Aerosol: A Comparison between Foggy and Nonfoggy Days. Environ. Sci. Technol. 45: 7307–7313.
Kaul, D.S., Gupta, T. and Tripathi, S.N. (2012). Chemical and Microphysical Properties of the Aerosol during Foggy and Nonfoggy Episodes: A Relationship between Organic and Inorganic Content of the Aerosol. Atmos. Chem. Phys. Discuss. 12: 14483–14524.
Khare, P., Baruah, B. and Rao, P. (2011). WaterSoluble Organic Compounds (WSOCs) in PM2. 5 and PM10 at a Subtropical Site of India. Tellus Ser. B 63: 990–1000.
Kim, K.W., Kim, Y.J. and Oh, S.J. (2001). Visibility Impairment during Yellow Sand Periods in the Urban Atmosphere of Kwangju, Korea. Atmos. Environ. 35: 5157–5167.
Kim, N.D. and Fergusson, J.E. (1994). The Concentrations, Distribution and Sources of Cadmium, Copper, Lead and Zinc in the Atmosphere of an Urban Environment. Sci. Total Environ. 144: 179–189.
Kulshrestha, U.C., Raman, R.S., Kulshrestha, M.J., Rao, T. and Hazarika, P.J. (2009). Secondary Aerosol Formation and Identification of Regional Source Locations by PSCF Analysis in the Indo-Gangetic Region of India. J. Atmos.Chem. 63: 33–47.
Kumar, A. and Sarin, M. (2009). Mineral aerosols from Western India: Temporal Variability of Coarse and Fine Atmospheric Dust and Elemental Characteristics. Atmos. Environ. 43: 4005–4013.
Kumar, A. and Sarin, M. (2010). Atmospheric Water-Soluble Constituents in Fine and Coarse Mode Aerosols from High-Altitude Site in Western India: Long-Range Transport and Seasonal Variability. Atmos. Environ. 44: 1245–1254.
Li, J., Pósfai, M., Hobbs, P.V. and Buseck, P.R. (2003). Individual Aerosol Particles from Biomass Burning in Southern Africa: 2, Compositions and Aging of Inorganic Particles. J. Geophys. Res. 1984–2012: 108.
Lowenthal, D.H., Wunschel, K.R. and Rahn, K.A. (1988). Tests of Regional Elemental Tracers of Pollution Aerosols. 1. Distinctness of Regional Signatures, Stability during Transport, and Empirical Validation. Environ. Sci. Technol. 22: 413–420.
Mamane, Y. and Gottlieb, J. (1992). Nitrate Formation on Sea-Salt and Mineral Particles—ASingle Particle Approach. Atmos. Environ. 26(9): 1763–1769.
Mamane, Y. and Pirrone, N. (1998). Vanadium in the Atmosphere. Adv. Environ. Sci. Technol. 30: 37–72.
Mishra, S., Tripathi, S., Aggarwal, S.G. and Arola, A. (2012). Optical Properties of Accumulation Mode, Polluted Mineral Dust: Effects of Particle Shape, Hematite Content and Semi-External Mixing with Carbonaceous Species. Tellus Ser. B 64: 19–25.
Misra, A., Gaur, A., Bhattu, D., Ghosh, S., Dwivedi, A., Dalai, R., Paul, D., Gupta, T., Tare, V., Singh, S., Eck, T., Welton, E., Holben, B., Tripathi, S.N. and Mishra, S. (2013). Characterization of Dust over the Indo-Gangetic Basin Based on Physical, Chemical, Optical, Morphological, and Mineralogical Measurements: An Overview, (Manuscript under Preparation).
Pathak, R.K., Wang, T., Ho, K. and Lee, S. (2011). Characteristics of Summertime PM2.5 Organic and Elemental Carbon in Four Major Chinese Cities: Implications of High Acidity for Water-Soluble Organic Carbon (WSOC). Atmos. Environ. 45: 318–325.
Ram, K., Sarin, M. and Tripathi, S. (2010). A 1 year Record of Carbonaceous Aerosols from an Urban Site in the IndoGangetic Plain: Characterization, Sources, and Temporal Variability. J. Geophys. Res. 1984–2012: 115.
Ram, K. and Sarin, M. (2011). Day-Night Variability of EC, OC, WSOC and Inorganic Ions in Urban Environment of Indo-Gangetic Plain: Implications to Secondary Aerosol Formation. Atmos. Environ. 45: 460–468.
Ranville, M.A., Cutter, G.A., Buck, C.S., Landing, W.M., Cutter, L.S., Resing, J.A. and Flegal, A.R. (2010). Aeolian Contamination of Se and Ag in the North Pacific from Asian Fossil Fuel Combustion. Environ. Sci. Technol. 44: 1587–1593.
Rastogi, N. and Sarin, M. (2009). Quantitative Chemical Composition and Characteristics of Aerosols over Western India: One-year Record of Temporal Variability. Atmos. Environ. 43: 3481–3488.
Rudnick, R. and Gao, S. (2003). Composition of the Continental Crust. Treat. Geochem. 3: 1–64.
Ghosh et al., Aerosol and Air Quality Research, 14: 879–891, 2014 891
Sanghi, R. and Sasi, K. (2001). Pesticides and Heavy Metals in Agricultural Soil of Kanpur, India. Bull. Environ. Contam. Toxicol. 67: 0446–0454.
Seinfeld, J.H. and Pandis, S.N. (2012). Atmospheric Chemistry and Physics, John Wiley and Sons.
Tabazadeh, A., Jacobson, M., Singh, H., Toon, O., Lin, J., Chatfield, R., Thakur, A., Talbot, R. and Dibb, J. (1998). Nitric Acid Scavenging by Mineral and Biomass Burning Aerosols. Geophys. Res. Lett. 25: 4185–4188.
Taylor, S., McLennan, S., Armstrong, R. and Tarney, J. (1981). The Composition and Evolution of the Continental Crust: Rare Earth Element Evidence from Sedimentary Rocks. Philos. Trans. R. Soc. London, Ser. A 301: 381–399.
Timonen, H., Saarikoski, S., Tolonen-Kivimaki, O., Aurela, M., Saarnio, K., Kulmala, M., Pakkanen, T. and Hillamo, R. (2008). Size Distributions, Sources and Source Areas of Water-soluble Organic Carbon in Urban Background Air. Atmos. Chem. Phys. 8: 5635–5647.
Usher, C.R., Michel, A.E. and Grassian, V.H. (2003). Reactions on Mineral Dust. Chem. Rev. 103: 4883–4940.
Viana, M., Chi, X., Maenhaut, W., Querol, X., Alastuey, A., Mikuška, P. and Večeřa, Z. (2006). Organic and Elemental Carbon Concentrations in Carbonaceous Aerosols during Summer and Winter Sampling Campaigns in Barcelona, Spain. Atmos. Environ. 40: 2180–2193.
Wang, X., Sato, T. and Xing, B. (2006). Size Distribution and Anthropogenic Sources Apportionment of Airborne
Trace Metals in Kanazawa, Japan. Chemosphere 65: 2440–2448.
Wang, Y., Zhuang, G., Zhang, X., Huang, K., Xu, C., Tang, A., Chen, J. and An, Z. (2006). The Ion Chemistry, Seasonal Cycle, and Sources of PM2.5 and TSP Aerosol in Shanghai. Atmos. Environ. 40: 2935–2952.
Wolff, G.T. (1984). On the Nature of Nitrate in Coarse Continental Aerosols. Atmos. Environ. 18: 977–981.
Yuan, H., Zhuang, G., Li, J., Wang, Z. and Li, J. (2008). Mixing of Mineral with Pollution Aerosols in Dust Season in Beijing: Revealed by Source Apportionment Study. Atmos. Environ. 42: 2141–2157.
Zhang, H., McFarquhar, G.M., Saleeby, S.M.and Cotton, W.R. (2007). Impacts of Saharan Dust as CCN on the Evolution of an Idealized Tropical Cyclone. Geophys. Res. Lett. 34: 14–16.
Zhang, R., Shen, Z., Cheng, T., Zhang, M. and Liu, Y. (2010). The Elemental Composition of Atmospheric Particles at Beijing during Asian Dust Events in Spring 2004. Aerosol Air Qual. Res. 10: 67–75.
Zhao, J., Zhang, F., Xu, Y. and Chen, J. (2011). Characterization of Water-Soluble Inorganic Ions in Size-Segregated Aerosols in Coastal City, Xiamen. Atmos. Res. 99: 546–562.
Received for review, July 16, 2013 Accepted, November 15, 2013