Page 1
CHEMICAL CONCERNTRATION CALCULATION BASED ON
SPECTROGRAM
SITI NUR AISHAH BINTI AHMAD SHAH
Thesis submitted in fulfillment of the requirements
To the award of the degree of
Bachelor of Electrical Engineering (Electronics)
Faculty of Electrical Engineering
UNIVERSITI MALAYSIA PAHANG
MAY 2012
Page 2
vi
ABSTRACT
In this project, the chemical concentration identified based on spectrogram.
In chemistry, concentration is defined as the abundance of a constituent divided by
the total volume of a mixture. The term concentration can be applied to any kind of
chemical mixture, but most frequently it refers to solutes in homogeneous solutions.
Meanwhile, spectrogram is a time-varying spectral representation (forming an image
of graph) that shows how the spectral density of a signal varies with time. It is an
instrument used to measure properties of light over a specific portion of the
electromagnetic spectrum, typically used in spectroscopic analysis to identify
materials. The purpose of this project was to develop the systems that can identify
the concentration of a compound by using spectrogram. Using MATLAB, the
chemical concentration can calculated based on the compound of the solution. By
using Acrylic acid as an example; which the simplest unsaturated carboxylic acid
which has double bond and carboxyl group in C3 one molecule with the formula
CH2=CHCOOH, we can determine the concentration percentages of the compound
that form acrylic acid. Based on the graph that plotted by using MATLAB, the area
under graph calculate. With the area, we can calculate the concentration directly
based on the data from HPLC-high performance liquid chromatography.
Page 3
vii
ABSTRAK
Dalam projek ini, kepekatan bahan kimia dikenalpasti melalui spektrogram.
Dalam bidang kimia, kepekatan ditakrifkan sebagai konstituen yang dibahagikan
dengan jumlah keseluruhan campuran yang banyak. Istilah kepekatan boleh
digunakan untuk apa-apa jenis campuran kimia, tetapi yang paling kerap ia merujuk
kepada bahan larut dalam penyelesaian homogen. Sementara itu, spectrogram
mewakili perubahan yang berkaitan dengan masa spektrum(menbentuk graf) yang
menunjukkan bagaimana isyarat ketumpatan spektrum berubah dengan masa. Ia
merupakan instrumen yang digunakan untuk mengukur sifat cahaya yang mana
sebahagian daripada spektrum electromagnet, biasanya digunakan dalam analisis
spektroskopi untuk mengenal pasti bahan-bahan tertentu. Tujuan projek ini adalah
untuk membangunkan sistem yang boleh mengenalpasti kepekatan sebatian dengan
menggunakan spektrogram. Mengunakkan MATLAB, kepekatan kimia boleh dikira
berdasarkan perkarangan penyelesaian. Dengan menggunakan asid akrilik sebagai
contoh, yang mana asid tak tepu yang paling mudah karboksilik yang mempunyai
ikatan kembar dan kumpulan carboxyl dalam C3 satu molekul dengan formula
CH2=CHCOOH, boleh ditentukan peratusan kepekatan sebatian adalah asid akrilik.
Berdasarkan graf yang di plotkan menggunakan perisian MATLAB, luas dibawah
graf dikira. Menggunakan luas kawasan tersebut, kepekatan boleh dikira secara
langsung berdasarkan data daripada HPLC-kromatografi pretasi tinggi cecair.
Page 4
viii
TABLE OF CONTENTS
PAGE
TITLE PAGE i
SUPERVISOR’S DECLARATION ii
STUDENT’S DECLARATION iii
DEDICATION iv
ACKNOWLEDGEMENTS v
ABSTRACT vi
ABSTRAK vii
TABLE OF CONTENTS viii
LIST OF TABLES ix
LIST OF FIGURES xi
LIST OF GRAPHS xii
Page 5
ix
CHAPTER TITLE
1 INTRODUCTION
1.1 Introduction
1.1.1 Spectrogram 2
1.1.2 Image Processing 3
1.1.3 HPLC-High Performance Liquid Chromatography 4
1.2 Problem Statement 5
1.3 Project Objectives 5
1.4 Scopes of Project 6
1.5 Expected Result 6
2 LITERATURE REVIEW
2.1 Concentration 7
2.2 Spectrogram 8
2.3 High Performance Liquid Chromatography-HPLC 8
2.4 UV/Vis Spectroscopy 9
2.5 Fourier Transforms Infrared Spectroscopy (FTIR) 10
2.6 Image Processing 11
3 METHODOLOGY
3.0 Introduction 12
3.1 Data Collection 13
3.2 plotting Graph 14
3.3 Area 15
3.4 Concentration 16
Page 6
x
4 RESULT AND DISCUSSION
4.0 Introduction 17
4.1 Results data 1-10 Acrylic Acid, C3H4O2 18
4.2 results data 11-15 formic acid, CH2O2 28
4.3 Discussions 33
5 CONCLUSION 36
6 RECOMMENDATION 39
REFERENCES 40
APPENDIX 41
Page 7
xi
LIST OF FIGURES
FIGURE NO. TITLES PAGE
3.1 Flow Chart for Method of Experiment 12
3.2 Hplc-High Performance Liquid Chromatography 14
3.3 New Graph Based On the Data 15
4.3 Examples of Area Manual Calculation 34
Page 8
xii
LIST OF GRAPHS
FIGURE NO. TITLES
PAGE
4.1.2 Graph Data 1 18
4.1.4 Graph Data 2 19
4.1.6 Graph Data 3 20
4.1.8 Graph Data 4 21
4.1.10 Graph Data 5 22
4.1.12 Graph Data 6 23
4.1.14 Graph Data 7 24
4.1.16 Graph Data 8 25
4.1.18 Graph Data 9 26
4.1.20 Graph Data 10 27
4.2.2 Graph Data 11 28
4.2.4 Graph Data 12 29
4.2.6 Graph Data 13 30
4.2.8 Graph Data 14 31
4.2.10 Graph Data15 32
Page 9
xiii
CHAPTER 1
INTRODUCTION
1.1 Introduction
Nowadays, there are so many chemical compounds that can be harm to us
such as Chlorofluorocarbon (CFC) if the amount of it’s become higher. But, there are
certain compounds useful in production fields. The compound are combined with
others type of chemical elements. It’s also has their own concentration which we can
calculate by using formula based on theory values. Concentration is defined as the
abundance of constituent divided by the total volume of mixture. By the way to
calculate the concentration, the method used before need a long time for verified the
values that we want to have in the solutions. There are some devices that can help
verified this unknown chemical solution. Based on the result from those devices, the
data calculated by substitutes the values in that standard formula. In others sides,
There are others method that can be used for calculated the concentration of the
chemical compounds using spectrogram.
Page 10
xiv
1.1.1 Spectrogram
Spectrogram is a time-varying spectral representation (forming an image).
There are many devices that can produces this images in differences types of graph.
The most common format is a graph with two geometric dimensions: the horizontal
axis represents time, the vertical axis is frequency; a third dimensin indicating the
amplitude of a particular frequency at a particular time is represented by the intensity
or colour of each point in the image. The devices which are can form this types of
signal are HPLC- High Performance Liquid Chromotography, UV-
VIS(spectrophotometer), mass spectrometry and FTIR-fourier transform infrared
spectrocopy. In this poject, data from HPLC- High Performance Liquid
Chromotography has been used for calculate the concentration of the solution.
Page 11
xv
1.1.2 Image Processing
Image processing is including image segmentation and it is crucially
significant for the successfulness recognition of the image, it is still a dream for the
computer to outperform human natural ability for visual interpretation, and thus
feature extraction still remains a challenging task in various realms of computer
vision and image analysis. There an image segmentation based on color texture
measurements, texture is one of most popular features for image classification and
retrieval. For as much as grayscale textures provide enough information to solve
many tasks, the color information was not utilized. But in the recent years, many
researchers have begun to take color information into consideration. Color Texture
analysis plays an increasingly important role in computer vision. Since the color
textural properties of images appear to carry useful information for discrimination
purposes, it is important to develop significant features of color textures.
Page 12
xvi
1.1.3 HPLC-high performance liquid chromatography
HPLC is a separation technique that involves the placement(injection of a
small volume of liquid sample into a tube packed with porous particles(stationary
phase), where individual components of teh sample are transported along the packed
tube column by liquid moved by gravity. HPLC typically utilizes different types of
stationary phases (i.e. sorbents) contained in columns, a pump that moves the mobile
phase and sample components through the column, and a detector capable of
providing characteristic retention times for the sample components and area counts
reflecting the amount of each analyte passing through the detector. Analyte retention
time varies depending on the strength of its interactions with the stationary phase, the
composition and flow rate of mobile phase used, and on the column dimensions.
HPLC is a form of liquid chromatography that utilizes small size columns (typically
250 mm or shorter and 4.6 mm i.d. or smaller; packed with smaller particles), and
higher mobile phase pressures compared to ordinary liquid chromatography.
With HPLC, a pump (rather than gravity) provides the higher pressure
required to move the mobile phase and sample components through the densely
packed column. The increased density arises from the use of smaller sorbent
particles. Such particles are capable of providing better separation on columns of
shorter length when compared to ordinary column chromatography.
Page 13
xvii
1.2 Problem Statements
In this project, the solution are called “unknown solution” has been used to
determined the concentration. The types of solution are acrylic acid and formic acid
solutions. Its concentration determined based on the result displayed on HPLC- High
Performance Liquid Chromotography screen data. Then, by using the result, that will
be identified using MATLAB software by observe the image to calculate the
concentration of the solution. This method provided the faster ways to calculate the
concentrations of the solution.
1.3 Project Objectives
The objectives of this project are:
I. To understand how the devices of HPLC can gives the result of
spectrogram types.
II. To applied the knowledge of MATLAB in creating coding. So, can
determine the concentration based on the images from the data of HPLC.
III. To calculate the chemical concentration based on spectrogram.
Page 14
xviii
1.4 Scope of Project
To achieve the project objectives, some analysis are done. There is a study on
how the HPLC-High Performance Liquid Chromatography, works and how to get the
pure result of graph since there are a specified software that can only read the file of
the data. This research done by using hardcopy of the result from HPLC data which
can be used to plot others graph that can read by MATLAB software. Then, the
structure of a compound can determine by observing its fragmentation especially on
the bonding of the chemical compounds. Next, for this project, the types of solution
are acrylic acid and formic acid which can be used using HPLC. This solution
doesn’t a pure acid since it need to go through dilute stage by dilute solution which
decide before the experiment is done.
a) CH2=CHCOOH- acrylic acid formula
b) CH2O2 – formic acid formula
1.5 Expected Result
The expected results from this project are to obtain the concentration of the
solution based on the area of the plotted data from HPLC using MATLAB code.
Besides that, the calculation doesn’t need to take long time since the data from HPLC
can copy and paste to excel file. Then, the data read by MATLAB code and start
calculated based on the formula given. The values are compared with calculated
values by manual and theory concentrations. Mostly, the concentration is low since
this solution is for students experiment and it’s a part of safety.
Page 15
xix
CHAPTER 2
LITERATURE REVIEWS
2.1 Concentration
In chemistry, concentration is defined as the abundance of a constituent
divided by the total volume of a mixture. Four types can be distinguished: mass
concentration, molar concentration, number concentration, and volume
concentration. The term concentration can be applied to any kind of chemical
mixture, but most frequently it refers to solutes in homogeneous solutions [1]. A
negative concentration value indicates that the sample was analyzed but that the
concentration was below the determination limits of the analytical method. All
instrumental methods for analyzing the concentrations of various elements in
sediments, waters, rocks, or plants have lower determination limits. Concentrations
below this lower determination limit are too small to be detected by the method. For
example, one of the Oak Ridge Multielement Emission Spectrochemical Analysis
methods could not detect concentrations of silver (Ag) that were less than 2 parts-
Page 16
xx
per-million (ppm). When the analytical method determined that a sample contained
less than 2 ppm Ag, a value of "-2" was recorded in the Ag_ppm field.
Unfortunately, we don't know if that means that the sample contains 1.8 ppm Ag or
0.0001 ppm Ag. The best that can be said is that the concentration is <2 ppm Ag.
Some analytical methods record different negative numbers for an element in
successive samples [2].
2.2 Spectrogram
Spectrogram is a time-varying spectral representation (forming an image) that
shows how the spectral density of a signal varies with time [3]. There are many
devices that can produces this images in differences types of graph. The devices
which are can form this types of signal are HPLC- High Performance Liquid
Chromatography, UV-VIS(spectrophotometer), mass spectrometry and FTIR-Fourier
transform infrared spectroscopy.
2.3 High Performance Liquid Chromatography-HPLC
HPLC is basically a highly improved form of column chromatography.
Instead of a solvent being allowed to drip through a column under gravity, it is
forced through under high pressures of up to 400 atmospheres. That makes it much
Page 17
xxi
faster. It also allows you to use a very much smaller particle size for the column
packing material which gives a much greater surface area for interactions between
the stationary phase and the molecules flowing past it. This allows a much better
separation of the components of the mixture [4].The principles of Chromatography is
a technique by which a mixture sample is separated into components. Although
originally intended to separate and recover (isolate and purify) the components of a
sample, today, complete chromatography systems are often used to both separate and
quantify sample components. The term, “chromatography" was coined by the
Russian botanist, Tswett, who demonstrated that, when a plant extract was carried by
petroleum ether through a column consisting of a glass tube packed with calcium
carbonate powder, a number of dyes were separated, as shown in Figure 1. He named
this analysis method "Chromatographie" after "chroma" and "graphos", which are
Greek words meaning "color" and “to draw," respectively[5].
2.4 UV/Vis Spectroscopy
UV/Vis spectroscopy is routinely used in analytical chemistry for quantitative
determination of different analytic, such as ion, compounds, and biological
macromolecules. Spectroscopic analysis is commonly carried out in solutions but
solids and gases may also be studied [6]. Solutions of transition metal ions can be
colored (i.e., absorb visible light) because d electrons within the metal atoms can be
excited from one electronic state to another. The color of metal ion solutions is
strongly affected by the presence of other species, such as certain anions [6]. Mass
Page 18
xxii
spectrometry (MS) is an analytical technique that measures the mass-to-charge
ratio of charged particles. It is used for determining masses of particles, for
determining the elemental composition of a sample or molecule, and for elucidating
the chemical structures of molecules, such as peptides and other chemical
compounds [7]. The combination of a mass spectrometer and a gas chromatograph
makes a powerful tool for the detection of trace quantities of contaminants or toxins.
A number of satellites and spacecraft have mass spectrometers for the identification
of the small numbers of particles intercepted in space. Mass spectrometers are used
for the analysis of residual gases in high vacuum systems. An atom probe is an
instrument that combines time-of-flight mass spectrometry and field ion microscopy
to map the location of individual atoms [8].
2.5 Fourier transforms infrared spectroscopy (FTIR)
Fourier transform infrared spectroscopy (FTIR) is a technique which is used
to obtain an infrared spectrum of absorption, emission, photoconductivity of a solid,
liquid or gas. An FTIR spectrometer simultaneously collects spectral data in a wide
spectral range. This confers a significant advantage over a spectrometer which
measures intensity over a narrow range of wavelengths at a time [9].
Page 19
xxiii
2.6 Image Processing
An image processing is any form of signal processing for which the input is
an image, such as a photograph or video frame. The output of image processing may
be either an image or a set of characteristics or parameters related to the image. Most
image processing techniques involves treating the image as two dimensional signals
and applying standard signal processing techniques to it. Recently, a lot of works was
done by depending on the computer, in order to let the processing time to be reduced
and to provide more results that are accurate, for example depending on different
types of data such as digital image and characters and digits. In order to automate
systems that deal with numbers such as fingerprint verification, face recognition, iris
discrimination, chromosome shape discrimination, optical character recognition,
texture discrimination, and speech recognition. Digital image recognition has been
extremely found and studied. Various approaches in image processing and pattern
recognition have been developed by scientists and engineers to solve this problem
(Al Omari, 2009)[10].
Page 20
xxiv
CHAPTER 3
METHODOLOGY
3.0 Introduction
FIGURE 3.1: Flow chart for method and instructions use in this project
1- TAKE THE SOLUTION AND PUT IT IN THE EXPERIMENT
DEVICES (HPLC)
2- CALIBRATE AND SEE THE RESULT (APPEAR ON THE
SCREEN).
3- IDENTIFY THE PEAK OF THE SOLUTIONS-CREATE CODE IN
MATLAB
5- DETERMINE THE CONCENTRATION ON CHEMICAL
COMPOUND
4-DETERMINE THE RELATE EQUATION OF CHEMICAL
COMPOUND BASED ON THE CALIBRATION SHEET.
Page 21
xxv
Based on the flow chart above, the first step of calculate the concentration by
using spectrogram are by taking the unknown solution which we does not know the
concentration of chemical used. Then, put it in the experiment equipments (HPLC-
High Performance Liquid Chromatography). Adjust the devices for not given any
error when the measurements are done. Next, calibrate the device and the results of
the signal appear on the screen. Then, see the peak of signal for determined what
kind of chemical elements exist in that solution. Based on the signal shown, we can
identify concentration of every compound in solution used. That because, different
compound give different values of concentration. By referring to these values, we
can determine the compound. Then, after the results of the spectrum of every
compound got, we use those results for determined the concentration of that
compounds. Lastly, we also can identify the chemical elements existing in the
solution we use. Continuing with step before, by using the signal and MATLAB
software, create a code to calculates the concentration using the calibration theory
based on the area of the peak signal. For getting the signal, it needs to plot graph
using the data from HPLC and the area of the graph calculated. Next, using the area
of the graph, the concentration calculated by substitute the values directly into
formula. Lastly, the concentration of the solution determined.
3.1 data collection
At this time of measurement are using acrylic acid, C3H4O2 and formic acid,
CH2O2 as the solution of the research. For acrylic acid, there are 10 different of
unknown concentration are used. Then, for formic acid, there are 5 different of
unknown concentration used. Both solutions indicate using HPLC.
Page 22
xxvi
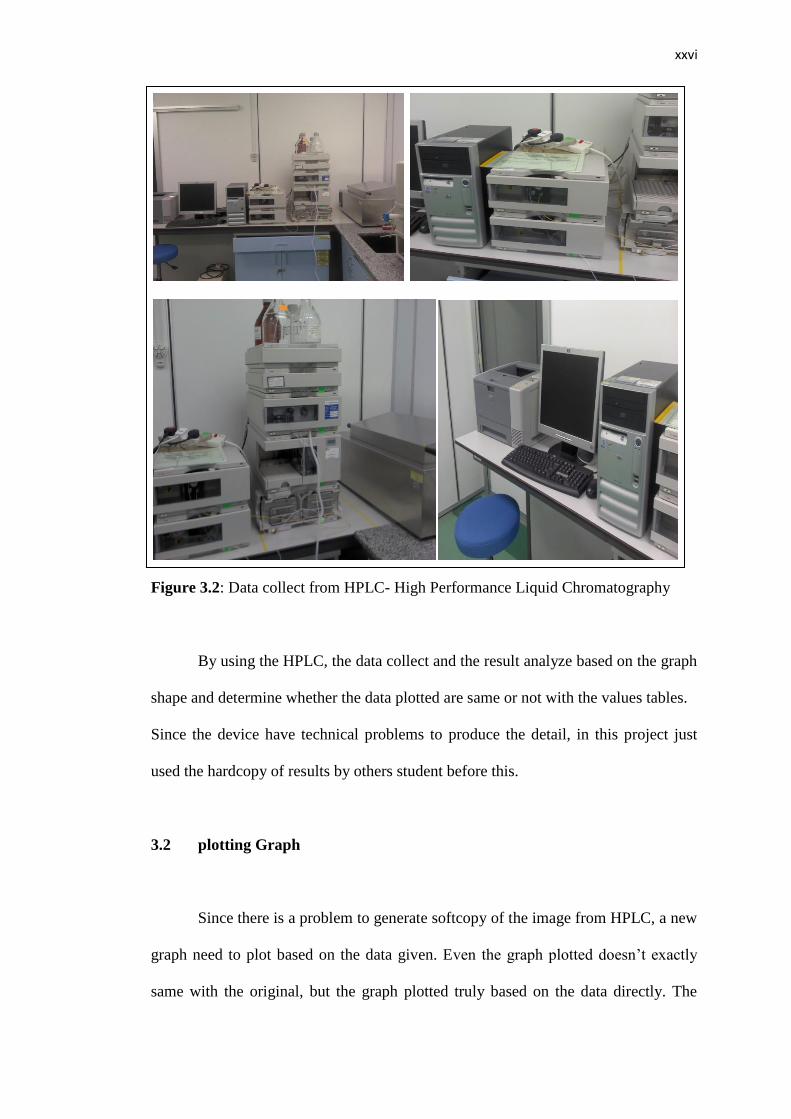
Figure 3.2: Data collect from HPLC- High Performance Liquid Chromatography
By using the HPLC, the data collect and the result analyze based on the graph
shape and determine whether the data plotted are same or not with the values tables.
Since the device have technical problems to produce the detail, in this project just
used the hardcopy of results by others student before this.
3.2 plotting Graph
Since there is a problem to generate softcopy of the image from HPLC, a new
graph need to plot based on the data given. Even the graph plotted doesn’t exactly
same with the original, but the graph plotted truly based on the data directly. The
Page 23
xxvii
data write in excel file. There was no graph paper or manual calculation, just using
technology application which is can be done by using MATLAB software code.
For plot a graph (figure 3):
Code:
y= xlsread('data1.xlsx','y=mAU') x= xlsread('data1.xlsx','x=time(m)')
plot(x,y) grid minor
Figure 3.3- new graph plotted by using data
3.3 Area
Next step, using other code of MATLAB, determined the area under the
graph. For area under graph, code trapz(x,y) are used. It’s doesn’t means the graph
shape are trapezoid. Trapz(x,y) code is computes an approximation of the integral of
Y via the trapezoidal method (with unit spacing). To compute the integral for spacing
other than one, multiply Z by the spacing increment. Input Y can be complex.
Page 24
xxviii
The codes are:
AUC=trapz(x,y)
title('Amount Of Concentration','fontweight','bold') xlabel('time(m)'); ylabel('amount,height(mAU)')
3.4 Concentration
Basically, from theoritical values of concentration of acrylic acid, C3H4O2 is
between range 10-0.1 mg/l and formic acid, CH2O2 is 8.518 g/l. By using the code
from MATLAB, the concentation calculated are between range and lower. Although
the concentration are lower, but, the hazardous still exist to human exspecially to
whow who not pay attention to safety when handling this types of solution.
The code is:
m=13.03438 %y=mx+c c=139.94412 % x(concentration)=AUC-c/m
z=(AUC-c)/m %concentration of arcylic acid %unit for concentration= ng/ul, n=10^-9
m=13.03438 %y=mx+c c=139.94412 % x(concentration)=AUC-c/m
z=(AUC-c)/m %concentration of formic acid %unit for concentration= ng/ul, n=10^-9