Effect of geometry on the mechanisms for off-bottom solids suspension in a stirred tank Inci Ayranci a,n , Ma ´ rcio B. Machado a , Adam M. Madej b , Jos J. Derksen a , David S. Nobes b , Suzanne M. Kresta a a Department of Chemical and Materials Engineering, University of Alberta, Edmonton, Alberta, Canada T6G 2V4 b Department of Mechanical Engineering, University of Alberta, Edmonton, Alberta, Canada T6G 2G8 GRAPHICAL ABSTRACT HIGHLIGHTS c Some combination of mean flow and turbulent eddies provides solids suspension in stirred tanks. c The solids suspension mechanism changes when the impeller geometry is changed. c For a T/3 impeller the dominant mechanism is the turbulence. For a T/2 impeller, neither the turbulence nor the mean flow dominates, but both play a role. c The T/3 impeller is more energy efficient, possibly because a single mechanism dominates. article info Article history: Received 23 January 2012 Received in revised form 28 April 2012 Accepted 18 May 2012 Available online 30 May 2012 Keywords: Solids suspension mechanisms Multiphase flow Turbulence Mean flow Impeller diameter Mixing abstract This paper probes solids suspension mechanisms in stirred tanks. The hypothesis is that at the point where solids are just suspended a critical flow condition exists close to the bottom of the tank for a fixed solids content and similar geometries. The critical flow condition may be dominated by the turbulence or by the mean flow. Two Lightnin A310 impellers with diameters of D ¼T/3 and D ¼T/2 were tested at varying off-bottom clearances. The mean and the turbulent fluctuating velocities close to the bottom of the tank were determined using both PIV and LES. The results showed that the mechanism of solids suspension is different for the two impeller diameters. Turbulence is the dominant mechanism for the T/3 impeller. For the T/2 impeller some combination of turbulence and mean flow is required. A comparison between the two impeller diameters in terms of power consumption suggests that solids suspension is more efficient when the turbulence mechanism dominates. & 2012 Elsevier Ltd. All rights reserved. 1. Introduction Complete off-bottom suspension is the most common process requirement for solid–liquid mixing. The impeller speed at this condition is called the just suspended speed (N js ), and is defined as the impeller speed at which no particles remain stationary at the bottom of the tank for more than one or two seconds (Zwietering, 1958). Using this criterion Zwietering proposed a correlation for N js : N js ¼ S gðr S r L Þ r L 0:45 X 0:13 d 0:2 p n 0:1 D 0:85 ð1Þ Many later papers provided measurements and tested other correlations for N js (Nienow, 1968; Baldi et al., 1978; Armenante et al., 1998), but the Zwietering correlation is still the most widely Contents lists available at SciVerse ScienceDirect journal homepage: www.elsevier.com/locate/ces Chemical Engineering Science 0009-2509/$ - see front matter & 2012 Elsevier Ltd. All rights reserved. http://dx.doi.org/10.1016/j.ces.2012.05.028 n Correspondence to: Department of Chemical and Materials Engineering, University of Alberta, 7th Floor ECERF, 9107-116 Street, Edmonton, Alberta, Canada T6G 2V4. Tel.: þ1 780 492 9221; fax: þ1 780 492 2881. E-mail address: [email protected] (I. Ayranci). Chemical Engineering Science 79 (2012) 163–176
Transcript
Chemical Engineering Science 79 (2012) 163–176
Contents lists available at SciVerse ScienceDirect
Chemical Engineering Science
0009-25
http://d
n Corr
Univers
Canada
E-m
journal homepage: www.elsevier.com/locate/ces
Effect of geometry on the mechanisms for off-bottom solids suspensionin a stirred tank
Inci Ayranci a,n, Marcio B. Machado a, Adam M. Madej b, Jos J. Derksen a,David S. Nobes b, Suzanne M. Kresta a
a Department of Chemical and Materials Engineering, University of Alberta, Edmonton, Alberta, Canada T6G 2V4b Department of Mechanical Engineering, University of Alberta, Edmonton, Alberta, Canada T6G 2G8
c Some combination of mean flow and turbulent eddies provides solids suspension in stirred tanks.c The solids suspension mechanism changes when the impeller geometry is changed.c For a T/3 impeller the dominant mechanism is the turbulence. For a T/2 impeller, neither the
turbulence nor the mean flow dominates, but both play a role.c The T/3 impeller is more energy efficient, possibly because a single mechanism dominates.
a r t i c l e i n f o
Article history:
Received 23 January 2012
Received in revised form
28 April 2012
Accepted 18 May 2012Available online 30 May 2012
Keywords:
Solids suspension mechanisms
Multiphase flow
Turbulence
Mean flow
Impeller diameter
Mixing
a b s t r a c t
This paper probes solids suspension mechanisms in stirred tanks. The hypothesis is that at the point
where solids are just suspended a critical flow condition exists close to the bottom of the tank for a
fixed solids content and similar geometries. The critical flow condition may be dominated by the
turbulence or by the mean flow. Two Lightnin A310 impellers with diameters of D¼T/3 and D¼T/2
were tested at varying off-bottom clearances. The mean and the turbulent fluctuating velocities close to
the bottom of the tank were determined using both PIV and LES. The results showed that the
mechanism of solids suspension is different for the two impeller diameters. Turbulence is the dominant
mechanism for the T/3 impeller. For the T/2 impeller some combination of turbulence and mean flow is
required. A comparison between the two impeller diameters in terms of power consumption suggests
that solids suspension is more efficient when the turbulence mechanism dominates.
& 2012 Elsevier Ltd. All rights reserved.
1. Introduction
Complete off-bottom suspension is the most common processrequirement for solid–liquid mixing. The impeller speed at thiscondition is called the just suspended speed (Njs), and is defined
ll rights reserved.
and Materials Engineering,
Street, Edmonton, Alberta,
492 2881.
as the impeller speed at which no particles remain stationary atthe bottom of the tank for more than one or two seconds(Zwietering, 1958). Using this criterion Zwietering proposed acorrelation for Njs:
Njs ¼ SgðrS�rLÞ
rL
� �0:45 X0:13d0:2p n0:1
D0:85ð1Þ
Many later papers provided measurements and tested othercorrelations for Njs (Nienow, 1968; Baldi et al., 1978; Armenanteet al., 1998), but the Zwietering correlation is still the most widely
I. Ayranci et al. / Chemical Engineering Science 79 (2012) 163–176164
accepted form for design. There are a number of valid criticisms ofthis correlation:
�
The Zwietering constant, S, varies with impeller type, impellerdiameter, off-bottom clearance, the shape of the tank bottom,the baffle geometry, and the particle type. � The effect of viscosity is questionable since the original experi-
ments did not use a wide range of viscosities.
� When there is only one particle, Njs drops to zero, which is
non-physical.
�
FD
FB
FLFlow
direction
FG
FDV
FL
FL= FM+ FS
FT
Fig. 1. Effect of mean velocity and turbulence on a particle on a flat plate. (a) The
forces effective on the particle. (b) Mean velocity isolated from turbulence.
(c) Turbulent eddies isolated from the mean flow.
The correlation is only applicable to low solids loadings(o10 wt%) and unimodal slurries.
In addition to the issues listed above, Grenville et al. (2010)showed that S changes on scale-up.
The Zwietering correlation does not successfully predict eitherthe effect of geometry or scale. When the geometry is keptconstant and the tank is scaled up, D0.85 does not fully capturethe effect of scale and S changes. When the scale is kept constantand D changes, S must also change. In order to make progress, abetter understanding of the mechanism of solids suspension isrequired. Since the definition of complete off-bottom suspensionis based on conditions at the bottom of the tank, it is notsurprising that the impeller diameter alone does not provideenough information. Additional variables such as power numberand the off-bottom clearance of the impeller provide moreinformation, but they are not necessarily good predictors of thecritical flow condition at the bottom of the tank. To makeprogress, more information is needed about the critical conditionsat the bottom of the tank at the just suspended point and how thetank geometry affects solids suspension.
Baldi et al. (1978) suggested that turbulent eddies are thecause of solids suspension in a stirred tank. Eddies have a range ofsizes and energies. Eddies that are close to the particle size aremost likely to suspend the particles. This is often generalized tothe idea that more solids can be suspended if there is moreturbulence or the idea that constant power per volume is areasonable scale-up rule. Both of these statements are flawed.To illustrate the problem consider two impellers: the Rushtonturbine and the A310 impeller. The Rushton turbine is a radialimpeller which provides intense turbulence, and the A310 is anaxial impeller which provides mostly flow (Zhou and Kresta,1996). The A310, however, is known to be better for solidssuspension with a much lower Pjs than the Rushton turbine(Ayranci and Kresta, 2011). There are two reasons for the failureof the Rushton turbine in suspending solids. First is the location ofthe turbulence. The Rushton turbine generates turbulence aroundthe impeller, not at the tank bottom. The A310 directs all of theturbulence it generates towards the bottom. Second is the direc-tion of the flow. The Rushton turbine discharges the fluid radiallytowards the walls where it divides into two circulation loops oneabove and one below the impeller. The loop below the Rushtonturbine reaches the tank bottom and flows towards the center ofthe tank where the particles tend to drop out with no means ofresuspension. The discharge of the A310 goes directly to the tankbottom and then turns outwards towards the walls. Once itreaches the walls, the baffles direct the fluid and solids upwards,making the solids suspension more efficient.
Next consider two tanks, both with A310 impellers, butdifferent shapes of tank bottom: one has a flat bottom and onehas a dished bottom. With the flat bottomed tank, the last point ofsuspension is at the tank walls, as described above, while with adished bottom it is in the center. If the baffles are profiled to fitclose to the tank bottom in the dished tank, Njs is much higherthan if they are left as rectangular baffles (Myers and Fasano,1992). The just suspended speed is clearly sensitive to both the
overall flow patterns and the details of the flow close to the bottomof the tank.
Important outcomes of these examples can be summarized as:
�
Njs depends on the conditions at the bottom of the tank. � Changing the impeller geometry completely changes the
bottom conditions.
� Details of the flow close to the bottom can make a large difference
to Njs.
These outcomes highlight an important point also emphasizedby Thorpe and Stevenson (2003): if the turbulence is not suffi-cient for solids suspension and other parameters such as the flowpattern have an effect, then some mechanism in addition toturbulence must also play a role in solids suspension.
The hypothesis is further developed using an example with amuch simpler geometry. First, the turbulent velocity is brokeninto two components: the mean velocity and the root meansquare of the turbulent fluctuating velocity. Some combinationof the velocity components provides the required conditions forsolids suspension. To form a better hypothesis of which mechan-isms might determine the solids suspension condition, the con-tribution from each of these velocity components should be wellunderstood.
Consider flow over a smooth flat plate with a single particle.When the particle is sitting on the plate as shown in Fig. 1a theforces acting on the particle are gravity (FG), buoyancy (FB), drag(FD), and lift (FL). The effect of friction on a rough surface isdiscussed later in the paper. In Fig. 1b the mean flow on theparticle is isolated from the turbulence. The mean flow needs togo over the sphere. This imposes both boundary layer and formdrag on the particle and it starts to roll or slide along the plate.
I. Ayranci et al. / Chemical Engineering Science 79 (2012) 163–176 165
A pressure difference will develop between the top and bottom ofthe particle due to the asymmetry of the flow. The pressuredifference applies a lift force on the particle. If FL4FG, the particlelifts off the plate. The lift forces that are caused by the shear androtation of the particle are known as the Saffman force, FS, and theMagnus force, FM, respectively. In Fig. 1c the turbulence is isolatedfrom the mean flow. The eddies formed in a turbulent flow havedifferent energies and sizes. The smallest eddies will not affect theparticle. The largest eddies have a convective effect and will actsimilarly to the mean flow. A range of intermediate sized eddieswill have sufficient energy to suspend the particle when they hitit, and will also have a size that is similar to the particle size (Baldiet al., 1978). This is shown as the turbulence force, FT in Fig. 1c.In this simple case, illustrated with a single particle on a flatplate, both the mean flow and the turbulence can play a role insuspending the sphere.
In a stirred tank with an axial impeller, the solids are carriedtowards the walls by the mean radial velocity where they meetbaffles and the associated vertical wall jets which work aselevators for the particles at the tank walls (Bittorf and Kresta,2003). The particles that are carried towards the walls are easierto suspend and circulate in the tank, which explains the impor-tance of selecting an axial flow impeller for solids suspension. Atthe same time as the mean radial velocity convects particlestoward the walls, the axial component of fluctuating velocity liftsthe particles off the bottom of the tank and into the strongcirculating flow. In a hypothetical case where only turbulence ispresent in the tank without any mean flow, the turbulent eddiescan suspend the particles; however, this is a short term suspen-sion since the particles are suspended only slightly from thebottom by the intermediate sized eddies. Each particle settlesquickly and is resuspended at some later time, failing on averageto lift all particles from the bottom of the tank. Since there is nomean flow the particles are not carried towards the walls andthey are not circulated throughout the tank.
Now consider a second hypothetical case where there is onlymean flow and no turbulence. The particles are easily carriedtowards the walls. They are slightly lifted as a result of thecombination of drag and lift forces; however, this does not providecomplete suspension at the bottom. The particles pile up at theperiphery of the tank in low velocity regions. At the walls the radialmean flow is redirected into axial mean flow. This suspends manyparticles that are at the top layer of the pile; however, a significantfraction of the particles remain stationary at the periphery sincethere is no turbulence to push them up and out of the stagnant zonethey are in. These thought experiments suggest that the completeoff bottom suspension condition in a stirred tank could easilyrequire contributions from both velocity components.
Solids suspension has been extensively studied in two otherresearch areas: slurry pipeline flow and river sediment transport.In both flows, the effects of mean flow, turbulence, and near walllift have been considered. These results are considered next andtheir applicability to stirred tanks is discussed.
Thorpe and Stevenson (2003) compared solids suspension instirred tanks and slurry pipeline flow in terms of the definition ofsuspension and the form of the correlations. The depositionvelocity, the minimum solid transport rate below which theparticles start accumulating at the pipe wall, is analogous to Njs
in stirred tanks. The main mechanisms for solids suspension inslurry pipelines are turbulent diffusivity (fluctuating velocity) andnear wall lift. In the core region turbulent diffusion providessolids suspension. Near the wall, the turbulence is diminished inthe viscous sub-layer. In the horizontal plane close to the viscoussub-layer there is a downwards flux of particles; however, there isno upward flux of particles caused by the turbulence since itis not effective in the viscous sub-layer. In this sub-layer, the
balance of the flux of particles is supported by another mechan-ism which is the near wall lift (Wilson, 2005). This is where theSaffman and Magnus forces become important vertical forces.Recently, Wilson et al. (2010) reported the importance of the ratioof the particle size to the thickness of the viscous sub-layer. Whenthe particle size is small the particles are submerged in theviscous sub-layer. For larger particles, no particles remain in theviscous sub-layer. The thickness of the viscous sub-layer changesaccording to the mean flow. Higher mean flow results in a thinnerviscous sub-layer. This affects the importance of near wall lift,since the ratio of the particle size to viscous sub-layer thicknesschanges. Turbulence, near wall lift, and the mean flow are allactive in providing solids suspension for slurry pipeline flows.
Molerus and Latzel (1987) reported boundary layer effects instirred tanks. Based on the wall friction on pipeline flow theyrelated a shear Reynolds number for the boundary layer to theArchimedes number (Ar), and defined limits on Ar to determinewhether the particle is submerged in the viscous sub-layer.
Ar¼gðrs�rLÞd
3p
n2rL
ð2Þ
Molerus and Latzel showed that the particles are submerged inthe viscous sub-layer if Aro40. Larger particles extend beyondthe viscous sub-layer, and therefore, different mechanisms applyfor these particles. It seems that the Ar does not include a velocityterm. The thickness of the viscous sub-layer, however, decreaseswith an increase in velocity. To test the validity of the argumentof a limit on Ar to determine the position of the particle withrespect to the viscous sub-layer the details of the Ar should beanalyzed. Ar is the ratio of gravitational forces to viscous forces.
Ar¼ðrs�rLÞgdp
mLU=xð3Þ
The velocity, U, is present in this initial form of the Ar, but not inthe final form, so it cancels out in the derivation. Since the focus ison the viscous sub-layer, the length scale, x, can be assumed to bethe thickness of the viscous sub-layer, d, and the velocity, U,becomes Un, the shear velocity. If dZdp, then the particle issubmerged in the viscous sub-layer. The limiting point is whend¼dp. Applying this limit and the assumptions to Eq. (3) gives
Ar¼ðrs�rLÞgdp
ðmLUnÞ=dp
ð4Þ
The Un is still present in the equation. In slurry pipeline flow adimensionless particle diameter, dþ is used to determine whetherthe particle is submerged in the viscous sub-layer (Wilson et al.,2010).
dþ ¼rLdpUn
mL
ð5Þ
If dþo9, then the particle is completely submerged in the viscoussub-layer, and if dþ427, then the particle is significantly largerthan the viscous sub-layer and starts to protrude into the logarith-mic layer. The near wall lift applies when 9odþo27. This is a limitgiven for the slurry pipeline transport. Since dþ is dimensionless, itcan be interpreted as some ratio of the particle diameter to d. Ingeneral, for flow close to a solid surface it is known that the viscoussub-layer is located at yþr5 (Davies, 1972):
yþ ¼ yUn
nð6Þ
When yþ¼5, y¼d. Applying these boundary conditions in Eq. (6)gives
d¼ 5n
Unð7Þ
I. Ayranci et al. / Chemical Engineering Science 79 (2012) 163–176166
To combine this back to the particle size remember that theparticle is submerged in the viscous sub-layer when dp¼d, andbased on Eq. (7) when dp ¼ 5ðn=Un
Þ. Substituting this informationin Eq. (5) shows that dþ¼5 when the particle is the same size asthe viscous sub-layer. Since the limiting dþ is known, 5, it can besubstituted in Eq. (5) to obtain an expression for Un.
Un¼ 5ðmL=rLdpÞ ð8Þ
When this Un is replaced in Eq. (4), the final form of the Ar, givenin Eq. (2), is obtained with a constant. This scaling argumentshows that the limit on the Ar does include the effect of velocityon the thickness of the viscous sub-layer for the fixed condition ofparticles being submerged in the viscous sub-layer.
The limit based on dþ can be improved with different assump-tions. Further investigation of the Ar criterion and dþ showed thatthey can be linked. The Ar is based on the particle shear Reynoldsnumber, and dþ is the same as the particle shear Reynolds number.Combining the two cases the relation between Ar and dþ is:
dþ ¼
ffiffiffiffiffiffiffiffiffi2
3Ar
rð9Þ
This relation applies only for the cases where d¼dp. Theparticles are submerged in the viscous sub-layer when Aro40.This corresponds to dþo5. Note that this limit is the same as thelimit based on flow close to a solid surface. There is no limit forstirred tanks at which the particles protrude into the logarithmiclayer. For slurry pipelines this limit is dþ427. This limit canloosely be used for the stirred tanks: particle is exposed to nearwall lift when 5odþo27, and it protrudes into the logarithmiclayer when dþ427. An exact quantitative upper limit cannot begiven for stirred tanks because of the complexity of boundarylayer development at the bottom of a stirred tank.
River sediment transport is another area where solids suspen-sion has been widely discussed. The motion of solids is caused bythe mean flow over a bed of sediment. At very low velocities nosediment moves. At higher velocities individual particles startrolling and sliding intermittently along the bed. As the velocity isfurther increased the drag and lift on the particles increases; someparticles start to make short jumps, leave the bed for a short timeand return either to come to rest or to continue in motion on thebed and undergo further jumps. If the mean velocity increasesslightly, the particles jump more frequently and some of thegrains are incorporated into the main body of the flow by theupward components of the turbulence. They may then stay insuspension for appreciable lengths of time (Vanoni, 2006).
The size of the unsuspended sediment particles determines thesurface roughness of the bed, which in turn affects the flowvelocity distribution and its sediment transport capacity. If thebottom boundary is smooth, turbulence will be suppressed in theviscous sub-layer near the bed and the capacity of turbulence tosuspend solids will be dramatically decreased. This is rarely thecase in rivers. Most boundaries in alluvial rivers are hydraulicallyrough; therefore, there is no viscous sub-layer formation. Turbu-lence becomes the main mechanism in solids suspension from thebed (Garcia, 2008). The effect of bottom roughness on Njs in astirred tank was studied by Ghionzoli et al. (2007). Their studyshowed that the Njs of particles which have a diameter smallerthan 10Z, where Z is the Kolmogoroff length scale, is reduced on arough bottom while the Njs for larger particles stays the same. Thebottom roughness determines the turbulent eddy size and allowsthe turbulence to be the controlling mechanism for solids whichare well matched to the defining eddies.
This analysis of related research areas shows that mean flowand turbulence are the main mechanisms for solids suspension. Itseems that both of these mechanisms are necessary for solidssuspension: either one of them acting alone may not be sufficient
to suspend the solids throughout the volume of a stirred tank Insome cases one of the mechanisms may dominate. At the largerscale, the mean flow carries the particles towards the walls. In theboundary layer, the velocity gradient due to the mean flow rollsand/or slides the particles and lifts them out of the viscous sub-layerso that they can be carried towards the walls by the bulk flow. Atthe same time turbulent eddies of a similar size and inertial energyof the particles lift particles for short periods of time, again exposingthem to the bulk flow. We hypothesize that both the mean flow andthe turbulent eddies are necessary for solids suspension, but if thereis sufficient turbulence with the required eddy size, then the eddieswill be the main mechanism that suspend the particles. If there issufficient mean flow, the turbulence will still contribute to solidssuspension, but the mean flow will dominate.
To test this hypothesis, experiments were designed to applygradual changes to the flow field using constant solid species andsolids concentration to compare the critical flow conditions at thejust suspended speed. The desired changes are small enough to keepthe circulation pattern the same, but large enough to observe adifference in the decay of the impeller discharge stream. Varying theoff-bottom clearance of an A310 impeller was chosen as the bestway to achieve this objective. If convection across the tank bottom(mean flow) is the dominant mechanism for solids suspension, thenall of the mean radial velocity profiles, properly scaled to Njs, shouldcollapse onto a single profile for all clearances. In this case theturbulent eddies are still necessary, but their contribution is notsufficient to obtain complete off-bottom suspension. If it is theturbulent eddies which dominate, then the axial rms (root meansquare) velocity profiles should collapse onto a single profile for allclearances, and the mean flow profiles will most likely be scattered.The dominant mechanism is tested for two impeller diameters.
The analysis of the dominant mechanism requires the analysisof a collapse in the velocity profiles. This collapse is based on thedifferences between the single phase velocity profiles and thevelocity profiles scaled to Njs. The analysis can be done by visualinspection and by inspecting the change in standard deviation.Both these analyses are done to test the hypothesis. An additionalanalysis based on the particle–eddy interactions is also included.
2. Experimental procedures
To test the hypothesis stated above a three-step plan wasprepared. First, the Njs of four slurries (three at low and one athigh solids loading) was measured at varying off-bottom clear-ances. Second, single phase velocity profiles, the mean radialvelocity and the axial fluctuating velocity, were measured usingparticle image velocimetry (PIV) and calculated with large eddysimulations (LES) over a horizontal plane close to the tank bottomfor the same range of geometries. Third, the velocity profiles werescaled to the just suspended condition at every clearance toidentify whether a single critical flow condition exists at thebottom of the tank.
2.1. Njs experiments
Njs was measured as a function of off-bottom clearance in a flatbottomed cylindrical tank with an inner diameter of 0.24 m, shownin Fig. 2. The tank was equipped with four baffles (W¼T/10). Theliquid level in the tank was equal to the tank diameter (H¼T). TwoLightnin A310 impellers with diameters D¼T/3 and D¼T/2 wereused. The A310 was chosen for this study because it generates apurely axial flow and is efficient for solids suspension in terms ofthe power consumption at Njs. The off-bottom clearance, C/T, wasvaried from 0.15 to 0.358 for the T/3 impeller, and from 0.125to 0.333 for the T/2 impeller to ensure that the impeller stream
Table 1Specifications of the particles used in the Njs experiments.
Type Density (kg/m3) Size (lm) Ar Shape
Small glass beads (SG) 2500 74–125 14.7 Spherical
Bronze (B) 8855 150–297 820.5 Spherical
Large glass beads (LG) 2500 595–841 5378.7 Spherical
Fig. 2. Cross-section of the cylindrical tank used for Njs and PIV experiments, and
LES simulations. The dashed plate represents the position of the calibration plate
4 mm above the bottom of the tank. The measurement plane is 3.5–4.5 mm from
the bottom of the tank and is 2 mm thick.
I. Ayranci et al. / Chemical Engineering Science 79 (2012) 163–176 167
reached all the way to the tank bottom in all cases. The liquid phasewas tap water in all experiments. The cylindrical tank was placed ina square tank in order to minimize the optical distortion, and thesetwo tanks were bolted onto a platform which is open in the middle,in order to leave the bottom of the tank visible from below. Moredetails about the experimental setup and the procedure are given inAyranci and Kresta (2011).
The just suspended speed, Njs, is determined visually bywatching the bottom of the tank. Njs is the impeller speed atwhich no particle remains stationary at the bottom of the tank formore than 1 or 2 s (Zwietering, 1958). The impeller speed wasincreased gradually, and after the system reached steady state(1–2 min) the bottom of the tank was observed. Four slurrieswere used in the experiments; unimodal slurries of small glassbeads (SG), large glass beads (LG), and bronze (B) at low solidsloadings and a mixture of small glass beads with bronze at highsolids loadings. The specifications of the particles are given inTable 1. The solids loadings of the unimodal slurries of SG, LG andB were 1.5 wt%, and the SGþB mixture loading was 26 wt% SGwith 1.3 wt% B. The mixture is at a high solids loading where thepresence of particles may start to affect the flow field so the singlephase velocity data should be considered with some caution. Thedata for the B slurry is available only for the T/3 impeller, becauseair entrainment was excessive with the T/2 impeller.
2.2. PIV experiments
A stereoscopic PIV system was used to measure velocityprofiles close to the tank bottom. The PIV was composed of twohigh-resolution cameras (14 bit, 2048�2048 pixels) which cap-ture images of a seeded flow field illuminated with the doublepulse of an Nd:YAG laser (532 nm, 10 Hz, 400 mJ of energy perpulse). The flow facility is a 240 l glass walled holding tank
(1200 mm length�500 mm height�400 mm width) in which a240 mm diameter glass cylinder served as the mixing tank. Thecameras viewed the region-of-interest from below.
The PIV measurements followed a procedure outlined byMadej et al. (2011). The water in the holding tank was evenlyseeded with tracer particles (hollow glass spheres, Potters Indus-tries). The mean particle size of the tracer particles was 11 mmand their specific gravity was 1.1. They were sufficiently smalland light to perfectly follow the flow, so the measured particlevelocities match the liquid velocity. The light sheet had a thick-ness of �2 mm to capture the out-of-plane component of theflow. The stereoscopic PIV system hence resolved the threecomponents of the flow over a 2 mm thick, two dimensionalplane. For each operating condition, 2000 image pairs wererecorded and the time interval between the two images was setbetween 700 ms and 1000 ms, depending on the off bottomclearance of the impeller. The lower time interval was used forlower clearances, since the velocities at the bottom were higherwhen the clearances were lower. The sampling frequencybetween each image pair was between 1.6 Hz and 2.5 Hz.
In order to determine the camera scaling and the imageoverlap a target was placed 4 mm above the bottom of the tank.Using the target data the images were dewarped and the camerascaling was calibrated. This allowed the positioning of the 2 mmthick measurement plane 3.5–4.5 mm above the bottom of thetank. Image overlap was further enhanced using a self-calibrationof the data to locate the position of the laser sheet as it overlapswith the target. The calibration plate had a diameter of 20 cm and,as shown in Fig. 2, it was positioned such that images can betaken from the center of the tank to the tank wall. Here, only datafrom the mid-baffle plane is reported.
A three-dimensional cross-correlation PIV algorithm was usedto determine the particle displacement over the time intervalbetween the two images. From these displacement vectors,velocity vectors were calculated using commercial software(Davis 7.4, LaVision). The resulting data field is an instantaneoussnap-shot of the three components of velocity over the measure-ment plane. Velocity data processing was carried out usinginterrogation cell sizes of 64�64 pixels for the preliminary stepand 32�32 pixels with 50% overlap for the final step. At this finalinterrogation window size, the determined velocity vector is anaverage over a physical region of 1.116 mm�1.116 mm in planeby the thickness of the light sheet of �2 mm.
The glass tank used for the PIV measurements has the samedimensions as the tank used for the Njs experiments, with thesame ranges of off bottom clearances. Measurements were carriedout at a fixed Reynolds number of 48,000.
Re¼ND2
nð10Þ
A fixed rotational speed was used at all clearances: 200 rpmfor the A310 T/2 and 450 rpm for the A310 T/3 impeller. Thisavoided shaft vibration and air entrainment at high rotationalspeeds which would have made the PIV experiments moredifficult. The single phase velocities that were measured withPIV are referred to as ‘‘measured velocities’’ throughout the paper.These are the only velocities that were measured. The measuredvelocities were then scaled to complete off bottom suspensionconditions using the Njs determined for each off-bottom clear-ance.
Vscaled ¼ Vmeasured
Njs
Nexptð11Þ
The Njs of the each solid species at each off-bottom clearance wasused to scale the measured velocities to the conditions where
0
200
400
600
800
1000
1200
1400
1600
0.2 0.4 0.6 0.8 1 1.2
Njs
(rpm
)
C/D
B
SG/BLGSG
D=T/3
D=T/2
Fig. 3. The effect of impeller diameter, particle diameter, particle density, and
solids loading on Njs. B, LG and SG are at 1.5 wt% and the mixture of SGþB is at
27 wt% total solids loading with 1.3 wt% B. Solid and hollow symbols represent
D¼T/3 and D¼T/2, respectively.
I. Ayranci et al. / Chemical Engineering Science 79 (2012) 163–176168
solids are present in the tank. These velocities are referred to as‘‘scaled velocities’’ throughout the paper.
Several authors have shown that velocity profiles below theimpeller scale exactly with the tip speed (pND) (Nouri et al.,1987; Zhou and Kresta, 1996). The range of clearances used herefalls within a range where this scaling can also be applied at thebottom of the tank (Kresta and Wood, 1993). This was validatedthrough some test experiments.
2.3. LES simulations
A lattice-Boltzmann method was used to discretize the Navier–Stokes equations and a force-field technique was employed torepresent the effect of impeller, shaft, baffles and tank wall on thefluid. In the lattice-Boltzmann method, the fluid flow can beconsidered as a many-particle system where all the particles followthe laws of conservation of mass and momentum (Derksen and Vanden Akker, 1999). The particles reside on a uniform cubic lattice. Atevery time step, particles move to neighboring lattice sites, collide,and exchange momentum.
LES was chosen because of its flexibility in adapting tocomplex geometries, providing detailed information and usingless computer resources compared to direct numerical simula-tions (DNS). In LES, small scale eddies are filtered out and thelarge scale eddies are resolved. The effect of the small scale eddieson the large scale is modeled using a subgrid-scale model. For thismodeling, the Smagorinsky model with a constant of cs¼0.1was used.
A force-field technique was used to represent the cylindricaltank wall, rectangular baffles, and revolving impeller and shaft inthe cubic lattice. These are defined by points on the surface. Thesepoints do not need to coincide with the lattice sites. The forcesacting on the flow are calculated in such a way that the fluid hasprescribed velocities (Derksen and Van den Akker, 1999) at thesesurface points. Applying the boundary conditions results in thedesired curved surface for the tank wall, the rectangular baffles,and the rotating impeller and shaft.
A computational domain with 2003 grid nodes was used. TheReynolds number was 48,000, which is the same as in the PIVexperiments. The simulations were performed for an A310impeller with a diameter of D¼T/3 at C/D¼0.45, 0.675, 0.75,and 0.9. The entire tank was simulated and the three velocitycomponents were computed. The averages were taken for severalhorizontal planes.
3. Results and discussion
The results are presented in five major sections. First the effectof particle properties, solids loadings and geometry (impellerdiameter and off-bottom clearance) on Njs are presented. Nextthe velocity profiles for the T/3 and the T/2 impellers areevaluated to determine the solids suspension mechanism foreach impeller and to examine whether the dominant mechanismdepends on the impeller diameter. After the analysis of theexperimental data, the hypothesis and the conclusions are com-pared with the LES results. Finally, the power consumed by thetwo impellers is compared to better understand the interactionbetween the observed mechanisms and power consumption.
3.1. Njs results
Fig. 3 shows the Njs results for the T/2 and T/3 impellers forunimodal slurries of B, LG and SG at 1.5 wt% and the mixed slurryof 26 wt% SG with 1.3 wt% B, all at varying off-bottom clearances.Within the unimodal slurries the B has the highest density and
also the highest Njs. The LG and SG have the same density, but LGhas a higher Njs since it is 7 times larger than the SG. The mixedslurry has the highest solids loading, so it has a higher Njs than theLG and the SG, but lower than the B because of particle–particleinteractions as explained in Ayranci and Kresta (2011). These trendsare consistent for both impeller diameters, and as expected, Njs issmaller for the larger impeller diameter. As predicted by theZwietering equation, an increase in the particle density, particle sizeor solids loading – in the absence of particle–particle interactions –results in an increase in Njs.
The effect of off-bottom clearance on Njs is more complex, asshown in Fig. 4. At off-bottom clearances, C/D, larger than 0.35,the particles collect close to the tank walls, and are suspendedfrom there when Njs is reached. At off-bottom clearances smallerthan 0.35 the particles collect in the center of the tank as well asat the tank walls. This is because the A310 impeller cannotdevelop purely axial flow below the hub at low C/D and thedischarge of the impeller is quickly deflected to produce aswirling radial flow. Fig. 4 shows sample experimental observa-tions of this behavior for a slurry of 1.5 wt% SG with 1.5 wt% Bwith the D¼T/2 impeller. At C/D¼0.25 the particles collect bothin the center and at the periphery of the tank, but when the off-bottom clearance is increased to C/D¼0.5 there is no accumula-tion in the center: all the particles are at the periphery of the tank.These two deposition patterns will be helpful for understandingsome of the later results.
3.2. Solids suspension mechanisms with the T/3 impeller
The evaluation of dominant solids suspension mechanism isbased on a hypothesis that the solids suspension occurs as a resultof a combination of both mean flow and turbulent eddies, and atthe complete off-bottom suspension condition one of thesemechanisms, either the turbulence or the mean flow, shoulddominate for a fixed set of particles. For a purely axial impeller,the flow pattern stays the same as the off-bottom clearance isincreased and thus the velocity component which is dominant atthe point of off-bottom suspension should also remain the same.If this hypothesis holds, a set of velocity profiles should collapseonto a single curve for all off-bottom clearances when themeasured profiles are scaled to Njs at the respective clearances.
Fig. 5. (a) Measured mean radial velocity profiles normalized with the tip speed of
the impeller: A310 T/3. (b) Measured axial rms velocity profiles normalized with
the tip speed of the impeller: A310 T/3.
Fig. 4. The effect of off-bottom clearance on the solids suspension pattern for the A310 D¼T/2. (a) C/D¼0.25. (b) C/D¼0.5.
I. Ayranci et al. / Chemical Engineering Science 79 (2012) 163–176 169
This hypothesis is evaluated based on both the visual inspectionof scaled velocity profiles for mean radial velocities, Vr, and axialrms velocities, v0z, and the reduction in normalized standarddeviation for scaled Vr or v0z over the range of clearances at eachpoint in the profile. A comparison of estimated eddy sizes withparticle sizes was also made to further probe the mechanisms.The analysis starts with the measured velocity profiles.
The measured Vr and v0z at seven off-bottom clearances werenormalized with the tip speed of the impeller and are shown inFig. 5a and b. The profiles in each graph show similar trends forincreasing off-bottom clearances, but they do not follow a definiteorder. In Fig. 5a the Vr profile for the highest clearance,C/D¼1.075, is 12% lower than the other clearances in the40–100 mm area. This is because the discharge of the impellerloses a significant amount of momentum by the time it reachesthe bottom of the tank when the impeller is more than oneimpeller diameter away from the tank bottom. While the data forthis clearance in the center blends in with the rest, it cannotsustain similar level of velocities in the 40–100 mm area. Thisclearance was eliminated from the rest of the figures because itviolates the basic assumption of having a constant circulationpattern. In Fig. 5a another irregularity is seen for C/D¼0.675 andC/D¼0.75 in the 95–120 mm area. While the circulation patternremains to be the same as the rest of the clearances tested, atransition is seen. The maximum radial velocity can be sustainedlonger at these off-bottom clearances. In Fig. 5b for these twoclearances the position of the peak velocity is slightly shifted, andafter 40 mm v0z is slightly higher than the rest of the data. Theremaining profiles for both Vr and the v0z are quite close to eachother at varying off-bottom clearances when normalized with tipspeed. This indicates that the expected collapse with either one ofthe velocity profiles may be difficult to determine by inspectionwhen the profiles are scaled. To allow a more objective assessment,the collapse was also analyzed in terms of Ds, the point by pointdifference between the standard deviation of the scaled velocityprofiles and the measured velocity profiles for each slurry.
The measured velocity profiles were scaled to Njs for fourslurries: SG, LG, B, and the mixture of SG with B. For all fourslurries the last point of suspension is at the tank walls. The SGslurry results were representative and are reported here. Thescaled Vr profiles in Fig. 6a are scattered over most of the profilebut collapse from 40 to 65 mm, which is right after the tip ofthe blade, for all clearances when compared to the measuredvelocities in Fig. 5a. The scaled v0z profiles in Fig. 6b are scattered
-50
-40
-30
-20
-10
0
10
20
30
40
50
0 20 40 60 80 100 120
0 20 40 60 80 100 120
% Δσ r
R (mm)
SGLG
BSG+B
T/3 MEAN
-10
-8
-6
-4
-2
0
2
4
6
8
10
% Δσ z
R (mm)
SG
LGB
T/3 RMS
Fig. 7. (a) The difference between the normalized standard deviation of the scaled
and the measured mean radial velocity for each particle species with the A310 T/3.
(b) The difference between the normalized standard deviation of the scaled and
the measured axial rms velocity for each particle species with the A310 T/3.
Fig. 6. (a) Scaled mean radial velocity profiles for 1.5 wt% SG with the A310 T/3.
(b) Scaled axial rms velocity profiles for 1.5 wt% SG with the A310 T/3.
I. Ayranci et al. / Chemical Engineering Science 79 (2012) 163–176170
over the first 40 mm, which is the area below the impeller blades.From 40 mm to the tank walls the v0z profiles collapse, and thecollapse becomes more significant after 80 mm. The v0z profilescollapse over most of the radius and the collapse is moresignificant than the small part in Vr. This shows that some levelof mean flow is necessary, but a certain level of turbulence isrequired for solids suspension. The turbulence is the dominantmechanism for solids suspension with the T/3 impeller.
While we categorize some parts of these figures as collapsed,the collapse is not perfect and the measured profiles are quiteclose to each other for varying clearances, so it is prudent toanalyze the data from another perspective to verify that thisinitial conclusion is correct.
The normalized standard deviation (s) of the velocities for allsix clearances was calculated at each radial position for bothvelocity components (Vr and v0z).
Here n signifies the off-bottom clearance. For each impeller thereare six off-bottom clearances. xn is either Vr or the v0z at the nth
off-bottom clearance, xmean is the mean of the velocities at all off-bottom clearances. This calculation is repeated for every radialposition and the difference between the normalized standard devia-tion of the measured and the scaled results, Ds, is calculated as:
The change in normalized standard deviation, Ds, is reportedin Fig. 7a and b for Vr and v0z and for all four particle species.Values above zero indicate that the profiles are more scattered,and values below zero indicate that profiles have collapsed. Theresults confirm the conclusions made from Fig. 6. Turbulence isclearly the dominant mechanism for all four slurries for the T/3impeller. The collapse of the mean radial velocity is erratic,actually becoming more scattered in the area immediately belowthe impeller blades (0–40 mm) where very large or very small
I. Ayranci et al. / Chemical Engineering Science 79 (2012) 163–176 171
Ds are seen. This is not surprising because the mean Vr over allclearances is close to zero in this area, and in the Ds calculationsthe velocities are divided by the mean of the velocities. Theprofiles show more agreement over the middle region (40–80 mm), increasing again from 80–120 mm. This shows that thehypothesis holds true for the T/3 impeller: both the mean flowand the turbulent eddies are necessary for solids suspension, butthe turbulent eddies dominate. A certain level of turbulenceshould be reached at the bottom of the tank with the contributionof some mean flow in order to achieve complete off-bottomsuspension.
A final analysis was done based on the size of the smallesteddies—the Kolmogoroff length scale (Z). A minimum and amaximum Z can be estimated at the bottom of the tank usingthe following scaling arguments. An axial flow impeller generatesturbulence at the bottom of the tank, with the smallest eddy sizes,the Kolmogoroff scale, following the relationship:
Zest ¼ ðn3
eÞ1=4
ð14Þ
where n is the kinematic viscosity and e is the energy dissipation.The energy dissipation can be estimated from:
e¼ Av03zL
ð15Þ
where A is 1.0 for isotropic turbulence, v0z is the axial rms velocity,and L is the integral length scale. Two integral length scalesmight be considered: the size of the trailing vortices close tothe impeller, L¼D/10, and the size of the circulation layer at thebottom of the tank, L¼T/5. Since the trailing vortices are at theimpeller, and the eddies get larger towards the bottom of the tank(Tatterson et al., 1980), the length scale at the bottom of the tankshould be larger than D/10. Similarly, the length scale at thebottom of the tank should be smaller than the circulation layerclose to the bottom of the tank, LoT/5. Based on these twolimiting length scales and the measured v0z, a maximum and aminimum limit on the Kolmogoroff length scale of the eddies canbe estimated:
Zmin ¼ ðn3
Aðv03z =ðD=10ÞÞÞ
1=4ð16Þ
Zmax ¼ ðn3
Aðv03z =ðT=5ÞÞÞ1=4
ð17Þ
The v0z in Eqs. (16) and (17) was determined from the scaledvelocity profiles for each particle. Over the sections where theprofiles collapsed the maximum v0z was used in Eq. (16) toestimate Zmin, and the minimum v0z was used in Eq. (17) toestimate Zmax. Table 2 shows the results. For SG, the range ofsmallest eddy sizes overlaps the range of particle sizes so theparticles are much smaller than the most energetic eddies andwill be swept up mainly by turbulent convection from eddiesmuch larger than the particles. For LG, the particles are muchlarger than the smallest eddies (about 10� ) but substantially
Table 2The range of Kolmogoroff length scales for each particle species as observed for
two impeller diameters.
Particletype
Impellerdiameter
Minimumv0z (m/s)
Maximumv0z (m/s)
Lmin
(m)Lmax
(m)gmin
(lm)gmax
(lm)
SG T/3 0.04 0.10
0.008 0.048
53 165
LG T/3 0.07 0.10 53 115
B T/3 0.10 0.30 23 83
SG T/2 0.10 0.280.012 0.048
27 83
LG T/2 0.33 0.10 24 83
smaller than the integral scale (10–80� ), so the particle–eddyinteraction at the particle scale may be expected to be quitestrong. For B, the particles are 3–4 times Z, and again the potentialfor particle–eddy interaction is quite strong.
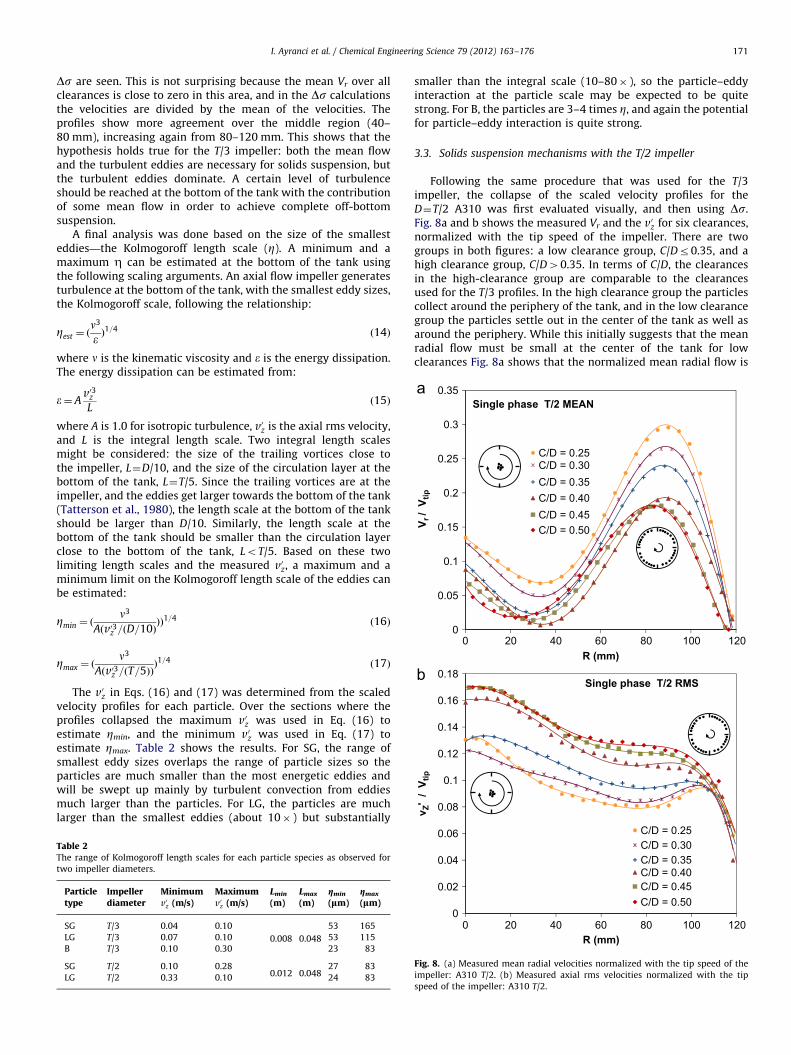
3.3. Solids suspension mechanisms with the T/2 impeller
Following the same procedure that was used for the T/3impeller, the collapse of the scaled velocity profiles for theD¼T/2 A310 was first evaluated visually, and then using Ds.Fig. 8a and b shows the measured Vr and the v0z for six clearances,normalized with the tip speed of the impeller. There are twogroups in both figures: a low clearance group, C/Dr0.35, and ahigh clearance group, C/D40.35. In terms of C/D, the clearancesin the high-clearance group are comparable to the clearancesused for the T/3 profiles. In the high clearance group the particlescollect around the periphery of the tank, and in the low clearancegroup the particles settle out in the center of the tank as well asaround the periphery. While this initially suggests that the meanradial flow must be small at the center of the tank for lowclearances Fig. 8a shows that the normalized mean radial flow is
Fig. 8. (a) Measured mean radial velocities normalized with the tip speed of the
impeller: A310 T/2. (b) Measured axial rms velocities normalized with the tip
speed of the impeller: A310 T/2.
I. Ayranci et al. / Chemical Engineering Science 79 (2012) 163–176172
actually larger than what it is in the high clearance group. Someother effect is dropping particles out in the center of the tank atlow clearances.
This additional effect is a strong rotational flow below theimpeller. This swirl diminishes when there is sufficient distancebetween the impeller and the tank bottom, but when the impelleris close to the tank bottom, C/Dr0.35, the swirl is containedbetween the impeller and the tank bottom causing particles todrop out. This requires the analysis of the theta velocities. Theprofiles are not shown here, but an analysis is provided. From 0 to30 mm along the radial traverse a forced vortex is evident in thetheta velocity profiles, followed by a free vortex which extendstowards the tank walls. In the 0–30 mm area the theta velocitiesnormalized with the tip speed of the impeller increase up to 0.12with a steep slope. This high velocity causes the particles drop outin the center immediately below the 20 m diameter hub. As theoff-bottom clearance increases, C/D40.35, the theta velocitydrops showing free vortex behavior all along the radius.
The measured velocities were scaled to Njs for three slurries:SG, LG, and the mixture of SG with B. For all of the slurries the lastpoint of suspension at low clearances is both at the center of the
Fig. 9. (a) Scaled mean radial velocity profiles for 1.5 wt% LG with the A310 T/2.
(b) Scaled axial rms velocity profiles for 1.5 wt% LG with the A310 T/2.
tank and at the tank walls, and at high clearances it is only at thetank walls. The LG slurry results are representative and are shownin Fig. 9a and b. Visual inspection indicates that with the T/2impeller the contribution of both mean flow and turbulent eddiesis necessary, but neither of them dominates. The data does notshow any collapse in either the low clearance or the highclearance group. This indicates that the hypothesis does not holdtrue for the T/2 impeller.
The Ds results are shown in Fig. 10a and b. Ds is alwaysnegative for Vr, and is always positive for v0z, suggesting that meanflow is the principle mechanism for the T/2 impeller, but this doesnot agree with the visual inspection of the velocity profiles, whichare nearly unchanged. The same conflicting result was observedfor LG, SG and the mixture of SG with B.
The two impellers can be directly compared by plotting thevelocity profiles for the T/3 mean and rms scaled for Njs of the LGdirectly on top of the plots for the T/2 impeller. This is shown inFig. 9a and b as dashed lines. Considering first the mean velocityprofiles, the T/3 result falls above the two results for the D¼T/2impeller at both high and low clearances. The drop in Vr close tothe center of the tank is much smaller for the T/3 impeller,
-4.5
-3.5
-2.5
-1.5
-0.5
0.5
1.5
0 20 40 60 80 100 120
0 20 40 60 80 100 120
% Δσ r
R (mm)
SG
LG
SG+B
T/2MEAN
0
1
2
3
4
5
6
% Δσ z
R (mm)
SG
LG
SG+B
T/2RMS
Fig. 10. (a) The difference between the normalized standard deviation of scaled
and the measured mean radial velocity profiles for each particle species: A310 T/2.
(b) The difference between the normalized standard deviation of scaled and the
measured axial rms velocity profiles for each particle species: A310 T/2.
-0.10
0.00
0.10
0.20
0.30
0.40
0 20 40 60 80 100 120
V r* N
js /
N (m
/s)
R (mm)
C/D=0.450
C/D=0.675
C/D=0.750
C/D=0.900
SG T/3MEANLES
0.15
0.20
0.25
Njs
/ N
(m/s
)
C/D=0.450C/D=0.675C/D=0.750C/D=0.900
SG T/3 RMSLES
I. Ayranci et al. / Chemical Engineering Science 79 (2012) 163–176 173
extending out to only 8 mm, while the T/2 impeller retains thistrend out to 40 mm. This is a direct effect of the change inimpeller diameter. For both impellers, the maximum radialvelocity occurs at about 80 mm, but for the T/2 impeller this isa sharp peak, while for the T/3 impeller, it is a broad peak whichextends from roughly 60–100 mm. Again, this is a direct effect ofthe impeller geometry. The larger impeller has less space to reachthe peak, so the slope of the profile on either side must be steeper.Overall, the mean radial velocities are of a similar magnitude,with the T/2 impeller having a significantly less favorable config-uration for removing solids from the bottom of the tank. The moresurprising results are found by comparing the fluctuating velocityprofiles. The LG particles can be suspended when the scaledfluctuating velocities are in the 0.8–1.8 range and there is somemean flow present with the T/3 impeller. For the T/2 impeller, therms velocity is 3–4 times larger than the required rms velocity.This is because of the shape of the radial velocity profiles with theT/2 impeller and proves that the contribution of mean flow iscertainly important. In order to achieve the required minimumconvective effect with the mean velocity, the T/2 impellergenerates much more turbulence as a secondary effect.
As a last note, consider the high and low clearance cases. Thelow clearance case, where particles tend to collect at the center ofthe tank, has a higher mean velocity and a lower rms velocity inthis group. This suggests that some other mechanism is drawingparticles into the center of the tank, and the mean velocity has tobe increased to compensate for this effect. The rms velocitycannot convect the particles away from the center, so it plays aless critical role for this particular configuration.
An estimation of the size of the smallest Kolmogoroff eddies wasalso made for the T/2 impeller, as given in Table 2. There is nosignificant collapse of the velocity profiles for this impeller, so theminimum and maximum v0z were taken close to the tank walls, from100–120 mm. The SG particles are similar in size to the smallesteddies, while the LG particles fall in the center of the most energeticeddy size range. Note that the maximum Kolmogoroff eddy size issmaller than for the T/3 impeller due to the increase in the rmsvelocity. This will lead to an increase in power consumption with noimprovement in solids suspension conditions.
The mean and rms velocity results reveal several things: solidssuspension for the T/3 impeller is determined by the rms velocitylimit, and the profiles collapse nicely to show this. The T/2impeller, on the other hand, is limited by an unfavorable meanradial velocity profile. Overcoming the limitations of this profilerequires a significant increase in the rms velocity beyond what isrequired to suspend the particles. For the low clearance case,some additional three dimensional effect is driving particlestoward the center of the tank, and this effect has to be overcomeby further increasing the mean velocity. These results show thatthe solids suspension mechanism changes when the impellerdiameter is changed for a fixed set of particles. This is because theflow close to the tank bottom changes, and the particles have torespond to the change in flow.
0 20 40 60 80 100 1200.00
0.05
0.10
v z' *
R (mm)
Fig. 11. (a) LES results for the scaled mean radial velocity profiles for 1.5 wt% SG:
A310 T/3. (b) LES results for the scaled axial rms velocity profiles for 1.5 wt% SG:
A310 T/3.
3.4. LES results
In the final stage of analysis, single phase velocity profileswere obtained using LES at the same conditions as the PIVexperiments for the T/3 impeller. The advantage of LES is thatthe flow field in the entire tank is calculated and the data forevery grid point is stored. This allows us to investigate thevelocity profiles at different horizontal measurement planes. Inthis section, the critical flow condition hypothesis is tested for afinal time using the LES results, and the LES and the PIV resultsare compared. Second, the sensitivity of the velocities to the
position of the measurement plane was analyzed using the highresolution LES data.
3.4.1. Solids suspension mechanisms with the T/3 impeller and
comparison of the LES and PIV data
Fig. 11a and b shows the scaled Vr and v0z for the T/3 impeller.Both the Vr and the v0z profiles are scattered; there is no visiblecollapse of the profiles. The visual inspection does not show aclear trend for a dominant solids suspension mechanism. Fig. 12aand b shows the Ds for Vr and v0z. The Ds for Vr is mostly negative,while the Ds for v0z is negative only from 75 to 105 mm. Thissuggests that the mean flow is the dominant mechanism for theT/3 impeller. The Ds analysis leads to a different conclusion thanboth the visual inspection and the PIV results.
The shapes of the scaled velocity profiles with LES, Fig. 11a andb, are similar to the PIV profiles, Fig. 6a and b, but there are somedifferences in both the flow details and in the magnitude of thevelocities. In Fig. 11a, Vr calculated using LES is zero in the centerof the tank while it is between �0.1 and 0.2 m/s in the PIVmeasurements, giving a mean of zero. In a mathematical senseVr must approach zero at the bottom center of the tank because
-16
-12
-8
-4
0
4
8
% Δσ r
R (mm)
SG
T/3 MEAN LES
-12
-8
-4
0
4
8
12
0 20 40 60 80 100 120
0 20 40 60 80 100 120
% Δσ z
R (mm)
SG
T/3 RMS LES
Fig. 12. (a) The difference between the normalized standard deviation of the
scaled SG and the single phase mean radial velocities according to LES. (b) The
difference between the normalized standard deviation of the scaled SG and the
single phase radial mean velocities according to LES.
-0.1
0
0.1
0.2
0.3
0.4
V r* N
js /
N (m
/s)
R (mm)
i=1.8 mmi=2.4 mmi=3.0 mmi=3.6 mmi=4.2 mmi=4.8 mmi=5.4 mm
T/3 MEAN
0
0.05
0.1
0.15
0.2
0.25
0 20 40 60 80 100 120
0 20 40 60 80 100 120
v z' *
Njs
/ N
(m/s
)
R (mm)
i=1.8 mmi=2.4 mmi=3.0 mmi=3.6 mmi=4.2 mm
i=4.8 mmi=5.4 mm
T/3 RMS
I. Ayranci et al. / Chemical Engineering Science 79 (2012) 163–176174
there is no point source of mass at R¼0. Capturing an exact zerovelocity at the center of the tank would require measurementswith a longer time average as well as high resolution in both timeand space close to the center of the vessel, and a thoughtfulconsideration of the best time averaging scheme to apply if a slowprecessing vortex structure is present in this region. This detailedflow analysis is beyond the scope of work considered here.
In the LES results, the magnitude of Vr is under-predicted, andthe magnitude of v0z is over-predicted. The LES profiles are located4.2 mm above the bottom of the tank, which is a region wherewall effects may have a substantial impact on the accuracy of LESpredictions.
Fig. 13. (a) The effect of the position of the measurement plane on mean radial
velocities. Mean radial velocities were obtained with LES and scaled with Njs data
for 1.5 wt% SG with the A310 T/3 at C/D¼0.75. (b) The effect of the position of the
measurement plane on axial rms velocities. Axial rms velocities were obtained
with LES and scaled with Njs data for 1.5 wt% SG with the A310 T/3 at C/D¼0.75.
3.4.2. The effect of distance from the bottom of the tank on velocities
The LES profiles in Fig. 11a and b were taken 4.2 mm above thebottom of the tank. In the PIV experiments the axial position of
the measurement plane was from 3.5 to 4.5 mm above thebottom of the tank, and the thickness of the plane was 2 mm.Close to the bottom of the tank the velocities may vary signifi-cantly, so it is interesting to consider how sensitive the resultsmay be to small errors in positioning. This analysis cannot bedone with the PIV data since it was only at one vertical position,but LES data was recorded for all horizontal planes along thevertical axis.
Fig. 13a shows the scaled mean radial velocity profiles at afixed impeller off-bottom clearance, C/D¼0.75, at various dis-tances from the bottom of the tank. As the plane moves awayfrom the bottom of the tank the radial velocities vary slightlyclose to the center of the tank and close to the tank walls, but theyall collapse on to a single profile at around the maximum Vr.
Fig. 13b shows the scaled axial rms velocity profiles at a fixedoff-bottom clearance, C/D¼0.75, for a T/3 impeller. As the planeis pulled away from the bottom of the tank the trend of theprofiles remains the same, but the magnitude of the velocitiesincreases. Between the first plane, i¼1.8 mm, and the second plane,
0
2
4
6
8
10
12
14
16
18
20
0 0.2 0.4 0.6 0.8 1 1.2
P js
(W)
C/D
SG+B
LGSG
D=T/3D=T/2
Fig. 14. The comparison of power consumption between the A310 T/3 and the T/2.
The power consumption was calculated for the SG and the LG slurries at 1.5 wt%,
and for the mixture at 26 wt% SG with 1.3 wt% B. Solid and hollow symbols
represent D¼T/3 and D¼T/2, respectively.
I. Ayranci et al. / Chemical Engineering Science 79 (2012) 163–176 175
i¼2.4 mm, the magnitude of the velocities increases significantly,showing that the position of the measurement plane makes asignificant difference in the velocities. Starting from 3.6 mm theprofiles collapse onto each other, indicating that from 3.6 mm to5.4 mm the axial rms velocities do not change significantly. Thisanalysis shows that the velocities are not a strong function of theposition of the measurement plane in the 3.5–4.5 mm range.
3.5. Comparison between the T/3 and the T/2 impellers
Solid–liquid mixing is a power intensive operation; therefore,the power consumption is an important criterion in choosing animpeller. The power consumption at just suspended conditions(Pjs) can be calculated from:
Pjs ¼ rslNpN3jsD
5ð18Þ
Fig. 14 shows the comparison of power consumption between theT/3 and the T/2 impellers for the SG and the LG slurries at 1.5 wt%and SGþB mixture at 27 wt% at varying off-bottom clearances.For all slurries the power consumption with the T/3 impeller issignificantly lower than the T/2 impeller. Referring back to Fig. 3we see that Njs is higher for the T/3 impeller than the T/2 impellerfor both the SG and the LG slurries. From an operational point ofview, the power consumption is a better criterion than Njs forchoosing an impeller.
A comparison of the two impellers in terms of the solidssuspension mechanisms shows two different trends. For the T/2impeller some combination of the mean flow and turbulent eddiesprovides solids suspension, and neither of these mechanisms dom-inate. For the T/3 impeller a single mechanism, turbulence, dom-inates and the required level of turbulence with the small impeller isapproximately one third the levels observed for the T/2 impeller. TheT/3 impeller is also less power intensive. It can be concluded that theT/3 impeller is more efficient because the convective flow is moreefficient, which in turn minimizes the amount of turbulence energydissipation required to suspend the solids.
4. Conclusions
The goal of this study was to investigate the mechanisms thatdrive solids suspension in stirred tanks. The analysis was based on
the hypothesis that at complete off-bottom suspension a criticalflow condition exists close to the bottom of the tank at everyclearance for fixed solids, tank geometry, and constant circulationpattern. The flow condition might be dominated by either themean flow in a convective mechanism, or the turbulence in aneddy-lifting mechanism.
Data was collected using visual observations of the tank bottom,PIV, and LES. The PIV measurements were collected at a singlerotational speed. The data was analyzed using three separatemethods. First the velocity profiles were scaled with Njs and plottedtogether to determine whether the profiles collapsed to a singlecritical flow condition at Njs. Second, the degree of collapse wasquantified using the change in normalized standard deviation fromthe raw measured profiles to the scaled velocity profiles. Last, thesize of the smallest eddies was estimated and compared with thesize of the particles to determine the most likely type of particle–eddy interactions for each particle species. The results led to thefollowing conclusions:
�
Solids suspension occurs as a result of the combination ofmean flow and turbulent eddies. Complete off-bottom suspen-sion cannot be obtained in the absence of one of thesemechanisms. � When the impeller diameter is changed the solids suspension
mechanism changes. The solids deposition pattern changeswhen the off-bottom clearance is changed. This data providestwo clear demonstrations of the dramatic effect of geometryon solids suspension.J For the T/3 impeller the hypothesis holds true. The critical
flow condition is dominated by the level of turbulence andconvection plays a secondary role.
J For the T/2 impeller the hypothesis does not hold true. Bothmechanisms play an active role, but neither mechanismdominates. The shape of the radial velocity profile is unfavor-able for solids suspension so a larger impeller speed is neededto achieve the same amount of convective flow and thisresults in a significant amount of additional turbulence andpower consumption at the point of solids suspension.
�
The solids suspension mechanism also depends on the type ofthe particle, because the particle–eddy interactions are differ-ent for each particle species.J The SG is submerged in the viscous sub-layer and it is
significantly smaller than the most energetic eddies.J The LG lies in the middle of the spectrum with highly
energetic particle–eddy interactions all along the tank bottom.J The B lies somewhere in between: it is larger than the
viscous sub-layer and the smallest eddy sizes, but theparticle–eddy interactions are not as strong as for LG. Thissuggests that the B is moved away from the tank bottom asa result of both turbulent eddies and near wall lift.
�
The T/3 impeller is more efficient for solids suspension becauseless energy is lost to excess turbulent energy dissipation.
Nomenclature
Roman characters
A constant in Eqs. (15)–(17)C off-bottom clearance of the impeller (m)cs Smagorinsky model constantD impeller diameter (m)dp particle diameter (m)dþ particle diameter (dimensionless)FB buoyancy force (N)
I. Ayranci et al. / Chemical Engineering Science 79 (2012) 163–176176
FD drag force on the sphere (N)FG gravity force (N)FL lift force (N)FM Magnus force (N)FS Saffman force (N)FT turbulence force (N)g acceleration due to gravity (m/s2)H liquid height (m)h height of the calibration plate from the tank bottom
(mm)i the distance of the horizontal plane from the bottom of
the tank for LES data (mm)L integral length scale (m)N impeller rotational speed (rpm)Nexpt impeller speed for the PIV experiments (rpm)Njs just suspended speed (rpm)Np power number (dimensionless)n clearance index in Eq. (13)Pjs power consumption at the just suspended speed (W)R radial position in the tank (mm)S Zwietering’s Njs constantT tank diameter (m)U velocity in Eq. (3) (m/s)Un shear velocity (m/s)Vmeasured measured velocity (m/s)Vr mean radial velocity (m/s)Vscaled scaled mean radial or axial rms velocity (m/s)Vtip tip velocity (m/s)v0z axial rms velocity (m/s)W baffle width (m)X solids loading (mass of solid/mass of liquid�100)x the length scale (m)xn velocity at the nth off-bottom clearancexmean the mean velocity over all six clearancesy distance from the solid surface (m)yþ dimensionless distance from the solid surface
Greek characters
n kinematic viscosity of the liquid (m2/s)mL dynamic viscosity of the liquid (kg/m s)rL liquid density (kg/m3)rS solid density (kg/m3)rsl slurry density (kg/m3)s normalized standard deviation (Eq. (12))Ds difference between the normalized standard deviations
of the scaled and measured velocities (Eq. (13))Dsr Ds for mean radial velocitiesDsz Ds for axial rms velocitiesZ Kolmogoroff length scaleZest estimated Kolmogoroff length scalee rate of dissipation of turbulent kinetic energy per unit
mass (m2/s3)d viscous sub-layer thickness (m)
Abbreviations
Ar Archimedes numberA310 axial impeller provided by LightninB bronzeDNS direct numerical simulations
LES large eddy simulationsLG large glass beadsmin minimummax maximumPIV particle image velocimetryRe Reynolds numberrms root mean squareSG small glass beadswt% weight percent
Acknowledgments
The authors would like to thank Lightnin, NSERC, and CNPq,Brazil, for funding this research.
References
Armenante, P.M., Nagamine, E.U., Susanto, J., 1998. Determination of correlationsto predict the minimum agitation speed complete solid suspension in agitatedvessels. Can. J. Chem. Eng. 76, 413–419.
Ayranci, I., Kresta, S.M., 2011. Design rules for suspending concentrated mixturesof solids in stirred tanks. Chem. Eng. Res. Des. 89, 1961–1971.
Baldi, G., Conti, R., Alaria, E., 1978. Complete suspension of particles in mechani-cally agitated vessels. Chem. Eng. Sci. 33, 21–25.
Bittorf, K.J., Kresta, S.M., 2003. Prediction of cloud height for solid suspension instirred tanks. Trans. IChemE 81(A), 568–577.
Davies, J.T., 1972. Turbulence phenomena, an introduction to the eddy transfer ofmomentum, mass, and heat, particularly at interfaces. Academic Press, NewYork (chapter 3).
Derksen, J., Van den Akker, H.E.A., 1999. Large eddy simulations on the flow drivenby a Rushton turbine. AICHE J. 45, 209–221.
Ghionzoli, A., Bujalski, W., Grenville, R.K., Nienow, A.W., Sharpe, R.W., Paglianti, A.,2007. The effect of bottom roughness on the minimum agitator speed requiredto just fully suspend particles in a stirred vessel. Trans. IChemE 85 (A5),685–690.
Grenville, R.K., Mak, A.T.C., Brown, D.A.R., 2010. An improved correlation to predict‘‘just suspension’’ speed for solid–liquid mixtures with axial flow impellers instirred tanks. North American Mixing Forum, Victoria, BC, Canada (June 20–June 25).
Kresta, S.M., Wood, P.E., 1993. The mean flow field produced by a 451 pitchedblade turbine: changes in the circulation pattern due to off bottom clearance.Can. J. Chem. Eng. 71, 42–53.
Madej, A.M., Babazadeh, H., Nobes, D.S., 2011. The effect of chamber length andReynolds number on jet precession. Exp. Fluid 51 (6), 1623–1643.
Molerus, O., Latzel, W., 1987. Suspension of solid particles in agitated vessels.Particulate Sci. Technol. 5 (3), 235–260.
Myers, K.J., Fasano, J.B., 1992. The influence of baffle off-bottom clearance on thesolids suspension of pitched-blade and high-efficiency impellers. Can. J. Chem.Eng. 70, 596–599.
Nienow, A.W., 1968. Suspension of solid particles in turbine agitated baffledvessels. Chem. Eng. Sci. 23, 1453–1459.
Nouri, J.M., Whitelaw, J.H., Yianneskis, M., 1987. The scaling of the flow field withimpeller size and rotational speed in a stirred reactor. In: Proceedings of theSecond International Conference on Laser Anemometry—Advances and Appli-cations. Strathclyde, UK.
Thorpe, R.B., Stevenson, P., 2003. Suspension of particles from the bottom of pipesand stirred tanks by gassed and ungassed flows. Can. J. Chem. Eng. 81,351–359.
Vanoni, V.A., 2006. Chapter II: Sediment Transportation Mechanics, SedimentationEngineering. ASCE Manuals and Reports on Engineering Practice, second ed.,vol. 54, pp. 11–189.
Wilson, K.C., 2005. Slurry transport using centrifugal pumps. Springer, New York,pp. 123–151.
Wilson, K.C., Sanders, R.S., Gillies, R.G., Shook, C.A., 2010. Verification of the near-wall model for slurry flow. Powder Technol. 197, 247–253.
Zhou, G., Kresta, S.M., 1996. Impact of tank geometry on the maximum turbulenceenergy dissipation rate for impellers. AICHE J. 42, 2476–2490.
Zwietering, Th.N., 1958. Suspending of solid particles in liquid by agitators. Chem.Eng. Sci. 8, 244–253.