Page 1
Chemical Fractions and Prediction for Long-term Releases of
Phosphorus in Typical Canadian Agricultural Soils
by
Aruna Kanthi Withana Herath
A Thesis
presented to
The University of Guelph
In partial fulfillment of the requirements
for the degree of
Doctor of Philosophy
in
Environmental Sciences
Guelph, Ontario, Canada
© Aruna Withana Herath, April, 2013
Page 2
ABSTRACT
CHEMICAL FRACTIONS AND PREDICTION FOR LONG-TERM RELEASES OF
PHOSPHORUS IN TYPICAL CANADIAN AGRICULTURAL SOILS
Aruna Withana Herath Co-Advisors: Dr. Gary Parkin University of Guelph, 2013 Dr. T. Q. Zhang
Phosphorus (P) pollution has been identified as the most significant agriculture-related
threat to water quality impairment in Canada. One approach to reduce P pollution is to
identify soils with high P loss potential and develop management strategies to minimize
that risk. This thesis contributes towards greater understanding of short- and long- term
P dynamics in soils to which different P sources had been applied (Chapters 3 and 4)
and improvement in the P measurements for determining long-term P loss potential
(Chapter 5). Chapter 3 evaluated immediate and residual effects of swine manure and
fertilizer on soil P. Soils were sampled from Brookston clay loam in south-western
Ontario, Canada which were treated with liquid (LM), solid (SM), composted (MC)
manure and fertilizer, only in the corn phase. Soils were analyzed using a modified
Hedley’s fractionation. All P sources influenced soil labile and moderately labile P in the
year of application, while MC and SM showed significant residual impacts in the
following year. Residual effects of MC and SM are beneficial for crops; however, there
may be a P loss potential through leaching/runoff.
Chapter 4 considered long-term effects of dairy manure slurry (DMS) and ammonium
nitrate (AN) on soil P. Soils were sampled from south coastal region of BC, Canada,
which were treated with DMS or AN at 50 or 100 kg NH4-N ha-1, and analyzed using a
Page 3
modified Hedley’s fractionation. DMS significantly increased labile and moderately
stable P in surface soil, indicating short- and long-term impacts on P availability and
loss potential.
Chapter 5 analyzed a new test to predict long-term soil P loss potential. Soils were
collected from four agro-ecological areas across Canada, and analyzed using Mehlich-
3, Olsen, Resin strips (RMS), FeO-strips, and new procedures: various combinations of
NaOH with and without EDTA, with four shaking periods. Statistically significant linear
and quadratic relationships between the RMS and NaOH with EDTA-P indicated that
the latter provide an efficient basis for predicting long-term soil P loss potential. A highly
significant relationship between RMS-P and 0.025M NaOH with EDTA-P indicates this
extractant was effective for measuring Total Releasable P.
Page 4
iv
Gratefully Dedicated
To
My loving
Amma and Thaththa
Who laid the foundation many years ago,
And
Whose values and vision have remained instrumental
up to
This moment of Accomplishment
Page 5
v
Acknowledgements
My special and lasting gratitude towards my advisory committee; Dr. Gary Parkin
(Advisor), Dr. Tiequan Zhang (Co-advisor), Dr. Michael Goss (Former advisor,
committee) and Dr. Ivan O’ Halloran (Committee), for their continuous support,
generosity and guidance throughout the period of my graduate studies and for their
invaluable contribution to bring my thesis to a successful completion.
I am very grateful to Dr. Tiequan Zhang for arranging funds for my research through
Agriculture and Agri-Food Canada, and also providing me with all the laboratory
facilities in his lab at Harrow experiment station. I would also like to thank Dr. Chantal
Hamel, Lead Researcher of the GAPS project, for arranging funds for my research. I
wish to thank Mary Ann Reeb and Brian Hohner from the Greenhouse and Processing
Crops Research Center, Agriculture and Agri-Food Canada, Harrow for technical
assistance. I also want to thank Ranee Pararajasingham and Glen Wilson at school of
Environmental Science for sharing some lab facilities.
I am very grateful to my loving parents for supporting me spiritually throughout my life.
To them I dedicate this thesis. Also, I wish to thank my loving sisters and brothers who
always kept me away from family responsibilities and encouraged me to concentrate on
my studies. I am heartily thankful them and their families for their unfailing love and
support throughout my life.
I wish to give warm thanks to all of my friends for their friendly encouragement during
this period and for their support during times of frustration. To my dearest friends and
relatives, there are too many of you to list, but you are present in my heart. Thanks all.
Page 6
vi
My warmest thank to my loved ones, Isuri, Thilini, and Sachin who are the true joy of my
life. They truly comforted me with unconditional love and support. I hope you always
know how proud I am of you, how grateful I am for you, and how much I love you.
More importantly, it is my greatest pleasure to acknowledge the most influential person
in my life, my husband, Dammika who was always ready to review my rough drafts and
provided me with important feedback. He gave his moral support and encouragement
throughout my graduate studies and always provides me love and laughter to my
everyday life. I cannot thank you enough.
Lastly, I offer my regards and blessings to all of those who supported me in any respect
during the completion of my graduate studies.
Page 7
vii
Table of Contents
Acknowledgements ......................................................................................................... v
Table of contents ............................................................................................................ vii
List of Tables ................................................................................................................... x
List of figures .................................................................................................................. xii
Chapter 1: General Introduction ...................................................................................... 1
1.1 Aims and Objectives .................................................................................................. 6
Chapter 2: General Literature Review ............................................................................. 8
2.1 Present concerns with soil phosphorus ………………….……….….….... .................. 8
2.2 Soil phosphorus forms and their availability ...............................…............. .............. 9
2.3 Soil phosphorus dynamics and transformations ……………….…..…..... ................ 11
2.3.1 Physical-chemical and chemical processes ……………………………. ................ 12
2.3.2 Biological processes ………………………………………….….…….....…. ............ 15
2.3.2.1 Mineralization …………………………..……………………….….…..…… ........... 16
2.3.2.2 Immobilization…………………………………………………….…...…..….. ......... 17
2.3.3 Effects of cropping ……………………………………………….…....….…. ............. 18
2.3.3.1 Effects of crop residue on soil phosphorus transformations .….….. .................. 18
2.3.3.2 Transformations of phosphorus in the rhizosphere ….…………...…. ................ 19
2.3.4 Effects of phosphate fertilizer application …………………….…...…… ................. 19
2.3.5 Effects of livestock manure application ………………………………… ................. 22
2.4 Soil phosphorus mobility ……………………….………………………….….. ............. 25
2.5 Soil phosphorus transport pathways ……………………………………… ................. 27
2.5.1 Factors affecting soil phosphorus loss ……………….…………….…… ................ 28
2.6 Analysis of soil phosphorus…………………………………………………… ............. 32
2.7 Soil phosphorus testing ………………….………………………………..….. .............. 36
2.8 Research Issue ……………………………………………………………….... ............. 45
Chapter 3: Immediate and residual effects of different forms of swine manure on soil
phosphorus fractions in a clay loam soil under corn-soybean rotation .......................... 48
Page 8
viii
3.1 Abstract …………………………………………………………………………. ............. 48
3.2 Introduction ............................................................................................................. 49
3.3 Methodology ............................................................................................................ 53
3.3.1 Site descriptions……. ........................................................................................... 53
3.3.2 Treatments, soil sampling and Analysis ............................................................... 53
3.3.3 Hedley sequential phosphorus fractionation ......................................................... 55
3.3.4 Statistical analysis ………………………………………………………….... ............ 57
3.4 Results and discussion …………………………………… ......................................... 57
3.4.1 Labile and moderately labile inorganic P (H2O-P, Bicarb-Pi and NaOH-1-Pi)…… 58
3.4.2 Labile and moderately labile organic P (Bicarb-Po and NaOH-1-Po)…….…. ...... 64
3.4.3 Stable Phosphorus fraction (HCl-Pi +NaOH-2-P +Residual-P)………………….. . 68
3.4.4 Total inorganic P, Total organic P and Total P……………………..…. .................. 72
3.5 Conclusion …………………………………………………………………….. ............... 77
Chapter 4: Phosphorus fractions in a sandy loam soil following long-term applications of
dairy manure slurry and inorganic fertilizer .................................................................... 91
4.1 Abstract ………………………………………………………………….…..….. ............. 91
4.2 Introduction ……………………………………………………………………..………. .. 92
4.3 Materials and Methods ............................................................................................ 93
4.3.1 Site descriptions ................................................................................................... 93
4.3.2 Treatments and soil sampling............................................................................... 94
4.3.3 Soil phosphorus fractionation ............................................................................... 97
4.3.4 Statistical Analysis ……………………………………………………….…. .............. 97
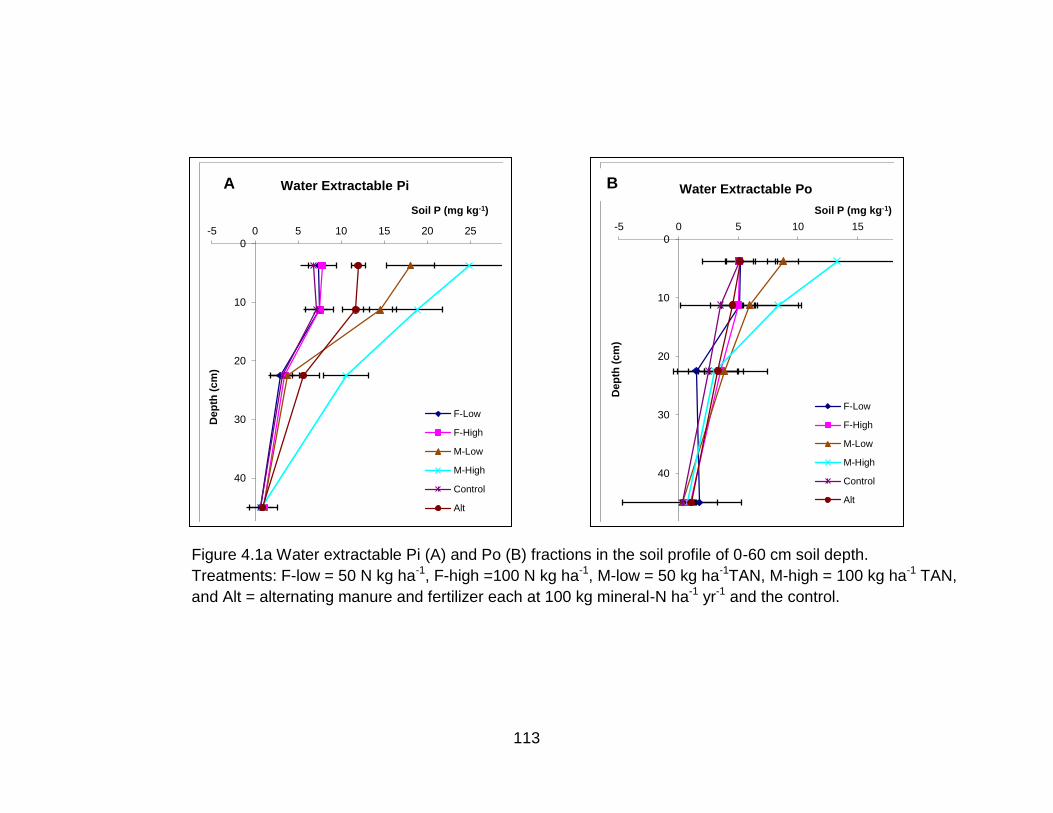
4.4 Results and Discussion……….………………………………..………....………….. ... 98
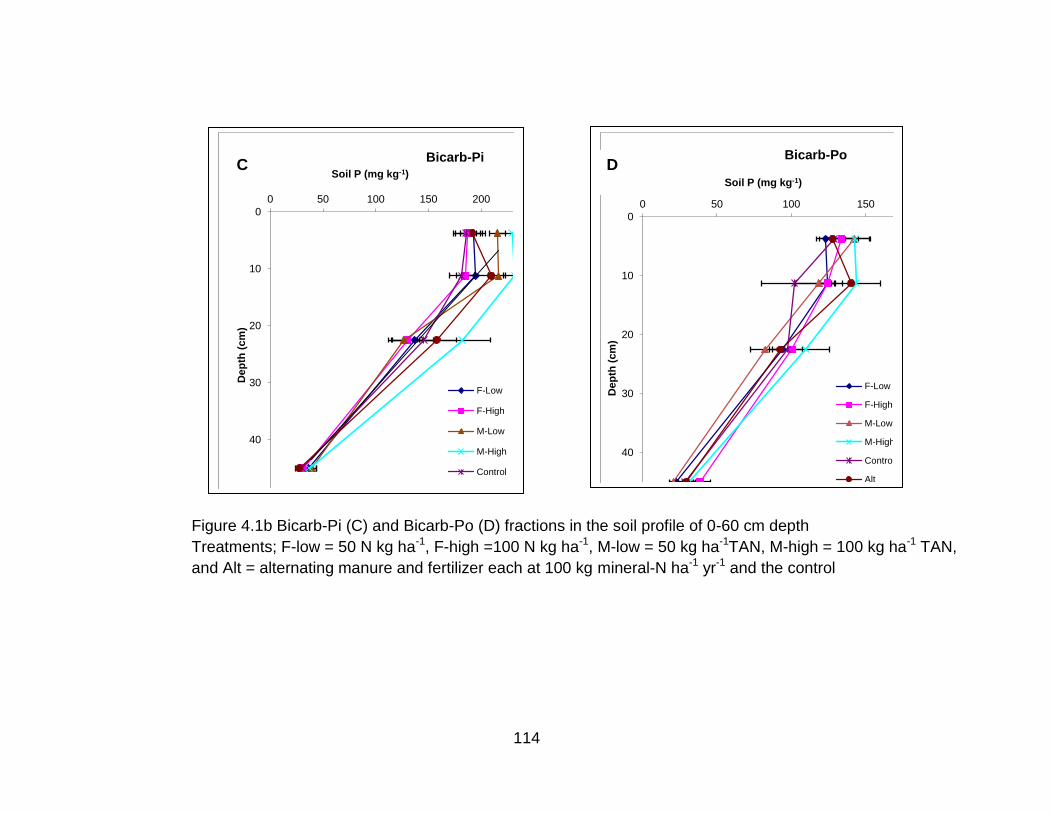
4.4.1 Labile phosphorus fraction (H2O-P and Bicarb-P) .............................................. 102
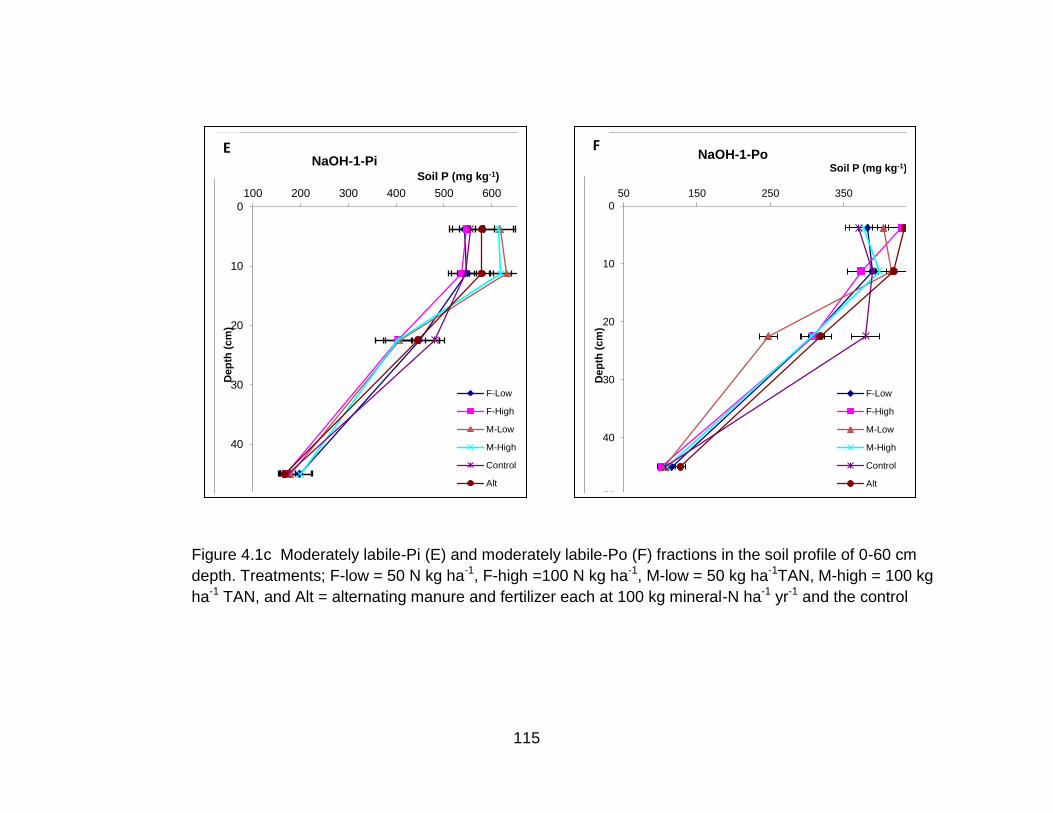
4.4.2 Moderately labile phosphorus fraction (NaOH-1-P) ............................................ 105
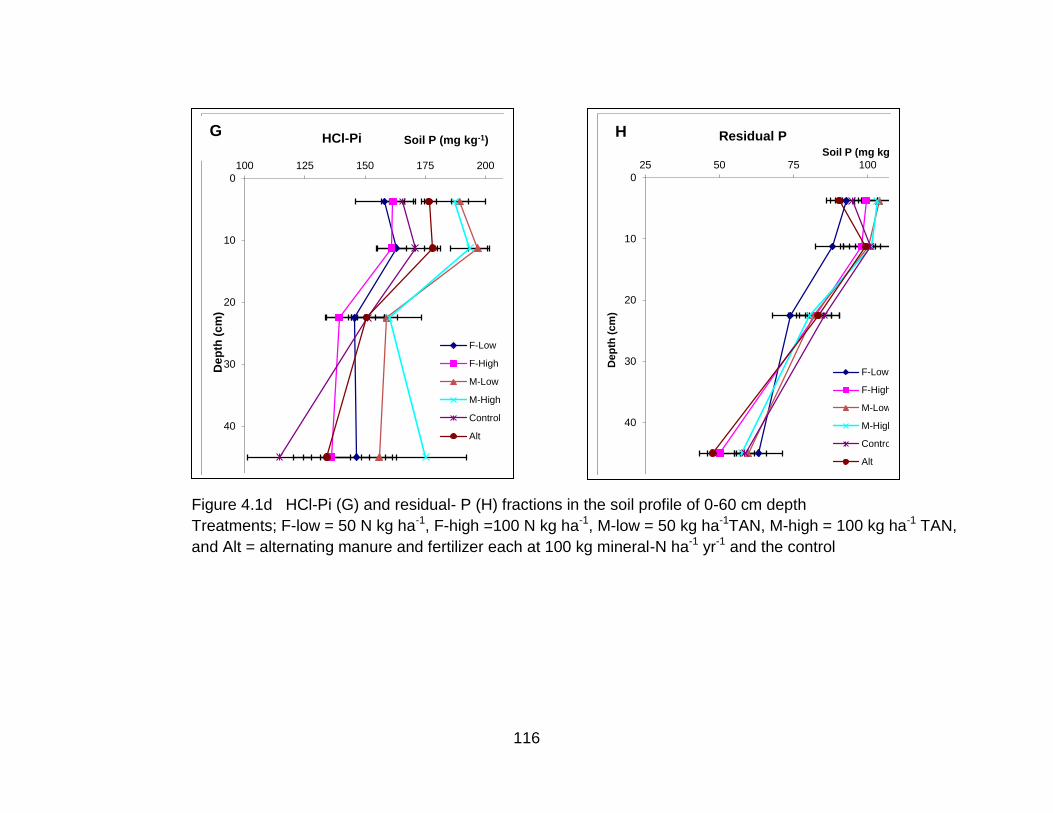
4.4.3 Moderately stable inorganic phosphorus fraction (HCl-Pi)……… ....................... 107
4.4.4 Stable phosphorus fraction ................................................................................. 109
4.4.5 Total inorganic, total organic and total P ............................................................ 110
4.5 Conclusions …………………………………………………………….…….……. ...... 112
Page 9
ix
Chapter 5: Development of a soil phosphorus test for predicting long-term soil
phosphorus losses ...................................................................................................... 120
5.1 Abstract ………………………………………………………………………… ............ 120
5.2 Introduction ……………………………………………………………………. ............. 121
5.3 Materials and Methods ………………………………………………………. ............. 128
5.3.1 Site and experiment descriptions …………………………………… .................... 128
5.3.2 Analysis of basic soil properties.………………………………….….. ................... 129
5.3.3 Soil Test Phosphorus………………………………………………………. ............. 133
5.3.3.1 Agronomic phosphorus tests………………………………………...…. .............. 137
5.3.3.2 Environmental phosphorus tests………………………………….... ................... 137
5.3.3.2.1 Anion resin membrane strips (RMS)... …………………………………..…..... 137
5.3.3.2.2 Iron oxide impregnated filter paper strips (FeO-strips).………….. ................ 138
5.3.3.3 Newly proposed extraction methods ……...……………………….... ................ 139
5.3.4 Statistical Analysis …………………………………………………………. ............. 140
5.4 Results and discussion ………………………………………………….……. ............ 141
5.4.1 Comparison of soil P extractability of existing agronomic and environmental soil P
tests…... . .................................................................................................................... 141
5.4.2 Comparison of phosphorus extracted by newly proposed mehods .................... 147
5.4.3 Correlations between amounts of P extracted by existing (agronomic and
environmental) soil P extraction methods and the cumulative amounts of P extracted by
resin membrane strips; “Total Releasable P” .............................................................. 157
5.4.4 Correlations between P extracted by newly proposed methods and the cumulative
amounts of P extracted by resin membrane strips; “Total Releasable Phosphorus” ... 158
5.4.5 Relationship between soil test phosphorus methods ……………………………. 161
5.5 Conclusion ………………………………………………………………………….…. .. 163
Chapter 6: Summary, Conclusions and Future Studies............................................... 181
6.1Summary and Conclusions .................................................................................... 181
6.1 Future studies ....................................................................................................... 187
Chapter 7: References ............................................................................................... 188
Page 10
x
List of Tables
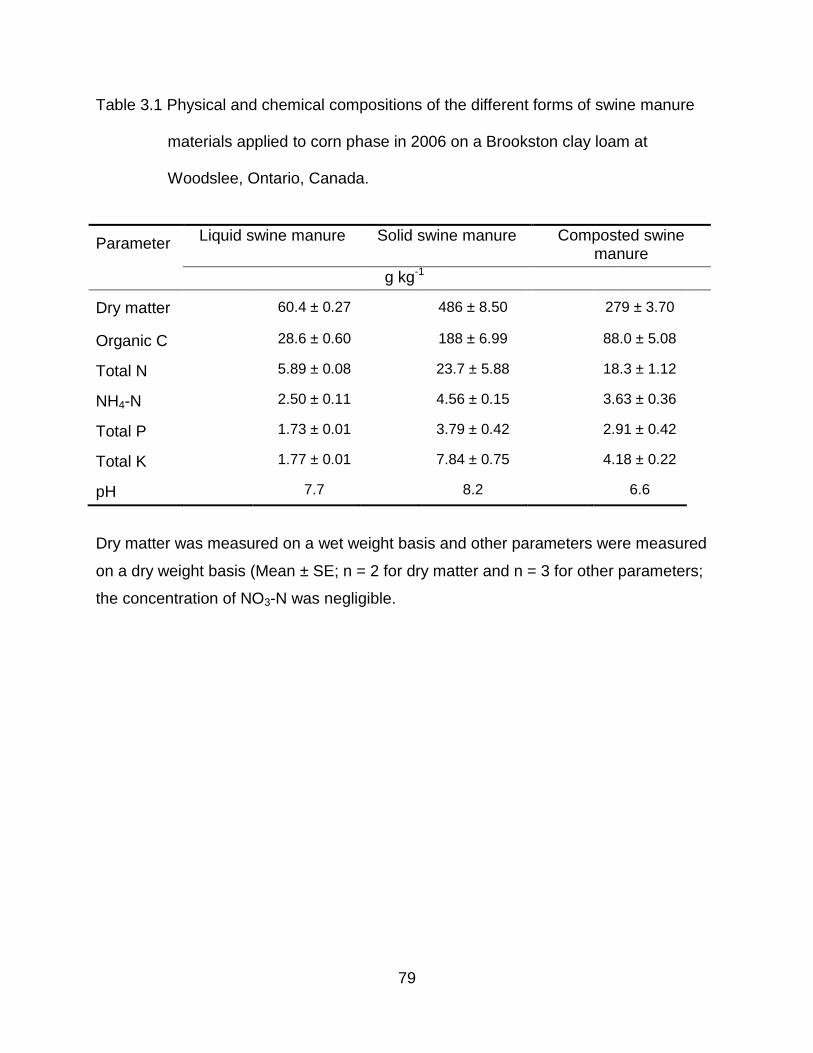
Table 3.1 Physical and chemical compositions of the different forms of swine manure
materials applied to corn phase in 2006 on a Brookston clay loam at Woodslee, Ontario,
Canada .......................................................................................................................... 79
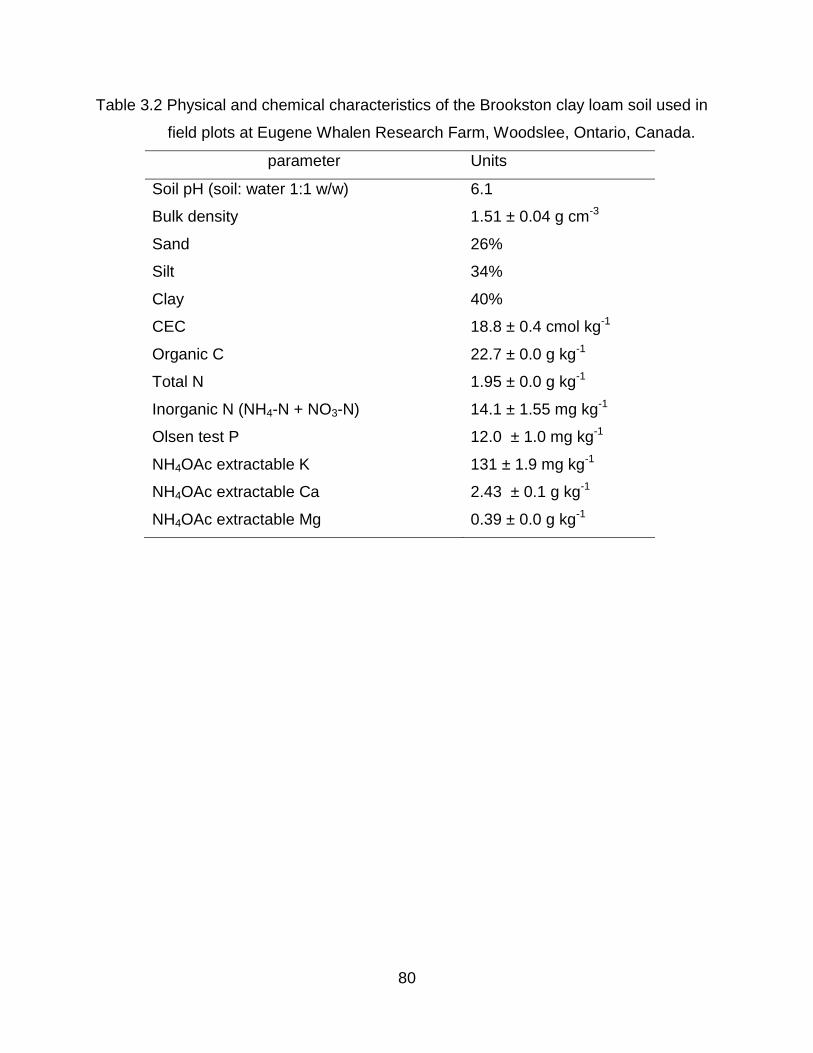
Table 3.2 Physical and chemical characteristics of the Brookston clay loam soil used in
field plots at Eugene Whalen Research Farm, Woodslee, Ontario, Canada ................. 80
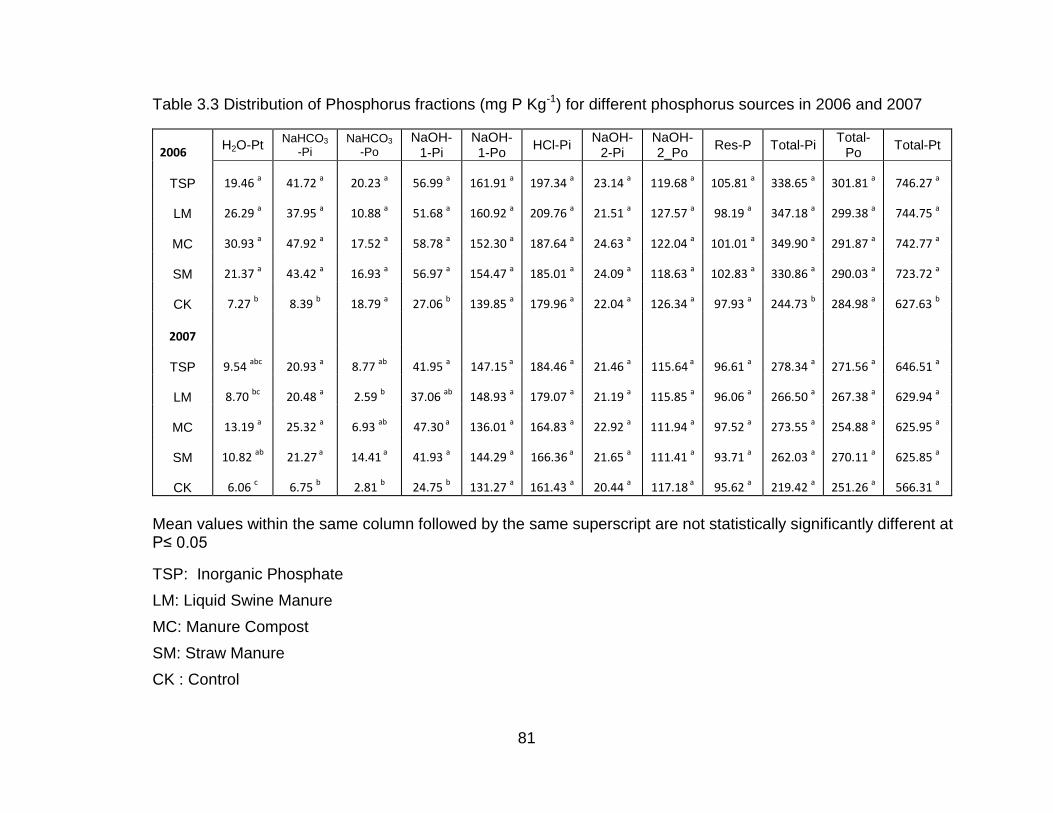
Table 3.3 Distribution of Phosphorus fractions (mg P Kg-1) for different phosphorus
sources in 2006 and 2007 ............................................................................................. 81
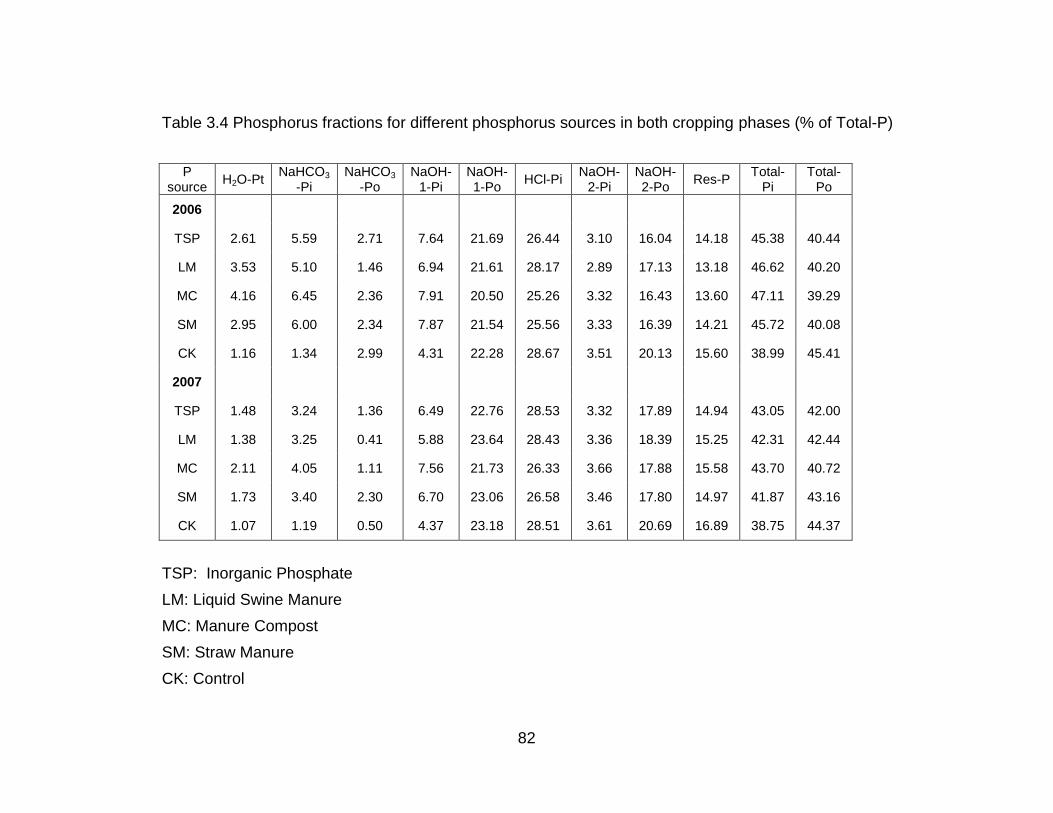
Table 3.4 Phosphorus fractions for different phosphorus sources in both cropping
phases (% of Total-P) .................................................................................................... 82
Table 3.5 The significance levels of Analysis of Variance (ANOVA) for main effects .... 83
Table 3.6 Treatment mean differences between 2006 and 2007, and their significant
levels of the Hedley P fractions ..................................................................................... 83
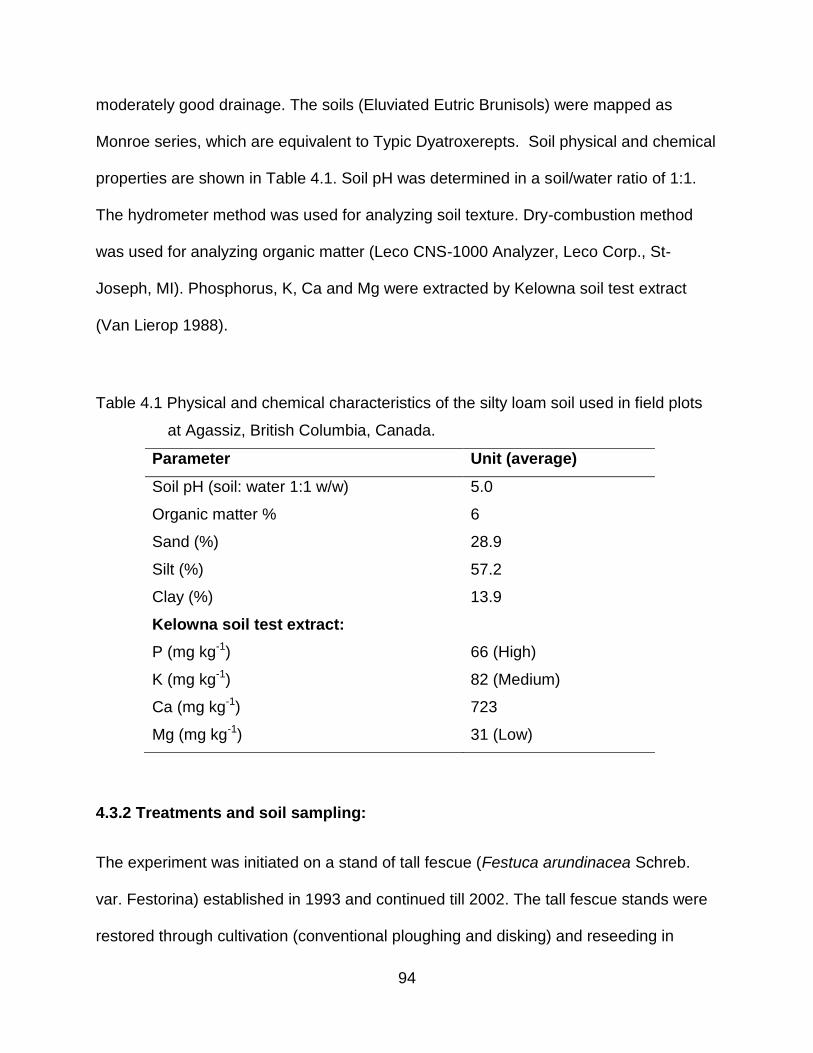
Table 4.1 Physical and chemical characteristics of the silty loam soil used in field plots
at Agassiz, British Columbia, Canada ........................................................................... 94
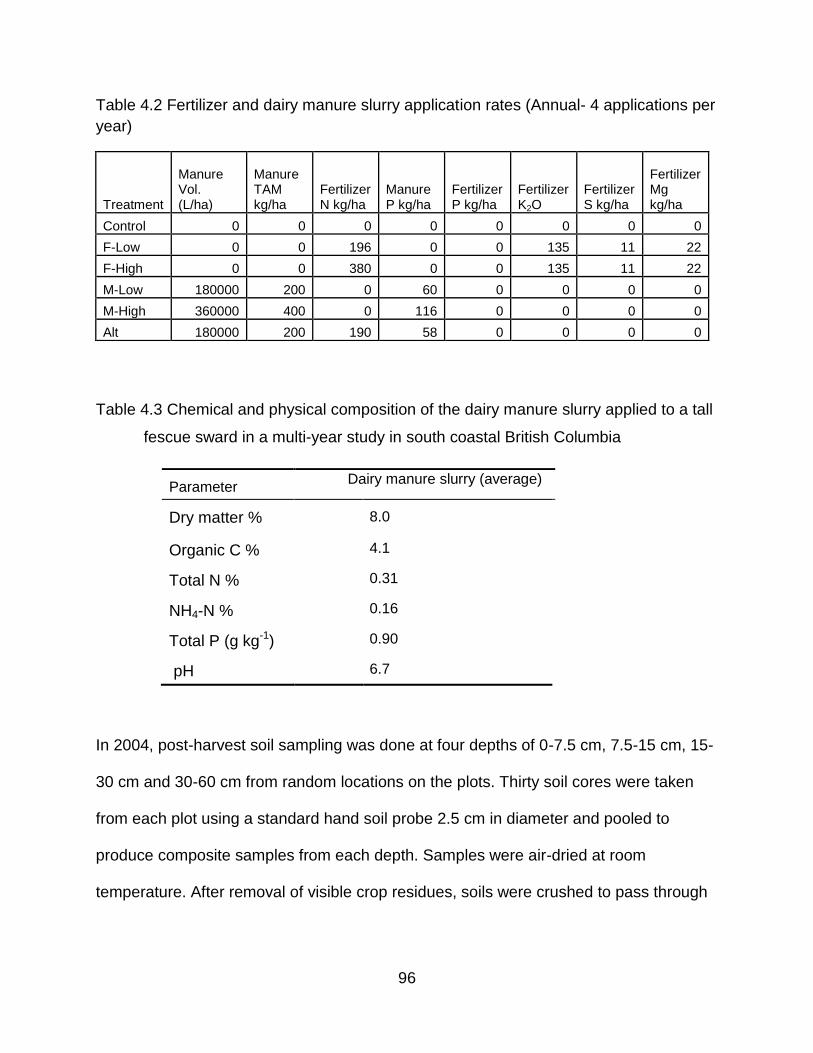
Table 4.2 Annual fertilizer and dairy manure slurry application rates (Four applications
per year) ........................................................................................................................ 96
Table 4.3 Chemical and physical composition of the dairy manure slurry applied to a tall
fescue sward in a multi-year study in south coastal British Columbia ........................... 96
Table 4.4 The significance levels of Analysis of Variance (ANOVA) for the main effects
(treatments, depth and the interaction and R2 values of the model ............................. 100
Page 11
xi
Table 4.5 Statistical significance of Depth comparisons from ANOVA (averaged over
treatments) ................................................................................................................. 100
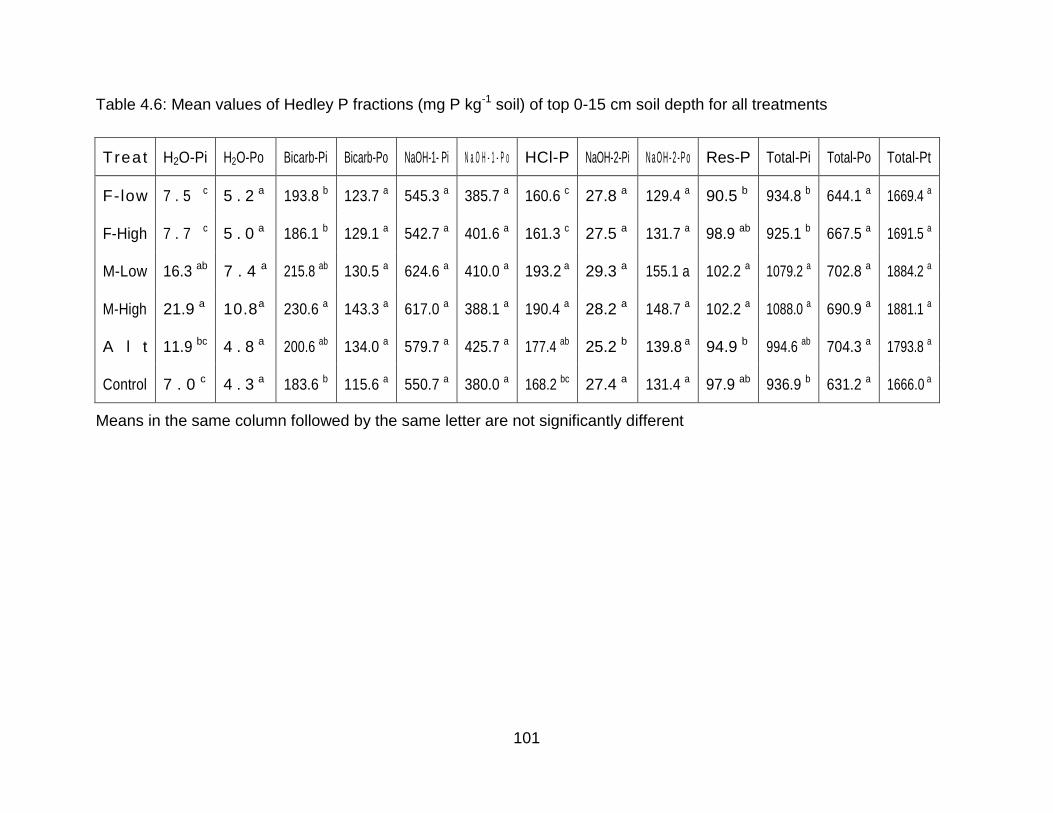
Table 4.6 Mean values of Hedley P fractions (mg P kg-1 soil) of top 0-15 cm soil depth
for all treatments ......................................................................................................... 101
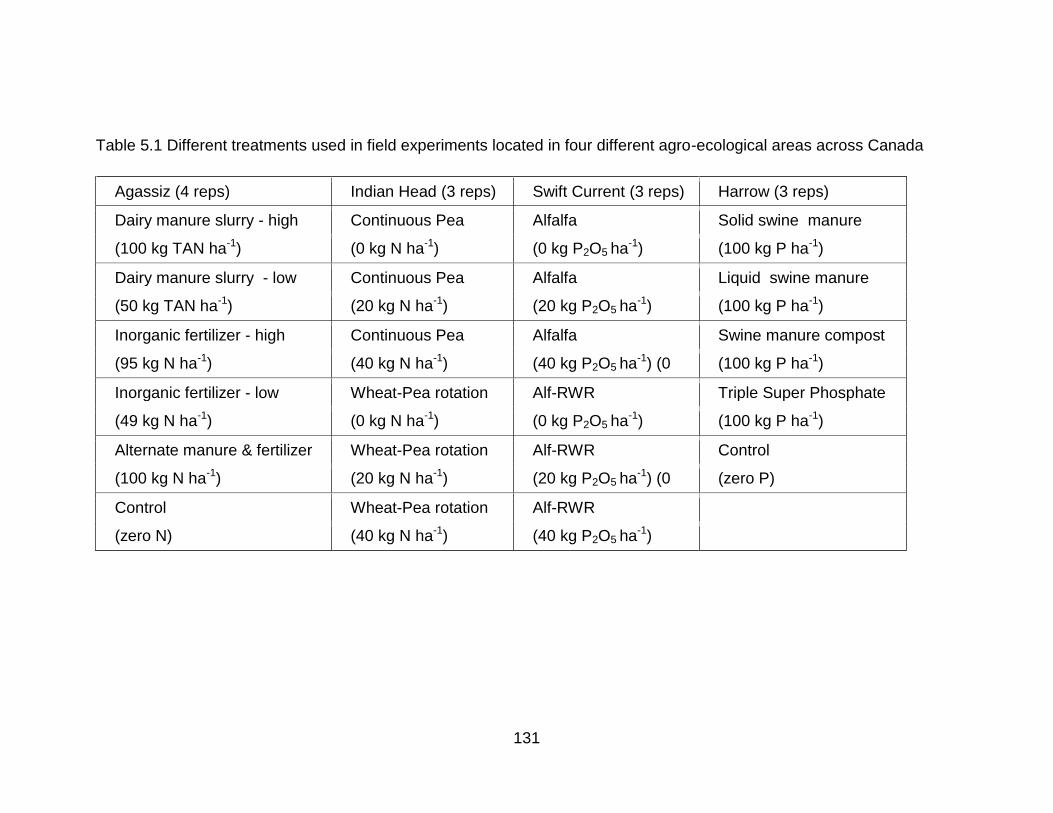
Table 5.1 Different treatments used in field experiments located in four different agro-
ecological areas across Canada ................................................................................. 131
Table 5.2 Physical and chemical characteristics of the soils of field experiments located
in four different agro-ecological areas across Canada ................................................ 132
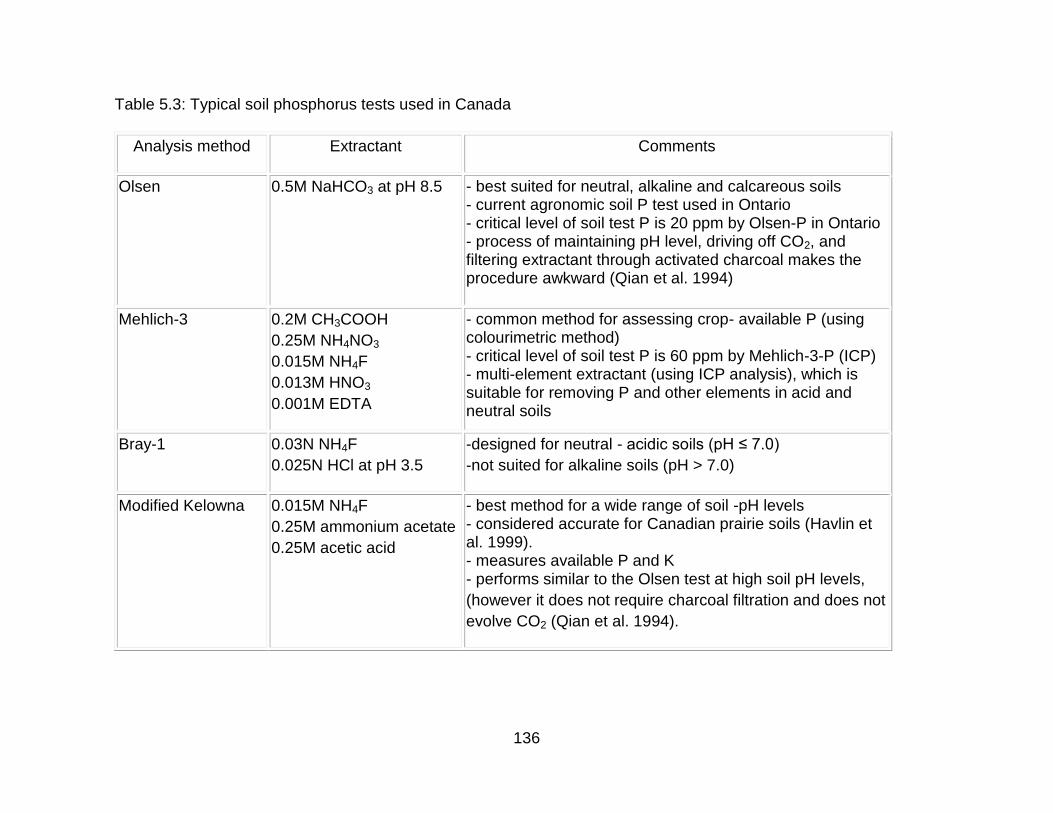
Table 5.3 Typical soil phosphorus tests used in Canada ............................................ 136
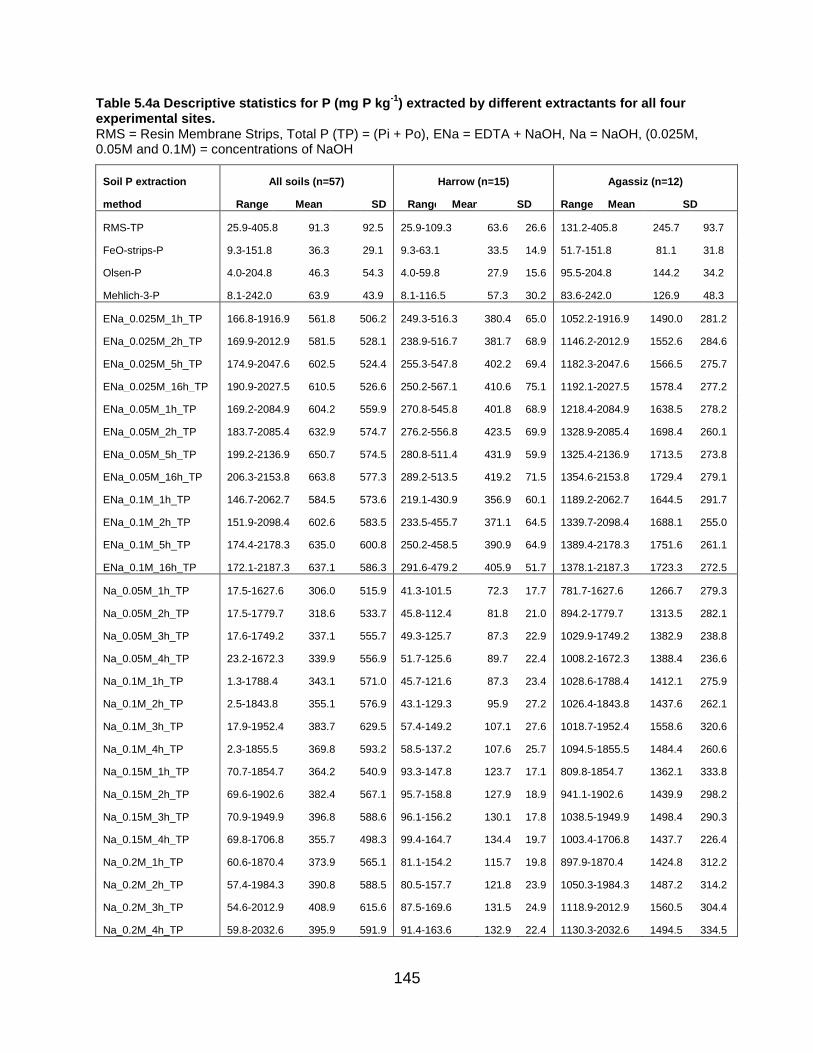
Table 5.4a Descriptive statistics for P (mg P kg-1) extracted by different extractants for
all four sites. RMS = Resin Membrane Strips, Total P (TP) = (Pi + Po), ENa = EDTA +
NaOH, Na = NaOH ...................................................................................................... 145
Table 5.4b Descriptive statistics for P (mg P kg-1) extracted by different extractants for
all four sites. RMS = Resin Membrane Strips, Total P (TP) = (Pi + Po), ENa = EDTA +
NaOH, Na = NaOH ...................................................................................................... 146
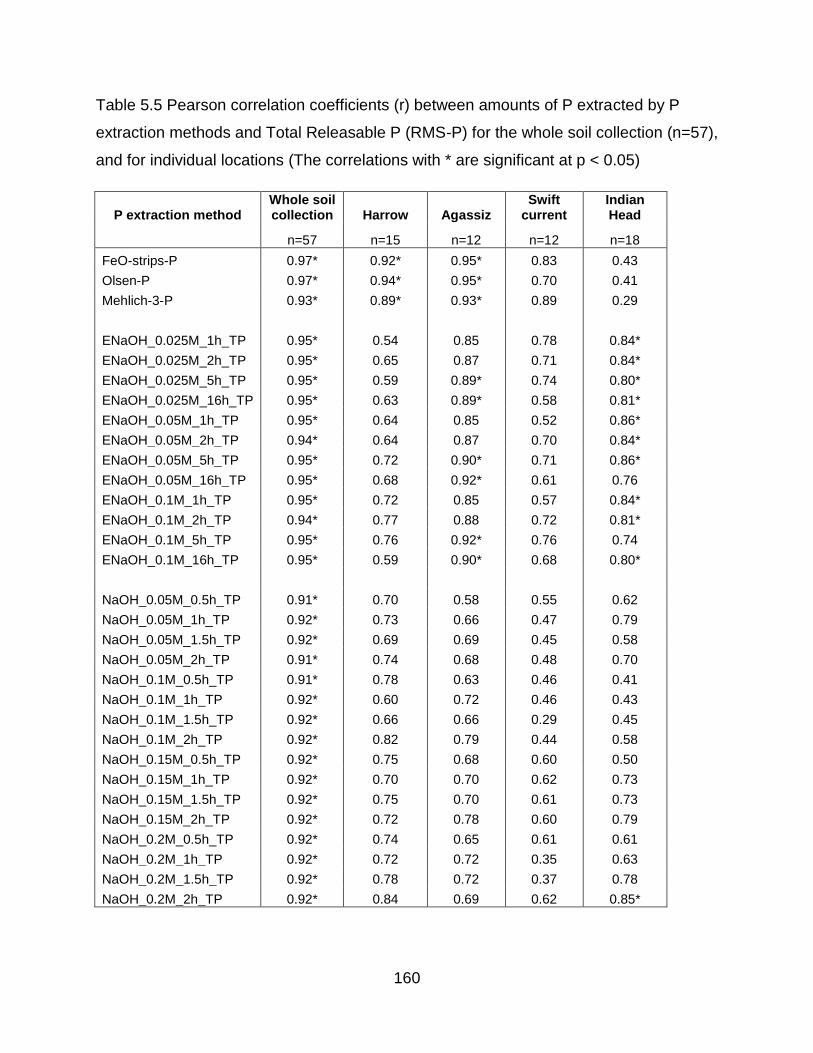
Table 5.5 Pearson correlation coefficients (r) between amounts of P extracted by P
extraction methods and Total Releasable P (RMS-P) for the whole soil collection (n=57),
and for different locations (The correlations with * are significant at P < 0.05) ............ 160
Page 12
xii
List of Figures
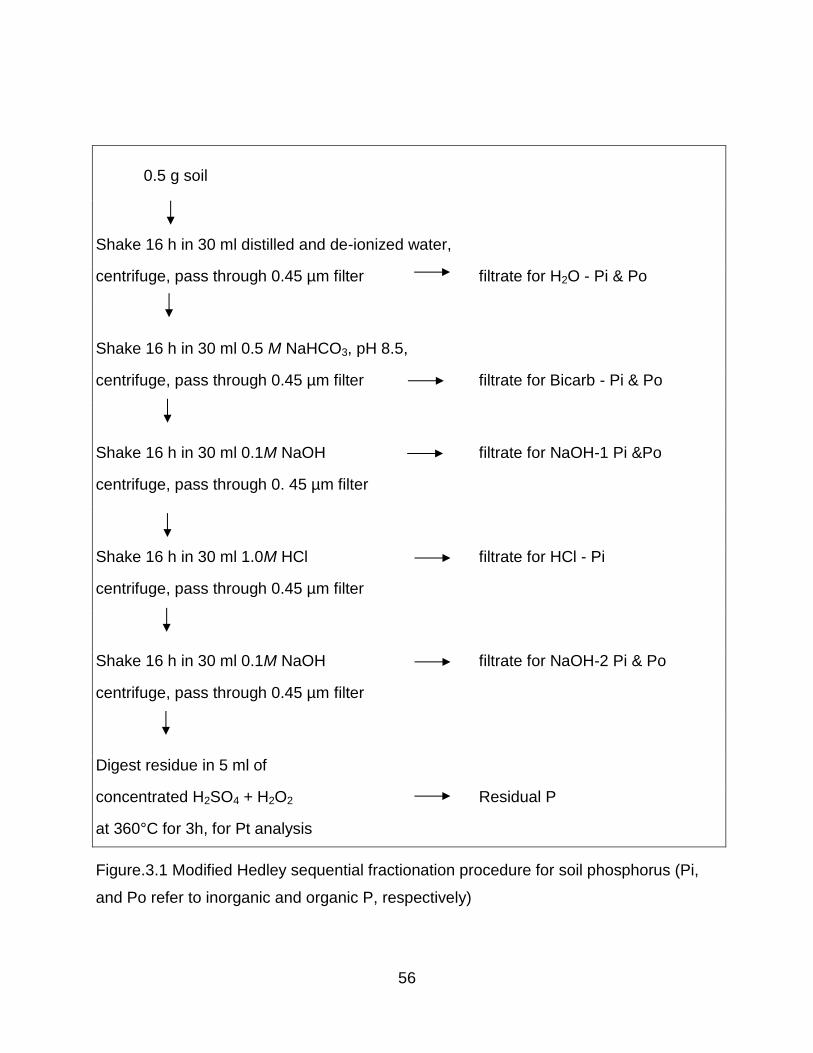
Figure 3.1 Modified Hedley sequential fractionation procedure for soil phosphorus (Pi,
Po and Pt refer to inorganic, organic and total P, respectively) ..................................... 56
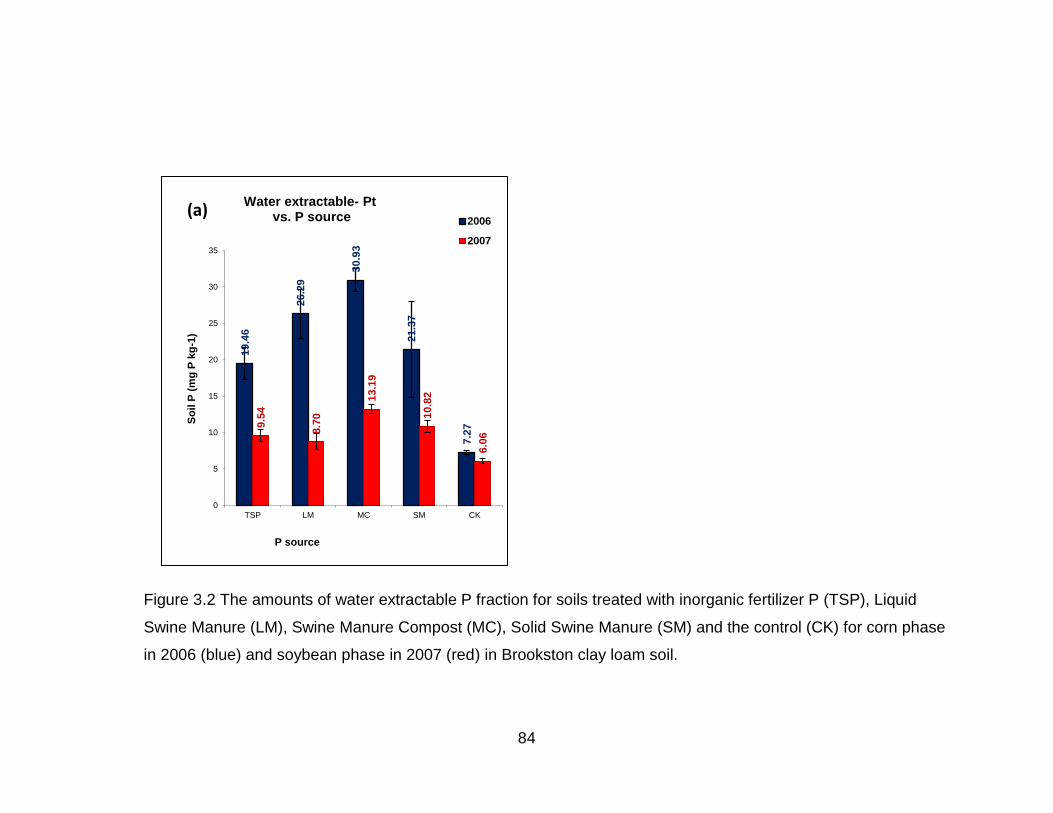
Figure 3.2 The amounts of water extractable P fraction for soils treated with inorganic
fertilizer P (TSP), Liquid Swine Manure (LM), Swine Manure Compost (MC), Solid
Swine Manure (SM) and the control (CK) for corn phase in 2006 (blue) and soybean
phase in 2007 (red) in Brookston clay loam soil ............................................................ 84
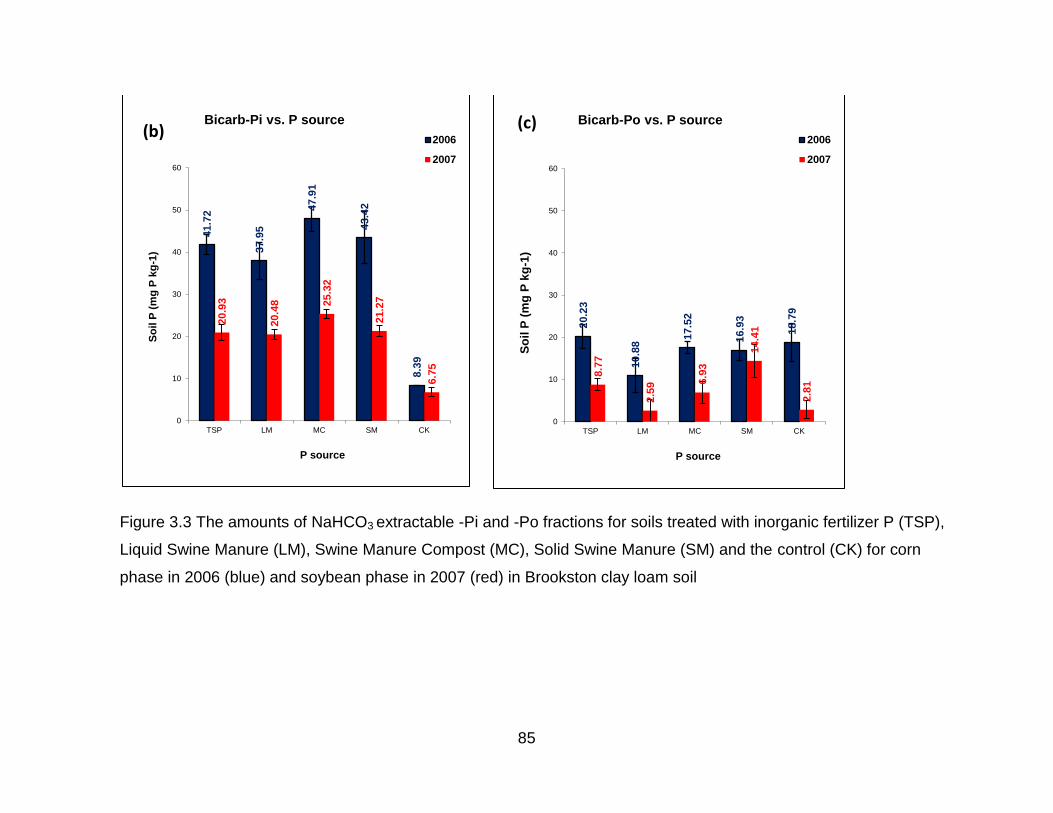
Figure 3.3 The amounts of NaHCO3 extractable Pi and Po fractions for soils treated with
inorganic fertilizer P (TSP), Liquid Swine Manure (LM), Swine Manure Compost (MC),
Solid Swine Manure (SM) and the control (CK) for corn phase in 2006 (blue) and
soybean phase in 2007 (red) in Brookston clay loam soil ............................................. 85
Figure 3.4 The amounts of NaOH-1 extractable -Pi and -Po fractions for soils treated
with inorganic fertilizer P (TSP), Liquid Swine Manure (LM), Swine Manure Compost
(MC), Solid Swine Manure (SM) and the control (CK) for corn phase in 2006 (blue) and
soybean phase in 2007(red) in Brookston clay loam soil .............................................. 86
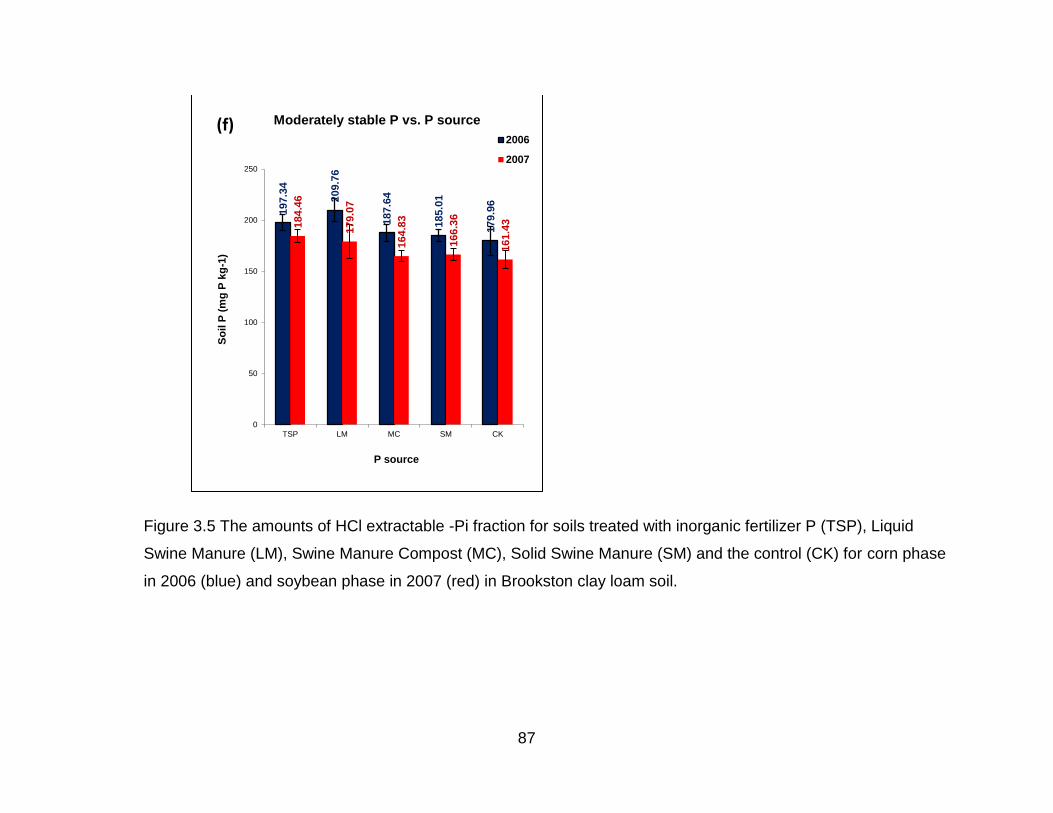
Figure 3.5 The amounts of HCl extractable -Pi fraction for soils treated with inorganic
fertilizer P (TSP), Liquid Swine Manure (LM), Swine Manure Compost (MC), Solid
Swine Manure (SM) and the control (CK) for corn phase in 2006 (blue) and soybean
phase in 2007 (red) in Brookston clay loam soil ............................................................ 87
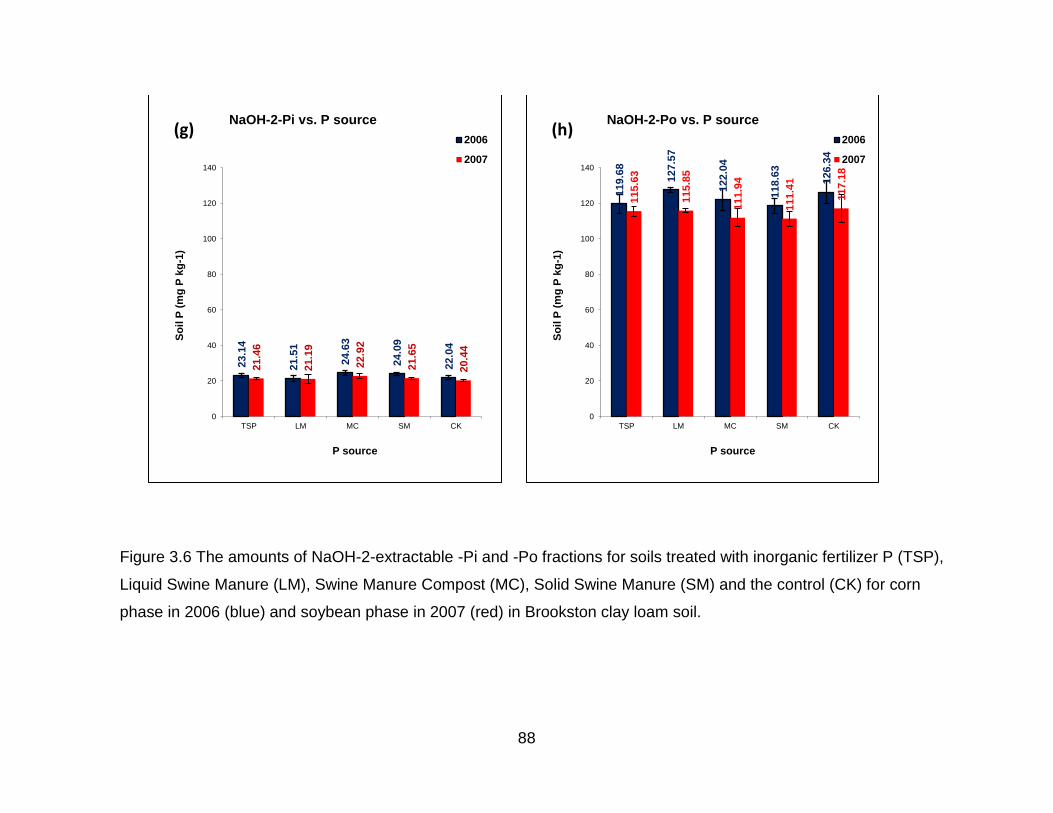
Figure 3.6 The amounts of NaOH-2 extractable -Pi and -Po fractions for soils treated
with inorganic fertilizer P (TSP), Liquid Swine Manure (LM), Swine Manure Compost
(MC), Solid Swine Manure (SM) and the control (CK) for corn phase in 2006 (blue) and
soybean phase in 2007 (red) in Brookston clay loam soil ............................................. 88
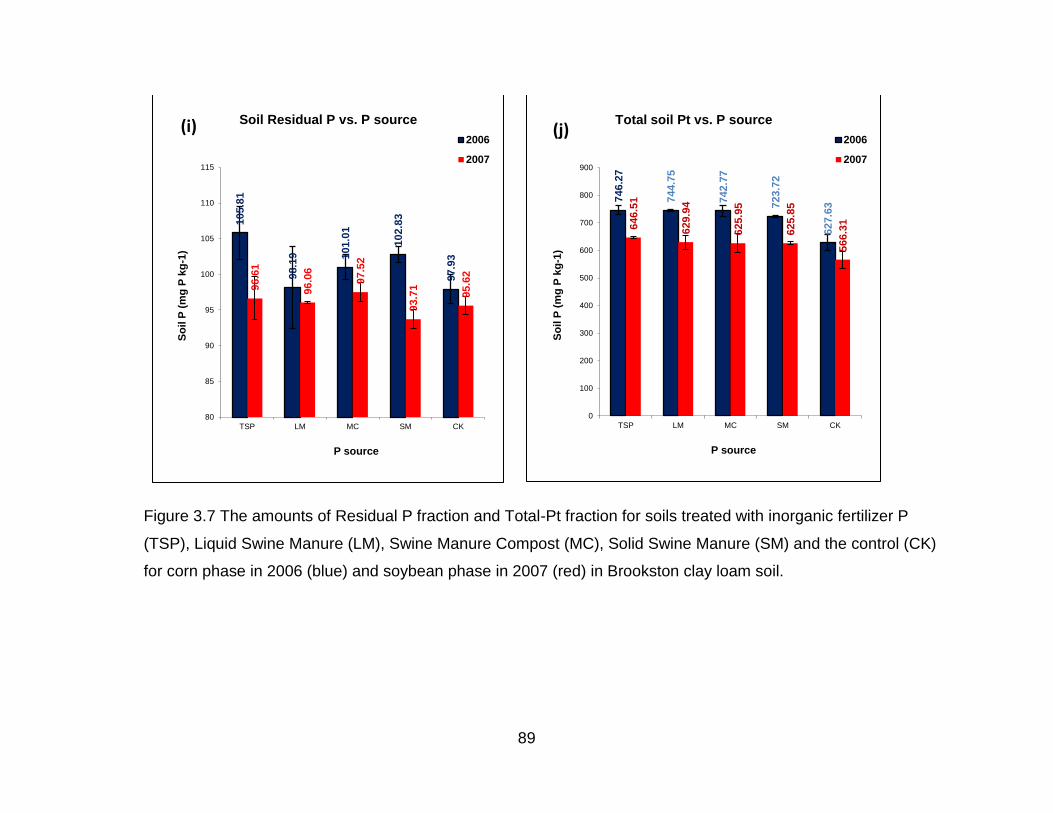
Figure 3.7 The amounts of Residual -P fraction and Total Pt fraction for soils treated
with inorganic fertilizer P (TSP), Liquid Swine Manure (LM), Swine Manure Compost
Page 13
xiii
(MC), Solid Swine Manure (SM) and the CK (CK) for corn phase in 2006 (blue) and
soybean phase in 2007 (red) in Brookston clay loam soil ............................................. 89
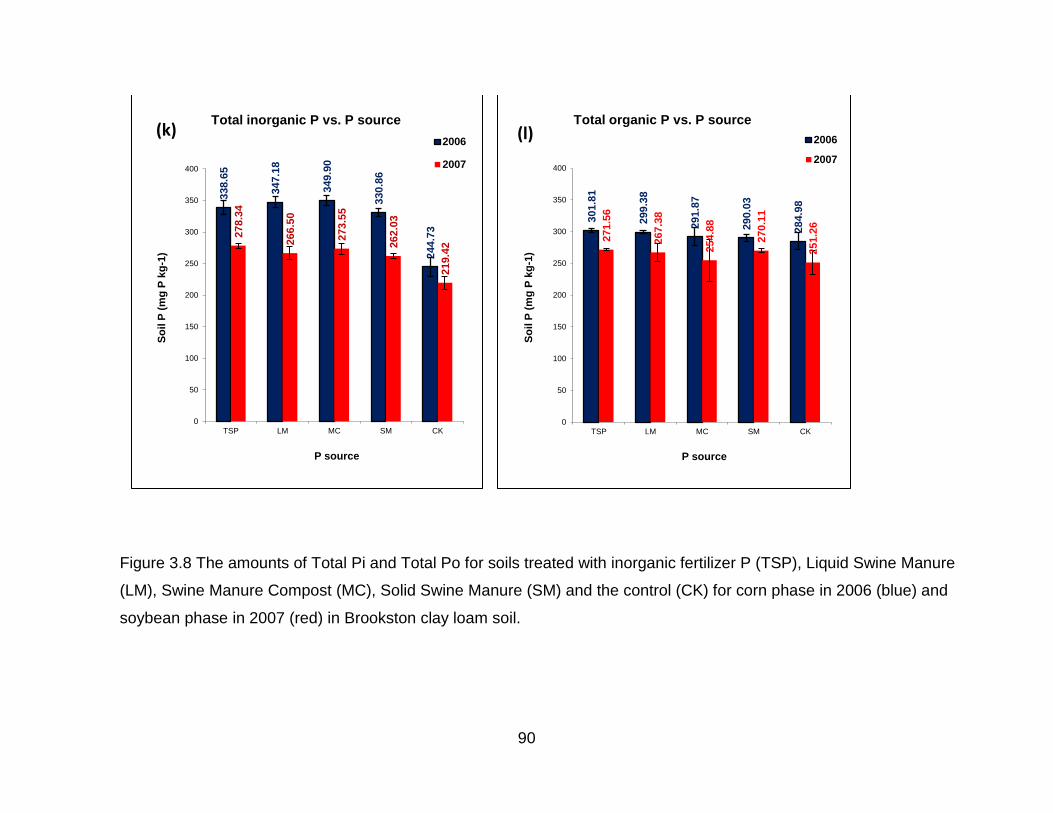
Figure 3.8 The amounts of Total-Pi and Total-Po fractions for soils treated with
inorganic fertilizer P (TSP), Liquid Swine Manure (LM), Swine Manure Compost (MC),
Solid Swine Manure (SM) and the control (CK) for corn phase in 2006 (blue) and
soybean phase in 2007 (red) in Brookston clay loam soil ............................................. 90
Figure 4.1a Water extractable Pi (A) and Po (B) fractions in the soil profile of 0-60 cm
soil depth ..................................................................................................................... 113
Figure 4.1b Bicarb-Pi (C) and -Po (D) fractions in the soil profile of 0-60 cm depth .... 114
Figure 4.1c Moderately labile-Pi (E) and moderately labile-Po (F) fractions in the soil
profile of 0-60 cm depth ............................................................................................... 115
Figure 4.1d HCl-Pi (G) and residual-P (H) fractions in the soil profile of 0-60 cm depth
.................................................................................................................................... 116
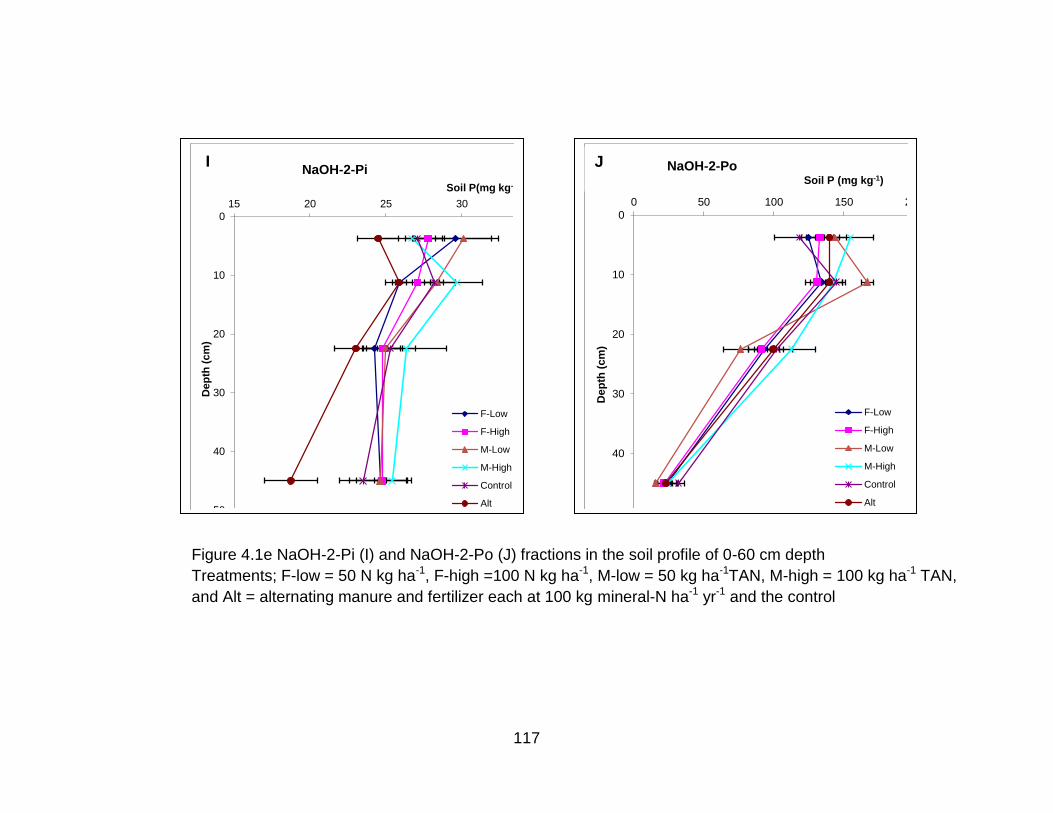
Figure 4.1e NaOH-2-Pi (I) and NaOH-2-Po (J) fractions in the soil profile of 0-60 cm
depth ........................................................................................................................... 117
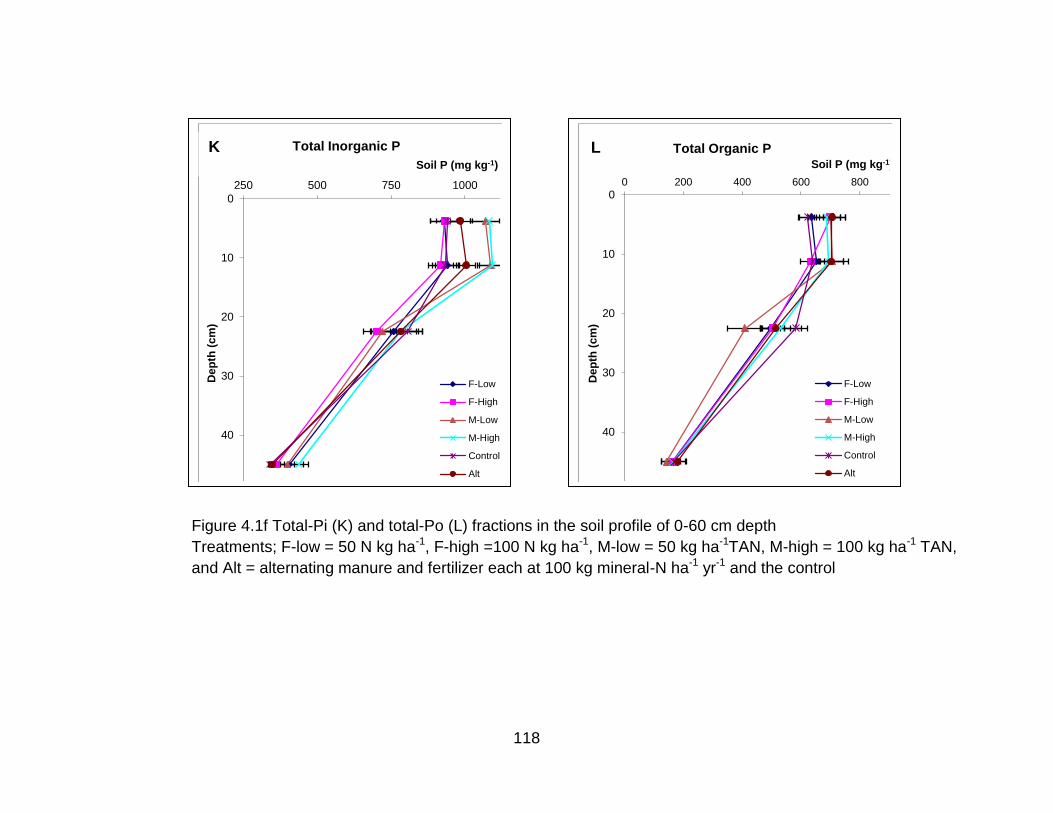
Figure 4.1f Total Pi (K) and total Po (L) fractions in the soil profile of 0-60 cm depth .. 118
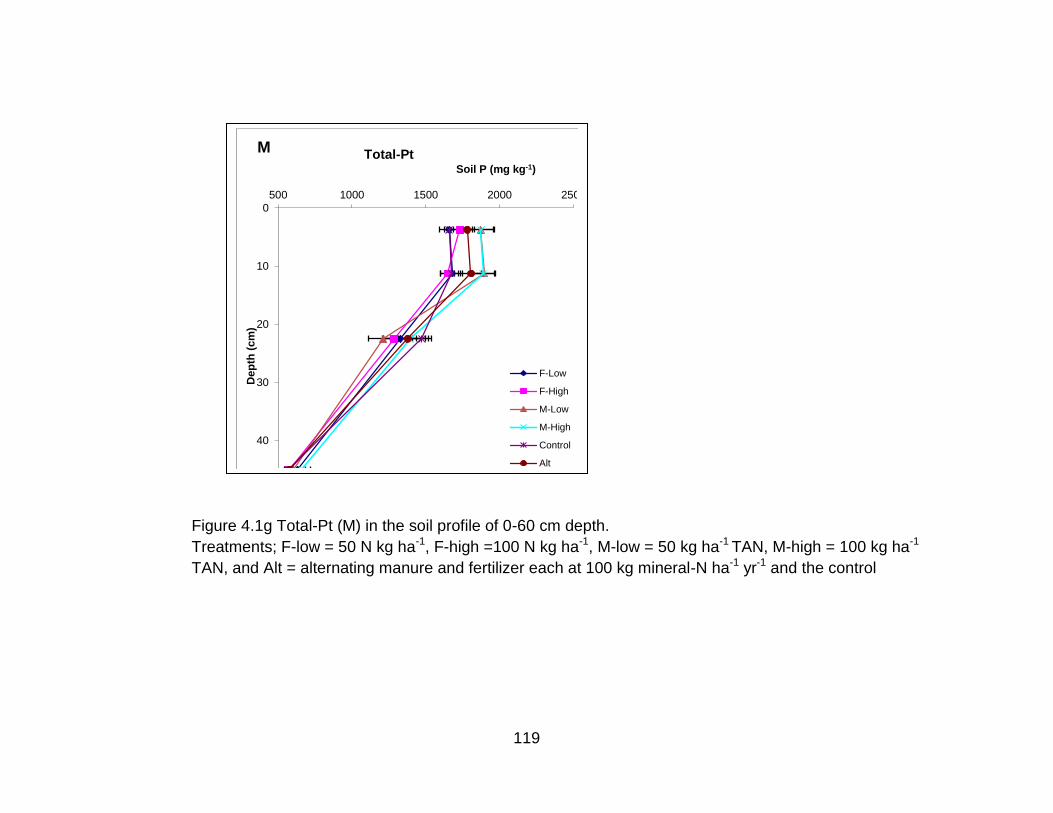
Figure 4.1g Total soil Pt (M) in the soil profile of 0-60 cm depth ................................. 119
Figure 5.1 Major soil types in the typical agro-ecological systems of Canada ............. 130
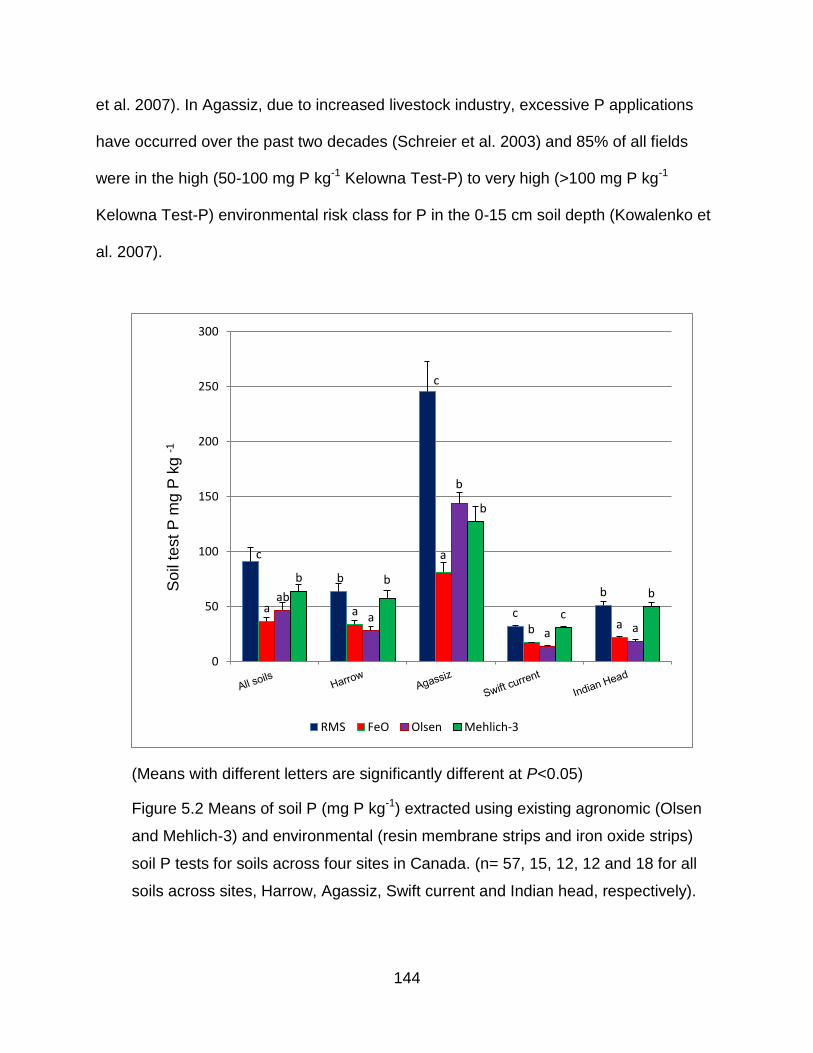
Figure 5.2 Means of soil P (mg P kg-1) extracted using agronomic and environmental
soil P extracting methods for soil samples collected from various field plots across four
sites in Canada ........................................................................................................... 144
Page 14
xiv
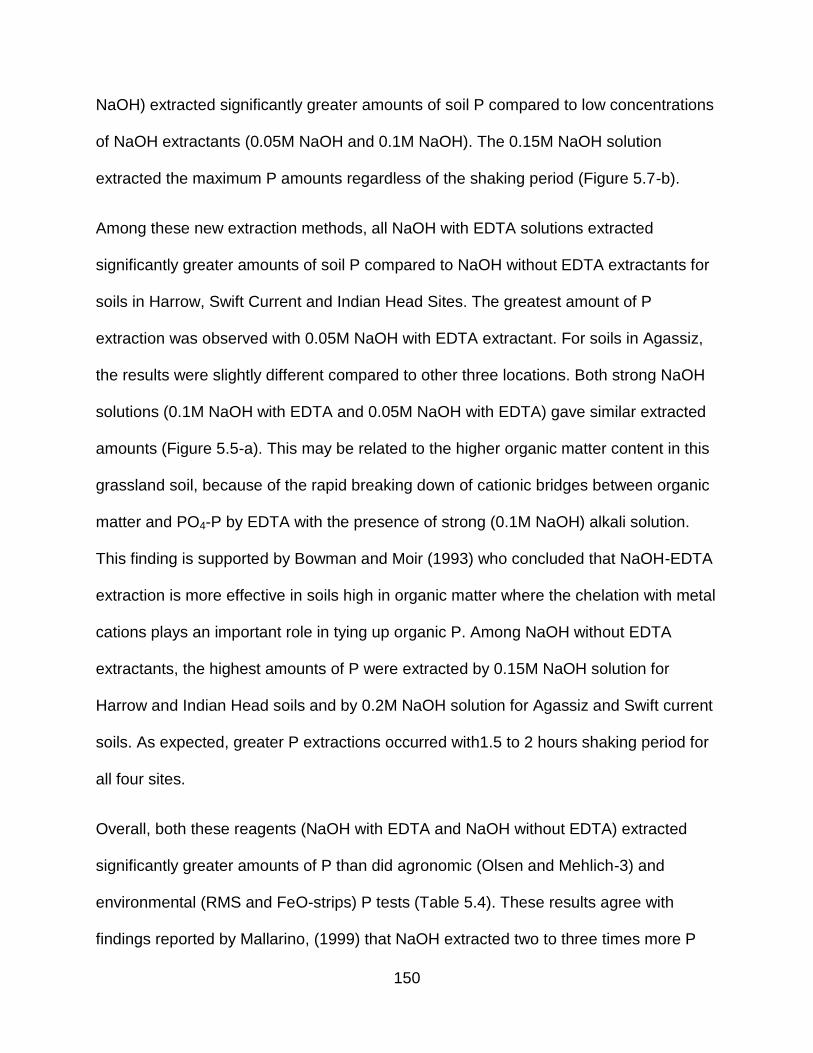
Figure 5.3 Means of soil P extracted using various concentrations of NaOH with EDTA
(a) and NaOH without EDTA (b) for four different shaking periods for soil samples
collected from various field plots across four sites in Canada ..................................... 152
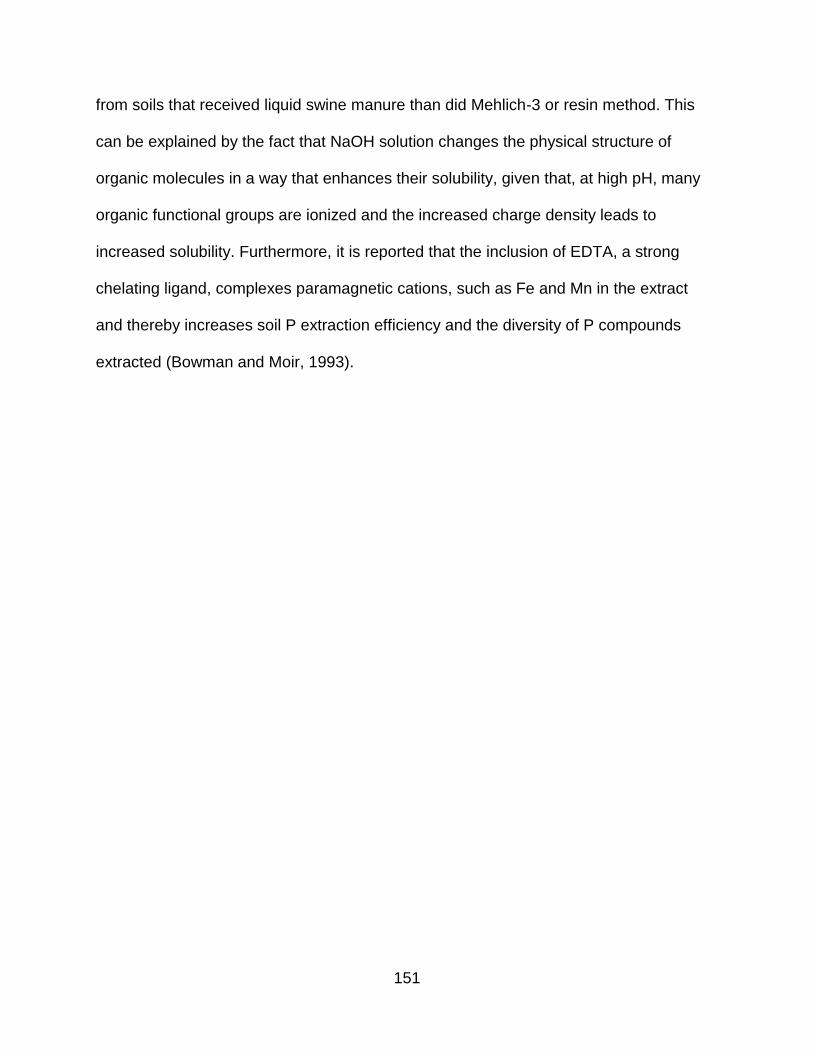
Figure 5.4 Means of soil P extracted using various concentrations of NaOH with EDTA
(a) and without EDTA (b) for four different shaking periods for soil samples collected
from Harrow field experimental plots ........................................................................... 153
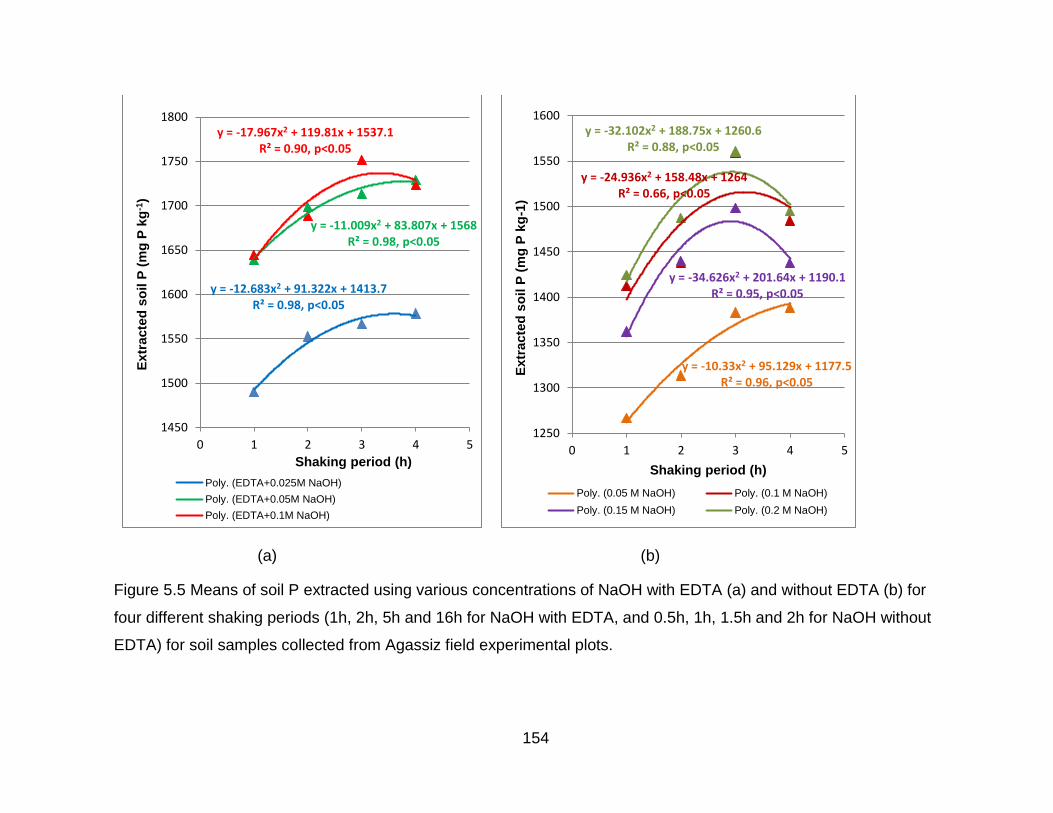
Figure 5.5 Means of soil P extracted using various concentrations of NaOH with EDTA
(a) and without EDTA (b) for four different shaking periods for soil samples collected
from Agassiz field experimental plots .......................................................................... 154
Figure 5.6 Means of soil P extracted using various concentrations of NaOH with EDTA
(a) and without EDTA (b) for four different shaking periods for soil samples collected
from Swift Current field experimental plots .................................................................. 155
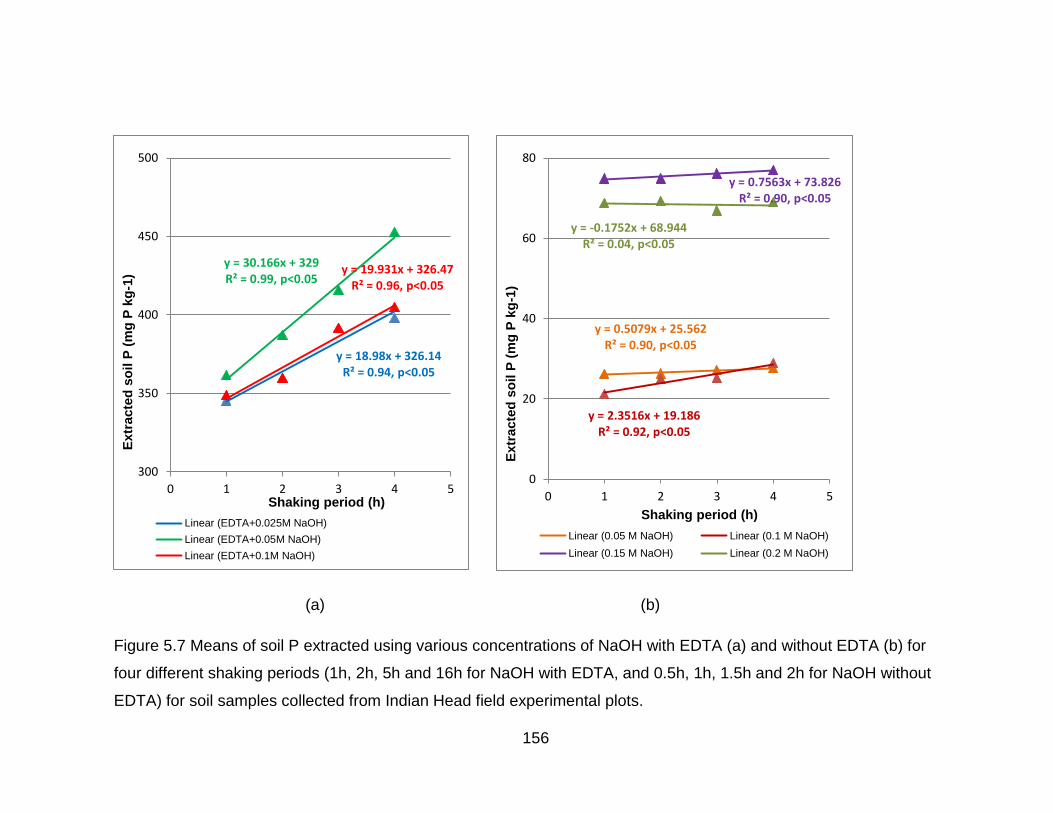
Figure 5.7 Means of soil P extracted using various concentrations of NaOH with EDTA
(a) and without EDTA (b) for four different shaking periods for soil samples collected
from Indian Head field experimental plots ................................................................... 156
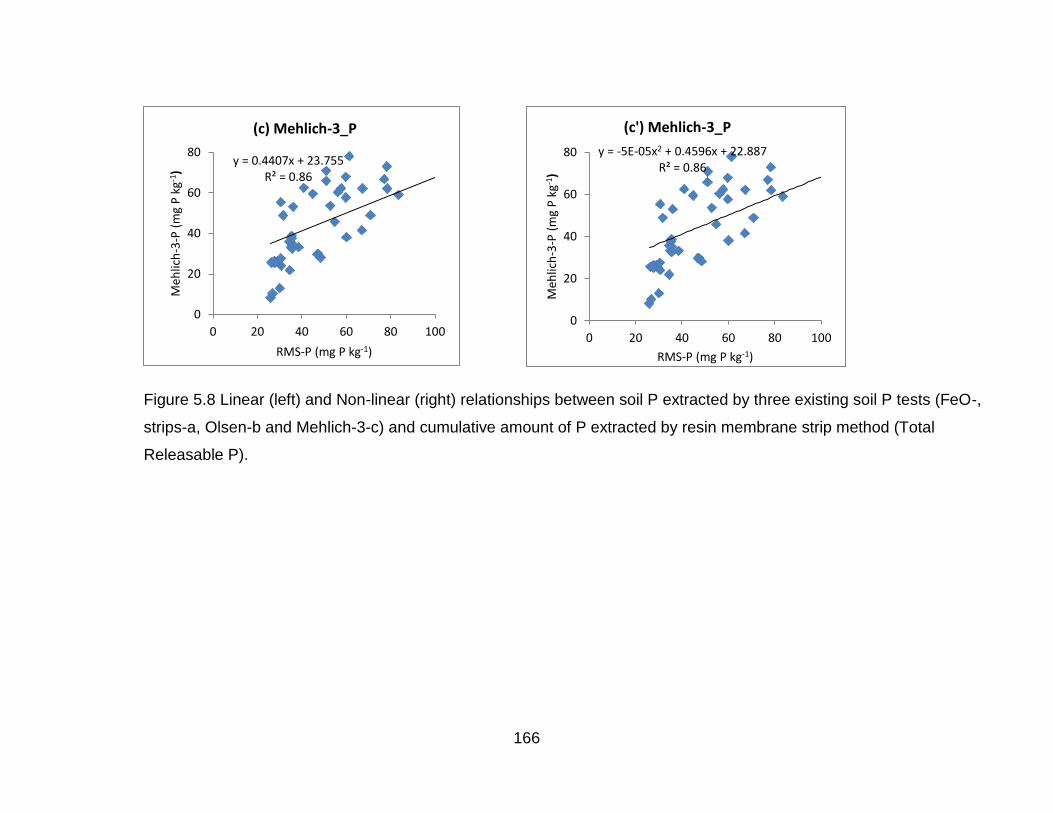
Figure 5.8 Linear (left) and Non-linear (right) relationships between soil P extracted by
three soil test P methods (FeO-strips, Olsen and Mehlich-3) and cumulative amount of
P extracted by resin membrane strip method (Total Releasable P) ............................ 166
Figure 5.9 Linear (left) and non-linear (right) relationships between soil P (mg P kg-1)
extracted by 0.025M NaOH + EDTA, and cumulative amount of P extracted by resin
membrane strip method (Total Releasable P) ............................................................. 168
Figure 5.10 Linear (left) and non-linear (right) relationships between soil P (mg P kg-1)
extracted by 0.05M NaOH + EDTA, and cumulative amount of P extracted by resin
membrane strip method (Total Releasable P) ............................................................. 170
Page 15
xv
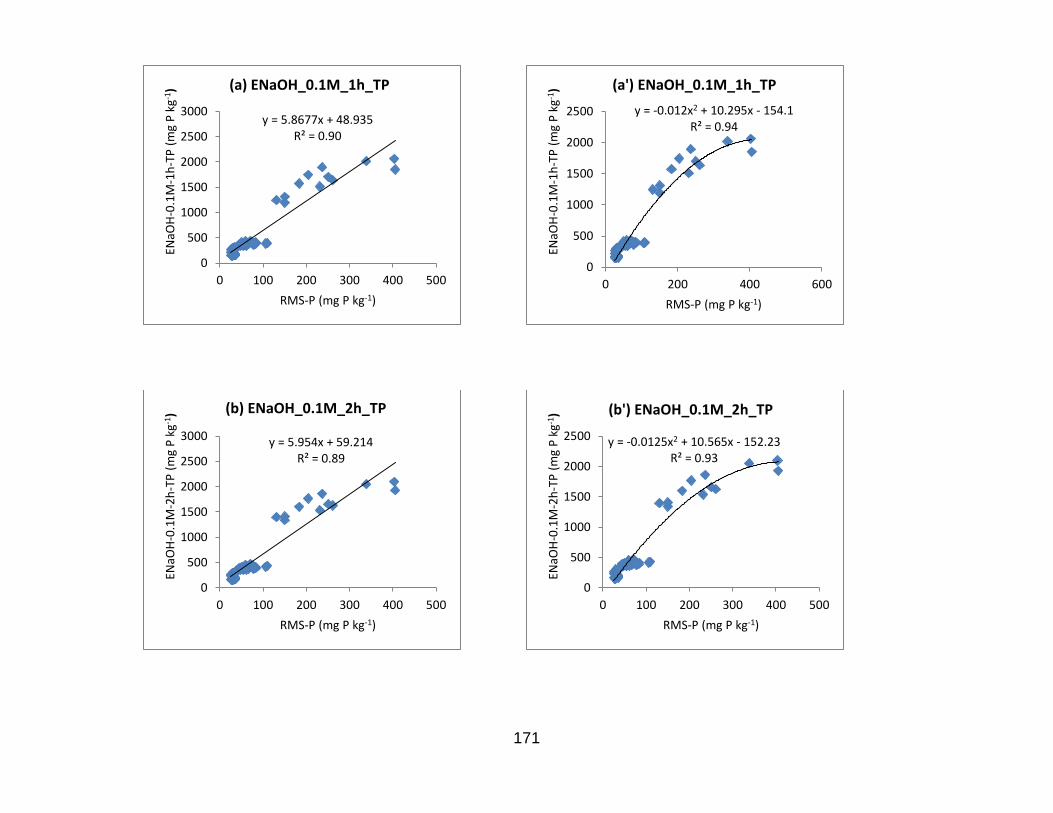
Figure 5.11 Linear (left) and non-linear (right) relationships between soil P (mg P kg-1)
extracted by 0.1M NaOH + EDTA, and cumulative amount of P extracted by resin
membrane strip method (Total Releasable P) ............................................................. 172
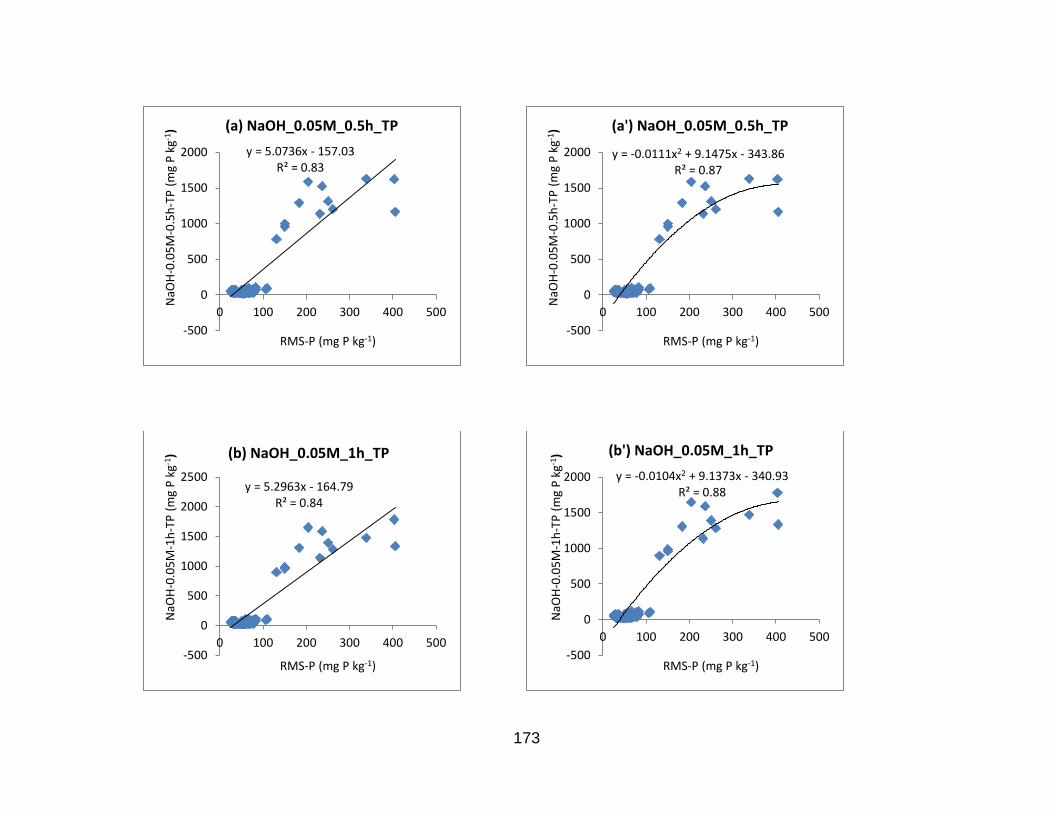
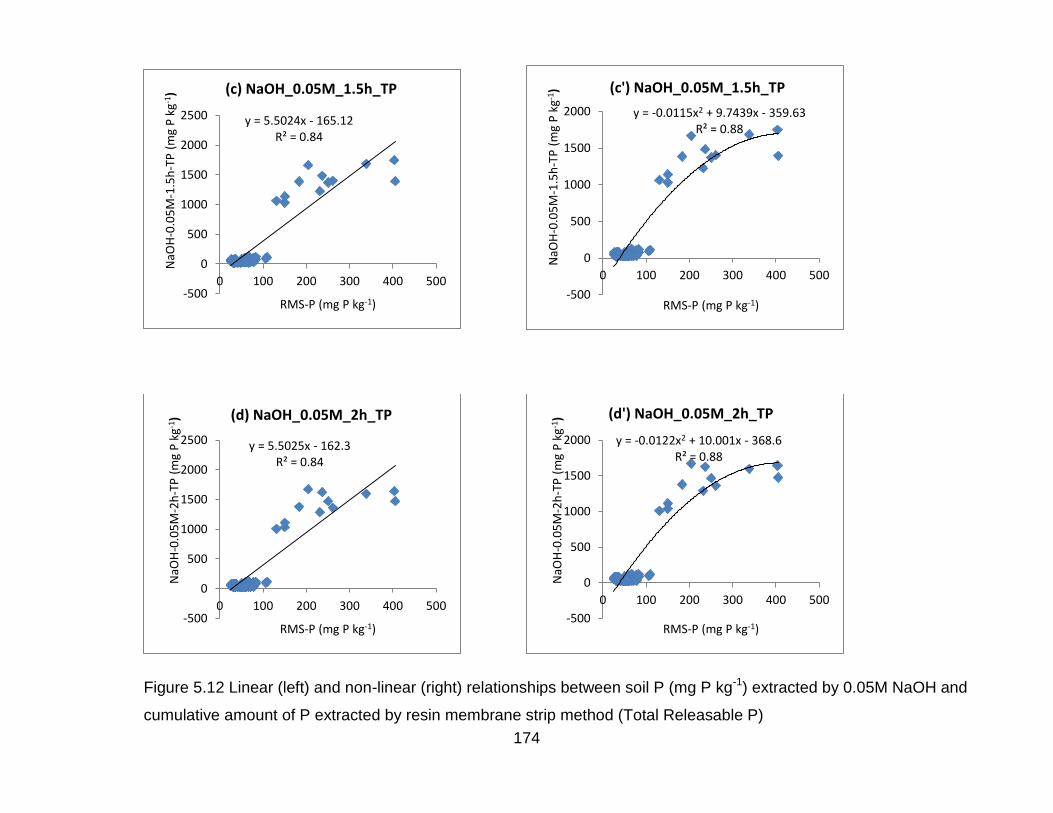
Figure 5.12 Linear (left) and non-linear (right) relationships between soil P (mg P kg-1)
extracted by 0.05M NaOH and cumulative amount of P extracted by resin membrane
strip method (Total Releasable P) ............................................................................... 174
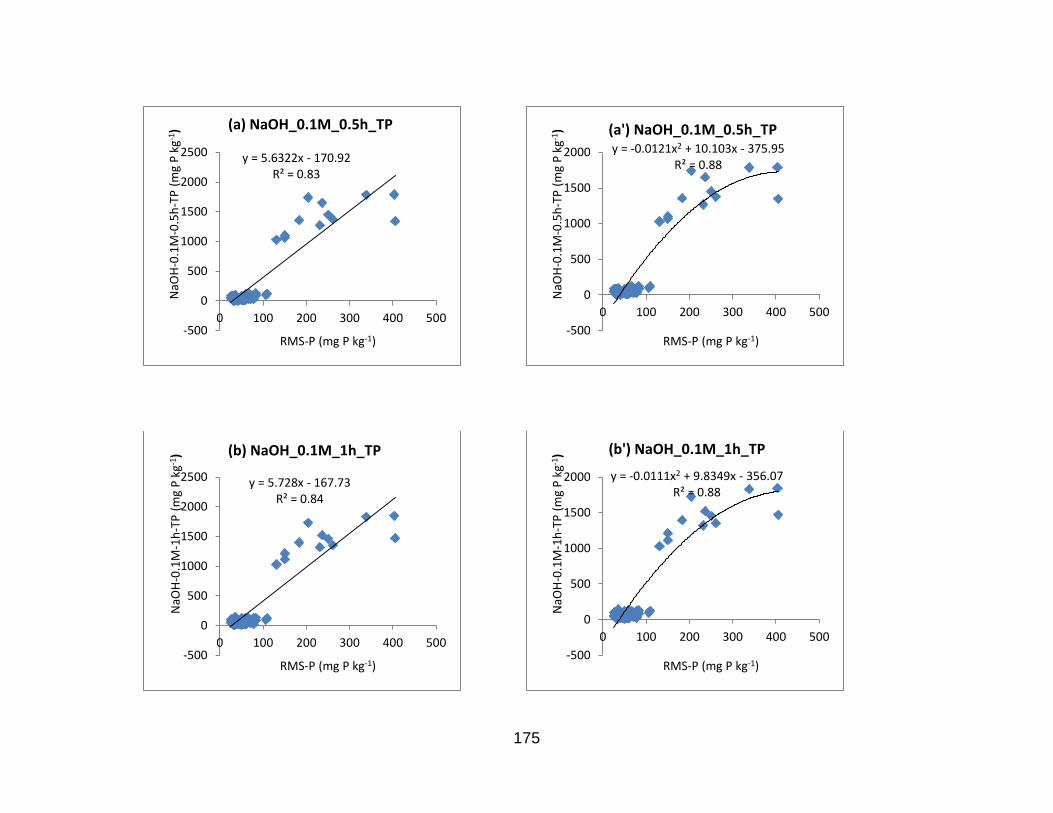
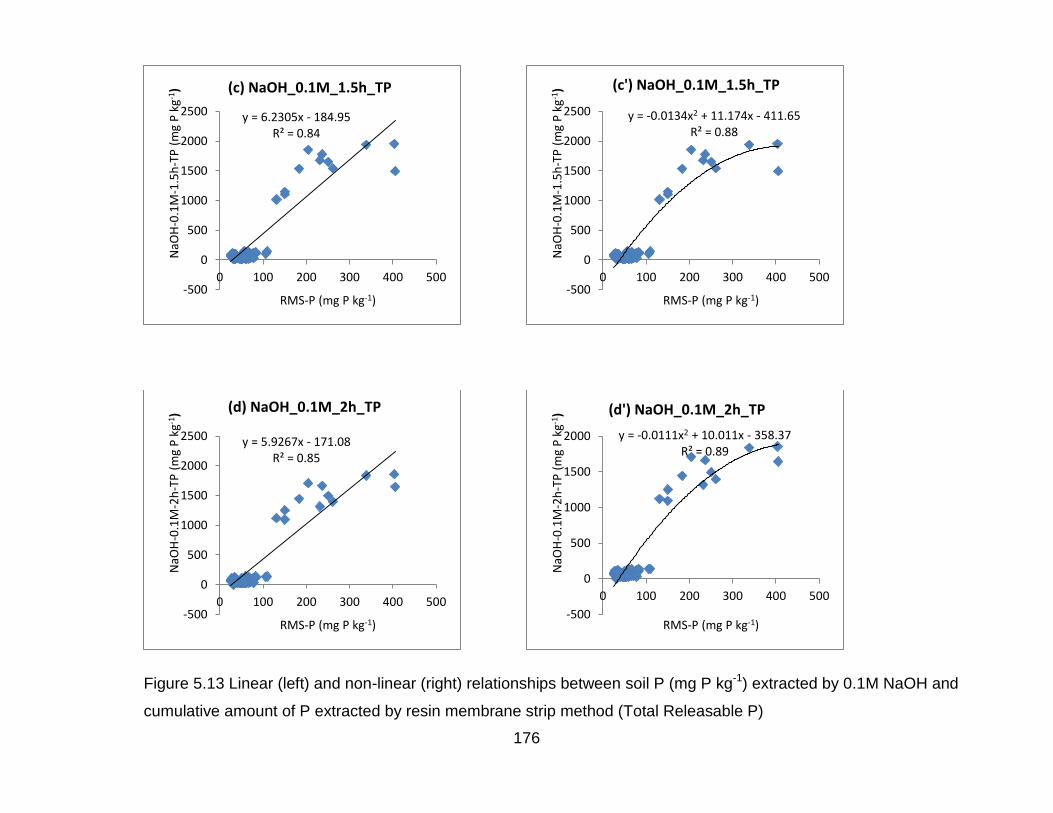
Figure 5.13 Linear (left) and non-linear (right) relationships between soil P (mg P kg-1)
extracted by 0.1M NaOH and cumulative amount of P extracted by resin membrane
strip method (Total Releasable P) ............................................................................... 176
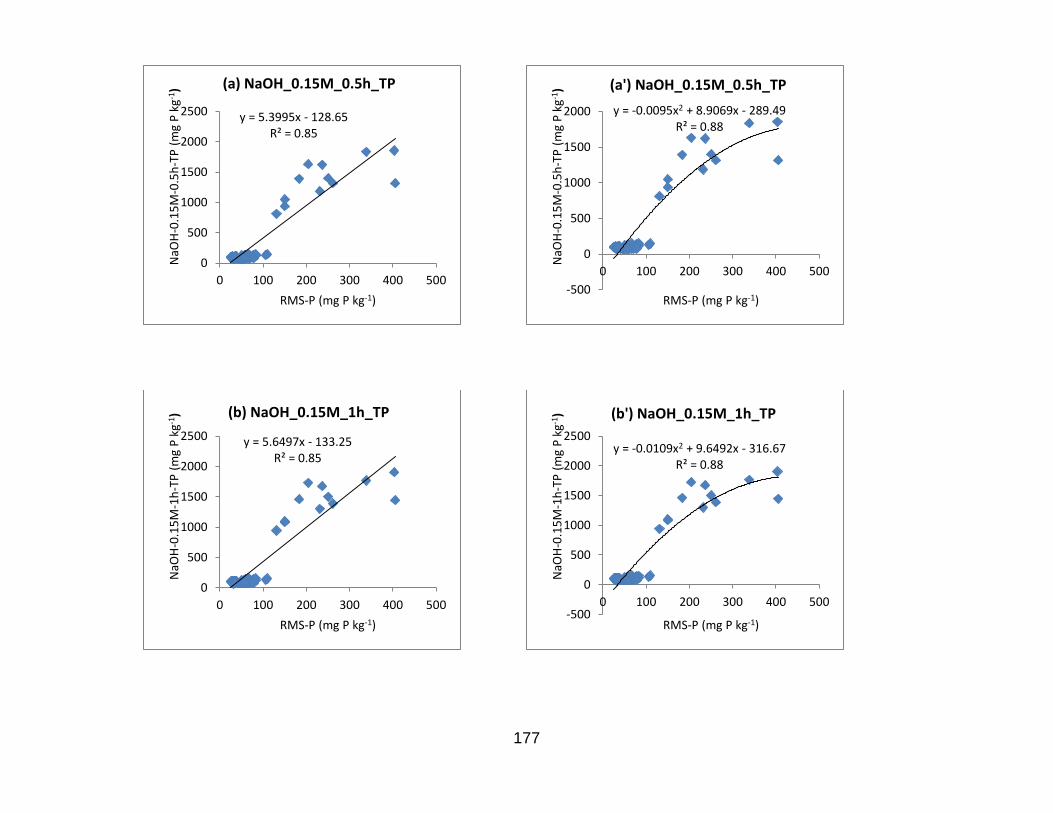
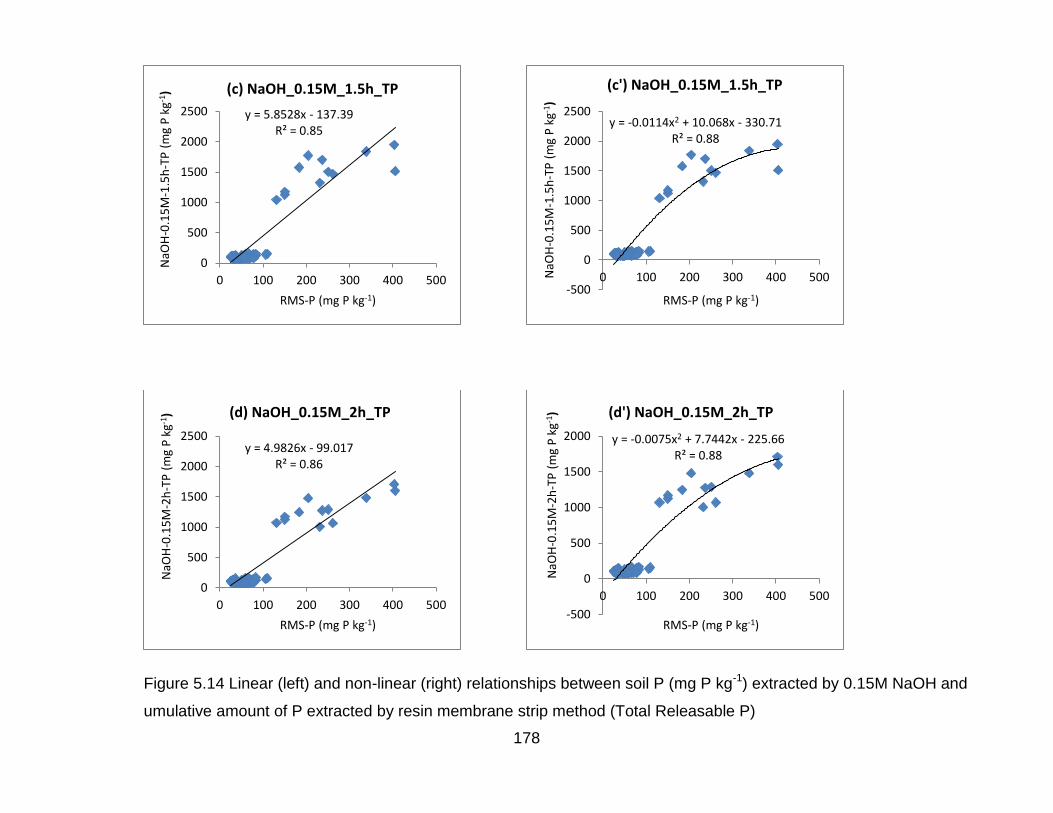
Figure 5.14 Linear (left) and non-linear (right) relationships between soil P (mg P kg-1)
extracted by 0.15M NaOH and cumulative amount of P extracted by resin membrane
strip method (Total Releasable P) ............................................................................... 178
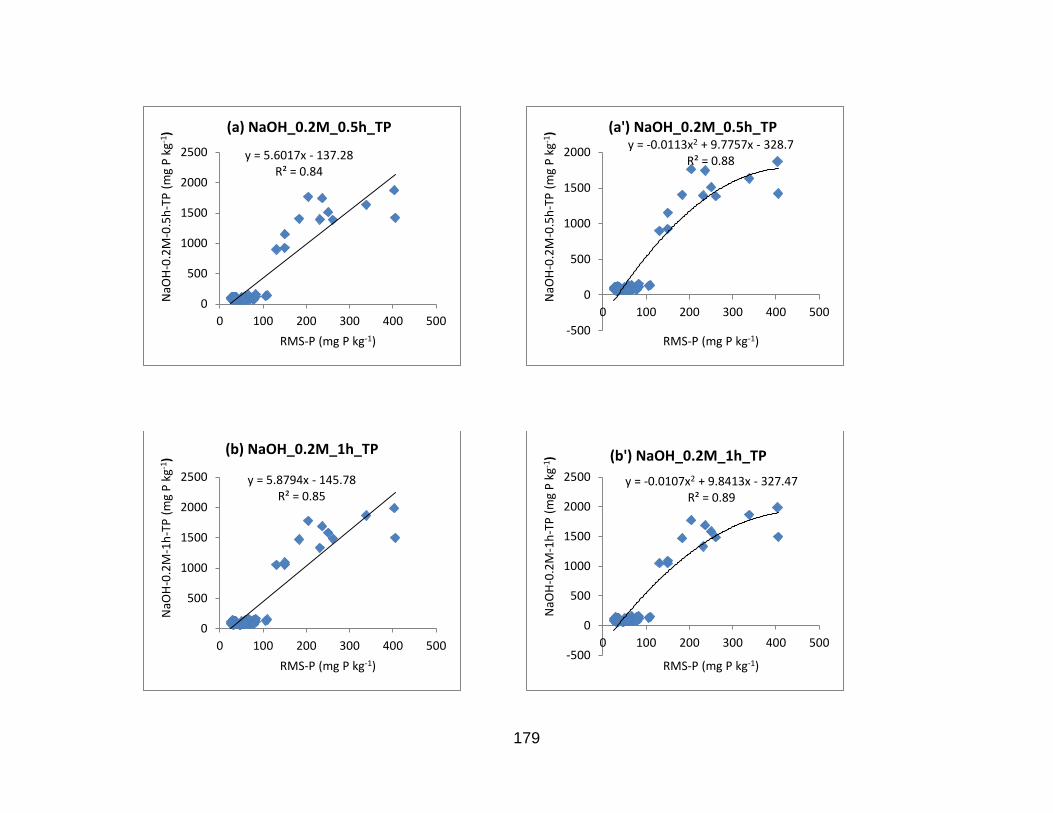
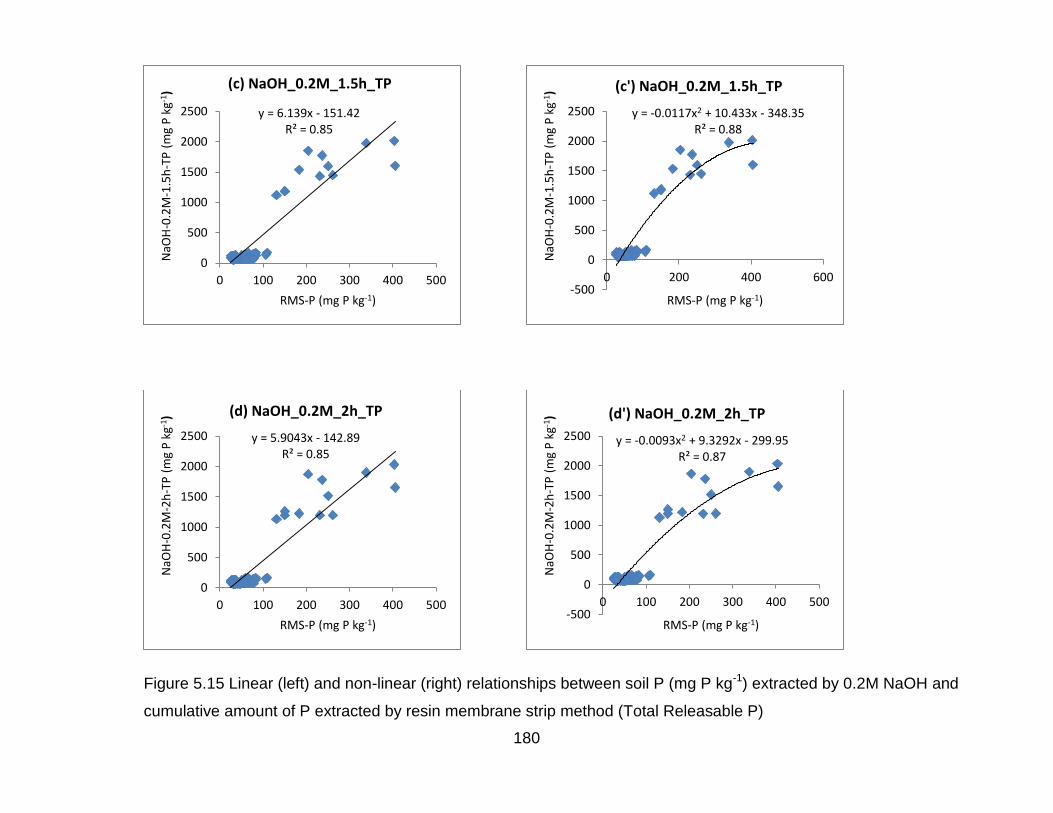
Figure 5.15 Linear (left) and non-linear (right) relationships between soil P (mg P kg-1)
extracted by 0.2M NaOH and cumulative amount of P extracted by resin membrane
strip method (Total Releasable P) … .......................................................................... 180
Page 16
1
Chapter 1: General Introduction
Phosphorus (P) is an essential plant macronutrient, making up about 0.2 to 0.4% of a
plant’s dry weight (Brady and Weil, 2007). It is a component of key molecules, such as
nucleic acids, phospholipids and adenosine triphosphate (ATP). The functions of P
within the plant include energy transfer and energy storage. Consequently, plants
cannot grow without a reliable supply of this nutrient. However, P does not occur in the
soil as abundantly as other macronutrients such as nitrogen (N) and potassium (K). The
soil solution invariably contains too little P to meet the requirements of actively growing
plants. Accordingly, there has to be a readily available supply of P in the soil to
replenish that in solution as it is taken up by a crop. To meet these requirements,
external P-inputs (inorganic fertilizers and manures) must be added to soils if they are to
produce enough food to sustain humankind both now and in the future.
When the soluble sources of P, such as those in inorganic P fertilizers and organic
amendments, including manure, are added to soils, they react with various soil
components and are changed into forms that are unavailable to plants. Eventually these
P compounds become highly insoluble ‘fixed P’ compounds. These P fixation reactions
in soil may allow only a small fraction (10 to 15%) of the P applied in fertilizers and
manures to be taken up by plants in the year of application (Tisdale et al. 1993; Subba
Rao et al. 1995; Brady and Weil, 2007). These stable forms of organic and inorganic
soil P develop into plant available phosphate forms at a rate too slow to meet crop P
requirements. Thus, in production agriculture, farmers typically apply P fertilizers to soils
in excess of P removed in the crop harvest to optimize crop growth (Brady and Weil,
2007). Over the years, continual application of inorganic fertilizer or manure at levels
Page 17
2
exceeding crop P needs can lead to accumulation of large amounts of insoluble and
chemically stable forms of soil P. This buildup of the level of soil P can certainly improve
soil fertility status. However, the application of P in excess of that being removed by
crops often results in an increased concentration of soil test P that is associated with an
elevated risk of P losses from the land to neighboring aquatic environments.
Phosphorus is often the most limiting nutrient to the growth of vegetation in freshwater
bodies. Therefore, very small increases in P concentration can result in excessive
growth of aquatic vegetation, leading to eutrophication. Eutrophication impedes water
use for fisheries and other industries because of the increased growth of undesirable
algae and aquatic weeds. The masses of dead algae and other organic materials in the
aquatic bodies are continuously decomposed, utilizing the dissolved oxygen in water,
thereby depleting the available gaseous oxygen (Sharpley et al. 2000). As a
consequence, eutrophic water becomes inhospitable to aquatic flora and fauna with
lower dissolved oxygen levels and increased turbidity leading to loss of aquatic
biodiversity (Hansen et al. 2002). A nutrient-rich aquatic environment may also lead to
periodic surface blooms of cyanobacteria (blue green algae) and contamination of
drinking water sources (Sharpley et al. 2003). The highly toxic and volatile chemicals
released by these organisms can cause serious health hazards to animals and humans.
In addition, poor taste and foul odor of eutrophic freshwater decrease the recreational
amenity values for such activities as swimming and boating. Thus, minimizing P inputs
to the freshwater bodies through proper P management is of prime importance in
reducing eutrophication of freshwater bodies.
Page 18
3
Eutrophication can be accelerated by any human activities that increase P entering into
surface waters through point sources and non-point sources. Point- sources of P, such
as effluent discharge from wastewater treatment plants, sewage treatment plants and
industrial factories, are relatively easy to identify and regulate. Accordingly, during the
past several decades many developed countries have successfully reduced the mass of
P entering into surface water bodies from point sources. However, there has been little
success in regulating and managing non-point source pollution of P such as runoff
water, eroded sediments and subsurface movement from nearby agricultural lands.
Currently, these non-point sources of P are often the main cause of excessive P in
aquatic environments that lead to eutrophication.
The rate of pollution from non-point source P is higher mostly with intensive agriculture,
which involves heavy P application through inorganic phosphate fertilizers and organic
amendments, such as animal manure. Presently, one of the major concerns is high P
loading in agricultural soils through excessive rates of livestock manure application. This
is often an issue in the areas of intensive livestock production where soils are found to
be enriched with P due to the overloading of manure onto a limited area of cropland.
High transportation costs and other logistic difficulties prevent livestock manure from
being transported to farms in distant locations, where it could supplement or even
replace mineral fertilizer requirements.
Buildup of soil P may be made even greater by inadvertent P inputs when manure with
a small N: P ratio is applied to provide the required amount of N to crops (see Chapter
2). Excess P from N-based manure application increases the soil test P concentrations
far beyond the crop requirements. This accumulation of excess P in the soil is often
Page 19
4
accompanied by increases in the degree of P saturation (Simard et al. 1995; Zheng et
al. 2001). Both of these factors can increase the risk of P transport from agricultural
lands to nearby freshwater bodies through runoff, erosion and tile drainage.
Over the last three decades, agricultural researchers have been exploring
environmentally sound P management practices in agricultural lands to protect surface
water quality. To manage P for economically optimal crop production and for
environmental protection, it is necessary to develop ways of maximizing the efficiency of
P utilization by crops and minimizing P losses from soil to water bodies. One way to
minimize P losses from crop lands is to ensure that the soils are not over- enriched with
P. Thus, balancing P inputs and outputs is one of the main challenges to make modern
farming systems both economically and environmentally sustainable. To meet such a
challenge one must be able to identify sites, soils and management systems that are
vulnerable to P losses, so that appropriate remedial measures can be targeted
effectively. To achieve this, environmental assessments are required at the farm level;
for example, soil tests are needed to assess the potential of a soil to release P to runoff
rather than for its availability to plants. To ensure that soil P levels are not allowed to
exceed those that represent a threat to the environment, it is imperative to identify a
critical level of P in the soil. The upper limit of manure that could be applied with
minimum environmental pollution could be determined by the pre-application level of P
in the topsoil. Therefore, testing of soil P to assess its availability is currently the best
management tool available to ensure that crops are provided with adequate, but not
excessive supplies of the nutrient.
Page 20
5
Recently, there has been an increased interest in using existing agronomic soil tests as
an indicator of potential environmental risk of P loss leading to eutrophication. The use
of locally-calibrated routine soil tests as environmental risk indicators has a significant
practical advantage due to the widespread use of such tests and their well- established
agronomic applications together with the large data base they provide on soil P levels.
Details of extraction methods commonly adopted in such tests are included in Chapter
two. However, for environmentally sound predictions, the suitability of an agronomic soil
test P depends on the chemical nature of the extractants, procedure, soil type and
management and the climatic conditions. Therefore it is difficult to assign universally
acceptable routine soil test P values for environmentally sustainable management
systems.
In addition to the use of agronomic tests, several new soil P tests have been developed
by researchers that might better estimate the potential of soil P losses to aquatic
environments. Some of the most promising methods are distilled water extraction and
‘Ion Sink’ methods (more details are included in Chapter two). These methods are
designed to extract all or a representative amount of P fraction in soils that could be
easily lost through surface runoff, erosion and sub-surface leaching. However, these
methods have some limitations for their use as environmental soil P tests and there are
improvements needed that are addressed in this thesis.
Page 21
6
1.1 Aims and Objectives
Taking account of all the agronomic and environmental soil P test methods, it is evident
from the literature that their overall effectiveness in predicting P losses from agricultural
soils is limited. Therefore, better soil testing methods that are more precise and
accurate have to be developed to have reliability in identification of soils where P loss to
the environment will be of concern. The overall goal of this thesis is to develop an
environmentally sound Soil Test Phosphorus (STP) method for more relevant
measurements of soil P status, to identify the forms of P present and the prediction of
long-term P loss potential. The test must be applicable to agricultural lands under
different soil-crop management practices, such as different sources of P (mineral
fertilizer or organic amendments, including manure) and in different cropping systems.
To accomplish this, the more specific objectives of this dissertation are:
1. Determine the immediate and residual effects of swine manure and manure
compost on soil P fractions in a clay loam soil under corn-soybean rotation
2. Determine the short- term and long-term effects of soil P inputs from both dairy
manure slurry and mineral fertilizer on soil P forms and their distribution in a silty
to sandy loam soil profile
3. Develop a new soil P test for prediction of long-term soil P loss potential
These three objectives contribute to increase the knowledge regarding changes in soil P
forms and their behavior in soils with different agricultural management practices that
Page 22
7
collectively advance the ultimate goals of protecting surface water quality and
preserving farm productivity.
This dissertation is organized in the form of three separate journal articles; the first
paper (Chapter 3) is entitled “Immediate and residual effects of swine manure and
manure compost on soil P fractions in a clay loam soil under corn-soybean crop
rotation”. The second paper (Chapter 4) is entitled “Phosphorus fractions in a sandy
loam soil following long-term application of dairy manure slurry and inorganic fertilizer”.
The third paper (Chapter 5) is entitled “Development of a soil P test for prediction of
long-term soil P loss”. Each paper includes an abstract, introduction, methodology,
results and discussion, conclusions, tables and figures. These papers are preceded by
a Thesis Abstract, General Introduction, General Literature Review and are followed by
Thesis Summary including general conclusions and future research requirements and
References.
Page 23
8
Chapter 2: General literature review
2.1 Present concerns with soil phosphorus
The native P levels in soils are small enough to limit crop production. Therefore both
inorganic fertilizer and organic sources are applied to provide P and correct deficiencies
in the soil. When these sources are properly managed, P additions can increase crop
production to an optimum level with minimum losses to the environment. However,
inadequate management of these sources can result in increasing the soil test P
concentrations far beyond crop requirements, thereby increasing the risk of P losses to
the aquatic environment. Phosphorus, in particular, has been found to be the limiting
nutrient in freshwater ecosystems and its presence, even in relatively small amounts,
greatly accelerates the potential for water quality degradation through the process of
eutrophication. Eutrophication results in increased growth rates of algae and aquatic
macrophytes which can cause recreational problems, decrease water quality, clarity and
depth of light transmission, result in unpleasant odor, anoxia, as well as toxicity to fish,
other life forms in the aquatic environment, livestock, and even humans.
To manage P for economic crop production and for environmental protection, we have
to understand the nature and the availability of the different forms of the P found in soils,
the manner in which the various forms interact within the soil and in the environment,
and also the effects of different management practices (such as cropping and fertilizer
and manure application) on these forms and their transformations within the soil P
fractions. Essential details of these topics will be briefly discussed in the following
literature review.
Page 24
9
2.2 Soil Phosphorus forms and their availability
The amount of total P (mass percentage) in a soil can range from 0.02% to 0.5%, with
an average of approximately 0.05% (Barber, 1995). However, only a minute part of the
total P (usually <1%) is available for plant growth at any given time and this P fraction is
referred to as “Available Phosphorus”. The bulk of the soil P exists as groups of
compounds: organic P, Ca-bound inorganic P, and Fe- or Al- bound inorganic P. All
these groups of compounds slowly contribute P to the soil solution, but most of the P in
each group is of very low solubility and not readily available for plant uptake.
Soil P content varies with parent material, extent of pedogenesis, soil texture, and
management factors, such as rates and types of P applied and soil cultivation
(Sharpley, 2000). Even in the same soil profile, P content of surface horizons is usually
greater than that of the subsoil (Sharpley, 2000). This is due to the sorption of added P
by soil constituents in surface soils, more organic materials in surface soil layers,
greater micro-biological activity and cycling of P from roots to above-ground plant
biomass. Especially, in minimum tillage or zero-tillage systems, buildup of excess P in
the top 5 to 12 cm of soil is very likely, given that fertilizers and manures are not
incorporated into the soil or they are incorporated only to shallow depths with such
tillage practices.
Soil P can be categorized into two major groups; inorganic and organic P. The inorganic
P forms originate from weathering of primary minerals, and from the addition of
inorganic P fertilizer and organic amendments, such as livestock manure. Organic P
forms originate from organic amendments, plant residues and products of soil microbes.
Page 25
10
Inorganic P forms are associated with amorphous and crystalline sesquioxides and
calcareous compounds. The organic P is associated with labile phospholipids and fulvic
acids and more resistant humic acids. Generally, in most agricultural soils, the inorganic
P content is greater than the organic P content. For example, Sharply (2000) has found
that, 50 to 75% of the P found in most agricultural soils exists as inorganic P, although
this fraction can vary from 10 to 90%. The main exception being peat (Histosols), where
essentially all the P occurs in organic forms (Stevenson, 1986). Generally, prairie
grassland soils, forest soils and certain tropical soils also contain relatively high
amounts of P in organic forms (Stevenson, 1986). However, both inorganic and organic
P contents vary with soil type and other environmental and management practices such
as cropping, inorganic fertilizer and organic manure application.
The knowledge of the specific nature of most of the organic-bound P in soils is quite
limited. However, three broad groups of organic P compounds are known to exist in
soils; inositol phosphates, phospholipids and nucleic acids. These organic P
compounds are mineralized in soils by a reaction which is catalyzed by the enzyme
phosphatase. Inositol phosphates are the most abundant of the known organic P
compounds, comprises up to10 to 50 % of the total organic P (Brady, 2007), and
represent a series of phosphate esters ranging from monophosphate up to
hexaphosphate. Most of inositol phosphates in soils are products of microbial activity
and degradation of plant residues.
Nucleic acids occur in all living cells and are produced during the decomposition of
residues by soil microorganisms. Two distinct forms of nucleic acids, DNA and RNA are
released into the soil in greater quantities relative to inositol phosphates. However, DNA
Page 26
11
and RNA are mineralized in most soils much more rapidly and incorporated into the
microbial biomass. Therefore nucleic acids represent only a small portion of total
organic P in soils, approximately 2.5% or less (Condron et al.1985).
Phospholipids are organic compounds, insoluble in water, but are readily utilized and
synthesized by soil microorganisms. Thus, the free phospholipids content in soils is also
small, representing only 5% or less of the total organic P. The most common
phospholipids are derivatives of glycerol dominated by choline phospho-glyceride,
followed by ethanolamine phospho-glyceride (Dalal, 1977). Other soil organic P
compounds can be sugar phosphates (Anderson and Malcolm, 1974) and phosphate
proteins that contribute to trace amounts of soil organic P.
Phosphorus enters the soil solution through dissolution of primary and secondary
minerals; desorption of P from clays, oxides, and minerals; and biological conversion of
P in organic materials to inorganic forms (mineralization).The next section will discuss
the processes that control the forms of soil P and their availability to plants.
2.3 Soil Phosphorus dynamics and transformations
The P cycle in soil is a dynamic system involving the soil, plants and micro-organisms.
In the closed natural system, essentially all the P consumed by plants is returned to the
soil either as plant or animal residues. However, in agricultural systems, some P is
removed from the soil with harvested parts of crops and only a portion of this P returns
directly to the soil.
Phosphorus transformations in soils involve complex mineralogical, chemical, physical-
chemical and biological processes (Frossard et al. 2000). Chemical processes include
Page 27
12
precipitation and dissolution, while physical-chemical processes include adsorption and
desorption, and biological processes involve immobilization and mineralization. The
physical-chemical and chemical processes that influence soil P forms and their
availability are discussed in the next section.
2.3.1 Physical-chemical and chemical Processes
Chemical weathering and solubilization of soil mineral phosphates release P in the form
of orthophosphates into the soil solution, where they exist in very small concentrations.
Apatite [(Ca10 (PO4)6 (X)2, where X represents F-, Cl-, OH- or CO32-)] is the most
common primary P mineral in soils with high pH. In soils with low pH, Variscite
(AlPO4.2H2O) and Strengite (FePO4.2H2O) are the probable P minerals (Savant and
Racz, 1973; Lindsay, 1979).
When phosphate fertilizers are added to soils, initially P in water soluble compounds
goes into the soil solution as phosphate ions. Once in the soil solution, P can be taken
up by plant roots, assimilated by biological organisms, sorbed to sesquioxides and
calcium carbonates, precipitate as an insoluble compounds, or be lost in surface or
subsurface runoff. The major processes for removal of inorganic P from soil solution are
generally adsorption to soil surfaces and conversion to secondary P minerals. This
phenomenon is often referred to as ‘P fixation’ which involves both P sorption and P
precipitation mechanisms. Phosphorus sorption covers surface adsorption and
absorption that is subsequent to the penetration of P into the retaining component.
Generally, clay content approximates the reactive surface area responsible for P
sorption of a soil (Sharpley et al. 1984a; Hedley et al. 1995).
Page 28
13
Phosphorus fixation in soil consists of two different patterns; an initial rapid adsorption
process followed by a very much slower reaction process. When soluble P is added to a
soil, initially the phosphate ions dissolve in the soil solution. However, a rapid reaction
then removes P from solution. This rapid reaction involves an exchange of P with
anions on the surfaces of Fe- and Al-oxides (Rajan and Fox, 1975; Rao and Sridharan,
1984). It has been found that a number of soil minerals and soil colloids are involved in
adsorbing phosphates from the soil solution. In calcareous soils, it appears that a
surface coating of phosphate can be formed on calcium carbonate. In neutral and acidic
soils, P is more likely to be adsorbed on hydrated Fe oxides, Al oxides or on the edges
of clay minerals.
The adsorption capacity of the soil is mainly determined by the nature and the amount
of soil components, i.e. the type of surfaces which may be in contact with P in the soil
solution and the number of sites available for reaction with added P. In soils with
significant contents of Fe and Al oxides, where the oxides are less crystalline, the P
adsorption capacity is greater owing to the larger surface area. For instance, hydrous
metal oxides of Fe and Al, which are most abundant in weathered soils, have a greater
capacity to adsorb very large amounts of P. Therefore, highly weathered soils are
characterized by small values of total available P because a large proportion of
inorganic phosphates are removed as relatively insoluble Al and Fe forms from the soil
solution, leading in turn to greater P requirements in these soils.
Slower reactions are considered to involve slow sorption and precipitation. In the slow
reaction process, phosphate is removed from solution over a long period of time and
there is continual gradual reduction in the solubility of total P. Therefore, the freshly
Page 29
14
fixed P may be slightly soluble and some value to plants. However, with time, the
solubility of fixed P tends to decrease to extremely low levels. Both sorption and
precipitation mechanisms occur in all types of soils at all pH levels. However, the type
and the relative proportion of the fixed P compounds depend mainly on the nature of the
clay particles and the pH of the soil. Generally, Ca controls these reactions in neutral or
calcareous environments, while Al and Fe are the dominant controlling cations in acidic
environments.
Precipitation involves transformation of soluble P into relatively less soluble Fe, Al, Ca
and Mg phosphates, which control P concentration in the soil solution. Addition of
fertilizer P leads to the formation of strongly concentrated P solutions and often a low
pH in the vicinity of the fertilizer granule. Sample et al. (1980) have reported that P
concentration could be as high as 1.5 M to 12 M and pH can be as low as 1 depending
on the source of P. This acidification effect may cause degradation of clay mineral
structures, dissolution of CaCO3 and subsequent precipitation of amorphous Al-
phosphates and Ca-phosphates (Freeman and Rowell, 1981). Generally, precipitation
reactions are favoured by the very large P concentrations existing in close proximity to
granules, droplets and bands of fertilizer P. However, adsorption seems to be the
dominant mechanism with small P concentrations in the soil solution developing over a
short period of time. Therefore adsorption reactions are most important at the periphery
of the soil-fertilizer reaction zone, where P concentration is much smaller.
Local soil conditions that lead to precipitation of Fe-, Al- and Ca-phosphates usually
change with time. However, in the long run, the formation of various Al- and Fe-
phosphates may depend mostly on average soil properties. The initial compounds
Page 30
15
precipitated are likely to be meta-stable and will usually change with time into more
stable and less soluble compounds, or re-dissolve into the soil solution. However, these
more stable phosphate products are unlikely to govern P concentration in soil solution
(Ryden and Pratt, 1980).
Soil P transformations are generally affected by soil biological reactions, and the next
section will discuss the biological processes which influence soil P forms, their
transformations and availability.
2.3.2 Biological Processes
Generally, P mineralization and immobilization processes occur in soils simultaneously.
Accordingly, the maintenance of soluble phosphate in the soil solution will depend to
some extent on the magnitude of the two opposing processes. The quantities and rates
of P mineralization and immobilization are determined by many soil factors, such as soil
temperature, moisture, aeration and soil pH, intensity of cultivation, total organic C and
P fertilizer applications. For example, additions of fertilizer P can lead to increase in soil
organic P through net immobilization.
The P content of decomposing organic residues plays a key role in regulating the
quantity of soluble P in the soil at any one time. The C/P ratio of the decomposing
residues regulates the predominance of P mineralization over immobilization. Generally,
net immobilization of soluble P is most likely to occur when the C/P ratios of added crop
residues are 300 or more and net mineralization of organic P occurs when the ratio is
200 or less (Stevenson, 1986). When residues are added to soil, net immobilization
occurs during the early stages of decomposition, followed by net P mineralization as the
Page 31
16
C/P ratio of the residue decreases. When the C/P ratio is in between 200 and 300, no
gain or loss of inorganic P occurs.
2.3.2.1 Mineralization
The initial sources of soil organic P are plant and animal residues, which decompose
under the action of microorganisms to produce other organic compounds and release
inorganic P. A wide range of soil microorganisms are capable of mineralizing organic P.
However, some organic P is resistant to microbial degradation and is most likely
associated with humic acids. According to Charter and Mattingly, (1979), the calculated
rates of inorganic P released by mineralization of soil organic P accounted for up to
67% of the total P uptake by crops in an unfertilized soils in eastern Canada. Barber,
(1979) found that in cropland to which no fertilizer was added, there was a more-or-less
constant content of inorganic P, although levels of available P gradually declined. The
net loss of P from the system through removal of harvested crop was primarily
accounted for by a decrease in organic forms.
The quantity of P mineralized during a crop growing season varies widely among soils
due to soil characteristics and environmental conditions. Typically, large quantities of
organic P are mineralized in the tropics where distinct wet and dry seasons and warmer
soil temperatures enhance microbial activity. Research has found that in tropical high-
temperature environments, organic P mineralization tends to be greater, ranging from
67 to 157 kg P ha-1 yr-1 and can apparently supply a large part of the crop P requirement
(Anderson, 1980). However, the slow-continual release of P would also be important in
soils with a high capacity to fix inorganic P as well. In the temperate zone, organic P
Page 32
17
mineralization rates are relatively slow due to cool temperatures and less microbial
activity. Larson et al. (1972) reported that an annual mineralization rate for temperate
soils was ≈ 10 kg P ha-1. Stewart and Tiessen, (1987) found that the amounts of organic
P mineralized in temperate dry-land soils range from 5 to 20 kg P ha-1 yr-1. Since
inadequate levels of P are mineralized during a given cultivation and growing season in
temperate soils, regular additions of fertilizer P are necessary to maintain optimum
levels of P for plant growth.
2.3.2.2 Immobilization
Mineral P from fertilizer can be immobilized to organic P by soil microorganisms.
Research has shown that continuous applications of fertilizer P could lead to an
increase in soil organic P (Zhang and MacKenzie, 1997) and such increases take place
through net immobilization of P in crop residues and conversion of available inorganic P
into microbial biomass and organic P (McLaughlin et al. 1977).
Soil P transformations are affected by different soil factors such as pH, texture, organic
matter content, the amount of CaCO3, Fe- and Al- oxides, as well as soil temperature
and moisture content. However, in a given agricultural soil, cropping and fertilizer
applications that alter the status of soil organic matter and P concentrations in the soil
solution, are the most important factors influencing transformations in the soil (Beck and
Sanchez, 1994; Zhang and MacKenzie, 1997; Zheng et al. 2002). In the next section,
the effects of cropping on soil P forms and their transformations are discussed.
Page 33
18
2.3.3 Effects of cropping
Generally, long-term cropping without fertilizer or manure additions leads to a reduction
in soil P content. Several studies have explored the relative changes in soil organic and
inorganic P fractions due to long-term cultivation. Hedley et al. (1982) found that
continuous cropping without addition of inorganic P fertilizer resulted in the depletion of
soil organic P. Adepetu and Corey (1977) observed that 25% of the organic P content of
some Nigerian surface soils was mineralized during the first two cropping periods after
initial cultivation. Similar results were reported by McKenzie et al. (1992a) in a study
focused on the effects of different cropping systems (continuous wheat, fallow-wheat
and fallow-wheat-wheat) on soil P fractions in the soil, indicating that the mineralization
of organic P occurred in a considerable degree during cultivation to supply crop P
needs.
Crop production modifies soil P transformations through addition of crop residues and
release of exudates into the rhizosphere. The effects of crop residue on soil P
transformations are discussed in the next section.
2.3.3.1 Effects of crop residue on soil Phosphorus transformations
Crop residues are a potential source of plant nutrients, which may be released into the
soil during their decomposition and are then available for uptake by following crops. The
transformations of residual P in soil into plant available P forms and its contribution to
crop P nutrition depend on inherent soil properties, cropping system, fertilizer
management and history, and climatic conditions. The influence of rhizosphere
characteristics on soil P transformations is discussed in next section.
Page 34
19
2.3.3.2 Transformations of Phosphorus in the rhizosphere
The rhizosphere is the unique volume of soil that is directly affected by the activity of
plant roots and where roots, soil and the soil biota all interact. Most of the interactions
are beneficial for plants as they improve soil fertility. When the plant roots absorb
nutrients from the soil solution, they release exudates into the rhizosphere. Therefore,
the chemical, physical and biological properties of rhizosphere soil are markedly
different from the bulk soil in many respects such as; (1) the presence of a larger
number of microorganisms, (2) a larger amount of organic C as a result of root exudates
and materials sloughed off from root surfaces, (3) the presence of small-molecular-
weight organic acids secreted by plant roots, and (4) lower pH due to differential uptake
of cations over anions by plant roots (depending on N source). Because of this unique
nature, the rhizosphere is a key site for P transformation with a significant mobilization
of P from the non-exchangeable inorganic and organic P fractions.
2.3.4 Effects of phosphate fertilizer application
Phosphorus fertilizers are added to soil to improve productivity. The level of P addition
varies with both soil and plant type (Pierzynski and Logan, 1993). For example, Tiessen
(2008) has found that crop requirements for fertilizer P varied from <1 kg P ha-1 in
relatively un-weathered soils of arid environments to 200 or 300 kg P ha-1 in oxide rich
tropical or volcanic soils. When fertilizer P is added to the soil, soluble P goes into soil
solution before reacting with the soil and initially increases solution P. But subsequently
solution P decreases due to both biological and chemical processes of P fixation. The
duration of elevated solution P levels depends on the application rate of fertilizer P, the
Page 35
20
method of placement, the quantity of P removed by the crop together with the soil
properties that influence P availability. From the soil solution, P is either taken up by the
crop, becomes weakly (physical) or strongly (chemical) adsorbed onto Al, Fe and Ca
surfaces, or incorporated into organic (microbial) P (McLaughlin et al. 1988; Syers and
Curtin, 1989).
Most of the P (as high as 90 % or more) applied to soil as fertilizer, is not taken up by
the crop, but is retained in insoluble or fixed forms. While a portion of the residual P can
be used by subsequent crops, further additions of fertilizer are often required in order to
maintain high crop yields. Therefore, over the years, repeated applications of fertilizer P
in amounts exceeding crop uptake inevitably result in an accumulation of P in the soil.
The extent of P accumulation depends on both fertilizer application rate and years of
application. For example, Barber (1979) found P accumulation when P application rates
exceeded 22 kg ha-1 yr-1 in a rotation-fertility experiment over a 25-year period.
Carpenter et al. (1998) also reported that the estimated value for the average annual
rate of soil P accumulation resulting from fertilizer applications was about 22 kg P ha-1 in
the USA and Europe.
Several studies have explored the influence of applied fertilizer P on the different P
fractions in soil. MacKenzie et al. (1992) and Schmidt et al. (1996) reported that
continuous application of fertilizer P for many years has increased inorganic and organic
P fractions in soil. Based on a study of eight agriculturally important soil series in the US
comparing the relative amounts and distribution of P forms in virgin soil profiles with
those of similar soils that had been cultivated and fertilized for at least 15 years,
Sharpley and Smith (1983) found an average decrease of 43% in soil organic P content
Page 36
21
of cultivated surface horizons, although fertilizer application increased the total P by
25% compared to their virgin analogues. The authors asserted that as a result of
fertilizer application and organic P mineralization during cultivation, the inorganic P
content increased by 118% and plant available (Bray-1-P) inorganic P content
increased by 85% for all surface soil horizons. However, they observed that the content
of all P forms in the sub-soils was relatively unaffected by cultivation. And the change in
content of P forms with cultivation and fertilizer P application was closely correlated with
P content of the virgin soils and the amount of fertilizer P added during cultivation.
The sink with which excessive P is mostly associated depends on soil type, cropping
system and climatic conditions. For example, in a field study conducted on a Hawaiian
Ultisol, Linquist et al. (1997) reported that one year after fertilizer application almost
40% of the applied triple super phosphate fertilizer was in the hot HCl and H2SO4
fractions. O’Halloran (1993) reported that fertilizer application increased the resin
extractable inorganic P, NaOH extractable inorganic P and residual P and total P
fractions of a sandy loam soil, however, for a clay soil, only the resin P fraction was
affected. Beck and Sanchez (1994) found that in a tropical Ultisol of the Amazon basin,
with 18 years of continuous cultivation, the NaOH extractable inorganic P fraction
served as a primary sink for fertilizer P added to soil. Similar results were reported by
Richards et al. (1995); Motavalli and Miles (2002), for different cropping systems with
continuous fertilizer application of soils for more than 9 years. While the assertion of
Beck and Sanchez (1994) has been supported by studies on temperate soils by
Schmidt et al. (1996) and Zhang and Mackenzie (1997a, 1997b), the later authors found
involvement of three other P fractions as a P sink, namely NaOH-extractable organic P
Page 37
22
(NaOH-Po), HCl-extractable P (Ca-P) and the residual P fractions. Zhang and
MacKenzie (1997) have reported that application of fertilizer P to a Hapludalf soil has
increased the labile and moderately labile inorganic P fractions. In a Chicot sandy clay
loam soil, NaOH extractable inorganic P fraction was the major sink for P from the
excessively added fertilizer P (Zhang and MacKenzie, 1997). Wager et al. (1986) found
that, after one year, most fertilizer P added to calcareous Canadian soils entered the
easily extractable inorganic P fractions. In subsequent years (2-8) these fractions were
depleted due to crop P uptake and transformation to more stable forms of P.
2.3.5 Effects of livestock manure application
In production agriculture, livestock manures are used as a soil amendment to improve
soil quality and productivity. The availability of P from manure is somewhat different
from that of mineral fertilizer. For example, Lucero et al. (1995) found that 3 – 4.5 kg P
ha-1 from poultry manure and 16.5 kg P ha-1 from mineral fertilizer were required to
increase Mehlich-3- P by 1 mg kg-1. Reddy et al. (1999) showed very similar results,
with 5.6 kg P ha-1 from poultry manure and 17.9 kg P ha-1 from mineral fertilizer needed
to increase Olsen extractable P by 1 mg kg-1. Some research suggests that manure P
may be equally available or more available to plants than fertilizer P (Gale et al. 2000;
Meek et al. 1979; Abbott and Tucker, 1973). Elias-Azar et al. (1980) found that P from
fresh and composted dairy manure was as available as P from KH2PO4 in alkaline
sandy soils. However, manure P has not always been found to be more plant available
than fertilizer P. For example, Sharpley and Sisak (1997) found that the availability of P
from poultry manure leachate was somewhat less than that from KH2PO4.
Page 38
23
Researchers have also found that, when manure and inorganic fertilizer are applied
together, a synergistic effect occurs whereby available P is increased more than the
sum of the increase from either applied separately (Copeland and Merkle, 1941; Dalton
et al. 1952; Toor and Bahl, 1997; Reddy et al. 1999). This synergistic effect may be
explained by the fact that several anions of organic acids have been found to prevent P
fixation and are able to replace P bound to the soil resulting in greater concentrations of
available P (Nagarajah et al. 1970; Kafkafi et al. 1988). However, In a study conducted
by O’Halloran and Sigrist, (1993) to find the effects of incubating monocalcium
phosphate monohydrate (MCPM) with liquid hog manure (LHM) on P availability, the
results indicated that the additions of both MCPM and LHM had the same effect on soil
P fractions regardless of whether the materials had been incubated together or added to
the soil separately.
The application of livestock manure to soil significantly influences the chemical, physical
and biological properties of soil (Sommerfeldt and Chang, 1985) thereby providing
several potential benefits for crop growth. Improving soil physical properties such as
bulk density, soil compaction and aeration or porosity can enhance root growth (Egrinya
et al. 2001). Manure application can also enhance water retention and water holding
capacity, especially in sandy soils, thus aiding nutrient uptake through both diffusion
and mass flow. There may even be manure impacts on soil color and subsequently on
soil temperature, thus aiding root growth particularly in the spring. The effects of manure
on increasing soil organic carbon and improving tilth in favour of crop emergence and
growth have been reported for years by many researchers (Hoyt and Rice, 1977; Meek
et al. 1982; Sommerfeldt et al. 1988). Manure also has a residual nutritional effect as
Page 39
24
mineralization of its organic fraction often takes longer than a cropping season (Cusick
et al. 2006; Zhang et al. 2006). It has been reported that manuring tends to move soil
pH towards neutrality, whether in acidic soils (Whalen et al. 2000) or alkaline soils
(Chang et al. 1990), thus improving nutrient availability, especially for P and other
micronutrients by maintaining the soil pH in the ideal range for most field crops.
Most of these effects of manure application are attributable to an increase in soil organic
matter, because animal manure, especially solid and slurry manure, contains a large
amount of organic matter. The ability of organic matter to promote formation of water-
stable aggregates in the soil has a substantial effect on soil structure and physical
characteristics. For example, increasing the stability of aggregates to excess water
could increase infiltration, porosity and water holding capacity of the soil and thereby
decrease soil compaction and erosion. Organic matter increases the cation exchange
capacity of the soil and serves as a buffer against rapid change in pH. It also serves as
an energy source for soil micro-organisms. Consequently, an increase in the organic
matter content of a soil from manure application improves overall soil fertility and
productivity for plant growth.
The rate of manure application is usually based on the plant-available N content of the
manure and the recommended N rate for the crop to be grown. Generally the manure
N:P ratio is often smaller than the N:P uptake ratio of most crops (Simard et al. 1995;
Gburek et al. 2000; Whalen, 2001). Some manure sources particularly ruminant and
poultry manure are reported to have a high P content relative to N content (Leaver
1984; Nguyen and Goh 1992; Greatz and Nair 1995; Mikkelsen, 2000). Therefore,
manure applied to meet crop N requirements often causes accumulation of P in soils
Page 40
25
exceeding the optimum concentration needed for crop production (Mozaffari and Sims,
1994, Simard et al. 1995; Sims et al. 2000; Whalen and Chang, 2001). This buildup of P
in the soil could be initially beneficial to crop growth, especially in soils that are deficient
in P. However, this accumulation is accompanied by increases in soil-test P levels
(Simard et al. 1995, Zheng et al. 2001), that can pose environmental problems, through
increases in soluble/dissolved P in runoff water (Pote et l. 1996; Andraski and Bundy,
2003; Fang et al. 2002; Schroeder et al. 2004; Sims et al. 1998) and downward
movement of P to ground water (Haygarth et al. 1998).
The next section will discuss movement of P in soil, including different transport
pathways and loss potential to the environment.
2.4 Soil Phosphorus mobility
Phosphorus is the least mobile macro nutrient in soil and this poor mobility of P is
mostly due to the strong reactivity of phosphate ions with the soil components. The
mobility of phosphate ions in soil depends on the nature of mineral surfaces present,
since phosphate anions are strongly adsorbed by mineral constituents such as clays
and sesquioxides (Parfitt, 1978).
Mobility of phosphate in soil is also dependent on its form in a soil. Generally, organic P
anions can move to a greater depth than inorganic P in soil (Chardon et al. 1997). For
example, an accumulation of inositol phosphate in the B horizon of soil was found by
Halstead and McKercher (1975). Several studies also demonstrated an appreciable
downward movement of P following application of manure which resulted in elevated P
levels at 60 -120 cm depths. Chater and Mattingly (1979) have found that application of
Page 41
26
inorganic fertilizer P resulted in much less downward movement of P compared to the
organic P in manure.
The addition of decomposable organic matter enhances the mobility of P in soil because
the concentrations of PO4-P in soil solutions have increased as the residue loading
rates were increased (McDowell et al. 1980). The mechanisms that may most likely be
involved in the decomposition of organic residues and its contribution to soil P mobility
are explained by Stevenson (1994) as:
(1) Formation of chelate complexes with Ca, Fe and Al and the subsequent release of
phosphate to water soluble forms
(2) Competition between humate and phosphate ions for adsorbing surfaces prevents
fixation of phosphate
(3) Formation of protective coatings over colloidal sesquioxides with reduction in
phosphate adsorption and
(4) Formation of phospho-humic complexes through bridging with Fe and/or Al.
Accordingly, management practices that increase the loading of crop residue may
increase P mobility in a soil profile.
The next section discusses the different pathways and the mechanisms of soil P
transportation to neighboring water bodies and which forms are transported through
each path.
Page 42
27
2.5 Soil Phosphorus transport pathways
Phosphorus can be transported from agricultural fields to adjacent surface water bodies
through surface (runoff and erosion) and/or subsurface (leaching and preferential flow)
pathways. Under typical agricultural practices, P remains concentrated in the surface
horizon which leads to greater P loss through surface transport and less P loss through
subsurface leaching. Studies have reported that the greatest potential for P losses from
soil is through erosion (Tiessen et al. 1983) and surface runoff (Khasawneh et al. 1980).
Phosphorus losses through leaching are much smaller than losses by soil erosion and
surface runoff because P becomes a part of very insoluble and less mobile compounds
in the soil. It is reported that 10% of P export from land occurs by leaching and ground
water transport while 90% is transported by overland flow through erosion and surface
runoff. Although the proportion of P leaching is much smaller than overland flow loss, it
has a greater effect on eutrophication because it is soluble P and therefore readily
available to aquatic biota. However, subsurface runoff (i.e. tile drainage) has been
reported recently as a major soil P loss pathway (up to 95% of total soil P loss) in tile
drained lands that are increasingly a common practice in North America (Zhang et al.
2009: Tan and Zhang, 2011).
Phosphorus can be lost from agricultural lands in two different forms; particulate-bound
(sediment- bound) form and dissolved (soluble) form (Sims et al. 1998). Particulate
bound P forms include P associated with soil particles and organic materials eroded
during flow events and constitute about 75 to 90% of total P (TP) transported in surface
runoff from most cultivated lands (Sharpley et al. 1993). However, surface runoff from
Page 43
28
grass, forest, or non-cultivated soils carries little sediment and is therefore generally
dominated by the dissolved form of P. The dissolved form comes from the release of P
from soil and plant materials. This release occurs when rainfall or irrigation water
interacts with a thin layer of surface soil (2.5 - 5 cm) and plant materials before leaving
the field as surface runoff (Sharpley, 1985). According to Sharpley et al. (1993),
dissolved P contributes 10 to 40% of the total (TP) transported from most cultivated
soils to water bodies through runoff and leaching. Most dissolved P is readily
bioavailable and thus increases algal growth in surface waters. Though sediment bound
P is not readily bioavailable, it can be a long-term source of P for aquatic biota (Ekholm,
1994; Sharpley, 1993).
The amount of P loss and its delivery rate from soils to surface water is influenced by
various factors and these factors will be discussed in detailed in the next section.
2.5.1 Factors affecting soil Phosphorus loss
The most influential factors that affect soil P loss and its delivery rate to water bodies
include the type of P source added (Kleinman et al. 2002), soil P levels (Sharpley, 1995;
Heckrath et al. 1995; Pote et al. 1996; Ige et al. 2005), soil physical and chemical
characteristics (Nearing et al. 1993), the amount and intensity of rainfall (Edwards and
Daniel, 1993), and the field slope and proximity to surface waters. Generally, highly
water soluble P sources increase the risk of dissolved P loss. For example, Anderson
and Magdoff (2005) have found that repeated application of P sources that are high in
soluble organic P (such as animal manures) to agricultural soils could release a
substantial amount of organic P to ground water. McDowell et al. (2001) have reported
Page 44
29
that losses of P are related to soil P concentration and therefore strongly influenced by
P additions as fertilizers and manures. According to Pote et al. (1999b) and Sharpley
(1995), soils with high soil test P levels can contribute significant amounts of P to runoff
in the forms of dissolved P or particulate bound P. Because, when the binding sites of
soil particles are highly saturated in P, its capacity to retain additional P decreases and
the potential for losses of dissolved P increases through desorption and dissolution.
Several studies have found that particular soil physical and chemical properties such as
coarse texture, small concentration of Fe and Al oxides and large P concentration can
result in limited P adsorption and thereby could increase the potential for dissolved P
losses (Sharpley et al. 1996; Kleinman et al. 1999; Pote et al. 1999; Morel et al. 2000;
Pautler and Sims, 2000; Schoumans and Groenendijk, 2000). Gaynor and Findlay
(1995) showed that ortho-phosphate concentration and losses in drain flow from clay-
loam soil averaged 0.24 mg P L-1 and 0.38 kg P ha-1 yr-1 which represented
approximately 3% of the total P fertilizer applied. Fox and Kamprath (1971) concluded
that P leaching is primarily governed by the concentrations of Fe and Al sesquioxides.
Similarly, a substantial decrease in P leaching was reported for finer-textured soils and
soils which contain greater amounts of reactive Al. Accordingly, the potential for P to
leach in organic soils is greater than such potential in mineral soils which contain
greater amounts sesquioxides. Thus, it is evident that P sorption capacity of soils plays
a key role in reducing the potential for P losses through leaching.
For soils with large organic matter content and soils receiving large quantities of P
fertilizer, Sharpley et al. (1993), Eghball et al. (1996) and Elliott et al. (2002) have found
that phosphate can be leached considerably when soil phosphate sorption capacity is
Page 45
30
saturated by fertilizer application. In a study conducted in an organic soil during one
study period, Miller (1979) reported that dissolved ortho-phosphate concentration and
loss from subsurface drainage water were as high as 18.2 mg P L-1 and 36.8 kg P ha-1
respectively. Accordingly, P leaching can be a significant problem in poorly drained soils
with high organic matter levels (Sharpley et al. 1994), soils with a long history of manure
application (Breeuwsma et al. 1995; Heckrath et al. 1995) and also in agro-ecosystems
characterized by soils excessively rich in P with small P sorption capacity (Cully et al.
1983; Gaynor and Findlay, 1995; Beauchemin et al. 1998; Sims et al. 1998; Smith et al.
2001b). Especially in flat fields, phosphate may be lost mainly by leaching from soils in
which the phosphate sorption capacity has been saturated by P fertilizer application.
Culley et al. (1983) also showed that more than 50% of the total P losses might be lost
through subsurface drainage water in flat plots of Ontario. Ozanne et al. (1961) found
that in sandy soils, which have small capacities for water retention and phosphate
buffering, the removal of P through leaching was as much as 80% of P applied. Similar
results were found by Humphreys and Pritchett (1971), in that all of the P applied as
inorganic fertilizer to sandy soils (>93% sand) leached to a depth below 50cm.
Generally P concentration of water percolating through the soil profile is small because
of P fixation by P-deficient sub-soils. However, exceptions can occur in sandy, acid
organic or peaty soils with low P fixation or holding capacities as well as in soils where
the preferential flows of water occur rapidly through macro pores and earthworm holes
(Bengston et al. 1992; Sharpley and Syers, 1979; Sims et al. 1998). Gaynor and
Findlay, (1995) found that, with artificially drained fine-textured soils that may not be P
Page 46
31
saturated, but allow for rapid movement of P through preferential flow paths to
subsurface drains and then to surface waters.
Soil P loss through erosion is more severe in regions with intense rainfall and where the
soil on sloping land is not protected by a permanent cover of vegetation. Heavy
raindrops can detach both mineral and organic particles from the main body of soil. If
the volume of rainfall is sufficient for excess to run off over the surface, then the
detached particles are carried in the flowing water and can eventually reach water
bodies. Whenever the soil particles and organic residues are removed from a field
through soil erosion, the P adsorbed to these particles also moves out from the field.
Accordingly, management practices that prevent soil erosion (such as residue
management, cover crops, contour farming and no-tillage) could minimize surface
losses of P.
The potential of P losses in overland flow is also affected by the method of fertilizer or
manure application (Tabbara, 2003). According to Hansen et al. (2002) and Tabbara
(2003), surface applications of fertilizer or manure are extremely vulnerable to losses of
P into surface waters particularly when runoff occurs during or shortly after application.
This is because, most of the P applied to soils as fertilizers and manures remains within
the top 2.5 – 5 cm of a soil profile. Management practices such as incorporation,
injection or banding of fertilizer P or manure into the seedbed can reduce much of the
potential P runoff and make more P available to a crop.
The magnitude of P loss from soil increased with high rates of fertilizer and manure
application (Kleinman and Sharpley, 2003), and decreased with time after application
Page 47
32
(Eghball et al. 2002) and with successive rainfall events (Kleinman and Sharpley 2003).
Phillips et al. (1981) have found that P concentration in surface runoff water was greater
following winter application of manure compared with similar applications in spring and
fall. Royer et al. (2003) found that the risk of water contamination would be less if
manure were applied in spring rather than in the fall.
Accordingly, pathways of soil P and forms of P that are lost from fields to neighboring
water bodies are governed by many soil factors, management practices and
environmental factors. Accurate measurements of soil P forms are imperative to make
decisions on environmentally sound P management. However, some difficulties are
reported when identifying these P forms. The next section will discuss laboratory
methods which are used to analyze and characterize soil P forms and their status.
2.6 Analysis of soil Phosphorus
Phosphorus is an extremely chemically reactive nutrient element. Estimating availability
of P is complex because soluble inorganic P can be immobilized by Fe, Al and other
metal oxides in soils (Lyamuremye et al. 1996; Griffin et al. 2003). Due to these different
reactions soil P exists in different inorganic (Pi) and organic (Po) forms, which control
the supply of labile P to the soil solution. These different inorganic and organic forms
and their quantities in soil can be estimated by extraction with acids and alkalis that
dissolve specific complexes binding P (Olsen and Sommers, 1982; Tiessen and Moir,
1993). The success of any extractant to estimate available P depends on its suitability
of the chemical used in relation to particular soil properties. However, it is unlikely that
Page 48
33
an extractant could be found that would measure exclusively a single fraction of soil
inorganic P, although some components of extractants are aimed at specific P fractions.
There are different techniques for isolating specific soil P compounds, such as high-
performance liquid chromatography (HPLC), nuclear magnetic resonance spectroscopy
(NMR) and X-ray absorption near edge structure spectroscopy (XANES). However,
there are some financial and practical limitations with these methods. Again most P
analysis methods are not able to characterize all of the P in the soil and may also give
different results. As an alternative method, sequential fractionation approach has proven
useful for assessing soil P status in a wide range of soils. Sequential chemical
extraction procedures have been widely used to study the nature of soil P forms and to
quantify the availability of inorganic and organic P fractions (Chang and Jackson, 1957;
Bowman and Cole, 1978; Hedley et al. 1982b; Cross and Schlesinger, 1995). Based on
the differential solubility of the various inorganic P forms in various extracts, soil P can
be fractionated into different P fractions (Hedley et al. 1982b). The underlying
assumption in these approaches is that readily available soil P is removed first with mild
extractants, while less available or plant-unavailable P can only be extracted with
stronger acids and alkali. Residual P that remains after extracting the soil with stronger
acids and alkali represents recalcitrant inorganic and organic P forms.
In a sequential fractionation procedure, P fractions are functionally defined by the
extractants removing them from the soil. Resin-Pi represents inorganic P either from the
soil solution or weakly adsorbed on (oxy) hydroxides or carbonates (Mattingly, 1975)
and is the most biologically available P in soil (Amer et al. 1955; Sibbesen, 1977).
Alternatively, distilled water extraction (H2O-P) is used to measure a form of P
Page 49
34
correlated to soluble P loss in runoff or leachate. Phosphorus extractable by NaHCO3
consists of weakly adsorbed inorganic P compounds (Hedley et al. 1982) and easily
hydrolysable organic P compounds such as ribonucleic acids and glycerol-phosphate
(Bowman and Cole, 1978). NaHCO3 extractable inorganic P fraction is considered to be
largely available to plants (Olsen et al. 1954). NaOH-Pi and NaOH-Po compounds are
held more strongly by chemisorptions to Fe- and Al- compounds of soil (Ryden et al.
1977; McLaughlin et al. 1977). NaOH-Pi is associated with amorphous and crystalline Al
and Fe (oxy) hydroxides and clay minerals. NaOH- Po is extracted from organic
compounds. NaOH-P is considered as moderately labile soil P and considered to be
slowly available to plants by desorption (Tiessen et al. 1984). Thus, both NaHCO3-P
and NaOH-P are considered to be available P forms and can contribute to plant-
available P (Tiessen et al. 1984). Hydrochloric acid extractable P fraction (HCl- P) can
be defined as stable P, which is an inorganic P in apatite-type minerals or in octa-
calcium P (Williams et al. 1971; Tiessen et al. 1984; Frossard et al. 1995). This P
fraction is generally assumed to be of limited availability to plants (McKenzie et al.
1992a). Residual P that remains after extracting the soil with HCl extractants represents
recalcitrant P forms, which include more chemically stable organic P forms and
relatively insoluble inorganic forms. The residual P can be further fractionated into Pi
and Po with an additional extraction of NaOH, to extract P held by the internal surfaces
of soil aggregates (Beck and Sanchez, 1994; Hedley et al. 1982a; Zheng et al. 2002).
The final residual P is determined after digestion with concentrated sulfuric acid and
hydrogen peroxide (based on the Thomas et al. 1967 method).
Page 50
35
In general, fractionation methods do not quantify the organic P fraction by means of a
specific extractant. The fraction of total P remaining after inorganic P fraction has been
removed is taken as organic P (Barbanti et al. 1994). Therefore, the organic P fraction
of soils often is quantified as the difference between orthophosphate as detected by the
colorimetric acid molybdate method of Murphy and Riley (1962) before and after acid
digestion (e.g., Chardon et al. 1997). In Hedley’s fractionation procedure, two
measurements of NaHCO3 and NaOH extractions have to be conducted. One is to
determine total P content in the soil extracts after acid digestion of the filtered extracts.
The other one is to measure P contents after soil extract is acidified to precipitate
organic matter and P content in this acidified solution is considered as inorganic P.
Organic P in each extraction is calculated by the difference between inorganic P and
total P.
Many studies have used a sequential extraction technique to study the effects of
cropping systems and fertilizer application and other management practices on soil P
status in short- and long-term field experiments (Hedley et al. 1982a; Tiessen et al.
1984; Condron et al. 1985; Wagar et al. 1986; Schoenau et al. 1989; Beck and
Sanchez, 1994; Richards et al. 1995; Schmidt et al. 1996; Zhang and Mackenzie, 1997;
Zheng et al. 2001, Zheng et al. 2002: Zhang et al. 2004). Some studies have used this
technique to look into the changes of soil P during short-term incubation experiments
(Buehler et al. 2002; Daroub et al. 2000; Hedley et al. 1982a; Iyamuremye et al. 1996;
Qian and Schoenau, 2000). Although this technique is time consuming, the major
advantage of this technique is that soil P can be systematically quantified, thereby
providing a tool for investigating soil P transformations (Hedley et al. 1982a; Tiessen et
Page 51
36
al. 1984; Condron et al. 1985; Schoenau et al. 1989). Another advantage is that the
sequential fractionation approach has also been proven useful for assessing P forms in
a wide range of soils (Beck and Sanchez, 1994; Nair et al. 1995; Sui et al. 1999).
To assess soil P status either for agronomic or environmental purposes, different soil
tests are used in different regions. The next section reviews the existing soil P tests
(agronomic and environmental), their limitations and identifies the improvements
needed for environmental soil P testing.
2.7 Soil Phosphorus Testing
Traditionally, the purpose of soil P testing is to identify the “optimum” soil test P
concentration that is required for optimal plant growth and crop production. Thus, the
soil test P values serve as a guide in making fertilizer recommendations for
economically optimum rates of P addition. Given this requirement, agronomic (routine)
soil P tests have been designed to measure the amount of P in soil available for crop
uptake. Since plant uptake of P could be influenced by soil characteristics such as type
of minerals present and soil pH, the soil P test suitable for one set of soil properties may
give erroneous results if applied to other soils. For example, the ammonium fluoride and
acid based soil tests of Bray and Kurtz (1945) are recommended for acid soils but not
for calcareous soils due to the dissolution of CaCO3 and precipitation of F by Ca
interfering with the extraction of P. Therefore, a large number of soil P extraction
methods that have been designed to account for various soil types and mechanisms
controlling the chemistry of soil P.
Page 52
37
The most commonly used routine soil P tests in North America include Bray and Kurtz l,
Mehlich l, Mehlich 3, Kelowna and Olsen P (Bray and Kurtz, 1945; Mehlich, 1953, 1984;
Van Leirop, 1988; Watanabe and Olsen, 1965). Since the extracting agents used in
these tests have different abilities to extract different forms and different amounts of P,
the choice of an ideal method has been based on the regional understanding of soil
properties and the solubility of the forms of P prevalent in the region. As a general rule,
acidic soil extractants (Bray-P-1, Mehlich-3) are designed for acidic or non-calcareous
soils, where Al- and Fe- dominate P reactions, whereas alkaline extractants (Olsen) are
used for basic or calcarious soils, where Ca dominates soil P reactions. The form and
amount of soil P that is extracted by each extractant is determined by its solution pH
and the reaction of the ions present in the extractant. Using any of the chemical
extractants beyond the range of soils for which it was developed can result in the
buffering of acid or base extractants and dissolution of non-available P. Accordingly, the
reactions in chemical tests for soil P may solubilize non-labile P that are more tightly
bound to Al, Fe, or Ca complexes, which may not be plant available (Fixen and Grove,
1990; Mallarino, 1997). When this occurs accurate interpretation of test results becomes
difficult. Therefore, chemical extractants for soil P are not always equally reliable over
all soil types. Use of a given extractant is limited to specific soil types and test
interpretation is usually dependent on the region and crops grown.
The use of locally calibrated, routine soil P tests such as Olsen P or Mehlich-3 P, as
environmental risk indicators has significant practical advantages due to their well-
established data base (Sims et al. 2002). Accordingly, several studies have been
conducted in different regions to analyze the relationship between amounts of P
Page 53
38
extracted by some environmental soil P tests and P extracted by agronomic soil P tests.
Their results in general demonstrate that the P values obtained by routine agronomic P
tests are well correlated with those of the environmental P tests (Mallarino, 1999; Atia
and Mallarino, 2002; Kleinman and Sharpley, 2002; Maguire and Sims, 2002). However,
the relationships varied with soil properties such as soil type, soil pH, particle-size
composition and mineralogy and management practices, which are known to influence
soil P sorption (Pote et al. 1996; Fernandes and Coutinho, 1997; Nuernberg et al. 1998;
Magdoff et al. 1999; Pautler and Sims, 2000). Therefore across regions with contrasting
soils, only a few generalizations can be made about the relationship between agronomic
and environmental P tests.
The amount of P in soil, sediment, and water that is potentially available for algal uptake
could be defined as bioavailable P (Sharpley et al. 2008) hence bioavailable P is directly
related to the risk of P loss from a given soil or site. It is important to have a close
correlation between routine soil P test values and the levels of bioavailable P to justify
the use of routine soil P tests to assess the bioavailable P. In fact several laboratory
studies have demonstrated that soils with high agronomic soil test P values are more
likely to have higher concentrations of soluble and bioavailable P (Sims, 1998; Sibbesen
and Sharpley, 1997). The above relationship between bioavailable P and the routine
agronomic soil test P has been further supported by Sims et al. (2002), Klatt et al.
(2003) and Andraski and Bundy (2003), who have shown that routine soil P tests can
provide useful estimates of total or bioavailable P concentrations in runoff. The evidence
for correlation between the P values from routine agronomic P tests and dissolved P
levels in runoff and drainage waters, as measures of bioavailable P, have been reported
Page 54
39
by Daniel et al. (1994); Sharpley et al. (1994); Pote et al. (1996); Kleinman et al. (1999);
Sims et al. (2000); Cox and Hendricks (2000): McDowell et al. (2001), and Wang et al.
(2010, 2012). Mallarino (1999) found that soil P measured by routine soil tests (Bray-P,
Olsen-P and Mehlich-3-P as recommended for soils of the North Central region of US)
was well correlated with dissolved P in runoff water at 10-15 fold higher soil test P levels
relative to the optimum P amount needed for crop production. Many studies have
reported that P losses through erosion, surface runoff and leaching-lateral subsurface
flow are greater when soil test P values are above the agronomical optimum range
(Beauchemin et al. 1998).
Despite the evidence for correlation between routine soil P test and bioavailable P, a
number of researchers have raised concerns over the general suitability of routine soil
tests as a good diagnostic tool to monitor P levels in soils for environmental purposes.
For instance, Fang et al. (2002) found that Bray-1 P was least effective in explaining the
availability of dissolved P in runoff for calcareous soils. Allen et al. (2006) found a
similar relationship for typical USA Midwest soils. In addition, some agronomic soil test
P methods could not predict the potential P loss to surface water due to soil conditions.
For example, Mehlich-3-P has been shown to overestimate potential loss of soil P from
heavily manured soils due to formation of acid soluble Ca-P in soils following manure
applications (Sharpley et al. 2004). Torrent and Delgado, (2001) found that, at the same
soil test P reading with Olsen method, soils with a larger P sorption capacity release
less P than soils with a smaller P sorption capacity. Accordingly, the suitability of
agronomic soil test P for environmental predictions varies, depending on the nature of
the soil properties.
Page 55
40
While the studies discussed above show promise in describing the relationship between
level of soil P and surface runoff P, as an indicator of potential environmental risk of
excess P in soil, these methods have several limitations. First, routine soil test
extraction methods were designed to estimate the availability of soil P to plants as the
basis for making recommendations for additional fertilizer application. This may not
accurately reflect soil P release to water in surface or subsurface runoff. Second,
although dissolved P is an important water quality variable, it represents only the
dissolved portion of P that is readily available for aquatic plant growth. It does not reflect
fixed soil P that may become available with time. Third, these routine soil extractants
are either more acidic or alkaline compared to the pH value of the soil solution.
Therefore, a portion of P extracted by routine soil extractants is actually of small
availability. For example, acidic extractants such as Bray-P1 or Mehlich-3 extractants
would likely dissolve Ca phosphates that are sparingly water soluble but which may not
be readily available for algal uptake (Self-Davis et al. 2000). Conversely, acidic
extractants may extract less available P relative to other P tests in many CaCO3-
affected soils due to the reactions of acidic extractant with CaCO3, (Atia and Mallarino,
2002). Accordingly, these routine soil P tests may not necessarily correlate well with P
loss potential or resulting potential for algae growth in surface waters.
Another concern with routine soil tests as indicators of potential environmental risk of P
is the typical depth of soil sampled. It is generally recommended that soil samples
should be collected to plow depth, usually 0-20 cm for routine evaluation of soil fertility.
However, the zone of interaction of runoff waters with most soils is normally less than 5
cm and this sampling depth is important when conducting soil tests to estimate the
Page 56
41
potential for P losses. Consequently, different sampling procedures may be necessary
when using a soil test to estimate the potential for P loss.
As noted above, the relationships between routine soil test P and potential for P losses
are conditioned by a variety of soil properties. Therefore it is difficult to assign
universally acceptable routine soil test P values for environmentally sustainable
management systems. However, the use of mild extractants such as distilled water and
dilute salt solution (e.g. 0.01M CaCl2 and NH4Cl) overcomes the problem of location
dependency of the readings of soil test P, because these extractants have an ionic
strength similar to most soil solutions (Van der Paaw, 1971; Self-Davis et al. 2000;
Racz, 1979; Pote et al. 1995; Sotomayor-Ramirez et al. 2004). Since their use is not
limited to specific soil types, such extractants can better predict the potential for P
losses to surface and ground water compared to agronomic soil P tests. Furthermore,
McDowell and Sharpley (2001) found that water extractable P had the strongest
relationship with P lost via overland flow, while CaCl2 extractable -P had the strongest
relationship with P lost via leaching.
In addition, the extraction of soil P with distilled water provides a rapid (usually 1h
extraction time), low cost and simple method of determining the amount of soil P that
can be released from soil to runoff water. Distilled water extraction method is based on
weak desorption reactions and assumes that extraction with water replicates the
reaction between soil and runoff water. This extraction maintains the soil pH within one
unit of its original value, a desirable attribute since P solubility is highly dependent upon
soil pH (Golterman, 1988; Sharpley, 1993). Recently, distilled water extraction method
has been extensively used to study soil P effects on dissolved reactive P concentrations
Page 57
42
in runoff. For example, in a field study with tall fescue, Pote et al. (1996) found an
excellent correlation between water extractable P and dissolved reactive P
concentrations in runoff. However, there are some limitations; the amount of P extracted
by distilled water (mainly P in dissolved forms) is very small for most soils, and may not
reflect all forms of labile P. The difficulties related to chemical analysis of small amounts
of soil P also limit the use of water as an extractant. Thus, as an alternative to distilled
water extractant, the ion-sink methods can be used to measure bioavailable P in soil.
Ion sink methods that rely on sorption-desorption reactions could provide different
estimates of soil P available for plant growth compared to tests based on chemical
extractive solutions. Since ion sinks only adsorb P in soil solution onto the sink surface,
they interact minimally with the soil and do not alter the soil conditions. Since the ion
sink methods operate with negligible amount of chemical extraction, they mimic
rhizosphere conditions more closely, acting more or less analogous to the withdrawing
behaviour of a plant root. Accordingly, ion sink methods have an advantage over routine
chemical extractant methods such as Bray-1, Olsen, and Mehlich-3, because they
adsorb available P ions from the in situ labile P fractions in soil (Menon et al. 1989).
Previous studies have indicated that, ion sink methods often provide similar or better
correlations with crop responses to P compared to such correlations with chemical
extractants (Sharpley et al. 1994a). In pot experiments with canola, Qian et al. (1992)
reported that, the resin membranes have provided a better index of P availability than
conventional chemical extraction methods. Similar results were reported by Saggar et
al. (1992) for rye grass. Therefore, ion sink methods have been favorably employed to
estimate plant-available P for soils with large variations in physical and chemical
Page 58
43
properties (Menon et al. 1990; Sharpley et al. 1994). Especially where fertilizer history is
unknown and frequent changes in fertilizer type may have been made, it is difficult to
choose the appropriate soil test method. However, ion sink methods have provided
accurate estimates, irrespective of management history (Sharpley, 1993; Yang et al.
1991; Qian etal., 1992; Somasiri and Edwards, 1992).
The most promising ion sink methods are: iron-oxide impregnated filter paper strip
(FeO-strip) (Chardon et al. 1996) and Anion Exchange Resin Membrane (AEM)
methods (Abrams and Jarrell, 1992; Qian et al. 1992; Saggar et al. 1992). The FeO-
strip method has a stronger theoretical justification as a reliable estimate of bioavailable
P than do chemical extractants, since the strips act as an “infinite sink” to measure
desorbable soil P, and thus measured the potential of a soil to continue to release P
during a runoff or leaching event (Moore et al. 1998). Research has shown that FeO-
filter paper strip method effectively estimate plant available P in a wide range of soils
and management systems (Menon et al. 1989, 1990; Sharpley, 1991). Several studies
have shown that the amounts of P extracted by standard soil tests (Bray, Mehlich and
Olsen) are correlated with bioavailable P estimated by FeO-strip. For example, Sharpley
(1996) found a consistent increase in FeO-strip P with increasing levels of soil test P
(Mehlich-3) as a result of long term applications of beef, poultry and swine manures.
Barberris et al. (1996) found significant positive correlations between several soil P tests
and FeO-strip P (r = 0.62 to 0.89) for over-fertilized European soils. Pote et al. (1996)
found that FeO-strip P method accurately predicted the quantity of P susceptible to
runoff, better than most agronomic soil P tests. Sharpley (1993) also observed that the
FeO-strip P content of runoff was closely related (r2 = 0.92-0.95) with the growth of
Page 59
44
several algae species where runoff was the sole source of P and therefore Fe-oxide
strip P was a good indicator of the biological availability of P in runoff waters to algae.
However, there are some limitations with the use of FeO-coated papers. Papers coated
with FeO are not commercially available. This has led to various methods for their
preparation and use (Myers et al. 2005). Another concern is contamination of the FeO-
coated papers with fine soil particles during shaking period (Chardon et al. 1996; Myers
et al. 1995) which can lead to error in estimating desorbable P (Uusitalo and Yli-Halla,
1999). This can however, be minimized by the use of CaCl2 solution as the background
electrolyte which tend to minimize soil dispersion (Myers et al. 2005). But this can lead
to reduction in the amount of P extracted (Koopmans et al. 2001). With all these
disadvantages of the FeO-coated paper method, AEM method was developed to
simplify problems associated with ion-sink extraction of soil P.
The behaviour of AEM resembles the action of plant roots (Raven and Hossner, 1993),
adsorbing P from the soil solution and releasing counter ions (Qian et al. 1992;
Sibbesen, 1983; Tran et al. 1992).The adsorption rate of the AEM is governed by P
desorption rate from the soil solid phase (Schoenau and Huang, 1991; Cooperband and
Logan, 1994). Therefore, the amount of P adsorbed depends on the relationship
between exchange capacities of the soil solid phase and AEM and the duration of
contact between these two. Qian et al. (1992) found that, an extraction time as short as
15 min can be used without reducing the accuracy of predicted P availability for a wide
range of soils. The AEM can act as sinks or as exchangers, depending on their contact
environment (Cooperband and Logan, 1994).
Page 60
45
The major advantage of the resin extraction method is the capability to extract P from a
variety of soil types irrespective of the properties of the soil (Sharpley et al. 1994).
Durability of AEMs is another economically desirable feature of this method. They can
be recycled a large number of times without losing their physical and chemical
properties (Cooperband and Logan, 1994). Reports indicate that AEM have been re-
used as many as 50 to 500 times without losing their extraction efficiency or showing
detrimental structural effects (Saggar et al. 1990; Schoenau and Huang, 1991). This
feature makes it relatively a cheaper test compare with the use of FeO-coated papers
that can be used only once. Therefore, multiple uses would be a distinct advantage of
AEM over FeO-strip methods.
However, research with resin-based P tests (Fernandes and Coutinho, 1997; Nuernberg
et al. 1998; Fernandes et al. 1999) has shown that relationships between soil P
extracted and indices of P availability are affected by soil properties (soil pH, particle
size composition, and mineralogy) which are known to influence soil P sorption.
Therefore few generalizations are possible across contrasting soils. Since then, there is
a need to develop a suitable soil P testing method to predict soil P losses that can be
used for soils with a wide range of soil properties, so that an environmental plan can be
programmed and BMPs developed.
2.8 Research Issue
Public demand for improved management of P in agricultural systems is linked to the
threat of eutrophication from P pollution as a result of increased applications of
phosphate fertilizer and livestock manure to agricultural lands. Consequently, there
Page 61
46
have been determined efforts by soil scientists and other researchers to develop
strategies to reduce P losses from agricultural non-point sources. To a large extent,
these strategies depend on the accurate measurement of forms of P in soil, water and
residual material which are often seen as a source of surface water P.
A key component of remedial strategies to minimize P losses from agricultural non-point
sources to aquatic environments is the determination of soil P levels that exceed the
optimum levels required for crop growth. The possibility of soil P levels that exceed the
optimal level for crop growth is dependent on the soil P dynamics, which in turn is
determined by various soil management practices. A better understanding of the long
and short term changes in soil test P values as a result of widespread soil management
practices such as applying dairy or hog slurry, incorporation of composted livestock
manure and inorganic P fertilizer application is imperative to develop remedial strategies
to control the potential P pollution and managing P more efficiently for the sustainable
management of temperate agricultural soils. One of the related research issues
explored in the extant literature is the suitability of agronomic soil P test methods to
evaluate the P polluting potential of a soil and whether environmental soil P tests are
better suited to evaluate that threat.
This study contributes to our ability to evaluate the impact of various soil management
practices on the long and short term soil test P values. The study evaluates impacts of
long-term cropping and mineral fertilizer and livestock manure applications on changes
of soil inorganic and organic P fractions. It relates these changes to the amounts of P
extracted by agronomic and environmental soil testing procedures to establish a
Page 62
47
relationship between fertilizer and livestock manure P loading to the long-term potential
and risk of losing P from the soil to aquatic environments.
Page 63
48
Chapter 3: Immediate and residual effects of different forms of swine manure on
soil phosphorus fractions in a clay loam soil under corn-soybean
rotation
3.1 Abstract
Understanding P dynamics in soils applied with different forms of manure is useful for
minimizing negative impacts on environmental water quality, in addition to improving
crop use efficiency of P. The objective of this study was to evaluate both the immediate
(year of application) and the residual (following year) effects of various forms of swine
manure on soil P fractions in comparison with triple super phosphate (TSP) under a
corn-soybean rotation. A field experiment was conducted on a Brookston clay loam soil
in south-western Ontario, Canada. Treatments were three forms of swine manure [liquid
(LM), solid (SM), compost (MC)] and TSP, which were applied at the rate of 100 kg P
ha-1 only to the corn phase, and the no-P control (CK). Soils were sampled at post-
harvest stage in both corn and soybean phases and P was analyzed using a modified
Hedley’s sequential fractionation procedure.
In the corn phase, all P treatments significantly increased the soil labile (17.24 and
34.36 mg P kg-1 of H2O-P and Bicarb-Pi, respectively) and moderately labile (29.05 mg
P kg-1 P) inorganic P (Pi). The effects from all three forms of manure on a given P
fraction were similar to the effects of TSP. Total-Pi and Total-P (sum of all P forms) were
significantly increased by all P treatments, while total-Po (sum of all organic P forms)
was not. In the following year, only some of the treatments had residual effects on some
of the P fractions (MC and SM on H2O-P, all four P treatments on Bicarb-Pi, SM on
Bicarb-Po and MC, SM and TSP on NaOH-Pi). In both phases of cropping, none of the
Page 64
49
P treatments affected HCl-Pi or stable-P forms. In this study, increased soil labile P
levels associated with all P sources indicate the potential for soil P loss through leaching
and runoff to the aquatic environment with all three forms of swine manure applications
and TSP.
3.2 Introduction
Swine manure contains nutrients which are essential for plant growth, and when it is
applied to the soil at proper rates, can serve as an excellent source of essential plant
nutrients. However, there are uncertainties regarding its availability of nutrients and
cost-effectiveness for crop production while minimizing the adverse environmental
effects to water resources. Reasons for this uncertainty include large variability of P
concentrations in manure and limited research data about its effects on soil P dynamics.
In manure, P is found in both inorganic (Pi) and organic (Po) forms (Mikkelson, 1997),
yet in general these are not fully available for plant uptake. The availability of Pi in
manure is determined by the form of Pi and the capacity of the soil to precipitate or
adsorb that Pi. The Po fraction in manure is not directly available to plants. It must be
mineralized or converted into Pi forms via soil microbial activities over time before plants
can use them. Thus, the availability of Po in manure depends on the rate of
mineralization.
The proportions of organic and inorganic P in manure vary greatly. In the literature,
Brookes et al. (1997) estimated that inorganic P comprises approximately 80% of the P
in liquid hog manure with the rest present in organic form. This figure agrees with the
result of 70-90% as Pi recorded by Schoumans and Groenendijk (2000). However,
Page 65
50
Mikkelson (1997) estimated that generally up to 50% of the total P in swine manure is in
the organic form. This figure is compatible with the 49% organic P in swine manure
measured by He and Honeycutt (2001). These disparities are probably due to the
variation of manure P contents with the different manure types.
The composition of manure varies considerably due to animal physiology (type and age
of animal), feed rations and additives, type and amount of bedding, handling and
duration of storage (Lindley et al. 1988). Liquid manure (slurry) and solid manure differ
in their dry matter content, N, P and C contents along with their influence on microbial
activity and chemical changes in the soil (N’Dayegamiye and Cote, 1989). Slurries
consist of excreta produced by livestock while in a yard or building, which are mixed
with rainwater and wash water and some cases, waste bedding and feed. Therefore the
solid content of the slurry is usually low, ~ 1- 5 %. Solid manures include farmyard
manure and materials from covered straw yards, excreta with a lot of straw in it, or
solids from mechanical slurry separators. Due to its large water content, up to 99% (wet
basis) for liquid manure and 70% for solid manure, long-range haulage of fresh manure
from a livestock operation is uneconomical. However, concentrated livestock operations
often have an abundance of liquid and solid manures relative to the land on which the
manure can be spread. Accordingly, composting manure has become of great interest in
areas where surpluses of manure are found. Composting reduces volume, mass
(Larney and Hao, 2007) and moisture content of manure (usually less than 35% by
mass), and may increase the uniformity of manure (Rynk et al. 1992). These properties
reduce the transport cost and make it easier to spread the material uniformly.
Composting manure can also provide several potential advantages over the use of fresh
Page 66
51
forms of manure, such as a considerable reduction in loading of pathogens, parasites,
weed seeds and the level of odour associated with the land application (Eghball and
Lesoing, 2000; Menalled et al. 2002).
Composting of manure generally results in greater P concentrations, because P is
conserved while CO2 and NH3 losses result in 30-50% reduction in mass of C and N
(DeLuca and DeLuca, 1997). As consequence, composting generally increases the P
content but reduces the N: P ratio. Gagnon and Simard (1999) reported that composting
manure decreases the extractability and plant availability of P in the manure due to
immobilization. However, the extent of these effects varies greatly with the source of
compost material and with the method of compost management.
Composting has gained increased attention as a means of reducing the environmental
impact of livestock manure (Kashmanian and Rynk 1996, 1998), because during
composting, manure nutrients are converted to more stable forms such as and are less
likely to reach groundwater or move in surface runoff. However, there are some
disadvantages of composting manure, such as nutrient (especially N) losses,
greenhouse gas emissions and the extra cost of labour, equipment and space
necessary for composting. Furthermore, since composting increases P content of
manure on a dry matter basis (Ott and Vogtmann, 1982), the greater concentration of P
in compost may create environmental problems if applied to soils that have large
background levels of P.
Currently, agricultural producers and researchers explore the suitability of different
forms of livestock manure, including fresh slurry, solid manure and composted solid
Page 67
52
forms to satisfy the crops’ needs while minimizing adverse environmental impacts to
water resources. Some research suggests that fresh manure application may modify the
magnitude of different soil P fractions. For example, the greatest net increase in resin-P
and labile-P (in terms of percentage of total P added) occurred after mixing soil with
fresh dairy manure (Gagnon and Simard 2003). These same authors also reported that
the moderately labile P fraction was the most abundant form of P found in acidic soils
following the addition of manure compost. Similarly, a very rapid increase in anion-
exchange membrane extractable P was found by Simard et al. (2001) after the
application of liquid hog manure in a calcareous gleysolic soil in Quebec. A significant
increase in labile Pi and Po fractions was measured after 4 years of liquid dairy manure
addition to a silty clay soil (Zheng et al. 2001). However, a single application of liquid
hog manure was found to have little impact on labile P levels (Qian and Schoenau,
2000). According to these studies, the forms and availability of P in soil following
manure additions are dependent to a large extent on the form of manure applied.
Since manures vary in the degree of P availability and thus their immediate and residual
impacts on soil P forms and levels, detailed measurements of soil P forms, their
distribution and changes with time can provide important information to address the
present concerns with P contamination of surface waters. The objective of this research
was to improve the understanding of immediate effects in the year of application and the
residual effects in the following year of applying different forms of swine manures in
comparison with inorganic P fertilizer on soil P forms.
Page 68
53
3.3 Methodology
3.3.1 Site Description
The field experiment was conducted at the Eugene Whelan Research Farm of
Agriculture and Agri-Food Canada at Woodslee (42013’N, 82044’W), Ontario, Canada.
The site is characterized as humid and cool-temperate, with a mean annual air
temperature of 8.70C and mean annual precipitation of 827 mm. The soil type is
Brookston clay loam soil classified as fine loamy, mixed, mesic, Typic Argiaquoll or
Orthic Humic Gleysol.
3.3.2 Treatments, soil sampling and analysis
There were five treatments selected for this study, including four P sources: solid swine
manure, liquid swine manure, swine manure compost and inorganic fertilizer P as triple
super phosphate (0-46-0), and the control with zero nutrients (control) applied. Liquid
and solid swine manures were obtained from two local pig producers near Harrow,
Ontario and composted swine manure was obtained from Ridgetown Campus,
University of Guelph in Kent County, approximately 136 km east of Woodslee, Ontario.
Samples of each manure type were collected, chilled to 4°C and analyzed prior to
application.
First, the collected manure samples were dried at 105°C to determine moisture content.
Fresh manure samples were used for the determination of nutrient contents. Carbon
and total N were measured using a Leco Analyzer. The samples were digested with
H2SO4-H2O2 for total N, P, and K. A 10 g aliquot of hog manure was added with 100 ml
of 2M KCl, and shaken for one hour. The mixture was filtered with vacuum suction and
Page 69
54
NH4-N and NO3-N were determined colorimetrically. The physical and chemical
compositions of the various types of swine manure are given in Table 3.1.
Each study plot was 9 m wide by 25 m long. The cropping system was a corn (Zea
mays L.) soybean (Glycine max L.) rotation. Corn (2006) and soybean (2007) were
seeded at local recommended rates of 76852 and 373132 seeds ha-1, respectively
(OMAFRA, 2002). Pesticides were applied for both corn and soybean production.
Treatments were replicated three times in a randomized complete block design.
Treatments were applied at a rate of 100 kg P ha-1. Additional N and K were applied to
all treatments as inorganic fertilizers to satisfy crop needs according to the OMAFRA
(Ontario Ministry of Agriculture, Food and Rural Affairs) recommendation and taking
account of available N and K contents in the manure. Manures and inorganic fertilizer
were applied using the broadcast-incorporation method in the spring prior to planting the
corn. Manures were spread on the soil surface and incorporated immediately, or once
soil conditions allowed, by disk, triple-K tiller and packer.
Soil sampling was carried out at post-harvest stage. Sixty randomly selected soil cores
were taken from the surface soil (0-7.5 cm depth) in each plot using a standard hand
soil probe with 2.54 cm internal diameter; soil samples from each plot were pooled to
produce a composite surface soil sample for laboratory analysis. The samples were air-
dried. The pipette method was used for analyzing soil texture (Gee and Bauder, 1986).
The organic C and total N were analyzed by dry-combustion (Leco CNS-1000 Analyzer,
Leco Corp., St-Joseph, MI). Soil test P was estimated as Olsen P (Olsen and Sommers,
1982) and ammonium acetate (NH4OAC) extractable K, Ca and Mg (Knudsen et al.,
Page 70
55
1982) were determined. Soil pH was determined in a soil/water ratio of 1:1. The physical
and chemical properties of the soils used in this study are given in Table 3.2.
3.3.3 Hedley sequential Phosphorus fractionation:
Soil samples were sequentially extracted by the modified Hedley’s P fractionation
procedure to quantity the different soil Pi and Po fractions (Hedley et al. 1982),
(Figure.3.1). Phosphate was determined colorimetrically with the molybdate-ascorbic
acid procedure (Murphy and Riley, 1962) using a QuickChem Automated Analyzer
(Lachat Instrument, Milwaukee, WI).
To calculate the recovery of P in the sequential extraction, total soil P was determined
using a separate soil sample digested with H2SO4-H2O2 (Thomas et al. 1967), followed
by colorimetric measurement using a QuickChem Automated analyzer (Lachat
Instruments, Milwaukee, WI). The results indicated that the modified Hedley’s
sequential fractionation procedure had a good recovery range of 97-102 % of the total
soil phosphorus of this study.
Page 71
56
0.5 g soil
Shake 16 h in 30 ml distilled and de-ionized water,
centrifuge, pass through 0.45 µm filter filtrate for H2O - Pi & Po
Shake 16 h in 30 ml 0.5 M NaHCO3, pH 8.5,
centrifuge, pass through 0.45 µm filter filtrate for Bicarb - Pi & Po
Shake 16 h in 30 ml 0.1M NaOH filtrate for NaOH-1 Pi &Po
centrifuge, pass through 0. 45 µm filter
Shake 16 h in 30 ml 1.0M HCl filtrate for HCl - Pi
centrifuge, pass through 0.45 µm filter
Shake 16 h in 30 ml 0.1M NaOH filtrate for NaOH-2 Pi & Po
centrifuge, pass through 0.45 µm filter
Digest residue in 5 ml of
concentrated H2SO4 + H2O2 Residual P
at 360°C for 3h, for Pt analysis
Figure.3.1 Modified Hedley sequential fractionation procedure for soil phosphorus (Pi,
and Po refer to inorganic and organic P, respectively)
Page 72
57
3.3.4 Statistical Analysis
To evaluate the effects of different sources of swine manure on soil P fractions, Proc
GLM was carried out using the SAS 9.3.1. To identify the effect of treatment, amounts of
P removed by the various extracting agents were subjected to ANOVA. Subsequently,
treatment means were subjected to multiple mean comparisons to identify statistically
significant differences (SAS Institute Inc. 2001).
3.4 Results and Discussion
The distributions of Pi and Po fractions in the surface soil (0-7.5 cm) for both years (corn
and soybean) are illustrated in Figures 3.2 to 3.8. The contributions from each P fraction
to the total soil P (Total-Pt) fraction in 2006 and 2007 are given in Table 3.4. Analysis of
Variance (ANOVA) of the effect of treatments, time and the interaction (treatment * time)
on different soil P fractions are given in Table 3.5. The mean differences and their
significant levels of the P fractions from 2006 to 2007 are given in Table 3.6.
Results of this study show that addition of different forms of swine manure and inorganic
fertilizer P to the clay loam soil has influenced soil P fractions differently. Some of soil P
fractions were significantly affected by some of the treatments during the first cropping
season (2006). In addition, there were significant residual effects on some of the soil P
fractions in the following cropping season. Overall, changes in soil P concentrations
were found in most of the soil labile and moderately labile P fractions and such changes
varied by the treatments. These changes in the P fractions will be discussed in detail in
the following sections.
Page 73
58
3.4.1 Labile and moderately labile inorganic P (H2O-P, Bicarb-Pi and NaOH-1-Pi)
The P extracted by water (H2O-P) represents most labile P fraction of the soil. This P
fraction represents the freely exchangeable soil P, and may also be the most
appropriate environmental estimator of P concentrations in runoff, because water is the
solvent and transport medium for P loss from soils with runoff (Pote et al. 1996).
Under corn in 2006, addition of P from all forms of swine manure and inorganic fertilizer
treatments significantly increased the H2O-P fraction (soil solution P) compared with the
CK (Figure 3.1-a). The average concentration of H2O extractable -P in all P treated soils
was 24.51mg P kg-1, showing 17.24 mg P kg-1 increase (i.e. 237%) with the addition of
organic and inorganic P sources compared to the CK (7.27 mg P kg-1). In addition, the
similar H2O-P levels in soils treated with different forms of swine manure and fertilizer P
indicates, the effects on H2O-P were similar from organic and inorganic treatments
(Table 3.3). These results are comparable with the results reported by Du et al. (2011)
that indicated increased levels of soil solution P concentrations in soils treated with both
compost and inorganic fertilizer P. However, they observed that the soil solution P level
in the soils amended with compost was significantly greater than that in the soils treated
with inorganic fertilizer P. They suggested that the larger H2O-P concentration in
compost-treated soils could be related to the greater organic matter content of compost
(Turner et al. 2007). Organic matter may promote movement of P from soil solid phase
to soil solution phase, because organic matter releases large amounts of organic acids
when decomposed by microorganisms. These organic acids can complex Fe, Al and Ca
and thus mobilize sorbed P. In addition, organic compounds in manure directly compete
with P for the sorption sites (Guppy et al. 2005), and could prevent P from adsorbing to
Page 74
59
soil mineral surfaces, Al and Fe oxides, or carbonates (Cross and Schlesinger, 1995;
Celi et al. 1999; Wandruszka, 2006) and thereby increase P concentration in soil
solution.
Over the two year study period, H2O-P levels were significantly less under soybean
(2007) than under corn (2006) in all the treatments including the CK (Table 3.6).
Possible explanations for such decreases over the two-year period include plant P
uptake, adsorption of P onto soil components that is not water extractable and loss of
this most soluble P fraction from the surface soil through runoff and leaching.
The H2O- P levels in the following year (2007) were taken as the residual effects of the
treatments. In 2007, the average concentration of H2O-P in the soils that received P in
2006 was 10.56 mg P kg-1. There were no significant differences in the H2O-P levels
between fertilizer and manure treated soils (Table 3.3). However, significantly higher
levels of H2O-P were found in soils which were treated with MC (13.19 mg P kg-1) and
SM (10.82 mg P kg-1) in the previous year, compared to the CK (6.06 mg P kg-1). In
addition, significantly higher H2O-P levels were found in soils treated with MC in the
previous year compared to the LM (8.70 mg P kg-1) treated soils (Table 3.3). The higher
H2O-P level in the MC and SM treated soils might be related to the influence of the large
organic matter content associated with MC and SM treatments. The organic acids that
were released from MC and SM decomposition could effectively reduce P sorption to
the soil and increase soil solution P concentration (Turner et al. 2007). Furthermore, the
increased organic matter in the soils treated with MC and SM perhaps covered clay
mineral surfaces and/or chelated metal ions (Fe, Al etc.). Thus, higher level of organic
matter content may prevent Pi from adsorption to clay minerals or precipitation with
Page 75
60
metal ions (Tang et al. 2006), leading to higher available P in the soil solution. However,
in soybean phase in 2007, H2O-P levels of LM (8.70 mg P kg-1) and TSP treated soils
(9.54 mg P kg-1) were not significantly different from CK (6.06 mg P kg-1) (Table 3.3).
Given that the P in LM and TSP treated soils was more soluble and readily plant
available than P in other treatments (Mallarino et al. 2005), a greater uptake of P by
both corn and soybean crops within these two cropping periods would tend to decrease
the H2O-P levels in LM and TSP treated soils, leaving less residual P in the surface soil.
Overall, in this study, H2O-P fraction made a minimal contribution to soil total-Pt fraction;
in a range of 1- 4% in the corn phase (2006) and 1- 2% in the soybean phase (2007)
where the lowest contribution was from the CK and the highest contribution from MC
treated soils. These values are in line with Hooda et al. (2001) who reported that soil
water-extractable P fraction represented only 1.3% of soil total-Pt.
Sodium bicarbonate extractable P (Bicarb-Pi) fraction represents a major labile-P
fraction, which is plant available and may be subjected to losses through surface runoff
and leaching (Hedley et al. 1982). Bicarb-Pi fraction consists of Pi adsorbed on to
surfaces of some crystalline P compounds, sesquioxides or carbonates (Tiessen and
Moir 1993). In 2006 as well as in the following year, Bicarb-Pi fractions followed a
similar pattern as that of H2O-P (Figure 3.2-b).
In both years, significant increases in Bicarb-Pi levels were detected in all the P treated
soils compared to CK (Table 3.3). In corn phase, the average concentration of 42.75 mg
P kg-1 of Bicarb-Pi in P treated soils showed a 34.36 mg P kg-1 increase (409%)
compared to the CK (8.39 mg P kg-1). Among these P treatments, the highest Bicarb-Pi
Page 76
61
level was found in the MC treated soils (47.92 mg P kg-1 and 25.32 mg P kg-1 in 2006
and 2007 respectively) and the lowest Bicarb-Pi level was found in the LM treated soils
(37.95 mg P kg-1 and 20.48 mg P kg-1 in 2006 and 2007 respectively) compared to the
CK (Table 3.3). In addition, Bicarb-Pi fractions increased in fertilizer treated soils in a
similar manner to that of all three forms of swine-manure treated soils for both years.
Thus, there were no significant differences of Bicarb-Pi levels found among the four P
treatments (Table 3.3).
However, over the two-year study period, Bicarb-Pi fractions significantly declined for all
the P treated soils including the CK (Table 3.6). Accordingly, in soybean phase in 2007,
the average concentration of Bicarb-Pi in P treated soils was reduced to 22 mg P kg-1.
However, this residual P level was still 15.25 mg P kg-1 higher (i.e. 226%) than that of
the CK (6.75 mg P kg-1). Similar to the decreases in the H2O-P fraction, the decreases
in Bicarb-Pi fractions also could be owing to plant P uptake and the removal of P from
surface soil layer through runoff and leaching. In addition, some of the Bicarb-Pi may
have converted into other P fractions. In the corn phase in 2006, Bicarb-Pi fraction
represented about 6% of the soil total-Pt fraction from the P treated soils and about 1%
of the soil total Pt fraction from the CK. However, in the soybean phase in 2007, Bicarb-
Pi fraction contributed only about 3.5% of the total-Pt from the P treated soils and 1%
from the CK plots (Table 3.4).
On average, labile P (H2O-P and Bicarb-Pi) fraction represented 9% of total-Pt from P
treated soils and 2% of total-Pt from the CK. These results suggest that greater labile P
levels in the surface soil compared to the CK may have directly resulted from the
accumulation of P in the surface soil when P is added as swine manure (SM, MC, and
Page 77
62
LM) or as inorganic fertilizer P. Similar findings that manure applications have led to
increase in labile Pi levels were reported by Abbott and Tucker (1973), Campbell et al.
(1986) and O’Halloran (1993). Hao et al. (2008) and Zhang et al. (2004) have reported
that additions of manure and/or fertilizer to soil increased the soil test P values if the
additions were more than crop removal.
Since P has relatively low mobility in soil, most P accumulation takes place in the
surface soil. A significant accumulation of resin-Pi (P fraction which is similar to the H2O-
P fraction in sequential fractionation) in surface soil layer after applying liquid swine
manure in a Le bras silt loam soil (Gleysol) was reported by Hountin et al. (2000).
Similarly, significant increases in labile P (H2O-Pi, Bicarb-Pi and Bicarb-Po) fractions
after feedlot manure applications in a surface loamy soil (Dark Brown Chernozemic)
were observed by Dormaar and Chang (1995). Sutton et al. (1986) also reported that
extractable P concentrations in soils increased with manure and fertilizer applications
and a majority of the P accumulated in the 0-15 cm depth of the soil profile. They further
explained that, of all the nutrients applied to the soil with manure, the accumulation of P
was the greatest and, P was the only nutrient in abundant supply after the residual year
of cropping. This was owing to the inherent characteristics of P being sorbed to the soil
with little downward movement by leaching.
After sodium bi-carbonate extractable-P, the next extractable P fraction is the
moderately labile P fraction (NaOH-1-Pi). This is the source of soil labile P when soil
available P is depleted by crop uptake (Zhang et al. 2004). The moderately labile P
fraction represents the soil Pi that is associated with amorphous and crystalline Al and
Fe phosphates (Bowman and Cole 1978; Parfitt 1978) via chemisorption (Williams et al
Page 78
63
1980; Hedley et al. 1982; Tiessen and Moir 1993). This P fraction is not readily available
for plant P uptake compared to labile P (H2O-P or Bicarb-P) fraction.
Similar to the labile P fraction, in corn phase 2006, the NaOH-1-Pi fractions in soils
treated with all P sources were significantly increased compared to the CK (Table 3.3
and Figure 3.3-d), indicating considerable amounts of P accumulation in moderately
labile Pi fraction from all P sources. The average concentration of moderately labile Pi
was 56.11 mg P kg-1 for P treated soils compared to the CK (27.06 mg P kg-1), showing
29.05 mg P kg-1 average accumulation (i.e.107% higher than CK) with P addition in corn
phase.
Over the two-year period, NaOH-1-Pi levels significantly decreased in TSP, LM and SM
treated soils (Table 3.6 and Figure 3.3-d), indicating that considerable amounts of P
were moved out from the moderately labile-Pi fraction in TSP, LM and SM treated soils.
These decreases could be due to the replenishment of labile-Pi fraction, which tends to
be decreased by greater crop P uptake, or may be due to the transformation of
moderately labile Pi into more stable P fractions.
As a residual effect in the following year, 2007, significantly higher NaOH-1-Pi levels
were observed in all the P treated soils except LM compared to the CK (Table 4.3 and
Figure 4.3-d). The average concentration of NaOH-1-Pi in 2007 was 42.06 mg P kg-1 for
P treated soils compared to the CK (24.75 mg P kg-1). Therefore, as a residual effect of
P treatments, on average 17.3 mg P kg-1 P increase was observed in moderately labile
Pi pool, (i.e. 70% higher) compared to the CK. However, no significant difference was
found for NaOH-1-Pi levels between TSP and manure treatments (Table3.3 and Figure
Page 79
64
3.3-d). The contribution to the soil total-Pt fraction from NaOH-Pi fraction is in a range of
4- 8% in both crop phases, where the lowest contribution was found to be in soils of the
CK and the highest contribution from MC and SM treated soils (Table 3.4).
These results indicate that labile (H2O-P + Bicarb-Pi) and moderately labile (NaOH-1-Pi)
Pi fractions had significant treatment effects from both inorganic and organic P sources
in both corn and soybean phases compared to the CK. These results are comparable
with the findings reported by other authors from studies involving a wide range of soils.
Many have reported increases in the Bicarb-Pi and moderately labile-Pi fractions with P
applications (Ciampitti 2011; Picone et al. 2007; Wang et al. 2007; Verma et al. 2005;
Guo et al. 2000; O’Halloran 1993; Selles et al. 1995).
Although the amounts of moderately labile Pi were greater than those of Bicarb-Pi,
these two fractions followed a similar pattern of distribution among the treatments where
the highest increase was with the MC treatment followed by SM, TSP and LM
treatments (Table 3.3). The relationship between labile and moderately labile P with a
similar pattern of distribution among treatments is in agreement with the known fact that
available soil P pools are constantly replenished through reactions of dissolution or
desorption of more stable Pi (Tiessen and Moir 1993). Similar relationships were also
reported by McKenzie et al. (1992a, b) in a long-term crop rotation and fertilizer effects
study on P transformations in Chernozemic and Luvisolic soils.
3.4.2 Labile and moderately labile organic P (Bicarb-Po + NaOH-1-Po)
The Po extracted with NaHCO3 consists of loosely held low molecular weight organic
substances, such as ribonucleic acid, nucleotides and glycerophosphates (Bowman and
Page 80
65
Cole, 1978). This fraction is considered as an active fraction of soil Po because this
easily mineralizable Po form (Oberson and Joner 2005; Chauhan et al. 1981) could
contribute to plant available P after mineralizing to Bicarb-Pi (Bowman and Cole 1978).
Therefore, Bicarb-Po fraction represents a labile pool of soil Po (Frossard et al. 2000),
and the dynamic nature of soil Bicarb-Po may play a significant role in crop production,
especially when the soil is low in plant available P.
In the corn phase 2006, the average concentration of Bicarb-Po fraction was16.39 mg P
kg-1, representing 6% of soil total-Po. However, the Bicarb-Po fractions in all the P
treated soils showed values comparable to the CK, indicating that there were no
significant impacts from all three forms of swine manure and inorganic fertilizer P
treatments in the year of application (Table 3.3 and Figure 3.2-c). These results are in
agreement with those of Campbell et al. (1986) that manure additions did not change
Bicarb-Po fraction in a Black Chernozem soil. Similarly, O’Halloran (1993) also reported
no significant impacts by manure or inorganic fertilizer additions on the Bicarb-Po levels.
Accordingly, Bicarb-Po fraction appears to be relatively insensitive to the effects of
inorganic fertilizer and manure application in this study (Sharpley, 1985; O’Halloran et
al. 1987b). The results showed that the Bicarb-Po fraction accounted for about 2% of
soil total-Pt.
Over the two-year study period, the Bicarb-Po fractions of TSP and MC treated soils as
well as CK significantly declined (Table 3.6). Hence, in the soybean phase of 2007, the
average concentration of Bicarb-Po fraction was 8.2 mg P kg-1 and represented only
about 2-3% of soil total-Pt. The decreases of Bicarb-Po could be explained as
stimulation of mineralization of soil organic matter (Po pools) from newly added crop
Page 81
66
residues by greater microbial activity (Zhang et al. 2004). Similar results were observed
by Zhang and Mackenzie (1997b) and Zhang et al. (2004) who found a decrease in soil
Bicarb-Po with high levels of corn straw or swine manure application. In addition,
Tiessen et al. (1983) reported that Bicarb-Po was depleted rapidly in a Black
Chernozemic silt loam and a Dark Brown Chernozemic sandy loam soil during
cultivation. The Bicarb-Po in the SM and LM treated soils did not significantly change
from corn phase to soybean phase. As a result, Bicarb-Po fraction of the SM treated
soils (14.41 mg P kg-1) was significantly greater than that in the CK (2.81mg P kg-1). In
addition, SM treated soils showed a significantly higher Bicarb-Po value compared to
the LM (2.59 mg P kg-1). These different behaviours of Bicarb-Po with added P sources
were probably due to the variation of organic components in these different sources of
phosphorus.
Moderately labile Po (NaOH-1-Po) represents the Po held in more resistant or humified
forms, such as humic acids (Bowman and Cole 1978). This fraction was the most
abundant soil Po fraction (53% of total-Po), with the average concentration of 157.40 mg
P kg-1, representing 21-22 % of soil total-Pt in corn phase. These results are consistent
with Zhang and Mackenzie (1997) who reported that NaOH-Po was a sink for both
added Po and newly formed Po in a manure-inorganic fertilizer system in a Chicot
sandy clay loam soil. However, in both cropping seasons, moderately labile-Po fraction
in all the P-treated soils showed values comparable to the CK indicating that, NaOH-1-
Po fraction was not affected by manure or fertilizer treatments (Table 3.3). From corn
phase to soybean phase, NaOH-1-Po levels did not change significantly with manure P
treatments including CK, but changed with TSP treatment (Table 3.6 and Figure 3.3-e).
Page 82
67
A similar observation was reported by Tran and N’Dayegamiye (1995) that manure
application maintained the NaOH-Po fraction; however, this fraction was decreased by
inorganic P fertilization.
The above findings agree with the some of the findings in the literature reported by
others from a wide range of soils with a wide range of organic and inorganic P sources.
Yet, there are others with contradictory findings; for example, Zamuner et al. (2012)
reported that Po fractions were not affected by fertilization. Gagnon and Simard (2003)
reported that Bicarb-Po and moderately labile-Po fractions were less affected by
manure treatments compared to Pi fractions. Yet, O’ Halloran (1993) reported that
manure applications had decreased the moderately labile Po fraction in the surface
layer of a sandy loam soil under no-till conditions. Similarly, Ciampitti et al. (2011)
reported that fertilization exerted a large influence on the moderately labile Po fraction.
However, Hountin et al. (1999) reported that liquid pig manure application significantly
increased biological Po (NaHCO3-P and NaOH-1-Po) content in the 0-20 cm soil layer.
These diverse findings about the relationship between fertilization and labile and
moderately labile Po may be due to the differences in soil types, nature and the rates of
the P sources applied in each study.
Overall, compared to NaOH-1-Pi levels, NaOH-1-Po levels were three times greater for
all the treatments. However, NaOH-1-Po level in CK was more than five times greater
than NaOH-1-Pi level, indicating that the soil itself contained substantial amounts of
moderately labile-Po. Conflicting results were observed by Hao et al. (2008) that the
concentration of Po (extracted by NaHCO3 and NaOH) was much smaller than Pi. They
further reported that Po accounted for less than 5% of total-Pt and this percentage was
Page 83
68
not affected by the manure treatment. Other studies have also shown greater increases
in Pi than Po in soils that have received long-term applications of different types of
manure (Gale et al. 2000; Motavalli and Miles, 2002; Sharpley et al. 2004). These
results might be attributed to the fact that most of the P in manure and compost is
present as Pi (Sharpley and Moyer 2000).
3.4.3 Stable Phosphorus fraction (HCl-Pi + NaOH-2-P + Residual P)
The moderately stable P (HCl-Pi) fraction represents primary mineral P, such as apatite-
type minerals (Williams et al. 1980; Tiessen et al. 1984; Frossard et al. 1995) and other
forms of Ca- and Mg-bound P (Cross and Schlesinger 1995; Reddy et al. 1998; Simard
et al. 1995). This P fraction is generally assumed to be of low availability to plants
(Aulakh and Pasricha, 1991; Syers et al. 1972).
In both cropping seasons of 2006 and 2007, the results indicated that the HCl-Pi
fraction was not affected by fertilizer or manure treatments (Figure 3.4-f), given that the
P levels were very similar to those in the CK (Table 3.3). This indicates a minimal
contribution from swine manure and fertilizer treatments to this primary P mineral
fraction. In addition, over this two-year period, there were no measureable changes in
HCl-Pi fraction for all the treatments except LM (Table 3.6). Although decreases were
found with all the P treatments including CK, they were negligible and did not reach
significant levels.
The findings about the relationships between HCl-Pi and fertilization in previous
research are not unambiguous. For example, in one study the content of HCl-Pi was
shown to be not affected by repeated applications of barnyard manure (Campbell et al.
Page 84
69
1986). Similarly, Wagar et al. (1986) reported that Chernozemic soils which received
160 kg P ha-1 showed no significant change in HCl-Pi level in the soil. In addition,
Lyamuremye et al. (1996) also reported that no significant change occurred in HCl-Pi
content in soils amended with manure. Similar results were reported by Sharpley et al.
(1991) in studying the impact of long-term swine manure application on soil and water
resources in Eastern Oklahoma, where only small amounts of HCl-Pi accumulated in
the soil profile.
Conversely, some past studies noted possible transformation of P into the HCl-Pi pool
with animal manure applications. Shafqat et al. (2009) reported that continuous
application of manure significantly increased HCl-Pi fraction. Similarly, increased HCl-Pi
levels especially in the upper soil layers with a history of pig slurry application were
noted by Gatiboni et al. (2008). These increases could be related with the fact that, in
general, more than 60% of P contained in swine slurry was found in the inorganic
fraction bonded to Ca (Barnett 1994; Sui et al. 1999). This is consistent with the findings
of the study conducted by Sharpley and Smith (1995), to determine the effect of animal
manure on soil P fractions. The most dramatic increase was observed in HCl
extractable P fraction, which might be the result of the addition of large amounts of Ca
with the manure. McKenzie et al. (1992b) and Song et al. (2007) also reported that HCl-
Pi increased due to fertilizer P during long-term crop production. However, it has been
found that, Ca-P originating from fertilizer P could be among the least stable P
compounds in specified soil types and can be readily re-mobilized back into the labile P
fractions (O’Halloran et al. 1987).
Page 85
70
In both cropping phases, the amounts of HCl-Pi were greater than all other Pi fractions
for all treatments including the CK, indicating that soil itself contained considerable
amounts of HCl-Pi (Table 3.3). The average concentration of HCl-Pi was 192 and 171
mg P kg-1 in corn and soybean phase respectively. These high levels of HCl-Pi content
imply that a considerable amount of P in the soil is associated with Ca.
Considering total inorganic P in soil, the moderately stable P fraction contributes about
60% of soil total-Pi. Thus, moderately stable P fraction was the most abundant form of
Pi found in the soil and represented 26 - 29% of the total-Pt in both phases (Table 3.2).
Similarly, Daroub et al. (2000) reported that Ca-bound P accounted for 15 to 42% of
total-Pt in three long-term research sites. However, a much higher contribution (56%) of
HCl-Pi to total-Pt has been reported in a calcareous soil from Manitoba, Canada where
different rates of mineral P fertilizer were used (Yang et al. 2002).
After the HCl-Pi extraction, the remaining P fraction contains chemically stable organic
P forms and relatively insoluble inorganic P forms. This stable P fraction does not
contribute substantially to meet the plant P needs or to load P into surface water. Adding
another NaOH extraction to the end of the acid extraction to solubilize the occluded P
(Condron et al. 1990), the stable P fraction is further divided into NaOH-2- extractable P
(Pi and -Po) fraction (which is held within the internal surfaces of stable soil aggregates)
and the final residual-P fraction (Res-P), which contains highly recalcitrant Pi (Tiessen
and Moir 1993) and some stable forms of Po (Cross and Schlesinger 1995). These
stable forms of soil P are probably not directly available to plants, but may be involved
in long-term P transformations in soil (Tiessen et al. 1983).
Page 86
71
In both cropping seasons, NaOH-2-Pi and NaOH-2-Po fractions did not show any
significant differences between the treatments (Figure 3.5-g and -h). All of the
treatments including the CK showed similar levels of NaOH-2-Pi and Po, indicating that
this occluded P fraction had no impacts from manure and inorganic fertilizer treatments.
However, this fraction represented considerable amounts, about 20-24 % of soil total-Pt
in both phases (Table 3.4). These results further indicated that NaOH-2-Po contents
were much greater (more than five times) than NaOH-2-Pi contents in both phases
(Table 3.3 and Figure 3.5-g and -h). Accordingly, the NaOH-2-Po fraction represented
about 42 % of soil total-Po fraction, while NaOH-2-Pi fraction represented about 7.2% of
soil total-Pi. The reason for the higher NaOH-2-Po level is probably attributable to the
fact that the soil itself may contain a significant amount of chemically stable Po
compounds. Over the two-year period, NaOH-2-Pi and Po levels in all the treated soils
including CK, did not change significantly except in LM (Table 3.6).
After the NaOH-2 extraction, the most recalcitrant fraction of P in the soil is Residual P
(Res-P) extracted by concentrated H2SO4 + H2O2 at 360˚C digestion (Tiessen and Moir
1993). This Res-P fraction does not contribute considerably to meet plant P needs or
loading to surface water in soluble forms, because it consists of more chemically stable
organic P forms such as humus and humic acids (Stewart et al. 1980) and relatively
insoluble inorganic P forms (Thomas et al. 1967). In this study, no significant differences
were found for Res-P fraction between the treatments and the CK indicating that
addition of manure and inorganic fertilizer had no immediate impact on Res-P (Figure
3.6-i). The average concentration of Res-P fraction was 101.96 mg P kg-1 representing
14 -15 % of total-Pt in the year of application.
Page 87
72
Results also indicated that, within this two-year period, the Res-P fraction in all the P
treated soils including the CK did not change significantly except in the SM treated soils
(Table 3.6 and Figure 3.6-i). This reduction of Res-P with SM treatment may be due to
the transformation of Res-P into other P fractions, such as NaOH-Pi. Similarly, the Res-
P transformation to NaOH-Pi was reported by Zhang and Mackenzie (1997) in a study
investigating long-term soil P changes in a monoculture corn system using path
analysis. Since Res-P comprises a very stable P pool, significant changes in Res-P
concentration cannot be expected within this two year short-term period, because
conversion of manure P or fertilizer P into stable forms is a very slow process. However,
it was reported that Res-P increased with increasing rate of fertilizer application (Zhang
et al. 2004). In contrast, Zheng et al. (2003) found that the resistant pools in a Humic
Gleysolic clay soil were not influenced by fertilizer P application. However, Zhang et al.
(2006) reported that especially in exhaustive cropping systems, Res-P appeared to
continue to replenish the available P in soil. These contradictory results could be
attributed to differences in soil properties, experimental conditions, and different
management practices from location to location as well as continuously changing soil P
pools.
3.4.4 Total inorganic P (Total-Pi), Total organic P (Total-Po) and Total P (Total-Pt)
The total-Pi fraction was defined as the sum of all Pi fractions (labile-Pi + moderately
labile-Pi + moderately stable-Pi + stable-Pi) obtained from the sequential fractionation
procedure. In corn phase (2006), total-Pi levels were significantly increased in all the
manure and fertilizer treated soils compared to the CK. The average concentration of
total-Pi with P treatments was 341.65 mg P kg-1, i.e. 96.92 mg P kg-1 increase compared
Page 88
73
to the CK (244.73 mg P kg-1). This shows application of P from different forms of swine
manure and inorganic P fertilizer resulted in accumulation of considerable amounts
(40% higher than CK) of P in total-Pi fraction. The highest increase was found with MC
(105.17 mg P kg-1) and the lowest increase was found with SM (86.13 mg P kg-1)
compared to the CK. In addition, all the swine manure treatments showed total-Pi
values similar to the TSP, indicating no significant differences between these manure
and inorganic P fertilizer treatments in the year of application (Table 3.3 and Figure 3.7-
k). The reason for this outcome may be that, in the corn phase, P was added at the
same rate from all of the P sources (i.e. 100 kg P ha-1), and also due to the quite similar
amount of crop P removal from these treatments.
Over the two-year period, total-Pi levels have significantly decreased from the corn
phase to the soybean phase for all the P treatments (Table 3.6). These decreases may
be due to the removal of P by soybean crops, transformation of Pi into unavailable P
forms, immobilization of P by microorganisms in order to maintain energy to mineralize
the organic residues added into the soil and also due to the losses from the soil through
surface runoff and leaching.
In the following year 2007, none of these treatments had a significant residual impact on
total-Pi fraction (Table 3.3). However, the average concentration of total-Pi in soils which
received P was 270.11 mg P kg-1. Accordingly, within the two-year period, the average
reduction of total-Pi in soils which received P treatments was 71.54 mg P kg-1. This
total-Pi concentration was 50.69 mg P kg-1 higher than that of in CK (219.42 mg P kg-1).
This indicates, although the residual effects were insignificant, total-Pi levels in the soils
which received P in the previous year was 23% higher than CK. These results reveal
Page 89
74
that, regardless of the P source, added P from all forms of swine manure and inorganic
fertilizer made a considerable contribution to total-Pi fraction in the year of application
and the positive residual effects on soybean phase in the following year. In addition, this
increment may be partly accounted for by the transformations of soil Po into Pi forms
within this two-year period.
Overall, the total-Pi fraction represented 39- 47% and 39- 44% of the soil total-Pt in corn
phase and in soybean phase respectively (Table 3.4). These findings are somewhat
less than those from Sharpley and Moyer (2000) and Eghball (2003), who reported that
most of the P in swine manure was present as Pi. Dou et al. (2000) also reported that
most (up to 84%) of the P in manure was in available Pi forms; however, this Pi could be
susceptible to runoff loss after land application.
The total-Po fraction can be defined as the sum of all the Po fractions (Bicarb-Po +
NaOH-1-Po + NaOH-2-Po) obtained from the P fractionation. In this study, Bicarb-Po
accounted for 6% of total-Po, while moderately labile Po accounted for 52% of total-Po
and was the major Po fraction of this soil. The stable-Po (NaOH-2-Po) fraction
accounted for 42% soil total-Po. In the year of P application, the average concentration
of total-Po in soils treated with P was 295.77 mg P kg-1, showing 10.79 mg P kg-1 higher
level compared to the CK (284.98 mg P kg-1). However, none of these treatments had
significant impacts on total-Po fraction, indicating 3.8% increase was not enough to
show a significant impact (Table 3.3 and Figure 3.7-l). This indicates, within this short-
term period, total-Po fraction was not affected considerably due to swine manure or
inorganic fertilizer applications. Perhaps rates of manure applied may not have been
high enough for significant impact on soil-Po fraction. Furthermore, generally swine
Page 90
75
manure contains more Pi than Po and inorganic fertilizer P does not contain Po at all;
therefore, less contribution to soil Po fraction would be expected.
Over the two-year period, the total-Po levels have significantly decreased in TSP and in
SM treated soils while the total-Po fraction in the LM and MC treated soils remained
unchanged as in the CK (Figure 3.7-l and Table 3.6). This significant reduction of total-
Po with TSP treatment over the two-year period was mainly accounted for by reduction
of Bicarb-Po as well as NaOH-Po fractions, which could be a source of labile P when
available P is drawn down due to plant P uptake. Similarly, Oniani et al. (1973) also
reported that super phosphate addition led to a decrease in Po fraction of the soil.
In terms of absolute amounts, total-Pi levels were generally greater than total-Po levels
in soils treated with manure (LM, MC and SM) and fertilizer in the year of application.
Several other studies have also shown more Pi forms than Po forms in soils that have
received different types of manure (Sharlpey et al. 1998, 2004; Gale et al. 2000;
Motavalli and Miles 2002). This is because manure contains higher amounts of P in
inorganic form and inorganic fertilizer P is entirely in Pi form. However, soils in the CK
plots showed relatively higher total-Po levels compared to the total-Pi levels indicating
that the soil itself contained considerable amounts of Po.
In the following year 2007, total-Po levels were greater than total-Pi levels for soils
treated with LM and SM in the previous year, including CK. This relatively lower total-Pi
concentration may be due to plant P uptake, immobilization of Pi into Po by microbes,
and also may be due to Pi runoff or leaching losses from surface soil. Generally,
inorganic fertilizers are in the soluble Pi form just after land application; therefore, higher
Page 91
76
plant uptake can be expected. Eghball et al. (2002) reported that P in swine manure
was 91% plant-available within the year of application.
In this study, over this two-year period, both total-Pi and total-Po fractions decreased in
terms of absolute values for all P treated soils including CK (Table 3.3). This may
happen due to the internal transformations of P between P pools when labile P pools
were depleted due to plant uptake. When the Pi content of a soil decreases, the Po pool
can be mineralized into Pi pool, decreasing Po levels. Overall, in corn phase (2006), the
contribution from total-Po fraction to soil total-Pt was about 39 - 45% and in the
following year of soybean phase (2007), total-Po fraction accounted about 40 - 45% of
the soil total-Pt. This indicates, within this short-term period, total-Po fraction has not
changed considerably due to swine manure or inorganic fertilizer applications. The
reasons may be that the manure applied did not add enough Po to the soil Po pool to be
significantly detected and\or the depletion of Po was not adequate to result in a
measureable change.
The total-Pt fraction can be considered as the sum of total-Pi and total-Po fractions
together with most stable Res-P fraction obtained from the H2SO4 + H2O2 digestion of P.
In corn phase (2006), significantly higher (i.e.17.8% higher than CK) amounts of total-
Pt, were observed with all swine manure and fertilizer treatments compared to the CK
(Figure 3.7-j and Table 3.3). The average concentration of total-Pt in soils, which
received P treatments was 739.38 mg P kg-1, which was 111.75 mg P kg-1 higher
compared to the CK (627.63 mg P kg-1), indicating a considerable amount of P
accumulation in surface (0-15 cm) soil. This accumulation was mainly due to the P
addition with P sources; however, it may partially be contributed by the P addition from
Page 92
77
crop residues. There were no significant differences between different forms of swine
manure treatments and TSP for total-Pt levels.
Over the two-year period, total-Pt levels in all P treated soils significantly decreased;
however, the decrease of total-Pt level in CK was insignificant (Table 3.6). These
significant decreases in plots with manure and fertilizer treatments could be due to
greater crop P uptake than CK and also due to soil P losses through surface runoff and
leaching. In the following year in 2007, the results indicate that the total-Pt fraction was
not affected by residual fertilizer or manure treatments, given that residual treatment
effects were not significantly different between all P treatments and the CK. However,
the average total-Pt level in all P treated soils was 632.06 mg P kg-1, showing 65.76 mg
P kg-1 higher total-Pt concentrations compared to the CK (566.31 mg P kg-1). Although
residual treatment effects were insignificant, this 11.6 % increase in total-Pt level in
soils, which received P in previous year, indicate that significant total-Pt changes require
long periods under cultivation. Therefore, a two-year period was not sufficient to detect
significant residual impact of previous year manure and fertilizer treatments on total-Pt
levels (Table 3.3).
3.5 Conclusions
This study revealed that additions of all three forms of swine manure (LM, SM and MC)
and inorganic fertilizer P (TSP) to clay loam soils influenced the labile P (H2O-P and
NaHCO3-Pi) and the moderately labile Pi (NaOH-Pi) fractions in the surface soils in the
year of application. The effects from all three forms of manure on a given P fraction
were comparable to the effects of TSP on the same P fraction, indicating no significant
Page 93
78
differences between swine manure and fertilizer P treatments in the year of application.
The greatest forms of P found in this soil following swine manure and inorganic fertilizer
P addition were associated with the moderately labile P fraction. Total-Pi and Total-Pt
were significantly increased by all P treatments, while total-Po was not.
In the following year, only some of the treatments had residual effects on some of the P
fractions. However, none of the P treatments showed significant increases of Total-Pi,
Total-Po and Total-Pt as the residual effects of these treatments. In both phases of
cropping, none of the P treatments affected HCl-Pi or stable-P forms. Overall,
contributions of P from different forms of swine manure and inorganic fertilizer P are not
readily incorporated into Po and stable P fractions. In this study, increased soil test P
levels associated with all P sources indicate the potential for soil P loss through leaching
and runoff to the aquatic environment with all three forms of swine manure applications
and TSP.
Page 94
79
Table 3.1 Physical and chemical compositions of the different forms of swine manure
materials applied to corn phase in 2006 on a Brookston clay loam at
Woodslee, Ontario, Canada.
Parameter
Liquid swine manure Solid swine manure Composted swine manure
g kg-1
Dry matter
60.4 ± 0.27 486 ± 8.50 279 ± 3.70
Organic C
28.6 ± 0.60 188 ± 6.99 88.0 ± 5.08 Total N
5.89 ± 0.08 23.7 ± 5.88 18.3 ± 1.12
NH4-N
2.50 ± 0.11 4.56 ± 0.15 3.63 ± 0.36
Total P
1.73 ± 0.01 3.79 ± 0.42 2.91 ± 0.42
Total K
1.77 ± 0.01 7.84 ± 0.75 4.18 ± 0.22
pH
7.7 8.2 6.6
Dry matter was measured on a wet weight basis and other parameters were measured
on a dry weight basis (Mean ± SE; n = 2 for dry matter and n = 3 for other parameters;
the concentration of NO3-N was negligible.
Page 95
80
Table 3.2 Physical and chemical characteristics of the Brookston clay loam soil used in
field plots at Eugene Whalen Research Farm, Woodslee, Ontario, Canada.
parameter Units
Soil pH (soil: water 1:1 w/w) 6.1
Bulk density 1.51 ± 0.04 g cm-3
Sand 26%
Silt 34%
Clay 40%
CEC 18.8 ± 0.4 cmol kg-1
Organic C 22.7 ± 0.0 g kg-1
Total N 1.95 ± 0.0 g kg-1
Inorganic N (NH4-N + NO3-N) 14.1 ± 1.55 mg kg-1
Olsen test P 12.0 ± 1.0 mg kg-1
NH4OAc extractable K 131 ± 1.9 mg kg-1
NH4OAc extractable Ca 2.43 ± 0.1 g kg-1
NH4OAc extractable Mg 0.39 ± 0.0 g kg-1
Page 96
81
Table 3.3 Distribution of Phosphorus fractions (mg P Kg-1) for different phosphorus sources in 2006 and 2007
2006 H2O-Pt
NaHCO3
-Pi NaHCO3
-Po
NaOH-1-Pi
NaOH-1-Po
HCl-Pi NaOH-
2-Pi NaOH-2_Po
Res-P Total-Pi Total-
Po Total-Pt
TSP 19.46 a 41.72
a 20.23
a 56.99
a 161.91
a 197.34
a 23.14
a 119.68
a 105.81
a 338.65
a 301.81
a 746.27
a
LM 26.29 a 37.95
a 10.88
a 51.68
a 160.92
a 209.76
a 21.51
a 127.57
a 98.19
a 347.18
a 299.38
a 744.75
a
MC 30.93 a 47.92
a 17.52
a 58.78
a 152.30
a 187.64
a 24.63
a 122.04
a 101.01
a 349.90
a 291.87
a 742.77
a
SM 21.37 a 43.42
a 16.93
a 56.97
a 154.47
a 185.01
a 24.09
a 118.63
a 102.83
a 330.86
a 290.03
a 723.72
a
CK 7.27 b 8.39
b 18.79
a 27.06
b 139.85
a 179.96
a 22.04
a 126.34
a 97.93
a 244.73
b 284.98
a 627.63
b
2007
TSP 9.54 abc
20.93 a 8.77
ab 41.95
a 147.15
a 184.46
a 21.46
a 115.64
a 96.61
a 278.34
a 271.56
a 646.51
a
LM 8.70 bc
20.48 a 2.59
b 37.06
ab 148.93
a 179.07
a 21.19
a 115.85
a 96.06
a 266.50
a 267.38
a 629.94
a
MC 13.19 a 25.32
a 6.93
ab 47.30
a 136.01
a 164.83
a 22.92
a 111.94
a 97.52
a 273.55
a 254.88
a 625.95
a
SM 10.82 ab
21.27 a
14.41 a
41.93 a 144.29
a 166.36
a 21.65
a 111.41
a 93.71
a 262.03
a 270.11
a 625.85
a
CK 6.06 c 6.75
b 2.81
b 24.75
b 131.27
a 161.43
a 20.44
a 117.18
a 95.62
a 219.42
a 251.26
a 566.31
a
Mean values within the same column followed by the same superscript are not statistically significantly different at P≤ 0.05
TSP: Inorganic Phosphate
LM: Liquid Swine Manure
MC: Manure Compost
SM: Straw Manure
CK : Control
Page 97
82
Table 3.4 Phosphorus fractions for different phosphorus sources in both cropping phases (% of Total-P)
P source
H2O-Pt NaHCO3
-Pi NaHCO3
-Po NaOH-
1-Pi NaOH-1-Po
HCl-Pi NaOH-
2-Pi NaOH-2-Po
Res-P Total-
Pi Total-
Po
2006
TSP 2.61 5.59 2.71 7.64 21.69 26.44 3.10 16.04 14.18 45.38 40.44
LM 3.53 5.10 1.46 6.94 21.61 28.17 2.89 17.13 13.18 46.62 40.20
MC 4.16 6.45 2.36 7.91 20.50 25.26 3.32 16.43 13.60 47.11 39.29
SM 2.95 6.00 2.34 7.87 21.54 25.56 3.33 16.39 14.21 45.72 40.08
CK 1.16 1.34 2.99 4.31 22.28 28.67 3.51 20.13 15.60 38.99 45.41
2007
TSP 1.48 3.24 1.36 6.49 22.76 28.53 3.32 17.89 14.94 43.05 42.00
LM 1.38 3.25 0.41 5.88 23.64 28.43 3.36 18.39 15.25 42.31 42.44
MC 2.11 4.05 1.11 7.56 21.73 26.33 3.66 17.88 15.58 43.70 40.72
SM 1.73 3.40 2.30 6.70 23.06 26.58 3.46 17.80 14.97 41.87 43.16
CK 1.07 1.19 0.50 4.37 23.18 28.51 3.61 20.69 16.89 38.75 44.37
TSP: Inorganic Phosphate
LM: Liquid Swine Manure
MC: Manure Compost
SM: Straw Manure
CK: Control
Page 98
83
Table 3.5 The significance levels of Analysis of Variance (ANOVA) for main effects
Source H2O-Pt NaHCO3-Pi
NaHCO3-Po
NaOH-1-Pi
NaOH-1-Po
HCl-Pi
NaOH-2-Pi
NaOH-2-Po
Res-P Total-Pi
Total-Po
Total-Pt
Model * * * * NS * NS NS NS * NS *
Treatment * * NS * NS NS NS NS NS * NS *
Time * * * * * * NS * * * * *
Treat*time * * * NS NS NS NS NS NS NS NS NS
R2 0.84 0.92 0.73 0.86 0.44 0.51 0.34 0.36 0.47 0.80 0.39 0.80
* Significant at P ≤ 0.05 level
Table 3.6 Treatment mean differences between 2006 and 2007, and their significant levels of the Hedley P
fractions
P source
H2O-Pt NaHCO3
-Pi NaHCO3-
Po NaOH-1-Pi
NaOH-1-Po
HCl-Pi NaOH-2-Pi
NaOH-2-Po
Res-P Total-
Pi Total-
Po Total-Pt
TSP 9.91* 20.79* 11.46* 15.05* 14.75* 12.88 1.68 4.05 9.20 60.31* 30.25* 99.76*
LM 17.59* 17.47* 8.29 14.62* 11.99 30.69* 0.31 11.72* 2.13 80.68* 32.00 114.81*
MC 17.75* 22.60* 10.59* 11.48 16.29 22.82 1.71 10.11 3.49 76.35* 37.00 116.84*
SM 10.55* 22.15* 2.52 15.04* 10.18 18.66 2.43 7.22 9.12* 68.83* 19.93* 97.88*
CK 1.21* 1.64* 15.98* 2.31 8.58 18.54 1.60 9.16 2.31 25.31 33.71 61.32
* Significant at P ≤ 0.05 level
Page 99
84
Figure 3.2 The amounts of water extractable P fraction for soils treated with inorganic fertilizer P (TSP), Liquid
Swine Manure (LM), Swine Manure Compost (MC), Solid Swine Manure (SM) and the control (CK) for corn phase
in 2006 (blue) and soybean phase in 2007 (red) in Brookston clay loam soil.
19.4
6
26.2
9
30.9
3
21.3
7
7.2
7 9.5
4
8.7
0
13.1
9
10.8
2
6.0
6
0
5
10
15
20
25
30
35
TSP LM MC SM CK
So
il P
(m
g P
kg
-1)
P source
Water extractable- Pt vs. P source 2006
2007
(a)
Page 100
85
Figure 3.3 The amounts of NaHCO3 extractable -Pi and -Po fractions for soils treated with inorganic fertilizer P (TSP),
Liquid Swine Manure (LM), Swine Manure Compost (MC), Solid Swine Manure (SM) and the control (CK) for corn
phase in 2006 (blue) and soybean phase in 2007 (red) in Brookston clay loam soil
41.7
2
37.9
5
47.9
1
43.4
2
8.3
9
20.9
3
20.4
8
25.3
2
21.2
7
6.7
5
0
10
20
30
40
50
60
TSP LM MC SM CK
So
il P
(m
g P
kg
-1)
P source
Bicarb-Pi vs. P source
2006
2007
(b)
20.2
3
10.8
8 1
7.5
2
16.9
3
18.7
9
8.7
7
2.5
9 6.9
3
14.4
1
2.8
1
0
10
20
30
40
50
60
TSP LM MC SM CK
So
il P
(m
g P
kg
-1)
P source
Bicarb-Po vs. P source
2006
2007
(c)
Page 101
86
Figure 3.4 The amounts of NaOH-1 extractable -Pi and -Po fractions for soils treated with inorganic fertilizer P (TSP),
Liquid Swine Manure (LM), Swine Manure Compost (MC), Solid Swine Manure (SM) and the control (CK) for corn
phase in 2006 (blue) and soybean phase in 2007 (red) in Brookston clay loam soil.
56.9
9
51.6
8
58.7
8
56.9
7
27.0
6
41.9
5
37.0
6
47.3
0
41.9
3
24.7
5
0
20
40
60
80
100
120
140
160
180
TSP LM MC SM CK
So
il P
(m
g P
kg
-1)
P source
Moderately labile Pi vs. P source
2006
2007
(d)
161.9
0
160.9
2
152.3
0
154.4
7
139.8
5
147.1
5
148.9
3
136.0
1
144.2
9
131.2
7
0
20
40
60
80
100
120
140
160
180
TSP LM MC SM CK
So
il P
(m
g P
kg
-1)
P source
Moderately labile Po vs. P source
2006
2007
(e)
Page 102
87
Figure 3.5 The amounts of HCl extractable -Pi fraction for soils treated with inorganic fertilizer P (TSP), Liquid
Swine Manure (LM), Swine Manure Compost (MC), Solid Swine Manure (SM) and the control (CK) for corn phase
in 2006 (blue) and soybean phase in 2007 (red) in Brookston clay loam soil.
197.3
4
209.7
6
187.6
4
185.0
1
179.9
6
184.4
6
179.0
7
164.8
3
166.3
6
161.4
3
0
50
100
150
200
250
TSP LM MC SM CK
So
il P
(m
g P
kg
-1)
P source
Moderately stable P vs. P source
2006
2007
(f)
Page 103
88
Figure 3.6 The amounts of NaOH-2-extractable -Pi and -Po fractions for soils treated with inorganic fertilizer P (TSP),
Liquid Swine Manure (LM), Swine Manure Compost (MC), Solid Swine Manure (SM) and the control (CK) for corn
phase in 2006 (blue) and soybean phase in 2007 (red) in Brookston clay loam soil.
23.1
4
21.5
1
24.6
3
24.0
9
22.0
4
21.4
6
21.1
9
22.9
2
21.6
5
20.4
4
0
20
40
60
80
100
120
140
TSP LM MC SM CK
So
il P
(m
g P
kg
-1)
P source
NaOH-2-Pi vs. P source
2006
2007
(g)
119.6
8
127.5
7
122.0
4
118.6
3
126.3
4
115.6
3
115.8
5
111.9
4
111.4
1
117.1
8
0
20
40
60
80
100
120
140
TSP LM MC SM CK
So
il P
(m
g P
kg
-1)
P source
NaOH-2-Po vs. P source
2006
2007
(h)
Page 104
89
Figure 3.7 The amounts of Residual P fraction and Total-Pt fraction for soils treated with inorganic fertilizer P
(TSP), Liquid Swine Manure (LM), Swine Manure Compost (MC), Solid Swine Manure (SM) and the control (CK)
for corn phase in 2006 (blue) and soybean phase in 2007 (red) in Brookston clay loam soil.
105.8
1
98.1
9
101.0
1
102.8
3
97.9
3
96.6
1
96.0
6
97.5
2
93.7
1
95.6
2
80
85
90
95
100
105
110
115
TSP LM MC SM CK
So
il P
(m
g P
kg
-1)
P source
Soil Residual P vs. P source
2006
2007
(i)
746.2
7
744.7
5
742.7
7
723.7
2
627.6
3
646.5
1
629.9
4
625.9
5
625.8
5
566.3
1
0
100
200
300
400
500
600
700
800
900
TSP LM MC SM CK
So
il P
(m
g P
kg
-1)
P source
Total soil Pt vs. P source
2006
2007
(j)
Page 105
90
Figure 3.8 The amounts of Total Pi and Total Po for soils treated with inorganic fertilizer P (TSP), Liquid Swine Manure
(LM), Swine Manure Compost (MC), Solid Swine Manure (SM) and the control (CK) for corn phase in 2006 (blue) and
soybean phase in 2007 (red) in Brookston clay loam soil.
338.6
5
347.1
8
349.9
0
330.8
6
244.7
3
278.3
4
266.5
0
273.5
5
262.0
3
219.4
2
0
50
100
150
200
250
300
350
400
TSP LM MC SM CK
So
il P
(m
g P
kg
-1)
P source
Total inorganic P vs. P source
2006
2007
(k)
301.8
1
299.3
8
291.8
7
290.0
3
284.9
8
271.5
6
267.3
8
254.8
8
270.1
1
251.2
6
0
50
100
150
200
250
300
350
400
TSP LM MC SM CK
So
il P
(m
g P
kg
-1)
P source
Total organic P vs. P source
2006
2007
(l)
Page 106
91
Chapter 4: Phosphorous fractions in a grassland soil following long-term
application of dairy manure slurry and inorganic fertilizer
4.1 Abstract
Impairment of freshwater quality by accelerated eutrophication has focused attention on
manure management and the potential for P loss through runoff and leaching. The
objective of this study was to assess the long-term effects of dairy manure slurry (DMS)
and inorganic fertilizer (Ammonium nitrate; AN) on changes and distribution of soil P
forms in the soil profile. Plots of tall fescue (Festuca arundinacea) sward in the south
coastal region of BC, Canada, were treated with DMS or AN at 50 or 100 kg NH4-N ha-1
up to four times per year. Control plots received no manure or fertilizer. Soil samples
were collected at four depths (0-7.5, 7.5-15, 15-30 and 30-60 cm) and analyzed for P
fractions using a modified Hedley’s sequential technique. Application of DMS had
significantly different effects on soil inorganic P (Pi) fractions compared to the AN
fertilizer and such impacts were higher in the near-surface soil than in deep layers.
Phosphorus accumulation with either rate of DMS application was mainly in labile P
(H2O- Pi + Bicarb-Pi) and moderately stable P (HCl-Pi) fractions in top (0-15 cm) soil
layer, while no significant impacts on soil organic P (Po) and resistant fractions. The
main conclusion of this study was that P supplied with DMS can have both short-term
(labile P) and long-term (moderately stable P) impacts on soil P availability and risk of P
loss to the aquatic environment. On a short-term scale, the contribution from surface
soil layers was around 22% (2 and 20% from H2O-Pt and Bicarb-Pt from high rate of
manure treated soils, respectively) of total soil P from soil labile fraction representing a
considerable potential for surface water pollution.
Page 107
92
4.2 Introduction
Dairy manure slurry (DMS) is a potentially important source of essential plant macro
nutrients, and can be used as a supplement for inorganic fertilizers in crop production.
There is interest in applying DMS on perennial forages, because these crops often take
up more nutrients than annual crops, and also allow several applications per year. This
is especially beneficial in the regions of increased livestock density. Since forages
provide year-round ground cover and typically have deep roots, manure may pose less
risk of run-off (Bittman et al. 2006). However, there are uncertainties over availability of
nutrients in DMS in the immediate and long-term, and the impacts of DMS on soil
inorganic P (Pi) and organic (Po) fractions compared to that of inorganic fertilizer. This
uncertainty also contributes to concerns regarding potential risk of soil P loading to
aquatic environments.
A wide range of effects of inorganic fertilizer and livestock manure applications on
different fractions of soil P have been reported in past studies. Such effects on soil P
fractions depend mainly on the rates of fertilizer or manure applications, P removal by
crops, inherent soil properties and climatic conditions. In general, continuous and
prolonged application of manure could lead to accumulation of both Pi and Po forms in
soil (Oniani et al. 1973; McKenzie et al. 1992a, b). Some studies have reported that
manure application has increased the concentrations of both total and soluble P, as well
as stable Po (Erich et al. 2002; Ylivainio et al. 2008; Waldrip-Dial et al. 2009). However,
Zhang and Mackenzie (1997) found that addition of manure has significantly increased
the labile (Bicarb-Pi and -Po) and moderately labile P (NaOH-Pi and -Po) fractions,
whereas stable P forms (HCl-P and residual-P) remained unaffected. Similarly, Meek et
Page 108
93
al. (1982) and O’Halloran (1993) reported that Bicarb-Pi and NaOH-Pi fractions had
significantly increased after manure applications. Abbott and Tucker (1973) and Mnkeni
and Mackenzie (1985) also reported that repeated applications of manure over a long
period of time have increased the labile Pi fraction. However, Greb and Olsen (1967)
reported that 38 years of manure application has increased Po levels in three
calcareous soils. In contrast, Campbell et al. (1986) reported that, when manure was
applied once in three years, no significant changes were observed in the Po fraction of
the soil during the 36 years of the study period, although labile Pi levels increased.
According to these research findings, manure P availability and its impacts on soil P
fractions in the soil profile are not consistent, nor are they well understood. Thus, to
manage manure P for profitable and economically sustainable crop production and to
minimize environmental impacts, there is a need to further investigate its chemical
behaviour in soils by assessing soil P forms and their vertical distributions in the soil.
Thus, the objective of this study was to determine the long-term effects of DMS and AN
fertilizer on soil P forms and their changes and distributions in the soil profile.
4.3 Materials and Methods
4.3.1 Site description:
The study was conducted at the Pacific Agri-Food Research Centre at Agassiz in south-
coastal British Columbia, Canada (49° 10’ North, 125° 15’ West). The 30 year average
annual precipitation and mean temperature (from 1 February to 31 October) in Agassiz
are 1024.6 mm and 12.7 °C, respectively. The soil at the experimental site was derived
from medium-textured (silty loam to sandy loam) stone-free Fraser River deposits with
Page 109
94
moderately good drainage. The soils (Eluviated Eutric Brunisols) were mapped as
Monroe series, which are equivalent to Typic Dyatroxerepts. Soil physical and chemical
properties are shown in Table 4.1. Soil pH was determined in a soil/water ratio of 1:1.
The hydrometer method was used for analyzing soil texture. Dry-combustion method
was used for analyzing organic matter (Leco CNS-1000 Analyzer, Leco Corp., St-
Joseph, MI). Phosphorus, K, Ca and Mg were extracted by Kelowna soil test extract
(Van Lierop 1988).
Table 4.1 Physical and chemical characteristics of the silty loam soil used in field plots
at Agassiz, British Columbia, Canada.
Parameter Unit (average)
Soil pH (soil: water 1:1 w/w) 5.0
Organic matter % 6
Sand (%) 28.9
Silt (%) 57.2
Clay (%) 13.9
Kelowna soil test extract:
P (mg kg-1) 66 (High)
K (mg kg-1) 82 (Medium)
Ca (mg kg-1) 723
Mg (mg kg-1) 31 (Low)
4.3.2 Treatments and soil sampling:
The experiment was initiated on a stand of tall fescue (Festuca arundinacea Schreb.
var. Festorina) established in 1993 and continued till 2002. The tall fescue stands were
restored through cultivation (conventional ploughing and disking) and reseeding in
Page 110
95
2003. The fertilizer treatments were interrupted in 2003 and were reinstated in 2004 in
the same plots.
There were six treatments, including unfertilized control, two DMS treatments applied at
target rates of 50 kg N ha-1 (47,000 l ha-1) (M-Low) and 100 kg N ha-1 (90,000 l ha-1) (M-
High) of total ammonia nitrogen (TAN) per application; two ammonium nitrate (AN)
fertilizer treatments at 49 kg N ha-1 (F-Low) and 95 kg N ha-1 (F-High) per application;
and a treatment with alternating manure and fertilizer (Alt) each at 100 kg mineral-N ha-1
yr-1. The application rate of P for manure was averaged 15 and 29 kg ha-1 per
application. For slurry treatments total-N application was approximately 2xTAN. The
details of the treatments and fertilizer applications are given in Table 4.2. These
treatments were completely randomized with four replicates. The treatments were
applied to the plots (3 x 65 m) each year in the early spring and after each harvest,
except the final harvest.
Dairy manure slurry was obtained from manure storages on local high-input dairy farms
in which wood shavings were used for bedding. The slurry averaged 92% water. The
chemical composition of the dairy slurry is given in Table 4.3 (Bittman et al. 2004).
Manure was applied with a 3-m wide sleigh-foot or drag-shoe slurry applicator mounted
behind a 4000-L tank (Bittman et al. 1999).The sleigh-foot was designed to float freely
over the soil surface with little downward force so that there was no soil penetration.
Other nutrients (P, K and S) were applied only to fertilizer plots in spring at rates
according to local recommendations as indicated by the soil tests. In total, applications
in 2004 on both fertilized plots (F-low and F-high) were 0, 135, 11 and 22 kg ha-1 of P,
K2O, S and Mg, respectively.
Page 111
96
Table 4.2 Fertilizer and dairy manure slurry application rates (Annual- 4 applications per
year)
Treatment
Manure Vol. (L/ha)
Manure TAM kg/ha
Fertilizer N kg/ha
Manure P kg/ha
Fertilizer P kg/ha
Fertilizer K2O
Fertilizer S kg/ha
Fertilizer Mg kg/ha
Control 0 0 0 0 0 0 0 0
F-Low 0 0 196 0 0 135 11 22
F-High 0 0 380 0 0 135 11 22
M-Low 180000 200 0 60 0 0 0 0
M-High 360000 400 0 116 0 0 0 0
Alt 180000 200 190 58 0 0 0 0
Table 4.3 Chemical and physical composition of the dairy manure slurry applied to a tall
fescue sward in a multi-year study in south coastal British Columbia
Parameter
Dairy manure slurry (average)
Dry matter %
8.0
Organic C %
4.1
Total N %
0.31
NH4-N %
0.16 Total P (g kg-1)
0.90
pH
6.7
In 2004, post-harvest soil sampling was done at four depths of 0-7.5 cm, 7.5-15 cm, 15-
30 cm and 30-60 cm from random locations on the plots. Thirty soil cores were taken
from each plot using a standard hand soil probe 2.5 cm in diameter and pooled to
produce composite samples from each depth. Samples were air-dried at room
temperature. After removal of visible crop residues, soils were crushed to pass through
Page 112
97
a 2-mm sieve. Sub samples of soil were further ground to pass through No.140 mesh
for sequential P fractionation.
4.3.3. Soil P fractionation
Soil samples were sequentially extracted by the modified Hedley’s P fractionation
procedure to quantity the different soil Pi and Po fractions (Hedley et al. 1982). Detailed
methodology is given in Chapter 3 (Figure.3.1). Phosphate was determined
colorimetrically with the molybdate-ascorbic acid procedure (Murphy and Riley, 1962)
using a QuikChem Automated Analyzer (Lachat Instruments, Milwaukee, WI).
To calculate the recovery of P in the sequential extraction, total soil P was determined
using a separate soil sample digested with H2SO4-H2O2 (Thomas et al. 1967), followed
by colorimetric measurement using a QuickChem Automated analyzer (Lachat
Instruments, Milwaukee, WI). The results indicated that the modified Hedley’s
sequential fractionation procedure recovered a range of 95.3-102.2 % of the total soil
phosphorus of this study.
4.3.4. Statistical Analysis
To evaluate the effects of AN and DMS treatments on P fractions, results were analyzed
using Proc GLM in SAS 9.3.1. The contents of soil P fractions were first subjected to
ANOVA to identify the respective contribution of the treatment, soil depth and the
interaction term between soil depth and treatment to the total variance. Subsequently,
the treatment and the depth means were subjected to multiple mean comparisons to
identify statistically significant mean differences (SAS 9.3.1).
Page 113
98
4.4 Results and Discussion
The significance levels of the ANOVA model for the main effects and the coefficient of
determination (R2) values of the model are given in Table 4.4. The depth effect was
found to be statistically significant (at p<0.05), in all P fractions, because generally, P
decreases in bioavailability with depth. However, the treatment effects of the ANOVA
model were found to be statistically significant (p< 0.05) only in some of the P fractions:
H2O- Pi, Bicarb- Pi, HCl-Pi, NaOH-2-Pi and residual- P. A significant treatment effect
was also found in Total-Pi fraction (Table 4.4). There was a significant interaction
(treatment * depth) observed only for H2O-Pi fraction. This may be due to the greater
decrease of P levels with depth in treatments where excess P was applied.
The distributions of different soil P fractions in the soil profile (0-60 cm depth) are
illustrated in Figures 4.1a to 4.1g. Along with the soil depths, all the P fractions, as
determined by the sequential fractionation, decreased from top to bottom layers for all
the treatments. In order to explain the distribution of P levels across soil depths,
average P values across different treatments were calculated at a given depth and are
given in Table 4.5. These results indicate that the average P levels found in the 0- 7.5
cm and 7.5 -15 cm soil depths were significantly greater than those found in the 15- 30
cm and 30- 60 cm soil depths, though the P levels in top two layers were not
significantly different from one another. The reason for this lack of difference of P levels
in top two layers was probably due to the in-field mixing of the soils, because the depth
of cultivation was greater than 7.5 cm. The P levels of all P fractions in the 15- 30 cm
soil depth were significantly greater than that in the 30-60 cm soil depth except HCl-Pi
and NaOH-2-Pi levels (Table 4.5). Relatively greater P level in the shallow (0-15 cm)
Page 114
99
soil layer might have mostly been attributable to the accumulation of P in the surface
soil when P was applied with organic manure, and also due to greater biological activity
in this layer than deeper layers.
The results shown in Figures 4.1a- 4.1g generally indicate that the application of DMS
affected almost all of the P fractions mostly in the surface soil (0-15 cm) and slightly in
the sub-surface (15 - 60 cm) soils. Since the treatment impacts were mostly limited to
the top soil layer (0- 15 cm), and also due to the very few significant (treatment * depth)
interaction effects, the treatment mean comparisons were performed only with the mean
P values of the surface soil layer (0-15 cm) and results are discussed as follows.
Page 115
100
Table 4.4: The significance levels of Analysis of Variance (ANOVA) for the main effects (treatments, depth
and the interaction and R2 values of the model (* significance at P ≤ 0.05 level)
H2O-Pi H2O-Po Bicarb-Pi Bicarb-Po NaOH-1- Pi NaOH-1-Po HCl-P NaOH-2-Pi NaOH-2-Po Res-P Total-Pi Total-Po Total-Pt
T reat * NS * NS NS NS * * NS * * NS NS
Depth * * * * * * * * * * * * *
Trt x Dep * NS NS NS NS NS NS NS NS NS NS NS NS
R2 0.78 0.44 0.93 0.88 0.93 0.84 0.67 0.55 0.9 0.9 0.93 0.91 0.94
Table 4.5: Statistical significance of Depth comparisons from ANOVA (P fractions (mg P kg-1 soil) averaged over
treatments)
Depth(cm) H2O-Pi H2O-Po Bicarb-Pi Bicarb-Po NaOH-1- Pi NaOH-1-Po HCl-P NaOH-2-Pi NaOH-2-Po Res-P Total-Pi Total-Po Total-Pt
0 - 7.5 12.8 a 7 . 1 a 200.3 a 133.2 a 576.2 a 399.5 a 173.2 a 27.6 a 135.6 a 97.5 a 990.0 a 675.4 a 1762.9 a
7.5 - 15 11.2 a 5 .4 a b 203.2 a 125.6 ab 577.0 a 397.6 a 177.2 a 27.5 a 143.1 a 98.0 a 996.2 a 671.6 a 1765.8 a
15 - 30 5 . 0 b 2 . 9 b 146.6 b 96.1 b 431.2 b 311.3 b 151.0 b 24.8 b 95.7 b 81.3 b 758.5 b 506.1 b 1345.9 b
30 - 60 0 . 8 c 0 . 9 c 33.7 c 28.6 c 180.2 c 111.4 c 143.7 b 23.6 b 23.4 c 56.2 c 382.0 c 164.2 c 602.4 c
Means in the same column followed by the same letter are not significantly different
Page 116
101
Table 4.6: Mean values of Hedley P fractions (mg P kg-1 soil) of top 0-15 cm soil depth for all treatments
Treat H2O-Pi H2O-Po Bicarb-Pi Bicarb-Po NaOH-1- Pi N a O H - 1 - P o HCl-P NaOH-2-Pi N a O H - 2 -P o Res-P Total-Pi Total-Po Total-Pt
F-low 7 . 5 c 5 . 2 a 193.8 b 123.7 a 545.3 a 385.7 a 160.6 c 27.8 a 129.4 a 90.5 b 934.8 b 644.1 a 1669.4 a
F-High 7 . 7 c 5 . 0 a 186.1 b 129.1 a 542.7 a 401.6 a 161.3 c 27.5 a 131.7 a 98.9 ab 925.1 b 667.5 a 1691.5 a
M-Low 16.3 ab 7 . 4 a 215.8 ab 130.5 a 624.6 a 410.0 a 193.2 a 29.3 a 155.1 a 102.2 a 1079.2 a 702.8 a 1884.2 a
M-High 21.9 a 10.8a 230.6 a 143.3 a 617.0 a 388.1 a 190.4 a 28.2 a 148.7 a 102.2 a 1088.0 a 690.9 a 1881.1 a
A l t 11.9 bc 4 . 8 a 200.6 ab 134.0 a 579.7 a 425.7 a 177.4 ab 25.2 b 139.8 a 94.9 b 994.6 ab 704.3 a 1793.8 a
Control 7 . 0 c 4 . 3 a 183.6 b 115.6 a 550.7 a 380.0 a 168.2 bc 27.4 a 131.4 a 97.9 ab 936.9 b 631.2 a 1666.0 a
Means in the same column followed by the same letter are not significantly different
Page 117
102
4.4.1 Labile Phosphorus fraction (H2O-P and Bicarb-P)
Labile P fraction refers to the water extractable P and Bicarb extractable P fractions and
corresponds to the P sorbed on the soil surface and to the easily mineralizable organic
P (Chauhan et al. 1981). In this study, the H2O-Pi fraction in surface soil (0-15 cm
depth) showed significant increases with either rate of DMS application compared to all
the other treatments (Table 4.5). It is obvious that average H2O-Pi fraction in 0-15 cm
soil depth was increased by 14.9 mg P kg-1 (21.9 – 7.0 mg P kg-1) in M-high treated
soils and by 9.3 mg P kg-1 (16.3 – 7.0 mg P kg-1) in M-low treated soils compared to the
H2O-Pi fractions of the control plots (7.0 mg P kg-1). In addition, these H2O-Pi levels
were two (in M-low treated soils) to three (in M-high treated soils) times greater than
H2O-Pi levels in AN fertilizer treated soils (Table 4.6). A similar observation was
reported by Simard et al. (2001) that the application of liquid hog manure to a
calcareous gleysolic soil in Quebec produced a very rapid increase in very labile P
(anion-exchange membrane extractable-P) fraction. In addition, H2O-Pi level in M-high
treated soil was significantly greater (by 10.0 mg P kg-1) than that of in Alt treatment.
However, either rate of AN fertilizer treatment or Alt treatment did not show significant
impact on H2O-Pi fraction compared to the control (Table 4.6).
The distribution pattern of H2O-Po fraction followed a similar distribution pattern as H2O-
Pi fraction, showing relatively high P levels in near-surface layers with either rate of
DMS application (Figure 4.1a-B). However, there were no significant impacts found from
either rate of DMS or AN or Alt treatments on H2O-Po fraction. In this study, H2O
extractable P fraction (Pi + Po) made a relatively small contribution (2%) to the total soil
P content.
Page 118
103
Compared to the H2O-Pi fraction, Bicarb extractable-Pi fractions showed considerably
greater levels for all these treatments. As expected, Bicarb extractable-Pi fraction was
significantly increased in M-high treated soils (230.6 mg P kg-1) compared to either rate
of AN fertilizer treatments (193.8 and 186.1 mg P kg-1 for F-low and F-high treatments
respectively) and the control (183.6 mg P kg-1) plots (Table 4.5 and Figure 4.2b-C).
However, Bicarb-Pi fraction in F-low (193.8 mg P kg-1) and F-high (186.1 mg P kg-1)
treated soils were similar to the control plots (183.6 mg P kg-1) indicating no significant
impact from either rate of AN fertilizer treatments on Bicarb-Pi fraction.
It has been shown that increased labile Pi levels are commonly associated with manure
applications (Abbott and Tucker 1973; Campbell et al. 1986). These results are in
agreement with those findings that significantly higher labile-Pi levels in soils receiving
DMS applications may reflect the fact that greater amounts of Pi were applied in these
treatments. Similarly, Zheng et al. (2001) reported that liquid dairy manure applied to
gleysolic silty clay soil produced three times as much labile Pi increase per unit of P
added in surplus to plant exports than did the mineral fertilizer. They also reported that
this increase was closely related to the changes in soil C. Similar findings were reported
by O’Halloran (1993), in a study with liquid dairy manure applied on a continuous corn
system under reduced tillage, where he found that dairy liquid manure application had
significantly increased the levels of labile Pi fraction. Similarly Dormaar and Chang
(1995) also reported, after long-term cattle feedlot manure application, the amounts of
labile Pi in the Ap horizon of a Lethbridge loam soil (Dark Brown Chernozemic)
increased compared to the control. They also reported that the long-term applications of
feedlot manure had a very large impact on the labile P fractions, and the proportion of
Page 119
104
the total soil P in Pi forms was greatly increased while labile Po was decreased.
However, these results were somewhat contradictory to a previous study done by Qian
and Schoenau (2000) where a single application of liquid hog manure had little impact
on the labile P fraction. The reason for these contradictory results is possibly due to the
differences in number of manure applications and also due to the total amount of P
added with the manure. Because, a single application of hog manure may not be
adequate to clearly identify where that P ends up, given the errors involved and the
amount of P in the soil. Also, the small impact by a single application may be due to the
applied manure P precipitating as calcium phosphate or converted to organic P in the
soil.
These positive effects of DMS may be related to the accumulation of soil P through
increased C addition and due to enhanced microbial and enzyme activities (Lalande et
al. 2000; Bissonnette et al. 2001), thereby, the rates of biologically-mediated turnover of
organic P could be increased (Sommers and Sutton, 1980; Mozaffari and Sims, 1994;
Tiessen et al. 1994). It can be assumed that the organic matter and organic acids that
are released from the DMS could effectively reduce P sorption/fixation to the soil. This is
possibly due to the competition between phosphate ions and the organic materials for
retention sites in the soil and such competition may lead to enhance the P availability
(Mnkeni and MacKenzie, 1985; Xie et al. 1991).
Similar to the H2O-Po fraction, there were no treatment effects found on Bicarb-Po
fraction from any of these treatments. Similar results were reported by Tran and
N’dayegamiye (1995), who found that long-term application of dairy cattle manure to the
same Le Bras silt loam soil (Humic Gleysol) maintained Po forms in 0-20 cm soil layer.
Page 120
105
Campbell et al. (1986) also reported no changes in labile Po fractions in a Black
Chernozem with manure applications. Overall, Bicarb-P fraction made a considerable
contribution (9 – 21 % from bottom to top soil layers respectively) to the total soil P.
4.4.2 Moderately labile Phosphorus fractions (NaOH-1-P)
The moderately labile-Pi fraction represents the soil Pi that is associated with
amorphous and crystalline Al and Fe phosphates. In this study, the observed levels of
moderately labile Pi fraction were about three times greater than Bicarb-Pi fraction for
all the treatments (Table 4.5). However, Figure 4.2c-E shows that NaOH-1-Pi fraction
followed a similar distribution pattern as Bicarb -Pi fraction (Figure 4.2b-C). As was
observed for Bicarb-Pi levels, relatively higher NaOH-1-Pi levels at both rates of DMS
applications were observed compared to the AN treatments and the control. However,
these NaOH-1-Pi levels were not significant (Table 4.5).
Moderately labile Po fraction is assumed to be derived primarily from humic compounds
arising either due to addition of manures or decomposition of roots. This organically
bound P fraction could be a source of labile, and thus plant available P (Cross and
Schlesinger, 1995). Similar to the NaOH-1-Pi fraction, NaOH-1-Po fraction also did not
have significant impact due to application of either rate of DMS or AN fertilizers.
However, NaOH-1-Po levels were relatively lower compared to the NaOH-1-Pi levels for
all treatments (Table 4.5). O’Halloran (1993) reported that the amount of moderately
labile-Pi fraction increased with manure applications; however, moderately labile Po
fractions were not affected.
Page 121
106
The distributions of labile and moderately labile P fractions (Figures 4.2b-C, 4.2b-D,
4.2c-E and 4.2c-F) in the soil profile have shown a very similar pattern. This is not
simply a result of the fact that more P in the surface layer means more P in each
fraction. This similar pattern indicates that these fractions were correlated with each
other. These relationships are in agreement with the previous studies that indicate,
available soil P fractions are constantly replenished through reactions of dissolution or
desorption of more stable inorganic P, and also through the mineralization of organic P
(Tiessen and Moir, 1993). Tiessen et al. (1984) reported that moderately labile P
fraction is sparingly available to plants by desorption. However, it acts as a labile P
fraction in absence of P inputs and may also act as the primary sink for external P
additions (Simard et al. 1995; Tiessen et al. 1984; Beck and Sanchez, 1994).
Although moderately labile Pi or Po fractions did not show any treatment impacts from
application of DMS or AN treatments, this P fraction was the largest and about three
times greater than the Bicarb-P fraction for all treatments. The results indicate that the
largest contribution (47- 58% from bottom to top layers respectively) to the total P was
from the moderately labile P fractions of this soil. However, these higher levels of
NaOH-1-P may not be due to the treatment effects, given that the soils in treated plots
had similar levels of NaOH-1-P in the control plots. Therefore, these higher levels of
NaOH-1-P are probably due to the soil itself containing higher levels of moderately
labile P.
Zheng et al. (2001) reported that NaOH-1-Pi fraction was the largest sink for excess Pi
in manure-treated soils. Similarly, Gagnon and Simard, (2003) reported that the largest
amount of P found in acidic soil following manure and compost additions was
Page 122
107
associated with the moderately labile P fraction. These findings indicate that long-term
manure applications mostly affect the moderately labile P fraction in soils. In addition,
this high proportion of NaOH-1-P in the soil profile may also be due to P retention
associated with amorphous Al and Fe in soil. Furthermore, the increases in labile and
moderately labile Pi fractions could be attributed to re-sorption of P added in excess of
crop removal. Hedley et al. (1982) stated that the Pi not utilized by plants could be re-
adsorbed to soil components either as weakly or strongly adsorbed fractions (Bicarb-Pi
and NaOH-Pi).
4.4.3 Moderately stable Inorganic Phosphorus fraction (HCl-Pi):
Moderately stable Pi fraction is associated with Ca and Mg primary minerals in the soil.
This fraction is mainly apatite-type minerals and occluded P, and assumed to be of low
availability to plants (McKenzie et al. 1992a). In this study, significantly higher HCl-Pi
levels were found in soils treated with M-high (190.4 mg P kg-1) and M-low (193.2 mg P
kg-1) treatments compared to the F-low (160.6 mg P kg-1), F-high (161.3 mg P kg-1) and
the control (168.2 mg P kg-1) plots (Table 4.3). This confirmed that moderately stable P
(HCl-Pi) fraction showed a significant improvement with DMS application compared to
the AN treated plots and the control. These results were in contrast to the results
reported by Campbell et al. (1986) that the amount of HCl-Pi was shown to be not
affected by applications of barnyard manure. Similarly, in a study conducted to evaluate
the impact of long-term swine manure application on soil and water resources in
Eastern Oklahoma, Sharpley et al. (1991) found that only small amounts of HCl-Pi
accumulated in the soil profile.
Page 123
108
Soils treated with Alt (177.4 mg P kg-1) have significantly high HCl-Pi fractions
compared to the soils that were treated with AN. This positive effect may be due to the
fact that when manure is applied alternatively with inorganic fertilizer, a considerable
amount of P could be added to the soil with manure application and may transfer to
moderately stable-P pool, resulting in greater concentrations of HCl-Pi. However, soils
treated with either rate of AN did not show such impact on HCl-Pi fraction, indicating
that HCl-Pi fraction was not sensitive to the AN applications alone. Similarly, Zhang et
al. (2004) observed that soil HCl-Pi remained constant after 5-10 years of inorganic
fertilizer application in a St-Rosalie heavy clay soil. However, McKenzie et al. (1992)
and Wagar et al. (1986) reported that HCl-Pi increased with the addition of inorganic
fertilizer. This disparity of results may be due to the differences in climatic conditions,
soil types and the nature of the P source applied.
In this study, the distribution of HCl-Pi fraction in the soil profile shows a somewhat
different pattern compared to all other P fractions (Figure 4.2d-G). In addition, HCl-Pi
contents were relatively low in all treatments compared to the Bicarb-Pi and NaOH-1-Pi
levels. The results also showed that regardless of the treatments, the percentage of
contribution to the Total-Pt from HCl-Pi fraction in the soil profile has increased from top
to bottom layers (17 - 40% from top to bottom layers, respectively). The reasons for a
greater contribution from deeper soil layers were probably due to either the presence of
more calcium associated phosphates or due to less weathered minerals.
Page 124
109
4.4.4 Stable Phosphorus fraction
After HCl-Pi extraction, the remaining P fraction is considered as the stable P fraction.
The stable P fraction is the least plant available P fraction, because it consists of more
chemically stable organic P forms and relatively insoluble inorganic P forms. The stable
P fraction was further divided into NaOH-2-extractable P (NaOH-2-Pi and -Po) fraction,
that is the P from internal surfaces of soil aggregates, and the final residual- P fraction,
that is recalcitrant P.
Results of this study indicated that both NaOH-2-Pi and NaOH-2-Po fractions were not
significantly influenced by either rate of DMS or AN treatments (Table 4.5). However,
NaOH-2-Pi levels in Alt treatments (25.2 mg P kg-1) showed significantly lower P levels
compared to all other treatments and the control. For the final residual P fraction, P
levels in M-low (102.2 mg P kg-1) and M-high (102.2 mg P kg-1) treated soils were
significantly higher compared to the Alt (94.9 mg P kg-1) and F-low (90.5 mg P kg-1)
treatments. However, residual P fraction was not sensitive to the either rate of AN
treatments or Alt treatment (Table 4.5). According to these results, Stable (NaOH-2-Pi
and Po and Res-P) P forms did not show any significant changes with DMS or AN
application. A similar observation was reported by McKenzie et al. (1992a, 1992b). The
contribution to the total soil P from residual P fraction was from 5-10% from top to
bottom layers, respectively.
Page 125
110
4.4.5 Total inorganic (Total-Pi), total organic (Total-Po) and total P (Total Pt)
In this study, the Total-Pi in 0-15 cm soil depth has significantly increased in M-high
(1088.0 mg P kg-1) and in M-low (1079.1 mg P kg-1) treated soils compared to those in
F-low (934.8 mg P kg-1), F-high (925.1 mg P kg-1) treatments and in the control (936.9
mg P kg-1) (Table 4.5). However, the Total-Pi in either rate of AN fertilizer treated soils
did not show any difference compared to the control plots, indicating that Total-Pi
fraction was not influenced by AN fertilization (Table 4.5). The Alt treatment did not
show a significant effect on Total-Pi fraction (994.6 mg P kg-1) either. Accordingly, only
DMS applications (both M-low and M-high) have influenced soil Total-Pi fraction; this is
because manure contained higher amounts of P in inorganic form. Overall, the Total-Pi
fraction contributes 54 – 66% of the Total-Pt in the soil profile and the contribution
increased with soil depth regardless of the treatment.
Overall, Total-Po fraction did not show any impact from application of either rate of DMS
or AN fertilizer treatments or Alt treatment. Compared to the Total-Pi fraction, a
comparatively small Total-Po fraction was observed for all the treatments. This is
because the accumulated contents of Pi in all three (H2O- Pi, Bicarb- Pi and NaOH- Pi)
P fractions were greater than the Po (H2O- Po, Bicarb- Po and NaOH- Po) fraction. The
same pattern was observed in all depths for all treatments and in the control. However,
for NaOH-2-extracted P fraction, Po fraction was 5- 6 times greater than Pi fraction for
all treatments. As a cumulative effect, Total- Pi fraction was greater than the Total-Po
fraction in the soil profile for all treatments and the control. In this study, Total-Po
fraction accounted for 24- 41% of the Total-Pt and the largest contribution was from the
Page 126
111
upper layers and smallest contribution was from deeper layers regardless of the
treatment.
In terms of absolute amounts of soil Total-Pt, soils treated with M-high (1881.1 mg P kg-
1) and M-low (1884.2 mg P kg-1) have the greatest Total-Pt levels; however, these P
levels were not significantly greater compared to the control (1666.0 mg P kg-1) and
both rates of AN treated soils. In addition, the Total-Pt in Alt (1793.8 mg P kg-1), F-low
(1669.4 mg P kg-1) and F-high (1691.5 mg P kg-1) treated soils also were not
significantly different from Total-Pt levels of the control plots (Table 4.5). Overall,
application of P with DMS at either rates (M-low and M-high) or P application with Alt
treatment were not enough to give significant effects on Total-Pt fraction of the soil.
However, in soils treated with AN fertilizer, there has been an increased demand for soil
P due to increased root mass and faster crop growth due to N fertilization, that may lead
to lower Total-Pi and then Total-Pt levels compared to all other treatments.
The application of DMS has increased Total-Pt levels mostly in surface soils (0-15 cm)
and slightly in sub-surface (15-60 cm) soils. This may result from the accumulation of P
mostly in the surface soil layer where P was applied through slurry manure, and also
due to low vertical movement of P in soils, which may also lead to accumulation of P
mostly in the surface horizon (Sharpley et al. 1993; Mozaffari and Sims, 1994; Zheng et
al. 2001). The literature indicates that, in most soils, the P content of surface horizons is
greater than that of the subsoil. This is due to the sorption of added P, greater biological
activity, cycling of P from roots to above-ground plant biomass and more organic
material in surface layers. Some studies have found that addition of P did not influence
the concentration of any P fraction below the plow layer (Saleque et al. 2004 and Han et
Page 127
112
al. 2005). However, in this study, the mean values of different P fractions in various soil
depths showed that although most of the Pi and Po were located in the 0-15 cm soil
depth, there were still certain amounts of P in the lower soil depths, especially in 15- 30
cm soil layer. This indicates, over time, P could be slowly leached into the deeper soil
horizons. Similarly, several studies have demonstrated appreciable downward
movement of P following the field application of manure, resulting in elevated P levels at
60-120 cm soil depth (Martin, 1970; Halstead and Mckercher, 1975).
4.5 Conclusions
Application of DMS has significantly different effects on soil Pi fractions compared to the
AN fertilizer and such impacts are greater in the surface soils than in deep layers. In this
study, P accumulation with either rate of DMS application was mainly in Total-Pi
fractions including labile P (H2O- Pi + Bicarb-Pi) fraction and moderately stable P (HCl-
Pi) fraction in top (0-15cm) soil layer. However, soil organic P fraction and resistant P
fraction were not influenced by either rate of DMS or AN application.
Application of AN fertilizer in either rate did not influence on soil P fractions. Thus, P
supplied with DMS can have both short-term (labile P) and long-term (moderately stable
P) impacts on soil P bio-availability and P loss. On a short-term scale, the contribution
from surface soil layers is around 22% of Total- Pt from soil labile P fraction (2 and 20 %
from H2O-Pt and Bicarb-Pt fractions from M-high treated soils, respectively)
representing a considerable potential for surface water pollution.
Page 128
113
Figure 4.1a Water extractable Pi (A) and Po (B) fractions in the soil profile of 0-60 cm soil depth.
Treatments: F-low = 50 N kg ha-1, F-high =100 N kg ha-1, M-low = 50 kg ha-1TAN, M-high = 100 kg ha-1 TAN,
and Alt = alternating manure and fertilizer each at 100 kg mineral-N ha-1 yr-1 and the control.
0
10
20
30
40
50
-5 0 5 10 15 20
Dep
th (
cm
)
Soil P (mg kg-1)
Water Extractable Po
F-Low
F-High
M-Low
M-High
Control
Alt
0
10
20
30
40
50
-5 0 5 10 15 20 25 30 35
Dep
th (
cm
) Soil P (mg kg-1)
Water Extractable Pi
F-Low
F-High
M-Low
M-High
Control
Alt
A B
Page 129
114
Figure 4.1b Bicarb-Pi (C) and Bicarb-Po (D) fractions in the soil profile of 0-60 cm depth
Treatments; F-low = 50 N kg ha-1, F-high =100 N kg ha-1, M-low = 50 kg ha-1TAN, M-high = 100 kg ha-1 TAN,
and Alt = alternating manure and fertilizer each at 100 kg mineral-N ha-1 yr-1 and the control
0
10
20
30
40
50
0 50 100 150 200 250
Dep
th (
cm
)
Soil P (mg kg-1)
Bicarb-Pi
F-Low
F-High
M-Low
M-High
Control
Alt
0
10
20
30
40
50
0 50 100 150 200
Dep
th (
cm
)
Soil P (mg kg-1)
Bicarb-Po
F-Low
F-High
M-Low
M-High
Control
Alt
C D
Page 130
115
Figure 4.1c Moderately labile-Pi (E) and moderately labile-Po (F) fractions in the soil profile of 0-60 cm
depth. Treatments; F-low = 50 N kg ha-1, F-high =100 N kg ha-1, M-low = 50 kg ha-1TAN, M-high = 100 kg
ha-1 TAN, and Alt = alternating manure and fertilizer each at 100 kg mineral-N ha-1 yr-1 and the control
0
10
20
30
40
50
100 200 300 400 500 600 700
Dep
th (
cm
)
Soil P (mg kg-1)
NaOH-1-Pi
F-Low
F-High
M-Low
M-High
Control
Alt
0
10
20
30
40
50
50 150 250 350 450
Dep
th (
cm
)
Soil P (mg kg-1)
NaOH-1-Po
F-Low
F-High
M-Low
M-High
Control
Alt
E F
Page 131
116
Figure 4.1d HCl-Pi (G) and residual- P (H) fractions in the soil profile of 0-60 cm depth
Treatments; F-low = 50 N kg ha-1, F-high =100 N kg ha-1, M-low = 50 kg ha-1TAN, M-high = 100 kg ha-1 TAN,
and Alt = alternating manure and fertilizer each at 100 kg mineral-N ha-1 yr-1 and the control
0
10
20
30
40
50
100 125 150 175 200 225
De
pth
(c
m)
Soil P (mg kg-1) HCl-Pi
F-Low
F-High
M-Low
M-High
Control
Alt
0
10
20
30
40
50
25 50 75 100 125
Dep
th (
cm
)
Soil P (mg kg-1)
Residual P
F-Low
F-High
M-Low
M-High
Control
Alt
G H
Page 132
117
Figure 4.1e NaOH-2-Pi (I) and NaOH-2-Po (J) fractions in the soil profile of 0-60 cm depth
Treatments; F-low = 50 N kg ha-1, F-high =100 N kg ha-1, M-low = 50 kg ha-1TAN, M-high = 100 kg ha-1 TAN,
and Alt = alternating manure and fertilizer each at 100 kg mineral-N ha-1 yr-1 and the control
0
10
20
30
40
50
15 20 25 30 35D
ep
th (
cm
)
Soil P(mg kg-1)
NaOH-2-Pi
F-Low
F-High
M-Low
M-High
Control
Alt
0
10
20
30
40
50
0 50 100 150 200
Dep
th (
cm
)
Soil P (mg kg-1)
NaOH-2-Po
F-Low
F-High
M-Low
M-High
Control
Alt
I J
Page 133
118
Figure 4.1f Total-Pi (K) and total-Po (L) fractions in the soil profile of 0-60 cm depth
Treatments; F-low = 50 N kg ha-1, F-high =100 N kg ha-1, M-low = 50 kg ha-1TAN, M-high = 100 kg ha-1 TAN,
and Alt = alternating manure and fertilizer each at 100 kg mineral-N ha-1 yr-1 and the control
0
10
20
30
40
50
250 500 750 1000 1250
Dep
th (
cm
)
Soil P (mg kg-1)
Total Inorganic P
F-Low
F-High
M-Low
M-High
Control
Alt
0
10
20
30
40
50
0 200 400 600 800 1000
Dep
th (
cm
)
Soil P (mg kg-1)
Total Organic P
F-Low
F-High
M-Low
M-High
Control
Alt
K L
Page 134
119
Figure 4.1g Total-Pt (M) in the soil profile of 0-60 cm depth.
Treatments; F-low = 50 N kg ha-1, F-high =100 N kg ha-1, M-low = 50 kg ha-1 TAN, M-high = 100 kg ha-1
TAN, and Alt = alternating manure and fertilizer each at 100 kg mineral-N ha-1 yr-1 and the control
0
10
20
30
40
50
500 1000 1500 2000 2500
Dep
th (
cm
)
Soil P (mg kg-1)
Total-Pt
F-Low
F-High
M-Low
M-High
Control
Alt
M
Page 135
120
Chapter 5: Development of a soil phosphorus test for predicting long-term
phosphorus losses from agricultural soils
5.1 Abstract
Phosphorus losses from terrestrial systems to the aquatic environment contribute to
eutrophication of freshwater bodies. To reduce eutrophication and maintain freshwater
ecosystems, it is important to prevent P entering into freshwater bodies through
leaching and runoff from agricultural soils which are often enriched with P as a result of
over-fertilization and manuring. Current environmental soil P tests provide useful
information on the potential for immediate losses of P from agricultural soils. However,
such tests may not be sufficient for predicting long-term P losses in runoff/leaching
water. The objective of this study was to develop a suitable soil P test for predicting
long-term P loss potential from agricultural soils. Soil samples were collected from field
plots located in four different agro-ecological areas across Canada, including Harrow,
ON; Swift Current and Indian Head, SK; and Agassiz, BC. Soil P was analyzed using; 1)
original or modified soil P tests that are used for agronomic prediction of soil P supply
(Mehlich-3-P and Olsen-P) or are under consideration for environmental soil P testing
(resin membrane strips (RMS)-P, and FeO-strips-P) for indication of immediate soil P
losses and, 2) new procedures proposed for this study, including various combinations
of NaOH with different shaking time periods, with and without EDTA. The soil P
extracted with each individual extractant was correlated to the cumulative amount of soil
P that was removed by sequential extraction by RMS that was considered as the
amount of “Total Releasable P (TRP)” of that soil.
The amount of P extracted by different extractants varied widely. The Mehlich-3
extracted a greater amount of P than did Olsen, while RMS extracted more than twice
Page 136
121
the amount of P than did FeO-strips. The mean extractable P values for Mehlich-3 were
similar to those of the RMS-P for soils from Harrow, Swift Current and Indian Head
sites, suggesting that Mehlich-3 test is as effective as RMS method for measuring the
TRP of these soils. All new tests extracted greater amounts of P than did existing
agronomic and environmental soil P tests. In addition, all the combinations of NaOH
with EDTA extracted 4-5 times greater amounts of P than did such combinations of
NaOH without EDTA.
The Olsen (r = 0.97), Mehlich-3 (r = 0.93) and FeO-strips (r = 0.97) methods were well
correlated with RMS-P. All NaOH with EDTA extractants were better correlated (r = 0.94
to 0.95) with RMS-P than all NaOH without EDTA extractants (r = 0.91 to 0.92). Overall,
highly significant linear (R2 = 0.89 to 0.91) and quadratic (R2 = 0.93 to 0.94)
relationships between RMS-P and NaOH with EDTA extractants suggests that these
extractants are as effective as sink-based RMS method for measuring TRP of that soil.
Among these newly proposed soil P extraction methods, the strongest linear (R2=0.91)
and quadratic (R2=0.94) relationships between RMS-P and 0.025M NaOH with EDTA
extractant indicates that this extractant might be the most suitable extractant for
predicting long-term P loss potential of agricultural soils.
5.2 Introduction
Phosphorus is often the most limiting nutrient of biological productivity both in terrestrial
and freshwater environments (Sharpley et al. 1994). Hence, P inputs to surface water
resources can increase biological productivity of these water bodies, leading to
accelerated eutrophication (Sharpley et al. 1999). Eutrophication has been identified as
Page 137
122
one of the main causes of impaired surface water quality (USEPA, 1996), which
restricts water use for fisheries, recreation, industry and potable supplies. Thus, control
of P inputs to waters is of prime importance in reducing the accelerated eutrophication
of freshwater bodies.
Point sources, such as wastewater treatment plants, industrial facilities, sewage, and
drainage pipes are the main sources of P pollution. However, loss of P from agricultural
soils is now considered to be a significant source of pollution (USEPA, 2000), because
many point sources are largely under control due to easier identification (Daniel et al.
1994). Hence research attention has been focused on developing remedial strategies to
mitigate non-point (diffuse) source impacts of agricultural P.
Although P management is an integral part of profitable agronomic systems, previous
studies have consistently shown that long-term continued inputs of fertilizer and manure
P in excess of crop requirements have led to a build-up of soil P levels, which are of
environmental concern rather than agronomic concern, particularly in areas with
intensive agriculture associated with concentrated livestock production. Research has
also shown that runoff (surface and subsurface) and erosion from high P-level soils may
be the major factors contributing to surface water eutrophication (Sharpley et al. 1994;
Sims et al. 2002). Thus, the one of the main issues facing the establishment of
economically and environmentally sound P management systems are the identification
of those agricultural soils that contain high levels of P and have the greatest potential to
lose P to surface water bodies. This concern has led to an increased interest in
environmental soil P tests that may better assess a soil’s propensity to contribute to
nonpoint source P pollution than pre-existing agronomic soil P tests.
Page 138
123
There is evidence that magnitude of soil P loss to water bodies is influenced by many
soil factors, management practices and environmental factors. These include; the soil
type (Miller 1979; Hooda et al. 1997), land use (Nearing et al. 1993), type, rate and
timing of fertilizer and manure application (Edwards and Daniel 1993; Hooda et al.
1999; Kleinman et al. 2001), amount, form and the distribution of soil P (Sharpley, 1995;
Hooda et al. 1999; Heckrath et al. 1995; Pote et al. 1996; Ige et al. 2005), soil physical
and chemical characteristics (Nearing et al. 1993), the amount and intensity of rainfall
(Edwards and Daniel, 1993), and the field slope and proximity to surface waters. For
example, surface water contamination has become of considerable concern due to high
soil P levels in many regions of Canada as a result of intensive crop and livestock
production, where there is also considerable runoff or soil erosion. Runoff, especially
associated with sloped land and rain events, transports an excessively large amount of
particulate P. Phosphorus loss through erosion is more severe in regions with intense
rainfall and where the soil on sloping land is not protected by a permanent cover of
vegetation. In flat fields, phosphate may be lost mainly by leaching from soils in which
the phosphate sorption capacity has been saturated by P fertilizer application. For
example, in the flat lands of Ontario, more than 50% of the total P losses might be lost
through subsurface drainage water (Culley et al. 1983). Moreover, on very flat prairie
landscapes in western Canada, movement of P into surface water occurs mostly as a
result of snowmelt rather than from rain water and the transported P is in the form of
dissolved reactive P rather than particulate P. Generally, snowmelt seems to carry more
highly reactive dissolved P which may be released from freezing and thawing of living
cells and tissues. Furthermore, there is evidence that P leaching can be a significant
Page 139
124
problem in poorly drained soils with high organic matter levels (Sharpley et al. 1994),
soils with a long history of manure application (Breeuwsma et al. 1995; Heckrath et al.
1995) and also in agro-ecosystems characterized by soils excessively rich in P with
small P sorption capacity (Gaynor and Findlay, 1995; Sims et al. 1998; Smith et al.
2001b). According, in any agro-climatic region, P losses are critically dependent on soil
factors, management practices and environmental factors that are highly variable both
in space and time. Among these factors, soil P level is the baseline risk indicator of
potential P loss to the aquatic environment through runoff and leaching.
There has been increasing interest in using agronomic soil P tests as indices of
potential soil P losses to water bodies (Mallarino et al. 2001). For example, Olsen-P,
Bray-1-P, Mehlich-3-P and Kelowna-P tests are often used in risk assessment for
estimating soil P loss potential in many regions of North America (Sims et al. 2000;
Sharpley et al. 1994). Because of the widespread use of these soil tests and the large
data base they provide on soil P, there is a considerable appeal to use such methods
for estimating the potential for P loss to surface waters. Another advantage of using
such soil P tests to assess risk of soil P loss is that, if one soil test can provide
information on both agronomic P recommendation and soil P loss potential, it would
practically save time, money and other resources required for assessments.
An issue with all these traditional soil P tests is that they are designed for soils with
particular characteristics (acidity and alkalinity) and they use dilute solutions of strong
acids, bases, and chelates to dissolve soil P depending on the soil properties. Thus,
their application over a range of soils with different properties result in the buffering of
acid or base extractants, leading to inefficiency with consequences of solubilizing non-
Page 140
125
labile P which are more tightly bound to Al, F, or Ca complexes (Myers et al. 2005).
When this occurs, such methods could over- estimate labile soil P and then test results
for P loss potential are inaccurate. Furthermore, these soil test methods do not take into
account the slow release of sorbed P (Steffens, 1994) and soil organic P mineralization
(Tiessen et al. 1994). Therefore, these methods may not necessarily measure actual
amount of available P for loss and may not correlate well with soil P loss potential.
Given these limitations, use of existing soil P tests to manage P for water quality
protection, especially in the long run, although practical may not be worthwhile.
To overcome the problem of location and soil type dependency of the readings of soil
test P, a distilled water extraction method has been used extensively. This method is
designed to extract easily desorbable soil P (Sissingh 1971) and assumes that
extraction with water replicates the reaction between soil and runoff water. However, the
small amounts of soil P extracted by distilled water for most soils and difficulties related
to chemical analysis of these small amounts limit the use of distilled water as an
effective extractant.
As an alternative to these chemical and water extraction methods, ion-sink-based tests
have been proposed for environmental soil P testing. These ion-sink-based methods
rely on P sorption-desorption reactions instead of extracting soil P with strong
chemicals. Thus, the estimates of available P based on these desorption-based tests
could be better correlated with potential of P loss, because the extraction mechanisms
do not involve an arbitrary chemical extraction. The major advantage of these ion-sink
tests is the capability of extracting P from a variety of soil types irrespective of the
properties of the soil (Sharpley et al. 1994). Furthermore, previous studies have shown
Page 141
126
that ion-sink tests could be more suitable to simulate long-term desorption by using a
near-infinite sink for P, i.e. once P ions are adsorbed to the sink, they are not desorbed
(Sibbesen, 1978) and thus measure the potential of a soil to continue to release P
during a runoff or leaching event (Qian et al. 1992; Saggar et al. 1992).
Some of the most promising ion sink methods are Fe-oxide (FeO) impregnated filter
paper strips and anion exchange resin membranes strips (RMS). Research has shown
that the FeO-impregnated filter paper strips method (Chardon et al. 1996) effectively
estimated available P in a wide range of soils and management systems (Menon et al.
1989, 1990; Sharpley, 1991) and accurately predicted the quantity of P susceptible to
runoff, better than most agronomic soil P tests (Pote et al. 1996). Sharpley (1993) also
observed that the P content of runoff that was extracted by FeO-strips was closely
correlated (R2 = 0.92 - 0.95) with growth of several algal species. Accordingly, the P
adsorbed to FeO-strips would be a good indicator of the biological availability of P to
algae in runoff waters. However, there are some limitations to the use of FeO-coated
papers. FeO-coated papers are not available in the market, and this has led to different
methods for their preparation and use (Myers et al. 2005). Another concern is
contamination of the FeO-coated papers with fine soil particles during shaking (Chardon
et al. 1996), which can lead to error in estimating desorbable P. This can be minimized
by the use of CaCl2 solution as the background electrolyte which tends to minimize soil
dispersion (Myers et al. 2005). However, this can lead to a reduction in the amount of P
extracted (Koopmans et al. 2001). All these disadvantages of the FeO-coated papers
make the resin membrane strips (RMS) method is a more appealing sink-based method
for assessing available P. Furthermore, these resin strips can be re-used several times
Page 142
127
without losing their extracting power (Schoenau and Huang, 1991) and therefore they
are particularly cost effective. Research has also shown that the P extracted by RMS is
strongly correlated with bioavailable P (Abrams and Jarrell, 1992), the fraction of soil P
most likely to induce eutrophication (Sharpley et al. 1994).
Accordingly, the RMS method overcomes the disadvantages of chemical extractions,
water extractions, as well as FeO-strip method. It also has the advantages of cost
effectiveness, and applicability in soils of different regions with diverse chemical and
physical properties and also irrespective of management history. Moreover, the
advantage of RMS over chemical extractions is that it simulates long-term desorption by
providing a near-infinite sink for P. Therefore it can be used for predicting long-term P
loss potential. However, this method is tedious, time-consuming and not simple enough
for use by practitioners with varied technical backgrounds. Furthermore, it is difficult to
carry out on a large scale. These limitations make the procedure unsuitable for routine
use for soil P testing for environmental purposes. In addition, the lack of a consistent,
uniform and widely accepted standard procedure for this method limits its use as an
environmental test.
Currently, there are no methods available to assess long-term risk of P loss potential
from agricultural soils. As such, the objective of this study was to develop a suitable soil
P test for prediction of long-term P loss potential from agricultural soils.
Page 143
128
5.3 Materials and Methods
5.3.1 Site and experiment descriptions
For this study, soil samples were collected from four existing field experimental plots
located in different geographical locations across Canada (Figure 5.1) representing soils
of major agro-ecosystems in Canada. The locations selected were at the Eugene
Whelan Research Farm in Harrow, Ontario; the Semiarid Prairie Agricultural Research
Centre in Swift Current, Saskatchewan; the Pacific Agri-Food Research Centre in
Agassiz, British Columbia and the Agriculture and Agri-food Canada Research Farm in
Indian Head, Saskatchewan. These experimental sites provided a unique opportunity to
implement the present study by covering the major soil types with different physical and
chemical properties and various management histories in the typical agro-ecological
systems of Canada. The experimental field plots at each site provided a range of soil P
levels within each soil-agro-ecosystem as a result of the various treatments that have
been applied historically. Treatments used in these experimental sites are given in
Table 5.1. Soil sampling was done at post-harvest stages. Randomly selected soil cores
were taken from the 0-7.5 cm soil depth in each plot using a standard hand soil probe
with 2.5 cm internal diameter and pooled to produce a composite soil sample for
laboratory analysis. Analytical methods used for analysis of basic soil properties are
explained in next section and results are given in Table 5.2.
Page 144
129
5.3.2 Analysis of basic soil properties
Soil samples were air-dried at room temperature and crushed to pass through a 2 mm
sieve prior to chemical analysis. Soil pH was measured using 1:1 soil to water ratio
(Thomas, 1996). Soil organic carbon was determined by dry-combustion method with a
Leco CNS-1000 Analyzer, Leco Corp., St.Joseph, MI). Particle size distribution was
determined using a hydrometer method (Kroetsch and Wang, 2008).
Page 145
130
Figure 5.1 Major soil types in the typical agro-ecological systems of Canada
Harrow, ON
(Gleysolic)
Swift Current, SK
(Brown chernozemic) Indian Head, SK
(Black chernozemic)
Agassiz, BC (Brunisolic)
Page 146
131
Table 5.1 Different treatments used in field experiments located in four different agro-ecological areas across Canada
Agassiz (4 reps) Indian Head (3 reps) Swift Current (3 reps) Harrow (3 reps)
Dairy manure slurry - high Continuous Pea Alfalfa Solid swine manure
(100 kg TAN ha-1) (0 kg N ha-1) (0 kg P2O5 ha-1) (100 kg P ha-1)
Dairy manure slurry - low Continuous Pea Alfalfa Liquid swine manure
(50 kg TAN ha-1) (20 kg N ha-1) (20 kg P2O5 ha-1) (100 kg P ha-1)
Inorganic fertilizer - high Continuous Pea Alfalfa Swine manure compost
(95 kg N ha-1) (40 kg N ha-1) (40 kg P2O5 ha-1) (0
kg P2O5 ha-1)
(100 kg P ha-1)
Inorganic fertilizer - low Wheat-Pea rotation Alf-RWR Triple Super Phosphate
(49 kg N ha-1) (0 kg N ha-1) (0 kg P2O5 ha-1) (100 kg P ha-1)
Alternate manure & fertilizer Wheat-Pea rotation Alf-RWR Control
(100 kg N ha-1) (20 kg N ha-1) (20 kg P2O5 ha-1) (0
kg P2O5 ha-1)
(zero P)
Control Wheat-Pea rotation Alf-RWR
(zero N) (40 kg N ha-1) (40 kg P2O5 ha-1)
Page 147
132
Table 5.2 Physical and chemical characteristics of the soils (0-7.5 cm depth) of field experiments located in four different agro-
ecological areas across Canada
parameter Harrow Agassiz Indian Head Swift Current
Soil classification Humic Gleysol Eutric Brunisol Black Chernozemic Brown Chernozemic
Mean annual air temperature (˚C) 8.7 12.7 2.5 3.7
Mean annual precipitation (mm) 827 1025 434 330
Location (latitude and longitude) 42°13’N, 82°44’W 49°10’N, 125°15’W 50°33’N,103°39’W 50°15’N, 107°43’W
Soil pH (soil: water 1:1 w/w) 6.1 5.0 7.5 6.6
Sand % 26.0 28.9 24.1 35.96
Silt % 34.0 57.2 20.4 46.96
Clay % 40.0 13.9 55.5 17.08
Organic C (g kg-1) 22.7 34.8 23.2 16.70
P (mg kg-1) 12.0 (Olsen) 66.0 (Kelowna) 6.66 (Olsen) 5.73 (Olsen)
Page 148
133
5.3.3 Soil test phosphorus
Soil testing procedures for P were developed to estimate the amount of plant-available
P in the soil for agronomic purposes and fertilizer recommendations (i.e. to determine
how much P amendments are required for optimum crop growth) and not the amount of
bioavailable P that might be transported in runoff waters. However, it is logical to
consider that these both types of P measurements would be reasonably well correlated,
because, the forms of soil P that are required for terrestrial plants are those that are
soluble, readily desorbable, or "labile" and available to plants in the growing season.
Thus, if a soil is very high in soil test P, it is also likely to contain a high amount of
soluble or readily desorbed P which might be easily moved in runoff water.
The correlation between soil P in different extracting solutions and plant growth is
affected by soil and weather conditions hence regions use different extracting solutions.
The typical soil P tests that are used to measure soil P levels and recommend fertilizer
requirements for the various types of soils in different agro-ecological regions of Canada
are given in Table 5.3.
In this study, two agronomic P tests (Olsen and Mehlich-3), two existing environmental
P tests (Anion Resin Membrane strips and Iron oxide impregnated strips) and two newly
proposed procedures (NaOH with and without EDTA) were used to measure soil
extractable P of the surface soils (0-7.5 cm) collected from four experimental sites.
Olsen extractant (Olsen et al.1954) and Mehlich-3 extractant (Mehlich 1984) were
selected for this comparison, because they are the most widely used soil P tests to
extract available P from soils in Canada. Olsen extractant, the current agronomic soil P
test in Ontario, has been widely used for extracting P from wide range of soils including
Page 149
134
calcareous, alkaline and neutral soils and even in acidic soils (Kamprath and Watson
1980). As a soil test, Olsen-P is sensitive to management practices that influence
bioavailable soil P levels, such as fertilizer applications (O’Halloran et al. 1985) or
manure additions (Qian et al. 2004). Furthermore, the Olsen-P test has been used as a
alternate measure of soil P loss potential through runoff (Pote et al. 1996; Turner et al.
2004) and in regions using the Olsen-P as the recommended soil P test it is often a
criterion in soil P indices for assessing risk of P loss and impact on surface water
(Sharpley et al. 1994). Mehlich-3 extractant is commonly used as a multi-element
extractant (using ICP analysis), which is suitable for removing P and other elements in
acid and neutral soils. Thus, Mehlich-3 method is widely used in most provinces in
Canada especially in western Canada for agronomic soil P testing. Further, the Mehlich-
3 soil test extraction solution in association with the use of the measurement of
aluminum to estimate degree of P saturation has been proposed as a method to
determine environmental risk in North America (Pellerin et al. 2006).
Resin membrane strips and iron oxide strips methods were selected for this study,
because both of these ion sink methods are capable of extracting available P from soils
with large variation of physical and chemical properties. Further, these strips act as an
“infinite sink” to measure desorbable soil P, and thus measured the potential of a soil to
continue to release P during a runoff or leaching event.
Two newly proposed extraction methods include different concentrations of NaOH, a
strong chemical extractant that measures stable forms of P that are involved in the long-
term transformations of P in soils (Batsula and Krivonosova, 1973). From the literature,
it was established that the NaOH extractant measures moderately labile P sorbed on
Page 150
135
amorphous Fe and Al minerals and also the occluded P contained within aggregates.
Furthermore, addition of EDTA which is a strong chelating ligand, complexes Fe and Mn
cations in the extract, and thereby increases the extraction efficiency of soil P and also
the diversity of extracted P compounds (Bowman and Moir, 1993).
Generally, the efficiency of the extraction could be influenced by the strength of the
extractant and the length of the extracting period. Accordingly, for the newly proposed
extraction methods, soils were extracted with sixteen different combinations (4*4) made
out of four different concentrations of NaOH solution (0.05M, 0.1M, 0.15M and 0.2M)
with four different shaking durations (0.5h, 1h, 1.5h and 2h). For 0.1M EDTA + NaOH
extractant, soils were extracted with twelve different combinations (3*4) made out of
three different NaOH concentrations (0.025M, 0.05M and 0.1M) with four different
shaking durations (1h, 2h, 5h, and 16h).
Page 151
136
Table 5.3: Typical soil phosphorus tests used in Canada
Analysis method Extractant Comments
Olsen 0.5M NaHCO3 at pH 8.5 - best suited for neutral, alkaline and calcareous soils - current agronomic soil P test used in Ontario - critical level of soil test P is 20 ppm by Olsen-P in Ontario - process of maintaining pH level, driving off CO2, and filtering extractant through activated charcoal makes the procedure awkward (Qian et al. 1994)
Mehlich-3 0.2M CH3COOH
0.25M NH4NO3
0.015M NH4F
0.013M HNO3
0.001M EDTA
- common method for assessing crop- available P (using colourimetric method) - critical level of soil test P is 60 ppm by Mehlich-3-P (ICP) - multi-element extractant (using ICP analysis), which is suitable for removing P and other elements in acid and neutral soils
Bray-1 0.03N NH4F
0.025N HCl at pH 3.5
-designed for neutral - acidic soils (pH ≤ 7.0)
-not suited for alkaline soils (pH > 7.0)
Modified Kelowna 0.015M NH4F
0.25M ammonium acetate
0.25M acetic acid
- best method for a wide range of soil -pH levels - considered accurate for Canadian prairie soils (Havlin et al. 1999). - measures available P and K - performs similar to the Olsen test at high soil pH levels,
(however it does not require charcoal filtration and does not
evolve CO2 (Qian et al. 1994).
Page 152
137
5.3.3.1 Agronomic Phosphorus tests
Olsen extractable P was obtained by shaking 1.0 g of soil (2 mm sieved) with 20 ml of
0.5M NaHCO3 solution (pH of 8.5) in the presence of 0.25 g of charcoal, for 30 minutes
at 180 rpm on a reciprocating shaker and filtering the suspension through Whatman
No.40 filter paper (Olsen and Sommers 1982). Mehlich-3 extractable P was determined
by shaking 2.5 g of air dried soil sample with 25 ml of Mehlich-3 extracting reagent
(0.2M CH3COOH, 0.25M NH4NO3, 0.015M NH4F, 0.013M HNO3, 0.001M EDTA) for 5
minutes at 120 rpm and filtering the suspension through Whatman No.40 filter paper
(Mehlich,1984). Phosphate was determined colourimetrically with the molybdate-
ascorbic acid procedure (Murphy and Riley, 1962) using a QuikChem Auto Analyzer
(Lachat instrument, Milwaukee, WI).
5.3.3.2 Environmental Phosphorus tests
5.3.3.2.1 Anion resin membrane strips: (RMS)
The procedure followed for the RMS test was described by Tiessen and Moir (1993).
Sheets of a commercially available resin impregnated plastic material were cut into 2 x
10 cm strips. The strips were washed in distilled water to remove all propylene glycol
and stored in distilled water. The resin strips were saturated with HCO3
- by soaking
them in 0.5M NaHCO3 twice, for 3 hours each time and allowed to dry at room
conditions. Phosphorus was extracted from the soil by shaking 1 strip with 1g of soil and
30 ml of 0.01M CaCl2 solution in 40 ml bottles for 1hour shaking in an end-over-end
reciprocating shaker. Resin strips were replaced at 1st, 4th, 9th, 16th, 25th and 36th days of
time period, for a total period of 91 days with six sets of resin strips (i.e. 1st resin strip-
Page 153
138
after 24 hour contact period, shaken 1hour and removed from the solution; 2nd strip was
then placed and removed after 96 hours (4 days) contact period etc. (Sharpley et
al.1994). The strips were carefully removed after slow up-and-down movement of the
strip in the supernatant to remove any adhering soil particles back into the bottles,
thereby minimizing extraction of P from adhered soil as well as membrane P and any
loss of soil particles for subsequent extraction. Phosphorus retained on the resin
membrane strips was extracted by shaking the strip end-over-end with 30 ml of 1.0 M
HCl for 1hour. The membrane strip was removed, rinsed with deionized water, and
shaken end-over-end with an additional 30 ml of 1.0 M HCl for 1hour. Phosphorus in the
two HCl extracts was measured separately and summed to give resin P (freely
exchangeable inorganic P) assuming “Total releasable P” (Tiessen and Moir, 1993).
Phosphate was determined colourimetrically with the molybdate-ascorbic acid
procedure (Murphy and Riley, 1962) using a QuickChem Auto Analyzer (Lachat
instrument, Milwaukee, WI).
5.3.3.2.2 Iron oxide impregnated filter paper strips: (FeO-strips)
The procedure followed for the FeO-strips test was described by Chardon et al. (1996).
Iron-oxide impregnated filter papers were prepared by immersing paper discs (15 cm
diameter, Whatman No.50) in acidified FeCl3 using tweezers for 5 minutes (acidified
FeCl3; 0.65M FeCl3.6H2O + 0.6M HCl). The paper discs were removed from the solution
and allowed to drip dry at room temperature for 1hour. After air drying the papers were
immersed in 2.7M NH4OH for 30 seconds to neutralize the FeCl3 and produce
amorphous Fe oxide. They were then allowed to drain for 15 seconds and thoroughly
rinsed in two containers of clean distilled water to remove adhering FeO particles. After
Page 154
139
air drying, the filter papers were cut into strips (2 x 10 cm with reactive surface area of
40 cm2) and stored for subsequent use.
Phosphorus was extracted from soil by weighing 1 g soil into a 100 ml polyethylene
shaking bottle. One FeO strip was placed between Spectra /Mesh polythene screens
(2 x 11 cm), held together by a plastic clip on one end, making a paper-screen
assembly to insert into the shaking bottle that contained the soil and 40 ml of 0.01M
CaCl2 (soil: solution 1:40). The bottle was sealed and shaken horizontally on an end-
over-end reciprocating shaker for 16 hours reaction time (130 oscillations per minute).
The FeO strips were removed from the screens and rinsed under a stream of deionized
water for a few seconds to remove adhering soil particles. The strips were coiled and
placed in the neck of a 125 ml Erlenmeyer flask to air dry, pushed to the bottom and P
retained on the strips extracted by adding 40 ml of 0.1M H2SO4 to the flasks and
shaking for 1 hour (Chardon et al.1996). Phosphate was determined colourimetrically
with the molybdate-ascorbic acid procedure (Murphy and Riley, 1962) using a
QuikChem Auto Analyzer (Lachat instrument, Milwaukee, WI).
5.3.3.3 Newly proposed extraction methods:
For 0.1M EDTA + NaOH extraction method, 0.5 g of finely ground soil (140 mesh
sieved) was extracted with 15 ml of 0.1M EDTA and 15 ml of NaOH solution (three
different concentrations of NaOH: 0.025M, 0.05M and 0.1M) by shaking for four different
shaking times (1h, 2h, 5h and 16h). For NaOH extraction method, 0.5 g soil was
extracted with 30 ml of NaOH solution (four different concentrations of NaOH: 0.05M,
0.1M, 0.15M and 0.2M were used) by shaking for four different shaking times (0.5h, 1h,
1.5h and 2h).
Page 155
140
After shaking, samples were immediately centrifuged for 10 minutes at 25,000 g at 0°C
and vacuum filtered using 0.45 µm micro-filter papers. For both extractions, a portion
(10 ml) of the filtrates was pipetted into a 30 ml centrifuge tube, acidified (3.5 ml of 0.9M
H2SO4) and centrifuged at 25,000 g for 10 minutes at 0°C to remove precipitated
organic P, Po (Tiessen and Moir, 1993). Inorganic P (Pi) was then measured
colourimetrically using QuikChem Auto Analyzer (Lachat Instruments, Milwaukee, WI),
using the ammonium molybdate and ascorbic acid colourimetric procedure (Murphy and
Riley 1962).
A separate aliquot (10 ml) of the filtrates was acidified by ammonium persulfate
oxidation (autoclaved at 103.4 KPa and 121°C for 1h) and total P was determined using
QuikChem Automated Analyzer (Lachat Instruments, Milwaukee, WI), using the
ammonium molybdate and ascorbic acid colourimetric procedure (Murphy and Riley
1962). The difference between total P and Pi was considered as Po.
5.3.4 Statistical Analysis
The amounts of P extracted by the various extractants were subjected to multiple mean
comparisons for mean differences using STATA. The suitability of soil P tests as
indicators of the potential for long-term P losses were evaluated by comparing soil P
extracted by different extractants with the cumulative amount of soil P that was
determined using the sequential extraction of the resin membrane strips, assuming
within the 91 days extraction period, all desorbable P was adsorbed by resin strips
(Sharpley et al. 1994). This cumulative amount of P was assumed to represent the
“Total Releasable P” from that soil. Correlation and linear regression analyses were run
using STATA to study the relationships between P extracted by existing (agronomic,
Page 156
141
environmental) and new soil test P methods and the total releasable P. Stepwise
regressions (using STATA) were run to assess the significances of coefficient of
determination (R2) values of quadratic model compared to the linear model.
5.4. Results and Discussion
5.4.1 Comparison of soil Phosphorus extractability of existing agronomic and
environmental soil Phosphorus tests
Considerable variation was observed in the soil P amounts extracted by both agronomic
and environmental soil P tests (Tables 5.4a,and 5.4b). Across all soils tested, the
amounts of P extracted by agronomic soil P tests ranged from 4.0 to 204.8 mg P kg-1
and from 8.1 to 242.0 mg P kg-1 for Olsen and Mehlich-3 tests, respectively. Based on
the mean extractable P values of all soils tested (n=57), in terms of absolute amounts,
Olsen extracted less amount of P (i.e. mean = 46.3 mg P kg-1), compared to Mehlich-3
(i.e. mean = 63.9 mg P kg-1) (Figure 5.2).
When soils from individual locations were considered, for soils from Harrow, Swift
Current and Indian Head sites, Mehlich-3 extracted significantly greater amounts of P
compared to the Olsen. However, for soils in Agassiz site, approximately the same
amount of P was extracted in both the Olsen (mean = 144.2 mg P kg-1) and the Mehlich-
3 test (126.9 mg P kg-1) (Figure 5.2 and Tables 5.4a and 5.4b). The different behaviour
of Agassiz soil compared to the soils in Harrow and Saskatchewan sites is probably due
to the low soil pH in Agassiz site. These findings agree with the results reported by Sims
(2000a), that Olsen extractant has less ability to remove P from soils compared with the
Mehlich-3 extractant. Kleinman et al. (2001) found that Mehlich-3 values were roughly
1.5 times greater than corresponding Olsen P values for 24 soils from across the United
Page 157
142
States. Buondonno et al. (1992) found that Mehlich-3- P values were almost twice as
much as those of the Olsen-P. These findings indicate that Mehlich-3 solution extracted
some forms of labile P that are not immediately available to Olsen extractant. Generally,
acid based extractions such as used in the Mehlich-3 solution could extract
proportionally more soil P compared with other agronomic P tests. This is probably due
to the fact that as pH of the extracting solution decreases, more of the phosphate
associated with Ca is dissolved. Thus, Mehlich-3 being a more acidic reagent, extracted
a greater amount of P, whereas Olsen, being more alkaline, extracted a lower amount
of P.
When viewed across all sites, the amounts of P extracted by two environmental soil P
methods ranged from 9.3 to 151.8 mg P kg-1 and from 25.9 to 405.8 mg P kg-1 for FeO-
strips and RMS method, respectively (Table 5.4a). The mean extractable P values of
the RMS (91.3 mg P kg-1) were over twice as much as that of the FeO strips (36.3 mg P
kg-1). The same pattern was observed for each individual soil from the four experimental
sites (Figure 5.2). The greater amount of extractable P obtained by RMS method is not
surprising, because this RMS-P value is the cumulative amount of P extracted twice
from six resin strips within the period of 91 days compared to the one time extraction by
FeO-strips.
When results from agronomic P extraction methods were compared with the cumulative
amount of P extracted by RMS, the mean extractable P values for Mehlich-3 were
almost equal to those of the RMS-P for soils from Harrow, Swift Current and Indian
Head experimental sites (Figure 5.2). This suggested that Mehlich-3 method was as
effective as RMS method for measuring the total releasable P in these soils. However,
Page 158
143
for soils in Agassiz site, the amount of P extracted by RMS method was significantly
greater than the P extracted by Mehlich-3 test (Table 5.4a). In addition, when all soils
across the sites were considered, RMS extracted significantly greater amount of P
compared to the Mehlich-3 test. The amount of P extracted by Olsen test was
approximately half of the amount extracted by the RMS for soils from all four
experimental sites as well as for all soils across all sites (Figure 5.2).
The differences among these extracted P amounts by different extraction methods
probably arose from the fact that, extracting agents preferentially extract P from different
fractions depending on their reactions with soil constituents involved in P sorption
(CAST, 2000). Furthermore, each extracting solution has a different ability to extract
varying portions of soil P because they were targeted at different pools of soil P (Zhang
et at. 2004).
When comparing soils from different locations, the extractable soil P values by all these
extracting methods varied significantly. According to the mean extractable soil P values,
the soils from Agassiz site had the greatest amounts of extractable P with each
agronomic and environmental soil P extraction method and the soils from Swift Current
site had the smallest amounts (Figure 5.2 and Tables 5.4a and 5.4b). This greater
concentration of extractable P in Agassiz soil is probably due to its greater organic
matter content, associated with a history of receiving long-term dairy manure
application. It has been reported in the literature that a fairly close relationship exists
between organic C and available soil P (Bunemann et al. 2006), because the
accumulation of organic C may increase the availability of P in soil due to the
competition between organic anions and PO4-P for the same sorption sites (Muukkonen
Page 159
144
et al. 2007). In Agassiz, due to increased livestock industry, excessive P applications
have occurred over the past two decades (Schreier et al. 2003) and 85% of all fields
were in the high (50-100 mg P kg-1 Kelowna Test-P) to very high (>100 mg P kg-1
Kelowna Test-P) environmental risk class for P in the 0-15 cm soil depth (Kowalenko et
al. 2007).
(Means with different letters are significantly different at P<0.05)
Figure 5.2 Means of soil P (mg P kg-1) extracted using existing agronomic (Olsen
and Mehlich-3) and environmental (resin membrane strips and iron oxide strips)
soil P tests for soils across four sites in Canada. (n= 57, 15, 12, 12 and 18 for all
soils across sites, Harrow, Agassiz, Swift current and Indian head, respectively).
c
b
c
c
b a a
a
b a
ab
a
b
a a
b b
b
c
b
0
50
100
150
200
250
300
So
il te
st P
mg P
kg -
1
RMS FeO Olsen Mehlich-3
Page 160
145
Table 5.4a Descriptive statistics for P (mg P kg-1
) extracted by different extractants for all four experimental sites. RMS = Resin Membrane Strips, Total P (TP) = (Pi + Po), ENa = EDTA + NaOH, Na = NaOH, (0.025M, 0.05M and 0.1M) = concentrations of NaOH
Soil P extraction All soils (n=57) Harrow (n=15) Agassiz (n=12)
method Range Mean SD Range Mean SD Range Mean SD
RMS-TP 25.9-405.8 91.3 92.5 25.9-109.3 63.6 26.6 131.2-405.8 245.7 93.7
FeO-strips-P 9.3-151.8 36.3 29.1 9.3-63.1 33.5 14.9 51.7-151.8 81.1 31.8
Olsen-P 4.0-204.8 46.3 54.3 4.0-59.8 27.9 15.6 95.5-204.8 144.2 34.2
Mehlich-3-P 8.1-242.0 63.9 43.9 8.1-116.5 57.3 30.2 83.6-242.0 126.9 48.3
ENa_0.025M_1h_TP 166.8-1916.9 561.8 506.2 249.3-516.3 380.4 65.0 1052.2-1916.9 1490.0 281.2
ENa_0.025M_2h_TP 169.9-2012.9 581.5 528.1 238.9-516.7 381.7 68.9 1146.2-2012.9 1552.6 284.6
ENa_0.025M_5h_TP 174.9-2047.6 602.5 524.4 255.3-547.8 402.2 69.4 1182.3-2047.6 1566.5 275.7
ENa_0.025M_16h_TP 190.9-2027.5 610.5 526.6 250.2-567.1 410.6 75.1 1192.1-2027.5 1578.4 277.2
ENa_0.05M_1h_TP 169.2-2084.9 604.2 559.9 270.8-545.8 401.8 68.9 1218.4-2084.9 1638.5 278.2
ENa_0.05M_2h_TP 183.7-2085.4 632.9 574.7 276.2-556.8 423.5 69.9 1328.9-2085.4 1698.4 260.1
ENa_0.05M_5h_TP 199.2-2136.9 650.7 574.5 280.8-511.4 431.9 59.9 1325.4-2136.9 1713.5 273.8
ENa_0.05M_16h_TP 206.3-2153.8 663.8 577.3 289.2-513.5 419.2 71.5 1354.6-2153.8 1729.4 279.1
ENa_0.1M_1h_TP 146.7-2062.7 584.5 573.6 219.1-430.9 356.9 60.1 1189.2-2062.7 1644.5 291.7
ENa_0.1M_2h_TP 151.9-2098.4 602.6 583.5 233.5-455.7 371.1 64.5 1339.7-2098.4 1688.1 255.0
ENa_0.1M_5h_TP 174.4-2178.3 635.0 600.8 250.2-458.5 390.9 64.9 1389.4-2178.3 1751.6 261.1
ENa_0.1M_16h_TP 172.1-2187.3 637.1 586.3 291.6-479.2 405.9 51.7 1378.1-2187.3 1723.3 272.5
Na_0.05M_1h_TP 17.5-1627.6 306.0 515.9 41.3-101.5 72.3 17.7 781.7-1627.6 1266.7 279.3
Na_0.05M_2h_TP 17.5-1779.7 318.6 533.7 45.8-112.4 81.8 21.0 894.2-1779.7 1313.5 282.1
Na_0.05M_3h_TP 17.6-1749.2 337.1 555.7 49.3-125.7 87.3 22.9 1029.9-1749.2 1382.9 238.8
Na_0.05M_4h_TP 23.2-1672.3 339.9 556.9 51.7-125.6 89.7 22.4 1008.2-1672.3 1388.4 236.6
Na_0.1M_1h_TP 1.3-1788.4 343.1 571.0 45.7-121.6 87.3 23.4 1028.6-1788.4 1412.1 275.9
Na_0.1M_2h_TP 2.5-1843.8 355.1 576.9 43.1-129.3 95.9 27.2 1026.4-1843.8 1437.6 262.1
Na_0.1M_3h_TP 17.9-1952.4 383.7 629.5 57.4-149.2 107.1 27.6 1018.7-1952.4 1558.6 320.6
Na_0.1M_4h_TP 2.3-1855.5 369.8 593.2 58.5-137.2 107.6 25.7 1094.5-1855.5 1484.4 260.6
Na_0.15M_1h_TP 70.7-1854.7 364.2 540.9 93.3-147.8 123.7 17.1 809.8-1854.7 1362.1 333.8
Na_0.15M_2h_TP 69.6-1902.6 382.4 567.1 95.7-158.8 127.9 18.9 941.1-1902.6 1439.9 298.2
Na_0.15M_3h_TP 70.9-1949.9 396.8 588.6 96.1-156.2 130.1 17.8 1038.5-1949.9 1498.4 290.3
Na_0.15M_4h_TP 69.8-1706.8 355.7 498.3 99.4-164.7 134.4 19.7 1003.4-1706.8 1437.7 226.4
Na_0.2M_1h_TP 60.6-1870.4 373.9 565.1 81.1-154.2 115.7 19.8 897.9-1870.4 1424.8 312.2
Na_0.2M_2h_TP 57.4-1984.3 390.8 588.5 80.5-157.7 121.8 23.9 1050.3-1984.3 1487.2 314.2
Na_0.2M_3h_TP 54.6-2012.9 408.9 615.6 87.5-169.6 131.5 24.9 1118.9-2012.9 1560.5 304.4
Na_0.2M_4h_TP 59.8-2032.6 395.9 591.9 91.4-163.6 132.9 22.4 1130.3-2032.6 1494.5 334.5
Page 161
146
Table 5.4b Descriptive statistics for P (mg P kg-1
) extracted by different extractants for all four experimental sites. RMS = Resin Membrane Strips, Total P (TP) = (Pi + Po), ENa = EDTA + NaOH, Na = NaOH, (0.025M, 0.05M and 0.1M) = concentrations of NaOH
Soil P extraction Swift Current (n=12) Indian Head (n=18)
method Range Mean SD Range Mean SD
RMS-TP 26.4-35.6 31.9 3.6 30.6-78.3 50.9 13.5
FeO-strips-P 12.9-20.7 17.1 2.2 13.2-37.4 21.6 6.6
Olsen-P 8.8-23.9 13.6 4.3 6.6-39.4 18.2 8.8
Mehlich-3-P 24.1-38.8 30.7 5.4 21.9-78.0 49.8 15.9
ENa_0.025M_1h_TP 166.8-203.8 185.3 11.1 250.9-457.4 345.3 50.8
ENa_0.025M_2h_TP 169.9-206.6 192.9 11.4 255.7-458.9 359.6 51.5
ENa_0.025M_5h_TP 174.9-220.4 205.1 12.9 290.8-493.1 391.6 52.7
ENa_0.025M_16h_TP 190.9-227.0 211.5 12.0 306.8-508.9 397.9 47.7
ENa_0.05M_1h_TP 169.2-200.2 186.6 9.0 274.6-474.2 361.7 46.6
ENa_0.05M_2h_TP 183.7-210.7 197.7 8.7 292.6-510.4 387.3 50.2
ENa_0.05M_5h_TP 199.2-232.8 213.6 9.9 316.8-527.6 415.9 53.8
ENa_0.05M_16h_TP 206.3-249.4 220.4 12.1 347.5-565.7 452.8 55.9
ENa_0.1M_1h_TP 146.7-173.9 162.0 9.9 264.7-437.3 349.1 45.9
ENa_0.1M_2h_TP 151.9-203.2 170.9 14.9 256.9-471.1 359.7 51.6
ENa_0.1M_5h_TP 174.4-207.3 188.9 10.9 265.3-576.9 391.5 72.9
ENa_0.1M_16h_TP 172.1-206.3 188.3 12.1 295.6-503.7 404.9 53.4
Na_0.05M_1h_TP 43.7-67.2 58.0 7.6 17.5-30.1 25.8 2.8
Na_0.05M_2h_TP 47.8-71.7 62.7 15.1 22.1-30.5 26.3 2.6
Na_0.05M_3h_TP 53.3-77.4 68.2 8.8 17.6-32.4 27.2 3.5
Na_0.05M_4h_TP 54.5-82.0 72.6 8.5 23.2-32.3 27.6 2.7
Na_0.1M_1h_TP 51.0-93.0 76.9 11.1 1.3-40.8 21.1 11.5
Na_0.1M_2h_TP 47.0-143.9 91.4 22.8 2.5-52.5 25.0 10.4
Na_0.1M_3h_TP 80.0-99.7 90.5 8.2 17.9-36.9 25.3 4.7
Na_0.1M_4h_TP 50.7-124.6 94.5 18.9 2.3-62.6 28.9 13.4
Na_0.15M_1h_TP 86.7-108.3 100.7 6.4 70.7-90.2 74.9 4.4
Na_0.15M_2h_TP 90.6-111.1 104.2 6.5 69.6-80.3 74.9 2.9
Na_0.15M_3h_TP 93.8-124.8 109.6 8.0 70.9-81.9 76.1 2.9
Na_0.15M_4h_TP 95.1-152.0 115.0 15.0 69.8-82.7 76.9 3.7
Na_0.2M_1h_TP 85.1-116.1 103.8 9.5 60.6-81.6 68.8 6.1
Na_0.2M_2h_TP 94.1-143.2 112.9 13.4 57.4-77.6 69.4 5.5
Na_0.2M_3h_TP 103.8-124.2 116.9 5.9 54.6-74.6 66.9 5.4
Na_0.2M_4h_TP 97.5-132.8 116.8 10.5 59.8-78.3 69.0 5.1
Page 162
147
5.4.2 Comparison of Phosphorus extracted by newly proposed methods
For all soils across all sites, all three concentrations of NaOH with EDTA solution
extracted greater amounts of P (mean values ranged from 561.8 mg P kg-1 to 663.8 mg
P kg-1) than did all NaOH without EDTA extractants (mean values ranged from 306.0
mg P kg-1 to 408.9 mg P kg-1) (Table 5.4 and Figures 5.3- a and b). This suggests that
NaOH with EDTA extracted P from different pools or with different mechanisms than
NaOH alone extraction. This is most likely due to EDTA chelating metal cations and
thereby decreasing the amount of P bound via cationic bridges (Bowman and Moir,
1993).
The amounts of P extracted by NaOH with EDTA extractants increased with increased
shaking time regardless of the NaOH concentration (Figure 5.3-a). As expected, the
lowest extracted P values were observed with low concentration of NaOH (i.e.0.025M
NaOH) with EDTA extractant for all four shaking periods. Although higher extractions
were expected with stronger NaOH concentration (0.1M NaOH with EDTA), in this
study, the highest extracted P values were observed with 0.05M NaOH with EDTA
extractant regardless of the shaking period (Figure 5.3-a). Accordingly, the greatest
amount of P was extracted by 0.05M NaOH with EDTA for 16 hours of shaking period.
For NaOH without EDTA, the extractable P values increased with increasing shaking
period up to 1.5 hours (Figure 5.3-b), and with 2 hours shaking, the amount of P
extracted by all four NaOH concentrations decreased. This may be due to the re-
adsorption of P with longer periods of shaking. As expected, the amounts of P extracted
by all four concentrations of NaOH increased with increasing concentration of the NaOH
Page 163
148
solution. Hence, the maximum amount of P was extracted by 0.2M NaOH with 1.5 hours
of shaking period (Figure 5.3-b).
For soils in Harrow, all three concentrations of NaOH with EDTA extracted significantly
greater amounts of P (mean values ranged from 356.9 mg P kg-1 to 431.9 mg P kg-1)
than did extractants without EDTA (mean values ranged from 72.3 mg P kg-1 to 134.4
mg P kg-1) (Table 5.4). Among all these NaOH with EDTA extractants, the maximum
extracted amounts were observed with the 0.05M NaOH with EDTA extractant while the
lowest was observed with 0.1M NaOH with EDTA extractant. The amounts of P
extracted by all three extractants increased with increased shaking time; however, for
0.05M NaOH with EDTA extractant, the extracted amounts tend to decrease after 5
hours of shaking period (Figure 5.4-a). Thus, the maximum extraction combination was
observed with 0.05M NaOH with EDTA for 5 hours of shaking period.
For NaOH without EDTA extractants, as expected, the extracted P amounts increased
with increased shaking period for all the NaOH concentration. Thus the maximum
amounts extracted by all four extractants were observed with 2 hours shaking period.
The highest amount of P extraction was observed with 0.15M NaOH extractant.
However, results indicate that both 0.2M NaOH and 0.15M NaOH extractants extracted
similar amounts of P for both 1.5 hours and 2 hours shaking periods (Figure 5.4-b).
For soils in Agassiz, the P extracted by NaOH with EDTA ranged from 1490.0 mg P kg-1
to 1751.6 mg P kg-1 and by NaOH without EDTA ranged from 1266.7 mg P kg-1 to
1560.5 mg P kg-1 (Table 5.4). The amounts of P extracted by NaOH with EDTA
increased with increased shaking period up to 5 hours for all three extractants, and then
Page 164
149
tend to decrease (Figure 5.5-a). Results indicate that the maximum extraction
combination was with 0.1M NaOH + EDTA solution for 5 hours shaking period.
However, both 0.05M NaOH + EDTA and 0.1M NaOH + EDTA extracted similar
amounts of soil P at all four shaking periods. For NaOH without EDTA extractants, the
maximum extraction combinations were observed with 0.1M NaOH and 0.2M NaOH for
1.5 hours shaking period (Figure 5.5-b).
For soils in Swift Current, all three concentrations of NaOH with EDTA extracted
significantly greater amounts of P (mean values ranged from 162.0 mg P kg-1 to 220.4
mg P kg-1) than did NaOH without EDTA extractants (mean values ranged from 58.0 mg
P kg-1 to 116.9 mg P kg-1) (Table 5.4). The extracted amounts increased with increasing
shaking period, giving the maximum extractions with 16 hours for all four extractants.
However, greater amounts of P extraction were observed with 0.05M NaOH with EDTA
extractant, indicating the maximum extraction with 0.05M NaOH with EDTA for 16 hours
shaking period (Figure 5.6-a). For NaOH without EDTA, 0.1M NaOH and 0.2M NaOH
with 2 hours shaking period gave the maximum extractions (Figure 5.6-b).
For Indian Head site, the extracted P by all three concentrations of NaOH with EDTA
were significantly greater (mean values ranged from 345.3 mg P kg-1 to 452.8 mg P kg-
1) than the NaOH without EDTA (mean values ranged from 21.1 mg P kg-1 to 76.9 mg P
kg-1) (Table 5.4). The amounts of soil P extracted by all three NaOH with EDTA
extractions increased with increasing shaking time. The maximum extraction
combination was with 0.05M NaOH with EDTA for 16 hours shaking period (Figure 5.7-
a). However, for NaOH without EDTA, extracted amounts did not show such increase
with increasing shaking time. Both strong NaOH solutions (i.e. 0.15M NaOH and 0.2M
Page 165
150
NaOH) extracted significantly greater amounts of soil P compared to low concentrations
of NaOH extractants (0.05M NaOH and 0.1M NaOH). The 0.15M NaOH solution
extracted the maximum P amounts regardless of the shaking period (Figure 5.7-b).
Among these new extraction methods, all NaOH with EDTA solutions extracted
significantly greater amounts of soil P compared to NaOH without EDTA extractants for
soils in Harrow, Swift Current and Indian Head Sites. The greatest amount of P
extraction was observed with 0.05M NaOH with EDTA extractant. For soils in Agassiz,
the results were slightly different compared to other three locations. Both strong NaOH
solutions (0.1M NaOH with EDTA and 0.05M NaOH with EDTA) gave similar extracted
amounts (Figure 5.5-a). This may be related to the higher organic matter content in this
grassland soil, because of the rapid breaking down of cationic bridges between organic
matter and PO4-P by EDTA with the presence of strong (0.1M NaOH) alkali solution.
This finding is supported by Bowman and Moir (1993) who concluded that NaOH-EDTA
extraction is more effective in soils high in organic matter where the chelation with metal
cations plays an important role in tying up organic P. Among NaOH without EDTA
extractants, the highest amounts of P were extracted by 0.15M NaOH solution for
Harrow and Indian Head soils and by 0.2M NaOH solution for Agassiz and Swift current
soils. As expected, greater P extractions occurred with1.5 to 2 hours shaking period for
all four sites.
Overall, both these reagents (NaOH with EDTA and NaOH without EDTA) extracted
significantly greater amounts of P than did agronomic (Olsen and Mehlich-3) and
environmental (RMS and FeO-strips) P tests (Table 5.4). These results agree with
findings reported by Mallarino, (1999) that NaOH extracted two to three times more P
Page 166
151
from soils that received liquid swine manure than did Mehlich-3 or resin method. This
can be explained by the fact that NaOH solution changes the physical structure of
organic molecules in a way that enhances their solubility, given that, at high pH, many
organic functional groups are ionized and the increased charge density leads to
increased solubility. Furthermore, it is reported that the inclusion of EDTA, a strong
chelating ligand, complexes paramagnetic cations, such as Fe and Mn in the extract
and thereby increases soil P extraction efficiency and the diversity of P compounds
extracted (Bowman and Moir, 1993).
Page 167
152
(a) (b)
Figure 5.3 Means of soil P extracted using various concentrations of NaOH with EDTA (a) and without EDTA (b) for
four different shaking periods (1h, 2h, 5h and 16h for NaOH with EDTA, and 0.5h, 1h, 1.5h and 2h for NaOH without
EDTA) for all soil samples collected from all four sites in Canada.
y = -2.9021x2 + 31.217x + 532.79 R² = 0.99, p<0.05
y = -3.9135x2 + 39.223x + 569.19 R² = 0.99, p<0.05
y = -4.0047x2 + 39.062x + 547.19 R² = 0.95, p<0.05
540
560
580
600
620
640
660
680
0 1 2 3 4 5
Extr
acte
d s
oil P
(m
g P
kg
-1)
Shaking period (h)
Poly. (EDTA+0.025M NaOH)
Poly. (EDTA+0.05M NaOH)
Poly. (EDTA+0.1M NaOH)
y = -2.4371x2 + 24.195x + 283.19 R² = 0.97, p<0.05
y = -6.4494x2 + 43.127x + 303.48 R² = 0.81, p<0.05
y = -14.817x2 + 73x + 303.39 R² = 0.87, p<0.05
y = -7.435x2 + 45.583x + 334.22 R² = 0.92, p<0.05
250
270
290
310
330
350
370
390
410
430
0 1 2 3 4 5
Extr
acte
d s
oil P
(m
g P
kg
-1)
Shaking period (h)
Poly. (0.05 M NaOH) Poly. (0.1 M NaOH)
Poly. (0.15 M NaOH) Poly. (0.2 M NaOH)
Page 168
153
(a) (b)
Figure 5.4 Means of soil P extracted using various concentrations of NaOH with EDTA (a) and without EDTA (b) for
four different shaking periods (1h, 2h, 5h and 16h for NaOH with EDTA, and 0.5h, 1h, 1.5h and 2h for NaOH without
EDTA) for soil samples collected from Harrow field experimental plots.
y = 1.7581x2 + 2.3188x + 374.72 R² = 0.93, p<0.05
y = -8.6163x2 + 49.175x + 360.79 R² = 0.99, p<0.05
y = 0.201x2 + 15.686x + 340.48 R² = 0.99, p<0.05
350
375
400
425
450
0 1 2 3 4 5
Extr
acte
d s
oil P
(m
g P
kg
-1)
Shaking period (h) Poly. (EDTA+0.025M NaOH)
Poly. (EDTA+0.05M NaOH)
Poly. (EDTA+0.1M NaOH)
y = -1.7882x2 + 14.712x + 59.407 R² = 0.99, p<0.05
y = -2.0414x2 + 17.41x + 71.268 R² = 0.97, p<0.05
y = 0.0478x2 + 3.1911x + 120.68 R² = 0.99, p<0.05
y = -1.1726x2 + 11.992x + 104.28 R² = 0.96, p<0.05
60
80
100
120
140
0 1 2 3 4 5E
xtr
acte
d s
oil P
(m
g P
kg
-1)
Shaking period (h)
Poly. (0.05 M NaOH) Poly. (0.1 M NaOH)
Poly. (0.15 M NaOH) Poly. (0.2 M NaOH)
Page 169
154
(a) (b)
Figure 5.5 Means of soil P extracted using various concentrations of NaOH with EDTA (a) and without EDTA (b) for
four different shaking periods (1h, 2h, 5h and 16h for NaOH with EDTA, and 0.5h, 1h, 1.5h and 2h for NaOH without
EDTA) for soil samples collected from Agassiz field experimental plots.
y = -12.683x2 + 91.322x + 1413.7 R² = 0.98, p<0.05
y = -11.009x2 + 83.807x + 1568 R² = 0.98, p<0.05
y = -17.967x2 + 119.81x + 1537.1 R² = 0.90, p<0.05
1450
1500
1550
1600
1650
1700
1750
1800
0 1 2 3 4 5
Extr
acte
d s
oil P
(m
g P
kg
-1)
Shaking period (h)
Poly. (EDTA+0.025M NaOH)
Poly. (EDTA+0.05M NaOH)
Poly. (EDTA+0.1M NaOH)
y = -10.33x2 + 95.129x + 1177.5 R² = 0.96, p<0.05
y = -24.936x2 + 158.48x + 1264 R² = 0.66, p<0.05
y = -34.626x2 + 201.64x + 1190.1 R² = 0.95, p<0.05
y = -32.102x2 + 188.75x + 1260.6 R² = 0.88, p<0.05
1250
1300
1350
1400
1450
1500
1550
1600
0 1 2 3 4 5
Extr
acte
d s
oil P
(m
g P
kg
-1)
Shaking period (h)
Poly. (0.05 M NaOH) Poly. (0.1 M NaOH)
Poly. (0.15 M NaOH) Poly. (0.2 M NaOH)
Page 170
155
(a) (b)
Figure 5.6 Means of soil P extracted using various concentrations of NaOH with EDTA (a) and without EDTA (b) for
four different shaking periods (1h, 2h, 5h and 16h for NaOH with EDTA, and 0.5h, 1h, 1.5h and 2h for NaOH without
EDTA) for soil samples collected from Swift Current field experimental plots.
y = -0.3189x2 + 10.684x + 174.37 R² = 0.9867
y = -1.0546x2 + 17.007x + 169.96 R² = 0.9861
y = -2.3604x2 + 21.498x + 141.48 R² = 0.9277
150
170
190
210
230
0 1 2 3 4 5
Extr
acte
d s
oil P
(m
g P
kg
-1)
Shaking period (h)
Poly. (EDTA+0.025M NaOH)
Poly. (EDTA+0.05M NaOH)
Poly. (EDTA+0.1M NaOH)
y = -0.0773x2 + 5.3035x + 52.693 R² = 0.9986
y = -2.6133x2 + 18.251x + 62.305 R² = 0.8885
y = 0.473x2 + 2.4754x + 97.632 R² = 0.9986
y = -2.3132x2 + 15.87x + 90.31 R² = 0.9994
40
60
80
100
120
0 1 2 3 4 5
Extr
acte
d s
oil P
(m
g P
kg
-1)
Shaking period (h)
Poly. (0.05 M NaOH) Poly. (0.1 M NaOH)
Poly. (0.15 M NaOH) Poly. (0.2 M NaOH)
Page 171
156
(a) (b)
Figure 5.7 Means of soil P extracted using various concentrations of NaOH with EDTA (a) and without EDTA (b) for
four different shaking periods (1h, 2h, 5h and 16h for NaOH with EDTA, and 0.5h, 1h, 1.5h and 2h for NaOH without
EDTA) for soil samples collected from Indian Head field experimental plots.
y = 18.98x + 326.14 R² = 0.94, p<0.05
y = 30.166x + 329 R² = 0.99, p<0.05
y = 19.931x + 326.47 R² = 0.96, p<0.05
300
350
400
450
500
0 1 2 3 4 5
Extr
acte
d s
oil P
(m
g P
kg
-1)
Shaking period (h)
Linear (EDTA+0.025M NaOH)
Linear (EDTA+0.05M NaOH)
Linear (EDTA+0.1M NaOH)
y = 0.5079x + 25.562 R² = 0.90, p<0.05
y = 2.3516x + 19.186 R² = 0.92, p<0.05
y = 0.7563x + 73.826 R² = 0.90, p<0.05
y = -0.1752x + 68.944 R² = 0.04, p<0.05
0
20
40
60
80
0 1 2 3 4 5E
xtr
acte
d s
oil P
(m
g P
kg
-1)
Shaking period (h)
Linear (0.05 M NaOH) Linear (0.1 M NaOH)
Linear (0.15 M NaOH) Linear (0.2 M NaOH)
Page 172
157
5.4.3 Correlations between amounts of P extracted by existing (agronomic and
environmental) soil P extraction methods and the cumulative amounts of P
extracted by resin membrane strips; “Total Releasable P”
For all soils sampled, the amount of P extracted by the FeO-strips method was
significantly correlated (r = 0.97, p < 0.05) with the amounts of P extracted by the RMS
method (Table 5.5). The high correlation between these two environmental tests was
expected, because they both have sink-based extracting mechanisms. Although not
expected because of the markedly different extraction mechanisms, good correlations
(p < 0.05) were also found between the amounts of P extracted by agronomic extraction
methods and RMS-P, with correlation coefficients of 0.97 and 0.93 for Olsen and the
Mehlich-3 methods, respectively (Table 5.5). These high correlations indicate that, even
though each of these extracting agents extracted a different proportion of available P,
they all are capable of estimating TRP of that soil. Similarly a significant correlation
between P desorbed by anion exchange membranes and 0.5M NaHCO3 extractable P
(Olsen method) was reported by Qian et al. (1992). Nuernberg et al. (1998) found a
significant correlation between P desorbed by anion exchange membranes and P
extracted by two acidic extractants (Mehlich-1-P and Bray-1-P).
When individual sites were considered, for soils from Harrow, the amounts of P
extracted by Olsen method showed the most significant correlation (r = 0.94) while the
Mehlich-3 method showed the smallest (but still significant) correlation (r = 0.89) with
RMS-P (Table 5.5). For soils from Agassiz, the P identified by all three methods showed
strong significant correlations with RMS-P, having correlation coefficients of 0.95, 0.95
and 0.93 (p < 0.05) for Olsen-P, FeO-strips-P and Mehlich-3-P respectively. Stronger
correlation is likely due to the greater P content of the soil from this site compared to all
Page 173
158
the other sites, as indicated by the amount of P extracted using existing soil P testing
methods. For soils from Swift Current and Indian Head plots, none of these existing
methods showed significant correlation with RMS-P.
5.4.4 Correlations between P extracted by newly proposed methods and the
cumulative amounts of P extracted by resin membrane strips; Total Releasable P
For all soils across sites, the amounts of P extracted by all new methods were
significantly correlated (p < 0.05) with RMS-P. The correlation coefficients ranged from
0.94 to 0.95 for NaOH with EDTA extractants and from 0.91- 0.93 for NaOH without
EDTA extractants (Table 5.5). These results indicate that all the combinations of NaOH
with EDTA extractants showed stronger correlations with total releasable P, than did all
combinations of NaOH without EDTA extractants.
When soils from individual sites were considered, significant correlations between
amounts of P extracted by NaOH with EDTA and the RMS-P were observed for soils
from Indian Head and Agassiz (Table 5.5). For Agassiz soils, all three concentrations
(0.025M, 0.05M and 0.1M) of NaOH with EDTA for 5 hours and 16 hours shaking period
showed significant correlations with RMS-P. For soils from Indian Head plots significant
correlations between P extracted by all three concentrations of NaOH with EDTA
extractants and RMS-P were observed with all four shaking periods except a few
combinations. However, none of these NaOH with EDTA extractants shows significant
correlations with RMS-P for the soils from Harrow and Swift Current plots. Further, there
were no significant correlations between RMS-P and the P extracted by different
combinations of NaOH without EDTA extractants for soils from all four locations. The
Page 174
159
reason may be the small sample size when they were considered individually within the
sites and also due to the range of values observed at any one site.
Overall, these results indicate that P extracted by different concentrations of NaOH with
EDTA was well correlated with total releasable P for all soils across the sites, as well as
for soils from Agassiz and Indian Head sites (Table 5.5). However, P extracted by
different concentrations of NaOH without EDTA extractants were well correlated with
total releasable P, only when soils across all sites were considered. This likely reflects
the bigger sample size when the entire set of soils was considered or a greater range of
soil P levels, and thus more variability.
Page 175
160
Table 5.5 Pearson correlation coefficients (r) between amounts of P extracted by P
extraction methods and Total Releasable P (RMS-P) for the whole soil collection (n=57),
and for individual locations (The correlations with * are significant at p < 0.05)
P extraction method Whole soil collection Harrow Agassiz
Swift current
Indian Head
n=57 n=15 n=12 n=12 n=18
FeO-strips-P 0.97* 0.92* 0.95* 0.83 0.43
Olsen-P 0.97* 0.94* 0.95* 0.70 0.41
Mehlich-3-P 0.93* 0.89* 0.93* 0.89 0.29
ENaOH_0.025M_1h_TP 0.95* 0.54 0.85 0.78 0.84*
ENaOH_0.025M_2h_TP 0.95* 0.65 0.87 0.71 0.84*
ENaOH_0.025M_5h_TP 0.95* 0.59 0.89* 0.74 0.80*
ENaOH_0.025M_16h_TP 0.95* 0.63 0.89* 0.58 0.81*
ENaOH_0.05M_1h_TP 0.95* 0.64 0.85 0.52 0.86*
ENaOH_0.05M_2h_TP 0.94* 0.64 0.87 0.70 0.84*
ENaOH_0.05M_5h_TP 0.95* 0.72 0.90* 0.71 0.86*
ENaOH_0.05M_16h_TP 0.95* 0.68 0.92* 0.61 0.76
ENaOH_0.1M_1h_TP 0.95* 0.72 0.85 0.57 0.84*
ENaOH_0.1M_2h_TP 0.94* 0.77 0.88 0.72 0.81*
ENaOH_0.1M_5h_TP 0.95* 0.76 0.92* 0.76 0.74
ENaOH_0.1M_16h_TP 0.95* 0.59 0.90* 0.68 0.80*
NaOH_0.05M_0.5h_TP 0.91* 0.70 0.58 0.55 0.62
NaOH_0.05M_1h_TP 0.92* 0.73 0.66 0.47 0.79
NaOH_0.05M_1.5h_TP 0.92* 0.69 0.69 0.45 0.58
NaOH_0.05M_2h_TP 0.91* 0.74 0.68 0.48 0.70
NaOH_0.1M_0.5h_TP 0.91* 0.78 0.63 0.46 0.41
NaOH_0.1M_1h_TP 0.92* 0.60 0.72 0.46 0.43
NaOH_0.1M_1.5h_TP 0.92* 0.66 0.66 0.29 0.45
NaOH_0.1M_2h_TP 0.92* 0.82 0.79 0.44 0.58
NaOH_0.15M_0.5h_TP 0.92* 0.75 0.68 0.60 0.50
NaOH_0.15M_1h_TP 0.92* 0.70 0.70 0.62 0.73
NaOH_0.15M_1.5h_TP 0.92* 0.75 0.70 0.61 0.73
NaOH_0.15M_2h_TP 0.92* 0.72 0.78 0.60 0.79
NaOH_0.2M_0.5h_TP 0.92* 0.74 0.65 0.61 0.61
NaOH_0.2M_1h_TP 0.92* 0.72 0.72 0.35 0.63
NaOH_0.2M_1.5h_TP 0.92* 0.78 0.72 0.37 0.78
NaOH_0.2M_2h_TP 0.92* 0.84 0.69 0.62 0.85*
Page 176
161
5.4.5 Relationships between soil test Phosphorus methods
The linear relationships between the amounts of P extracted by existing soil P extraction
methods and the RMS-P for entire soils across sites were significant at p< 0.05 (Figures
5.8-a, b and c). These strong linear relationships between these STP methods and
RMS-P suggest that they may extract P from the same soil P fractions and hence
should have a similar relationship with the amounts of total releasable P. Further,
significant linear relationships between these soil test methods indicates that the results
from one soil test P method can be converted to the other method by using their
regression equations.
As expected, a highly significant linear relationship was observed between RMS-P and
FeO- strips methods with the coefficient of determination (R2) of 0.93 (Figure 5.8-a),
because both these methods have a similar sink-based extracting mechanism. A highly
significant linear relationship was found between RMS-P and Olsen-P with R2 value of
0.94 (Figure 5.8-b); however, compared with the Olsen method, a smaller R2 value
(R2=0.86) was observed for the linear relationship between RMS-P and the Mehlich-3
(Figure 5.8-c). The R2 for RMS-P with Olsen P was significantly improved by applying a
quadratic model giving R2 value of 0.97 (Figure 5.8-b1); however, the relationships
between RMS-P and FeO-strips-P or between RMS-P and Mehlich-3-P did not improve
by applying a quadratic model (Figures 5.8-a1 and 5.8-c1).
For the newly proposed extraction methods, significant linear relationships were
observed between RMS method and the different concentrations of NaOH with EDTA
extractants with R2 values ranging from 0.89 to 0.91 [(Figures 5.9 (a to d), 5.10 (a to d),
and 5.11 (a to d)]. When the quadratic regression model was applied, the R2 in the
Page 177
162
relationships between all the combinations of NaOH with EDTA and RMS-P were
significantly improved giving the R2 values ranging from 0.93-0.94 [(Figures 5.9 (a1 to
d1), 5.10 (a1 to d1), and 5.11 (a1 to d1)].
The R2 for the linear relationships between RMS and the different concentrations of
NaOH without EDTA extractants [(Figures 5.12 (a to d), 5.13 (a to d), 5.14 (a to d) and
5.15 (a to d)] were smaller (ranging from 0.83 to 0.86) than those obtained for the linear
relationships between RMS and the different concentrations of NaOH with EDTA
extractants. Among these extractants, both 0.15M NaOH and 0.2M NaOH extractants
showed greater R2 values with RMS method compared to the 0.05M NaOH and 0.1M
NaOH concentrations. When a quadratic regression model was applied for the
relationships between NaOH without EDTA extractants and RMS-P, the R2 values were
improved (ranging from 0.87 to 0.89) than for linear regressions. However, significant
improvements were observed only for some of these relationships (Figures 5.12-c and
d, 5.13-b and d, 5.14-d, 5.15-c).
Overall, the Olsen method had the greatest R2 for both linear (R2 = 0.94) and quadratic
(R2 = 0.97) regressions among existing soil P tests. For new methods, the comparisons
of linear regressions reveal that the most significant linear relationships (R2 = 0.91) with
RMS-P was with the 0.025M NaOH with EDTA extractant for 2, 5 and 16 hours shaking
periods. Instead of 5 and 16 hours, 2 hours can be considered as the most effective and
practical shaking period. For quadratic regressions, no such difference was found for R2
values among NaOH with EDTA extractants. Accordingly, 0.025M NaOH with EDTA
extraction with 2 hours shaking period can be considered as effective as a sink-based
Page 178
163
RMS method for determining the total releasable P in that soil and it can be used for
predicting long-term soil P loss potential.
5.5. Conclusion
Amounts of P extracted by different tests varied widely. This is because different
extractants have varying ability to extract different portions of soil P as a result of their
different reactions with soil components controlling soil P availability. Mehlich-3
extracted a greater amount of P than Olsen and RMS extracted more than twice as
much P as did FeO-strips. The new methods extracted greater amounts of P than did
existing agronomic and environmental P tests. All combinations of NaOH with EDTA
extracted greater amounts of P compared to all combinations of NaOH without EDTA
indicating the inclusion of EDTA appeared to enhance the amounts of P extracted in
comparison with the NaOH alone. Among these existing and new methods 0.05M
NaOH with EDTA extractant gave the greatest extraction for all soils across the sites as
well as for soils within individual sites. However, Mehlich-3 extractant showed similar
levels of P extraction as RMS method did for Harrow, Swift current and Indian Head
soils, suggesting Mehlich-3- method was as effective as RMS method for measuring the
total releasable P in the soil.
The strong correlation between two environmental tests was found due to their common
sink-based extracting mechanisms. Amounts of P extracted by two agronomic tests
were highly correlated with RMS, indicating even though each of these reagents
extracted a different proportion of P, they both are capable of estimating the total
releasable P in the soil. The P extracted by all combinations of NaOH with EDTA and
without EDTA extractants were significantly correlated (at p ≤ 0.05) with RMS-P when
Page 179
164
soils across all sites were considered. In addition, all the combinations of NaOH with
EDTA had better correlation with RMS-P than did NaOH alone for all soils across all
sites. However, less satisfactory relationships were found for soils from individual sites.
Very significant linear relationships (p ≤ 0.05) were observed between the RMS method
and all the new methods. However, 0.025M NaOH with EDTA extractant had the
strongest linear relationship (R2 = 0.91) with RMS-P. The coefficient of determinations
(R2) were significantly improved by adopting a quadratic model for all NaOH with EDTA
extractants and some of the NaOH alone extractants. Results confirm that 0.025M
NaOH with EDTA for 2 hours shaking period was as effective as a sink-based RMS
method for measuring total releasable P in the soil. This extraction combination might
be the most suitable test for predicting long-term P loss potential of agricultural soils.
Page 180
165
y = 0.3041x + 8.5304 R² = 0.93
0
10
20
30
40
0 20 40 60 80 100
FeO
-str
ips-
P (
mg
P k
g-1)
RMS-P (mg P kg-1)
(a) FeO-strips_P
y = 5E-05x2 + 0.2857x + 9.3738 R² = 0.93
0
10
20
30
40
0 20 40 60 80 100
FeO
-str
ips-
P (
mg
P k
g-1)
RMS-P (mg P kg-1)
(a') FeO-strips_P
y = 0.569x - 5.616 R² = 0.94
0
20
40
60
0 20 40 60 80 100
Ols
en-P
(m
g P
kg-1
)
RMS-P (mg P kg-1)
(b) Olsen_P
y = -0.0009x2 + 0.8893x - 20.305 R² = 0.97
0
20
40
60
0 20 40 60 80 100
Ols
en-P
(m
g P
kg-1
)
RMS-P (mg P kg-1)
(b') Olsen_P
Page 181
166
Figure 5.8 Linear (left) and Non-linear (right) relationships between soil P extracted by three existing soil P tests (FeO-,
strips-a, Olsen-b and Mehlich-3-c) and cumulative amount of P extracted by resin membrane strip method (Total
Releasable P).
y = 0.4407x + 23.755 R² = 0.86
0
20
40
60
80
0 20 40 60 80 100
Meh
lich
-3-P
(m
g P
kg-1
)
RMS-P (mg P kg-1)
(c) Mehlich-3_P
y = -5E-05x2 + 0.4596x + 22.887 R² = 0.86
0
20
40
60
80
0 20 40 60 80 100
Meh
lich
-3-P
(m
g P
kg-1
)
RMS-P (mg P kg-1)
(c') Mehlich-3_P
Page 182
167
y = 5.1959x + 87.605 R² = 0.90
0
500
1000
1500
2000
2500
0 100 200 300 400 500
ENaO
H-0
.02
5M
-1h
-TP
(m
g P
kg-1
)
RMS-P (mg P kg-1)
(a) ENaOH_0.025M_1h_TP
y = -0.0097x2 + 8.7623x - 75.948 R² = 0.94
0
500
1000
1500
2000
2500
0 100 200 300 400 500
ENaO
H-0
.02
5M
-1h
-TP
(m
g P
kg-1
)
RMS-P (mg P kg-1)
(a') ENaOH_0.025M_1h_TP
y = 5.4326x + 85.645 R² = 0.91
0
500
1000
1500
2000
2500
0 100 200 300 400 500
ENaO
H-0
.02
5M
-2h
-TP
(m
g P
kg-1
)
RMS-P (mg P kg-1)
(b) ENaOH_0.025M_2h_TP
y = -0.01x2 + 9.1164x - 83.29 R² = 0.94
0
500
1000
1500
2000
2500
0 100 200 300 400 500
ENaO
H-0
.02
5M
-2h
-TP
(m
g P
kg-1
)
RMS-P (mg P kg-1)
(b') ENaOH_0.025M_2h_TP
Page 183
168
Figure 5.9 Linear (left) and non-linear (right) relationships between soil P (mg P kg-1) extracted by 0.025M NaOH + EDTA,
and cumulative amount of P extracted by resin membrane strip method (Total Releasable P)
y = 5.3953x + 110.05 R² = 0.91
0
500
1000
1500
2000
2500
0 100 200 300 400 500
ENaO
H-0
.02
5M
-5h
-TP
(m
g P
kg-1
)
RMS-P (mg P kg-1)
(c) ENaOH_0.025M_5h_TP y = -0.0098x2 + 8.9977x - 55.15
R² = 0.94
0
500
1000
1500
2000
2500
0 100 200 300 400 500
ENaO
H-0
.02
5M
-5h
-TP
(m
g P
kg-1
)
RMS-P (mg P kg-1)
(c') ENaOH_0.025M_5h_TP
y = 5.4212x + 115.72 R² = 0.91
0
500
1000
1500
2000
2500
0 100 200 300 400 500
ENaO
H-0
.02
5M
-16
h-T
P (
mg
P k
g-1)
RMS-P (mg P kg-1)
(d) ENaOH_0.025M_16h_TP
y = -0.0101x2 + 9.1426x - 54.934 R² = 0.94
0
500
1000
1500
2000
2500
0 100 200 300 400 500
ENaO
H-0
.02
5M
-16
h-T
P (
mg
P k
g-1)
RMS-P (mg P kg-1)
(d') ENaOH_0.025M_16h_TP
Page 184
169
y = 5.7296x + 81.26 R² = 0.90
0
500
1000
1500
2000
2500
3000
0 100 200 300 400 500
ENaO
H-0
.05
M-1
h-T
P (
mg
P k
g-1)
RMS-P (mg P kg-1)
(a) ENaOH_0.05M_1h_TP y = -0.0117x2 + 10.058x - 117.25
R² = 0.94
0
500
1000
1500
2000
2500
0 100 200 300 400 500
ENaO
H-0
.05
M-1
h-T
P (
mg
P k
g-1)
RMS-P (mg P kg-1)
(a') ENaOH_0.05M_1h_TP
y = 5.8635x + 97.747 R² = 0.89
0
500
1000
1500
2000
2500
3000
0 100 200 300 400 500
ENaO
H-0
.05
M-2
h-T
P (
mg
P k
g-1)
RMS-P (mg P kg-1)
(b) ENaOH_0.05M_2h_TP
y = -0.0125x2 + 10.465x - 113.28 R² = 0.94
0
500
1000
1500
2000
2500
0 100 200 300 400 500
ENaO
H-0
.05
M-2
h-T
P (
mg
P k
g-1)
RMS-P (mg P kg-1)
(b') ENaOH_0.05M_2h_TP
Page 185
170
Figure 5.10 Linear (left) and non-linear (right) relationships between soil P (mg P kg-1) extracted by 0.05M NaOH + EDTA,
and cumulative amount of P extracted by resin membrane strip method (Total Releasable P)
y = 5.8927x + 112.9 R² = 0.90
0
500
1000
1500
2000
2500
3000
0 100 200 300 400 500
ENaO
H-0
.05
M-5
h-T
P (
mg
P k
g-1)
RMS-P (mg P kg-1)
(c) ENaOH_0.05M_5h_TP
y = -0.0118x2 + 10.237x - 86.327 R² = 0.94
0
500
1000
1500
2000
2500
0 100 200 300 400 500
ENaO
H-0
.05
M-5
h-T
P (
mg
P k
g-1)
RMS-P (mg P kg-1)
(c') ENaOH_0.05M_5h_TP
y = 5.9268x + 122.84 R² = 0.90
0
500
1000
1500
2000
2500
3000
0 100 200 300 400 500
ENaO
H-0
.05
M-1
6h
-TP
(m
g P
kg-1
)
RMS-P (mg P kg-1)
(d) ENaOH_0.05M_16h_TP
y = -0.0111x2 + 10.018x - 64.777 R² = 0.94
0
500
1000
1500
2000
2500
0 100 200 300 400 500
ENaO
H-0
.05
M-1
6h
-TP
(m
g P
kg-1
)
RMS-P (mg P kg-1)
(d') ENaOH_0.05M_16h_TP
Page 186
171
y = 5.8677x + 48.935 R² = 0.90
0
500
1000
1500
2000
2500
3000
0 100 200 300 400 500
ENaO
H-0
.1M
-1h
-TP
(m
g P
kg-1
)
RMS-P (mg P kg-1)
(a) ENaOH_0.1M_1h_TP
y = -0.012x2 + 10.295x - 154.1 R² = 0.94
0
500
1000
1500
2000
2500
0 200 400 600
ENaO
H-0
.1M
-1h
-TP
(m
g P
kg-1
)
RMS-P (mg P kg-1)
(a') ENaOH_0.1M_1h_TP
y = 5.954x + 59.214 R² = 0.89
0
500
1000
1500
2000
2500
3000
0 100 200 300 400 500
ENaO
H-0
.1M
-2h
-TP
(m
g P
kg-1
)
RMS-P (mg P kg-1)
(b) ENaOH_0.1M_2h_TP
y = -0.0125x2 + 10.565x - 152.23 R² = 0.93
0
500
1000
1500
2000
2500
0 100 200 300 400 500
ENaO
H-0
.1M
-2h
-TP
(m
g P
kg-1
)
RMS-P (mg P kg-1)
(b') ENaOH_0.1M_2h_TP
Page 187
172
Figure 5.11 Linear (left) and non-linear (right) relationships between soil P (mg P kg-1) extracted by 0.1M NaOH + EDTA,
and cumulative amount of P extracted by resin membrane strip method (Total Releasable P)
y = 6.1442x + 74.242 R² = 0.89
0
500
1000
1500
2000
2500
3000
0 100 200 300 400 500
ENaO
H-0
.1M
-5h
-TP
(m
g P
kg-1
)
RMS-P (mg P kg-1)
(c) ENaOH_0.1M_5h_TP
y = -0.0127x2 + 10.818x - 140.08 R² = 0.94
0
500
1000
1500
2000
2500
0 100 200 300 400 500
ENaO
H-0
.1M
-5h
-TP
(m
g P
kg-1
)
RMS-P (mg P kg-1)
(c') ENaOH_0.1M_5h_TP
y = 5.9941x + 90.069 R² = 0.89
0
500
1000
1500
2000
2500
3000
0 100 200 300 400 500
ENaO
H-0
.1M
-16
h-T
P (
mg
P k
g-1)
RMS-P (mg P kg-1)
(d) ENaOH_0.1M_16h_TP
y = -0.0113x2 + 10.177x - 101.75 R² = 0.93
0
500
1000
1500
2000
2500
0 100 200 300 400 500
ENaO
H-0
.1M
-16
h-T
P (
mg
P k
g-1)
RMS-P (mg P kg-1)
(d') ENaOH_0.1M_16h_TP
Page 188
173
y = 5.0736x - 157.03 R² = 0.83
-500
0
500
1000
1500
2000
0 100 200 300 400 500
NaO
H-0
.05
M-0
.5h
-TP
(m
g P
kg-1
)
RMS-P (mg P kg-1)
(a) NaOH_0.05M_0.5h_TP
y = -0.0111x2 + 9.1475x - 343.86 R² = 0.87
-500
0
500
1000
1500
2000
0 100 200 300 400 500
NaO
H-0
.05
M-0
.5h
-TP
(m
g P
kg-1
)
RMS-P (mg P kg-1)
(a') NaOH_0.05M_0.5h_TP
y = 5.2963x - 164.79 R² = 0.84
-500
0
500
1000
1500
2000
2500
0 100 200 300 400 500
NaO
H-0
.05
M-1
h-T
P (
mg
P k
g-1)
RMS-P (mg P kg-1)
(b) NaOH_0.05M_1h_TP
y = -0.0104x2 + 9.1373x - 340.93 R² = 0.88
-500
0
500
1000
1500
2000
0 100 200 300 400 500
NaO
H-0
.05
M-1
h-T
P (
mg
P k
g-1)
RMS-P (mg P kg-1)
(b') NaOH_0.05M_1h_TP
Page 189
174
Figure 5.12 Linear (left) and non-linear (right) relationships between soil P (mg P kg-1) extracted by 0.05M NaOH and
cumulative amount of P extracted by resin membrane strip method (Total Releasable P)
y = 5.5024x - 165.12 R² = 0.84
-500
0
500
1000
1500
2000
2500
0 100 200 300 400 500
NaO
H-0
.05
M-1
.5h
-TP
(m
g P
kg-1
)
RMS-P (mg P kg-1)
(c) NaOH_0.05M_1.5h_TP
y = -0.0115x2 + 9.7439x - 359.63 R² = 0.88
-500
0
500
1000
1500
2000
0 100 200 300 400 500
NaO
H-0
.05
M-1
.5h
-TP
(m
g P
kg-1
)
RMS-P (mg P kg-1)
(c') NaOH_0.05M_1.5h_TP
y = 5.5025x - 162.3 R² = 0.84
-500
0
500
1000
1500
2000
2500
0 100 200 300 400 500
NaO
H-0
.05
M-2
h-T
P (
mg
P k
g-1)
RMS-P (mg P kg-1)
(d) NaOH_0.05M_2h_TP
y = -0.0122x2 + 10.001x - 368.6 R² = 0.88
-500
0
500
1000
1500
2000
0 100 200 300 400 500
NaO
H-0
.05
M-2
h-T
P (
mg
P k
g-1)
RMS-P (mg P kg-1)
(d') NaOH_0.05M_2h_TP
Page 190
175
y = 5.6322x - 170.92 R² = 0.83
-500
0
500
1000
1500
2000
2500
0 100 200 300 400 500
NaO
H-0
.1M
-0.5
h-T
P (
mg
P k
g-1)
RMS-P (mg P kg-1)
(a) NaOH_0.1M_0.5h_TP
y = -0.0121x2 + 10.103x - 375.95 R² = 0.88
-500
0
500
1000
1500
2000
0 100 200 300 400 500
NaO
H-0
.1M
-0.5
h-T
P (
mg
P k
g-1)
RMS-P (mg P kg-1)
(a') NaOH_0.1M_0.5h_TP
y = 5.728x - 167.73 R² = 0.84
-500
0
500
1000
1500
2000
2500
0 100 200 300 400 500
NaO
H-0
.1M
-1h
-TP
(m
g P
kg-1
)
RMS-P (mg P kg-1)
(b) NaOH_0.1M_1h_TP
y = -0.0111x2 + 9.8349x - 356.07 R² = 0.88
-500
0
500
1000
1500
2000
0 100 200 300 400 500
NaO
H-0
.1M
-1h
-TP
(m
g P
kg-1
)
RMS-P (mg P kg-1)
(b') NaOH_0.1M_1h_TP
Page 191
176
Figure 5.13 Linear (left) and non-linear (right) relationships between soil P (mg P kg-1) extracted by 0.1M NaOH and
cumulative amount of P extracted by resin membrane strip method (Total Releasable P)
y = 6.2305x - 184.95 R² = 0.84
-500
0
500
1000
1500
2000
2500
0 100 200 300 400 500
NaO
H-0
.1M
-1.5
h-T
P (
mg
P k
g-1)
RMS-P (mg P kg-1)
(c) NaOH_0.1M_1.5h_TP
y = -0.0134x2 + 11.174x - 411.65 R² = 0.88
-500
0
500
1000
1500
2000
2500
0 100 200 300 400 500
NaO
H-0
.1M
-1.5
h-T
P (
mg
P k
g-1)
RMS-P (mg P kg-1)
(c') NaOH_0.1M_1.5h_TP
y = 5.9267x - 171.08 R² = 0.85
-500
0
500
1000
1500
2000
2500
0 100 200 300 400 500
NaO
H-0
.1M
-2h
-TP
(m
g P
kg-1
)
RMS-P (mg P kg-1)
(d) NaOH_0.1M_2h_TP
y = -0.0111x2 + 10.011x - 358.37 R² = 0.89
-500
0
500
1000
1500
2000
0 100 200 300 400 500
NaO
H-0
.1M
-2h
-TP
(m
g P
kg-1
)
RMS-P (mg P kg-1)
(d') NaOH_0.1M_2h_TP
Page 192
177
y = 5.3995x - 128.65 R² = 0.85
0
500
1000
1500
2000
2500
0 100 200 300 400 500
NaO
H-0
.15
M-0
.5h
-TP
(m
g P
kg-1
)
RMS-P (mg P kg-1)
(a) NaOH_0.15M_0.5h_TP
y = -0.0095x2 + 8.9069x - 289.49 R² = 0.88
-500
0
500
1000
1500
2000
0 100 200 300 400 500
NaO
H-0
.15
M-0
.5h
-TP
(m
g P
kg-1
)
RMS-P (mg P kg-1)
(a') NaOH_0.15M_0.5h_TP
y = 5.6497x - 133.25 R² = 0.85
0
500
1000
1500
2000
2500
0 100 200 300 400 500
NaO
H-0
.15
M-1
h-T
P (
mg
P k
g-1)
RMS-P (mg P kg-1)
(b) NaOH_0.15M_1h_TP
y = -0.0109x2 + 9.6492x - 316.67 R² = 0.88
-500
0
500
1000
1500
2000
2500
0 100 200 300 400 500
NaO
H-0
.15
M-1
h-T
P (
mg
P k
g-1)
RMS-P (mg P kg-1)
(b') NaOH_0.15M_1h_TP
Page 193
178
Figure 5.14 Linear (left) and non-linear (right) relationships between soil P (mg P kg-1) extracted by 0.15M NaOH and
umulative amount of P extracted by resin membrane strip method (Total Releasable P)
y = 5.8528x - 137.39 R² = 0.85
0
500
1000
1500
2000
2500
0 100 200 300 400 500
NaO
H-0
.15
M-1
.5h
-TP
(m
g P
kg-1
)
RMS-P (mg P kg-1)
(c) NaOH_0.15M_1.5h_TP
y = -0.0114x2 + 10.068x - 330.71 R² = 0.88
-500
0
500
1000
1500
2000
2500
0 100 200 300 400 500NaO
H-0
.15
M-1
.5h
-TP
(m
g P
kg-1
)
RMS-P (mg P kg-1)
(c') NaOH_0.15M_1.5h_TP
y = 4.9826x - 99.017 R² = 0.86
0
500
1000
1500
2000
2500
0 100 200 300 400 500
NaO
H-0
.15
M-2
h-T
P (
mg
P k
g-1)
RMS-P (mg P kg-1)
(d) NaOH_0.15M_2h_TP
y = -0.0075x2 + 7.7442x - 225.66 R² = 0.88
-500
0
500
1000
1500
2000
0 100 200 300 400 500
NaO
H-0
.15
M-2
h-T
P (
mg
P k
g-1)
RMS-P (mg P kg-1)
(d') NaOH_0.15M_2h_TP
Page 194
179
y = 5.6017x - 137.28 R² = 0.84
0
500
1000
1500
2000
2500
0 100 200 300 400 500
NaO
H-0
.2M
-0.5
h-T
P (
mg
P k
g-1)
RMS-P (mg P kg-1)
(a) NaOH_0.2M_0.5h_TP y = -0.0113x2 + 9.7757x - 328.7
R² = 0.88
-500
0
500
1000
1500
2000
0 100 200 300 400 500
NaO
H-0
.2M
-0.5
h-T
P (
mg
P k
g-1)
RMS-P (mg P kg-1)
(a') NaOH_0.2M_0.5h_TP
y = 5.8794x - 145.78 R² = 0.85
0
500
1000
1500
2000
2500
0 100 200 300 400 500
NaO
H-0
.2M
-1h
-TP
(m
g P
kg-1
)
RMS-P (mg P kg-1)
(b) NaOH_0.2M_1h_TP
y = -0.0107x2 + 9.8413x - 327.47 R² = 0.89
-500
0
500
1000
1500
2000
2500
0 100 200 300 400 500
NaO
H-0
.2M
-1h
-TP
(m
g P
kg-1
)
RMS-P (mg P kg-1)
(b') NaOH_0.2M_1h_TP
Page 195
180
Figure 5.15 Linear (left) and non-linear (right) relationships between soil P (mg P kg-1) extracted by 0.2M NaOH and
cumulative amount of P extracted by resin membrane strip method (Total Releasable P)
y = 6.139x - 151.42 R² = 0.85
0
500
1000
1500
2000
2500
0 100 200 300 400 500
NaO
H-0
.2M
-1.5
h-T
P (
mg
P k
g-1)
RMS-P (mg P kg-1)
(c) NaOH_0.2M_1.5h_TP
y = -0.0117x2 + 10.433x - 348.35 R² = 0.88
-500
0
500
1000
1500
2000
2500
0 200 400 600
NaO
H-0
.2M
-1.5
h-T
P (
mg
P k
g-1)
RMS-P (mg P kg-1)
(c') NaOH_0.2M_1.5h_TP
y = 5.9043x - 142.89 R² = 0.85
0
500
1000
1500
2000
2500
0 100 200 300 400 500
NaO
H-0
.2M
-2h
-TP
(m
g P
kg-1
)
RMS-P (mg P kg-1)
(d) NaOH_0.2M_2h_TP
y = -0.0093x2 + 9.3292x - 299.95 R² = 0.87
-500
0
500
1000
1500
2000
2500
0 100 200 300 400 500
NaO
H-0
.2M
-2h
-TP
(m
g P
kg-1
)
RMS-P (mg P kg-1)
(d') NaOH_0.2M_2h_TP
Page 196
181
Chapter 6: Summary, Conclusions and Future Studies
6.1 Summary and conclusions
Freshwater eutrophication is accelerated by increased phosphorus (P) inputs, with a
large portion potentially from agricultural non-point sources. To reduce such negative
impacts of P on surface water quality, P inputs from agricultural lands are required to be
diligently managed to minimize them from entering into nearby water bodies. Hence, it
is imperative to identify the agricultural crop lands with high potential for P losses and
develop proper management strategies to minimize soil P loss. To accomplish this,
accurate measurements of soil P forms that related with loss from soil, their changes
and distribution in the soil profile are of prime importance.
The purpose of this thesis was to determine the effects of inorganic fertilizer (Triple
super phosphate and Ammonium nitrate) and different types of livestock manure
(different forms of swine manure and dairy manure slurry) applications on soil P forms,
their changes over time and distribution in the soil profile (objectives one and two). In
addition, a third objective was to develop a new soil P test for assessing the long-term P
loss potential of agricultural soils. To accomplish these objectives, this thesis is
comprised of three studies and their findings are summarized as follows.
The findings of both swine manure and dairy manure slurry studies indicate that
regardless of the P source, accumulation of P from external P sources was mostly in the
uppermost soil layer (0-15 cm). Generally, P has little mobility in soils because of their
strong reactivity with soil components and tendencies to be adsorbed on soil colloid
surfaces and to form insoluble compounds with bi- and trivalent cations (Stevenson and
Page 197
182
Cole 1999). In addition, this accumulation of soil P in the surface soil may also be
related to greater biological activity in surface soil layers where P was applied with
manure. Phosphorus accumulation in 0-15 cm soil depth is beneficial in terms of crop
growth especially in soils that are deficient in P. However, this accumulation is
accompanied by increases in soil-test P and degree of soil P saturation (Zheng et al.
2001) in the surface soil horizon that might increase the risk of P losses to adjacent
water bodies.
The results also confirmed that both types of manure had a very rapid impact on the
labile-Pi fractions (H2O-Pi and Bicarb-Pi) in soils. The reason may be due to the higher
Pi content in added manure sources. Further, the addition of organic matter to the soil
through manure application would enhance microbial and enzyme activities, which in
turn would increase the rate of biologically-mediated turnover of organic P into inorganic
P. In addition, competition between manure P and organic acids which were produced
during microbial degradation of organic matter, for adsorption sites on soil could lead to
a greater amount of manure P to be more available. Although increases of these labile
forms of P in soil increase plant availability of P, it also increases the risk of P loss and
contamination of adjacent water-bodies, causing environmental problems.
Considering the soil P pools, in the soils treated with dairy manure slurry and all forms
of swine manure, the moderately labile P fraction (NaOH-1-P) was the largest P fraction
compared to all other P fractions. NaOH extractable Pi is known to be the P
chemisorbed on amorphous Al and Fe minerals (Tiessen et al. 1984). Therefore, these
higher levels might be related to larger Al and Fe contents of these soils. Research has
found that the moderately labile P pool can act as a source of plant available P in
Page 198
183
absence of P inputs and also as a sink for P added in the case of P application in
excess of crop removal (Beck and Sanchex 1994). However, in the study with dairy
manure slurry application (Chapter four), the moderately labile P fraction did not show
significant changes. The potential explanation for the lack of significant changes of
moderately labile P fraction is, the rates of P application with dairy manure may not be
enough to considerably increase this P fraction, or the drawdown of the labile P fraction
due to plant P uptake may not be sufficient enough to result in reduction in this P
fraction. Therefore, moderately labile-P fraction neither acted as a P sink nor a P source
in the dairy manure study. In the study with swine manure and fertilizer P applications
(Chapter three), moderately labile P fraction increased significantly in year of P
application and also in the following year as a residual effect, indicating that moderately
labile P pool acted as the major sink for added P from swine manure and inorganic
fertilizer P. This is probably due to the formation of amorphous or crystalline Fe and Al
phosphates favoured by low pH. This low pH could be due in part to the application of
triple superphosphate that diminishes pH when solubilized, and also due in part to the
higher carbon availability through crop residues returning to the soil that releases acids
when degraded by microorganisms. These results show concomitant increases in labile
Pi and moderately labile Pi fractions along with P addition through different swine
manure forms and inorganic fertilizer P. Increases in both fractions indicate that these
fractions are an important sink of added P; it also suggests that P may be added in
excess of plant removal in this study.
The findings of the study with dairy manure slurry show that, moderately stable P
fraction (HCl-P) significantly increased with dairy manure slurry application, indicating
Page 199
184
that a considerable amount of P was added from dairy manure slurry to this P pool. The
study with swine manure or fertilizer P additions did not have significant impact on
moderately stable P fraction in the year of application or in the following year. This
indicates there were no measurable immediate or residual effects on moderately stable
P fraction from all these P sources. Generally, moderately stable P fraction is presumed
to be less use to plants and remains unaffected under normal conditions, because this
P fraction represents primary minerals in soils. This disparity of behaviour of moderately
stable P fraction with different manure and inorganic fertilizer P additions may be due to
the nature of the P sources and also due to the soil types and climatic conditions.
The organic P fraction of these soils did not change significantly with manure or fertilizer
application in both swine manure and dairy manure studies. One reason is that manure
contains relatively higher amounts of P in inorganic form and inorganic fertilizer P is
entirely in inorganic form. It has been reported in the literature that over 60% of P in the
manure products is initially present in the inorganic form (Barnett 1994; Sui et al. 1999).
Thus, application of manure products results in accumulation of P mainly in the
inorganic P pool (Gatiboni et al 2008) and it may not readily be incorporated into the
organic P pool to show significant impact. However, soils in the control plots showing
relatively higher organic P levels compared to the inorganic P levels indicate that the
soil itself contained a considerable amount of organic P and external P sources
contribute a significant amount of inorganic P to the treated soils.
In both studies, stable P forms (NaOH-2-Pi and Po and Res-P) did not show any
response to manure or fertilizer application, suggesting these sparingly soluble P
fractions may not likely contribute substantially to meet plant P needs or loading to
Page 200
185
surface water. Typically, the pools that are less available or stable are weakly
responsive to manure additions (Leinweber et al. 1999). However, some studies have
reported conflicting results which could be attributed to soil type and manure source.
Nevertheless, changes to these fractions may likely occur slowly and may take years to
become significantly quantifiable.
Generally, the forms and availability of P in soil following manure additions are
dependent to a large extent on the source of P applied. Most of the changes in manure-
treated soils are attributable to an increase in soil organic matter, because animal
manure, especially solid manure and manure compost contains a large amount of
organic matter. This increased organic matter in manure-treated soils covered clay
mineral surfaces or chelated metal ions, which could prevent Pi from adsorption or
precipitation by clay minerals or metal ions (Tang et al. 2006). Thus, the inorganic P
content in soil solution becomes higher in soils applied with manure with high organic
matter content.
Overall, the increases in labile and moderately labile P with manure applications are
beneficial for crop production, but excess amounts could negatively impact the
environment. The results of these studies confirm that the P applied with manure can
have both short-term (increases in labile-P fraction) and long-term (increases in
moderately stable-P fractions) impacts on soil P availability and P loss. However, in
both of these manure studies, other soil factors which influence soil P status need to be
considered, such as microbial activities, different agro-climatic factors (such as rainfall
intensity, evaporation and thermal effects) and concentrations of other soil constituents
that may have influence on soil P dynamics; this could be the focus of future research.
Page 201
186
As per the third objective, relationships between existing agronomic (Mehlich-3-P and
Olsen-P) and environmental (FeO-strips-P and Resin membrane strips, RMS-P) soil P
tests and new soil P tests (different concentrations of NaOH with EDTA and without
EDTA with different shaking periods) were assessed. The results show that the
amounts of P extracted by Mehlich-3 extractant were almost equal to the cumulative
RMS-P amounts for soils from Harrow and both sites in Saskatchewan. This suggests
that Mehlich-3 method was as effective as an RMS method for measuring the total
releasable P in these soils. Further, newly proposed reagents extracted more P than did
existing agronomic and environmental P tests. The reason for higher extraction is NaOH
changes the physical structure of organic molecules enhancing their solubility. Given
that, at high pH, many organic functional groups are ionized and the increased charge
density leads to increased P solubility. In addition, the inclusion of EDTA appeared to
enhance the amounts of P extracted compared to the NaOH without EDTA. Because
EDTA, a strong chelating ligand, complexes paramagnetic cations such as Fe and Mn
in the extract, it thereby increases soil P extraction efficiency and the diversity of P
compounds extracted (Bowman and Moir, 1993).
Considering the relationships between soil P tests, a strong correlation was observed
between two environmental P tests because of their common sink-based extracting
mechanisms. Further, the amounts of P extracted by two agronomic tests were also
highly correlated with RMS, indicating even though each of these reagents have
markedly different extraction mechanisms and extract different proportions of P, they all
are capable of estimating the total releasable P of that soil. These findings agree with
the findings of several past studies which have been conducted in different regions to
Page 202
187
analyze the relationship between amounts of P extracted by some environmental soil P
tests and P extracted by agronomic soil P tests. Their results demonstrated that the P
values obtained by agronomic P tests were well correlated with those of environmental
P tests (Atia and Mallarino 2002; Kleinman and Sharpley 2002; Maguire and Sims
2002). However, the relationships varied with soil properties such as soil type, soil pH,
particle size distribution and mineralogy and management practices, which are known to
influence soil P sorption. Hence, for regions with contrasting soils, only a few
generalizations can be made about the relationship between agronomic and
environmental P tests. Although P extracted by all the combinations of NaOH with
EDTA and NaOH without EDTA extractants were significantly correlated with RMS-P, all
the combinations of NaOH with EDTA extractants showed better correlation with RMS-P
than did NaOH alone. This suggests that NaOH with EDTA extractants are as effective
as RMS for measuring total releasable P of the soil and may have potential for use as
an environmental soil P test for identifying soils with long-term P loss potential.
6.2 Future Studies
To determine the residual effects of manure and inorganic fertilizer P on changes of soil
P forms, future studies need to be considered for a few more years with manure and
fertilizer applications on every other year and observe the behaviour of P fractions and
P distribution in the soil profile within these multi years. In order to further improve the
accuracy and appropriateness of this new soil P testing method as environmental soil P
test for prediction of long-term P loss potential, further work should be conducted using
a larger number of samples from different soil types from contrasting ecological regions
throughout Canada, and need to consider some other factors which influence on soil P.
Page 203
188
References
Abbott, J.L. and T.C. Tucker. 1973. Persistence of manure phosphorus availability in
calcareous soil. Soil Sci. Soc. Am. Proc. 37:60-63.
Abrams, M.M. and W.M. Jarrell. 1992. Bioavailability index for phosphorus using ion
exchange resin impregnated membranes. Soil Sci. Soc. Am. J. 56:1532-1537.
Adepetu, J.A. and R.B. Corey. 1977. Changes in N and P availability and P fractions
inIwo soils from Nigeria under intensive cultivation. Plant and Soil. 46(2):309-
316.
Allen, B.L., A.P. Mallarino, J.G. Klatt, J.L. Baker, and M. Camara. 2006. Soil and
surface runoff phosphorus relationships for five typical USA midwest soils. J.
Environ. Qual. 35:599-610.
Anderson, B.H. and F.R. Magdoff. 2005. Relative movement and soil fixation of soluble
organic and inorganic phosphorus. J. Environ. Qual. 34: 2228-2233.
Anderson, G. and R.E. Malcolm. 1974. The nature of alkali-soluble soil organic
phosphorus. J. Soil Sci. 25:282-297.
Anderson, G.1980. Assessing organic phosphorus in soils. In F.E. Khasawneh,
E.C.Sample, and E. J. Kamprath, (Eds). The role of phosphorus in Agriculture.
Am. Soc. Agronomy, Madison, WI. pp 411- 431.
Andraski, T.W. and L.G. Bundy. 2003. Relationship between phosphorus levels in soil
and in runoff from corn production systems. J. Environ. Qual. 32:310-316.
Atia, A.M. and A.P. Mallarino. 2002. Agronomic and Environmental Soil Phosphorus
Testing in Soils Receiving Liquid Swine Manure. Soil Sci. J. 66:1696-1705.
Aulakh, M.S. and N.S. Pasricha. 1991. Transformations of residual fertilizer P in a semi-
arid tropical soil under eight-year peanut-wheat rotation. Fert. Res. 29:145-152.
Page 204
189
Barbanti, A., M.C. Bergamini, F. Frascari, S. Miserocchi, and G. Rosso.1994. Critical
aspects of sedimentary phosphorus chemical fractionation. J.Environ.Qual.
23:1093-1102.
Barber, S.A. 1979. Crop response to P and K during 25 years of rotation-fertility
experiment (corn, soybeans). Better crops Plant Food. 63:26-28.
Barber, S. A. 1995. Soil nutrient bioavailability: a mechanistic approach. 2nd edition.
John Wiley and Sons, New York, NY. pp 414.
Barberis, E., F.A. Marsan, R. Scalenghe, A. Lammers.U. Schwertmann, A.C. Edwards,
R. Maguire, M.J. Wilson, A. Delgado, and J. Torrent. 1996. European soils over-
fertilized with phosphorus: I. Basic properties. Fert. Res. 45:199-207.
Barnett, G.M. 1994. Phosphorus forms in animal manure. Bioresour Technol 49:139-
147.
Batsula, A. A. and G. M. Krivonosova. 1973. Phosphorus in the humic and fulvic acids
of some Ukranian soils. Soviet Soil Sci. 347-350.
Beauchemin, S., R.R. Simard, and D. Cluis. 1998. Forms and concentration of
phosphorus in drainage water of 27 tile-drained soil. J. Environ. Qual. 27:721-
728.
Beck, M. A. and P. A. Sanchez. 1994. Soil phosphorus fraction dynamics during 18
years of cultivation on a Typic Paleudult. Soil Sci. Am. J. 58:1424-1431.
Bengston, L., P. Seuna, A. Lepisto, and R.K.Saxena. 1992. Particle movement of
meltwater in a subdrained agricultural basin. J. Hydrology. 135:383-398.
Bissonnette, N., D.A. Angers, R.R. Simard, and J. Lafond. 2001. Interactive effects of
management practices on water-stable aggregation and organic matter of a
Humic Gleysol. Can. J. Soil Sci. 81:545-551.
Bittman et al. 1999. Surface-Banded and Broadcast Dairy Manure Effects on Tall
Fescue Yield and Nitrogen uptake. Agron. J. 91: 826-833.
Page 205
190
Bittman, S., D.E. Hunt, C.G.Kowalenko, X. Wu, and T.A. Forge. 2004. Early phosphorus
nutrition in corn and the role of mycorrhizae. P 42-48. In S. Bttman and C. G.
Kowalenko (ed). Advanced silage corn management. Pacific Field Corn Assoc.,
Agassiz, B.C.
Bittman, S., C.G.Kowalenko, D.E. Hunt, T.A. Forge and X. Wu. 2006. Starter P fertilizer
and broadcast nutrients on corn with contrasting colonization by arbuscular
mycorrhizae. Agron. J. 98, 394-401.
Bowman, R. A. and C. V. Cole, 1978a. Transformations of organic phosphorus
substrates in soils as evaluated by NaHCO3 extraction. Soil Sci. 125:49-54.
Bowman, R.A. and Cole C.V. 1978b. An exploratory method for fractionation of organic
phosphorus from grassland soils. Soil Sci.125: 95-101.
Bowman, R.A. and J.O. Moir. 1993. Basic EDTA as an extractant for soil organic
phosphorus. Soil Sci. Soc. Am. J. 57:1516-1518.
Brady, N.C. and R.R. Weil. 2007. The nature and properties of soils, 14th edition,
Prentice Hall, NJ, USA.
Bray, R.H. and L.T. Kurtz. 1945. Determination of total, organic and available forms of
phosphorus in soils. Soil Sci. 59:39-45.
Breeuwsma, A., J.G.A. Reijerink, and O.F. Schoumans. 1995. Impact of manure on
accumulation and leaching of phosphate in areas of intensive livestock farming.
pp. 239-251. In K. Steele (ed.) Animal waste and the land-water interface. Lewis
Publishers- CRC, New York, NY.
Buehler, S., A. Oberson, I. M. Rao, D. K. Friesen, and E. Frossard. 2002. Sequential
Phosphorus Extraction of a 33P-Labeled Oxisol under Contrasting Agricultural
Systems. Soil Sci. Soc. Am. J. 66:868–877.
Bunemann, E.K., D.P. Heenan, P. Marschner and A.M. McNeill. 2006. Long-term
effects of crop rotation, stubble management and tillage on soil phosphorus
dynamics. Australian Journal of Soil Research 44:611-618.
Page 206
191
Buondonno, A., E. Coppola, D. Felleca, and P. Violante. 1992. Comparing tests for soil
fertility: 1. Conversion equations between Olsen and Mehlich- 3 as phosphorus
extractants for 120 soils of South Italy. Comm. Soil Sci. Plant Anal. 23:699-716.
Campbell, C. A., M. Schnitzer, J.W. B. Stewart, V.O. Biederbeck, and, F. Selles. 1986.
Effect of manure and P fertilizer on properties of a Black Chemozem in southern
Saskatchewan. Can. J. Soil Sci. 66:60l-613.
Carpenter, S.R., N.F. Caraco, D.L. Correll, R.W. Howarth, A.N.Sharlpey, and
V.H.Smith. 1998. Nonpoint pollution of surface waters withphosphorus and
nitrogen. Ecol Appl. 8:559-568.
CAST. 2000. Relevance of soil testing to agriculture and the environment. Council For
Agricultural Science and Technology, Issue Paper Number 15.
Council for Agricultural Science and Technology, 2000. Relevence of soil testing to
agriculture and the environment. Issue Paper No. 15. CAST, Ames, IA. pp 1-12.
Celi, L., S. Lamacchia, F.A. Marsan, and E. Barberis. 1999. Interaction of inositol
hexaphosphate on clays: adsorption and charging phenomena. Soil Sci.
164:574-585.
Chang, S.C. and M.L. Jackson, 1957. Fractination of soil phosphorus. Soil Sci. 84:133-
144.
Chang, C., T.G. Sommerfeldt, and T. Entz. 1990. Rates of soil chemical changes with
eleven annual applications of cattle feedlot manure. Can. J. Soil Sci. 70:673–681.
Chardon, W.J., R.G. Menon, and S.H. Chien. 1996. Iron oxide-impregnated filter paper
(pi test): a review of its development and methodological research. Nutr. Cycl. In
Agroecosyst. 46:41-51.
Chardon, W.J., O. Oenema, P. Del, Castilho, R. Vriesema, J. Japenga, and D. Blaauw.
1997. Organic phosphorus in solutions and leachates from soils treated with
animal slurries. J. Environ. Qual. 26:372-378.
Page 207
192
Charter, M. and G.E.G. Mattingly.1979. Changes in organic phosphorus contents of
soils from long-term experiments at Rothamsted and Saxmundham. In Report of
Rothamsted Experimental Station, Harpenden, Hertfordshire, UK. 2:41.
Chauhan, B. S., J.W.B. Stewart, and E.A. Paul. 1981. Effect of labile inorganic
phosphate status and organic carbon additions in the microbial uptake of
phosphorus in soil. Can. J. Soil Sci. 61:373-385.
Ciampitti, A.I., L.I. Picone, G. Rubio and F.O. Garcia. 2011. Pathways of phosphorus
fraction dynamics in field crop rotations of the Pampas of Argentina. Soil Sci.Soc.
Am. J. 75(3):918-926.
Condron, L.M., E. Frossard, H. Tiessen, R.H. Newman, and J.W.B. Stewart.1990.
Chemical nature of organic phosphorus in cultivated and uncultivated soils under
different environmental conditions. J. Soil Sci. 41:41-50.
Condron, L.M., K.M. Goh, and R.H. Newman. 1985. Nature and distribution of soil
phosphorus as revealed by a sequential extraction method followed by 31P
nuclear magnetic resonance analysis. J. Soil Sci. 36:199-207.
Cooperband, L.R. and T.J. Logan. 1994. Measuring in situ changes in labile soil
phosphorus with anion-exchange membranes. Soil Sci. Soc Am. J. 58:105-114.
Copeland, O.L. and F.G. Merkle. 1941. The influence of certain soil treatments upon the
fixation and availability of applied phosphates. Soil Sci. Soc. Am. Proc. 6:321-
327.
Cox, F.R. and S.E. Hendricks. 2000. Soil test phosphorus and clay content effects on
runoff water quality. J. Environ. Qual. 29:1582-1586.
Cross, A.F. and W.H. Schlesinger. 1995. A literature review and evaluation of the
Hedley fractionation: Application to the biogeochemical cycle of soil phosphorus
in natural ecosystems. Geoderma. 64:197-214.
Culley, J. L. B., E.F. Bolton, and V. Bernyk. 1983. Suspended solids and phosphorus
loads from a clay soil: I. Plot studies. J. Environ. Qual. 12(4):493-498.
Page 208
193
Cusick, P.R., K.A. Kelling, J.M. Powell, and G.R. Muñoz. 2006. Estimates of residual
dairy manure nitrogen availability using various techniques. J. Environ. Qual.
35:2170-2177.
Dalal, R.C. 1977. Soil organic phosphorus. Adv. Agron. 29: 83-117.
Dalton, D., G. Russell, and D. Sieling. 1952. Effect of organic matter on phosphate
availability. Soil Sci. 73:173-181.
Daniel, T.C., A.N. Sharpley, D.R. Edwards, R. Wedepohl, and J.L. Lemunyon.1994.
Minimizing surface water eutrophication from agriculture by phosphorus
management. J. Soil Water Conservation supplement. 49:30-44.
Daroub, S.H., F.J. Pierce, and B.G. Ellis. 2000. P fractions and fate of P33 in soils under
plowing and no-tillage. Soil Sci. Soc. Am. J. 64:170-176.
DeLuca, T. H., and D.K. DeLuca. 1997. Composting for feedlot manure management
and soil quality. J. Prod. Agric. 10:235-241.
Dormaar, J.F. and C. Chang. 1995. Effect of 20 annual applications of excess feedlot
manure on labile soil phosphorus. Can. J. Soil Sci. 75:507-512.
Dou, Z., J.D.Toth, J.D. Ferguson, D.T. Galligan, and C.F. Ramberg. 2000. Laboratory
procedures for characterizing manure phosphorus. J. Environ. Qual. 29:508-514.
Du, C., M. Lei, J. Zhou, and H. Wang Effect of long term fertilization on the
transformations of water extractable phosphorus in a fluvo-aquic soil. J. Plant
Nutr. Soil Sci. 2011, 174:20-27. Wiley Online Library.
Edward, C. and H. Daniel, 1993. Technical basis for quantifying phosphorus transfort to
surface and groundwaters. J. Animal Science.
Eghball, B., G.D. Binford, and D.D. Baltensperger. 1996. Phosphorus movement
andadsorption in a soil receiving long-term manure and fertilizer application. J.
Environ. Qual. 25:1339-1343.
Page 209
194
Eghball, B, and G. W. Lesoing. 2000. Viability of weed seeds following manure windrow
composting. Compost Science & Utilization 8:46–53.
Eghball, B., D.D. Gilley, D.D. Baltensperger, and J.M. Blumenthal, 2002. Phosphorus
and nitrogen in runoff following long-term and recent manure fertilizer
applications. Trans. ASAE 45:687-694.
Eghball, B. 2003. Leaching of phosphorus fractions following manure or compost
application. Commun. Soil Sci. Plant Anal. 34:2803-2815.
Egrinya Eneji, A., T. Honna, and S. Yamamoto. 2001. Manuring effect on rice grain yield
and extractable trace elements in soils. J. Plant Nutr. 24(7): 967-977.
Ekholm, P.1994. Bioavailability of phosphorus in agriculturally loaded rivers in southern
Finland. Hydrobiologia. 287:179-194.
Elias-Azar, K., A.E. Laag, and P.F. Pratt. 1980. Bicarbonate- extractable phosphorus in
fresh and composted dairy manures. Soil Sci. Soc. Am. J. 44: 435-437.
Elliott, H. A., G.A. O’Connor, and S. Brinton. 2002. Waste Management: Phosphorus
Leaching from Biosolid-Amended Sandy Soils. J. Environ. Qual. 31:681-689.
Erich, M.S., C.B. Fitzgerald, and G.A. Porter. 2002. The effect of organic amendments
on phosphorus chemistry in a potato cropping system. Agric. Ecosyst. Environ
88:79–88.
Fang, F., P.L. Brezonik, D.J. Mulla, and L.K. Hatch. 2002. Estimating runoff phosphorus
losses from calcareous soils in the Minnesota River basin. J. Environ. Qual.
31:1918–1929.
Fernandes, M.L. and J. Coutinho.1997. Anion and cation exchange resin membrane to
assess the phosphorus status of some Portuguese soil. Communication: Soil Sci.
Plant Anal. 28:483-495.
Page 210
195
Fernandes, M.L.V., R. Indiati, J. Coutinho, and A. Buondonno. 1999. Soil properties
affecting phosphorus extraction from Portuguese soils by conventional and
innovative methods. Commun. Soil Sci. Plant Anal. 30:921-936.
Fixen, P.E. and J.N. Grove. 1990. Testing soil for phosphorus. pp.141-180. In
R.L.Westerman (ed.) Soil Testing and Plant Analysis, 3rd Ed. Soil Sci. Soc. Am.
Madison, WI.
Fox, R.L. and E.J. Kamprath. 1971. Adsorption and leaching of P in acid organic soils
and high organic matter sand Soil Sci. Soc. Am. Proc. 35.
Freeman, J.S. and D.L. Rowell. 1981. The adsorption and precipitation of phosphate
onto calcite. J. Soil Sci. 32:75-84.
Frossard, E., M. Brossard, M.J. Hedley, and A. Metherell. 1995. Reactions controlling
the cycling of phosphorus in soils. pp 107-138. In H. Tiessen (ed.) Phosphorus in
the global environment: Transfers, cycles and management. J Wiley and Sons,
New York, NY.
Frossard, E., L.M. Condron, A. Oberson, S. Sinaj, and J.C. Fardeau. 2000. Processes
governing phosphorus availability in temperate soils. J. Environ. Qual. 29:15-23.
Gagnon, B. and R.R. Simard. 2003. Soil P fractions as affected by on-farm composts in
a controlled incubation study.. Can. J. Soil Sci. 83:223-226.
Gagnon, B. and R.R. Simard. 1999. Nitrogen and phosphorus release from on-farm and
industrial compost. Can. J. Soil Sci. 79:481-489.
Gale, P. M., M.D. Mullen, C. Cieslik, D.D.Tyler, B.N. Duck, M. Kirchner, and J. McClure.
2000. Phosphorus distribution and availability in response to dairy manure
applications. Commun. Soil Sci. Plant Anal. 31:553–565.
Gatiboni, L.C., G. Brunetto, J. Kaminski, D.S. Rheinheimer, C.A. Ceretta, and C.J.
Basso. 2008. Formas de fosforo no solo apos sucessivas adicoes de dejeto
liquid de suinos em pastagem natural. R. Bras Ci Solo 32 : 1753-1761.
Page 211
196
Gaynor, J.D. and W.I. Findlay. 1995. Soil and phosphorus loss from conservation and
conventional tillage in corn production. J. Environ. Qual. 24:734–741.
Gburek, W., A.N. Sharpley, L. Heathwaite, and G. L. Folmar. 2000. Phosphorus
management at the watershed scale: A modification of the phosphorus index. J.
Environ. Qual. 29:130–144.
Gee, G. W. and J.W. Bauder. 1986. Particle-size analysis. pp. 383-411. In A Klute (ed.)
Methods of Soil Analysis, Part 1. Physical and Mineralogical Methods. Agronomy
Monograph No. 9 (2ed). Am. Soc. Agronomy/Soil Sci. Soc. Am. Madison, WI.
Golterman, H.L.1988. Reflections on fractionation and bioavailability of sediment bound
phosphate. Arch. Hydrobiol. 30:1-4.
Goss, D.W. and B. A. Stewart. 1979. Efficiency of phosphorus utilization by alfalfa
(Medicago sativa) from manure and superphosphate. Soil Sci. Soc. Am. J.
43:523-528.
Greatz, D.A. and V.D. Nair.1995. Fate of phosphorus in Florida Spodosols
contaminated with cattle manure. Ecol. Eng. 5:163-181.
Greb, B.W. and S.R. Olsen. 1967. Organic phosphorus in calcareous Colorado soils.
Soil Sci. Soc. Am. Proc. 31:85-88.
Griffin, T.S., C.W. Honeycutt, and Z. He. 2003. Changes in soil phosphorus from
manure application. Soil Sci. Soc. Am. J. 67:645-653.
Guo, F., R.S. Yost, N.V. Hue, C.I. Evensen, and J.A. Silva. 2000. Changes in P
fractions in soils under intensive plant growth. Soil Sci. soc. Am. J. 64:1681-
1689.
Guppy, C.N., N.W. Menzies, P.W. Moody, F.P.C. Blamey. 2005. Competitive sorption
reactions between phosphorus and organic matter in soil: a review. Soil
Research. 43:189–202.
Page 212
197
Halstead, R.L. and R.B. McKercher. 1975. Biochemistry and cycling of phosphorus. pp.
31-63. In E.A. Paul, and A.D. McLaren, (ed.) Soil Biochem. 4: Chapter 2. Marcel
Deker, NY.
Han, X. Z., C.Y. Song, S.Y. Wang, and C. Tang C. 2005. Impact of long-term
fertilization on phosphorus status in black soil. Pedosphere 15(3):319-332.
Hansen, N.C., T.C. Daniel, A.N. Sharpley, and J.L. Lemunyon. 2002. The fate and
transport of phosphorus in agricultural systems. J. Soil and water conservation.
Hao, X., F. Godlinski, and C. Chang. 2008. Distribution of phosphorus forms in soil
following long-term continuous and discontinuous cattle manure applications. Soil
Sci. Soc. Am. J. 72:90-97.
Havlin, J.L., J.D. Beaton, S.L. Tisdale, and W.L. Nelson. 1999. Soil Fertility and
Fertilizers. 6th Edition. Prentice Hall. Upper Saddle River, NJ. 499 p.
Hawkes, G.E., D.S. Powlson, E.W. Randall, and K.R. Tate. 1984. A 31P nuclear
magnetic resonance study of the phosphorus species in alkali extracts of soils
from long-term field experiments. J. Soil Sci. 35:35-45.
Haygarth, P.M., L. Hepworth, and S.C. Jarvis. 1998. Forms of phosphorus transfer in
hydrolical pathways from soil under grazed grassland. Europ. J. Soil Sci. 49:65-
72.
He, Z. and C.W. Honeycutt. 2001. Enzymatic characterization of organic phosphorus in
animal manure. J. Environ. Qual. 30:1685-1692.
He, Z., T. A. Griffin, and C. W. Honeycut. 2004. Evaluation of soil phosphorus
transformations by sequential fractionation and phosphatase hydrolysis. Soil Sci.
169: 515-527.
Heckrath, G., P.C. Brookes, P.R. Poulton, and K.W.T. Goulding. 1995. Phosphorus
leaching from soils containing different phosphorus concentrations in the
Broadbalk experiment. J. Environ. Qual. 24:910-914.
Page 213
198
Hedley, M.J., R.E. White, and P.H. Nye. 1982a. Plant-induced changes in the
rhizosphere of rape seedlings. III. Changes in L value, soil phosphate fractions
and phosphatase activity. New Physiol. 91:45-56.
Hedley, M.J., J.W.B. Stewart, and B.S. Chuhan.1982b. Changes in inorganic and
organic soil phosphorus fractions induced by cultivation practices and by
laboratory incubations. Soil Sci. Am. J. 46:970-976.
Hedley, M.J., J.M. Mortvedt, N.S. Bolan, and J.K. Syers. 1995. Phosphorus fertility
management in agroecosystems. pp. 59-92. In H. Tiessen (ed.) Phosphorus in
the global environment: Transfers, cycles and management. J. Wiley and Sons,
New York, NY.
Hendershot , W.H., H. Lalande, and M. Duquett. 1993. Soil reactions and exchangeable
acidity, pp. 141-142, In M. R. Carter, (ed.) Soil Sampling and Methods of
Analysis. Can. Soc. Soil Sci. Lewis Publishers, Boca Raton, Florida.
Hooda, P.S., M. Moynagh, I.F. Svoboda, A.C. Edwards, H. A. Anderson and G. Sym.
1999. Phosphorus loss in drain-flow from intensively managed grassland soils. J.
Environ. Qual. 28, 1235-1242.
Hooda, P.S., M. Moynagh, I.F. Svoboda. 1997b. Soil and land use effects on
phosphorus in six streams draining small agricultural catchments in Scotland,
Soil Use Manage. 13:196-204.
Hooda, P.S., V.W. Truesdale, A.C. Edwards, P.J.A. Withers, M.N. Aitken, A. Miller and
A.R. Rendell. 2001. Manuring and fertilization effects on phosphorus
accumulation in soils and potential environmential implications. Adv Environ Res
5:13-21.
Hountin, J.A., A. Karam, D. Couillard, and M.P. Cescas. 1999. Use of a
fractionationprocedure to assess the potential for P movement in a soil profile
after 14 years of liquid pig manure fertilization. Agriculture, Ecosystems and
Environment. 78:77-84.
Page 214
199
Hountin, J.A., A. Karam, D. Couillard, and M.P. Cescas. 2000. Use of a fractionation
procedure to assess the potential for P movement in a soil profile after 14 years
of liquid pig manure fertilization. Agric. Ecosyst. Environ. 78:77-84.
Hoyt, P.B. and W.A. Rice. 1977. Effects of high rates of chemical fertilizer and barnyard
manure on yield and moisture use of six successive barley crops grown on three
Gray Luvisolic soils. Can. J. Soil Sci. 57: 425-435.
Humphreys, F.R. and W.L Pritchett. 1971. Phosphorus adsorption and movement in
some sandy forest soils. Soil Sci. Am. Proc 35:495–500.
Ige, D.V., O.O. Akinremi, and D.N. Flaten. 2005. Environmental index for estimating the
risk of P loss in calcareous soils of Manitoba. J. Environ. Qual. 34:1944-1951.
Kafkafi, U., B. Bar-Yosef, R. Rosenberg, and G. Sposito. 1988. Phosphorus adsorption
by kaolinite and montmorillinite: II. Organic anion competition. Soil Sci. Soc. Am.
J. 52:1585-1589.
Kamprath, E.J. and M.E. Watson. 1980. Conventional soil and Tissue Tests for
Assessing the phosphorus status of soil. In The Role of phosphorus in
Agriculture; Khasawneh, F.E. Sample, E.C. Kamprath, E.J. Eds.; American
Society of Agronomy/Crop Science Society of America/Soil Science Society of
America: Madison, WI, 433-469.
Kashem, A., O.O. Akinremi, and G.J. Racz. 2004. Phosphorus fractions in soil amended
with organic and inorganic phosphorus sources. Can. J. Soil Sci. 84: 83-90.
Kashmanian, R.M. and R.F. Rynk. 1996. Agricultural composting in the United States:
trends and driving forces. J. Soil Water Conserv. 51:194-201.
Kashmanian, R.M. and R.F. Rynk. 1998. Creating positive incentives for farm
composting Am. J. Altern. Agric. 13:40-45.
Khasawneh, F.E., E.C. Sample, and E.J. Kamprath. 1980. The role of phosphorus in
Agriculture. ASA CSSA SSSA, Madison, Wisconsin USA.
Page 215
200
Klatt, J.G., A.P. Mallarino, J.A. Downing, J.A. Kopaska, and D.J. Wittry. 2003. Soil
phosphorus, management practices, and their relationship to phosphorus
delivery in the Iowa clear lake agricultural watershed. J Environ. Qual.32:2140-
2149.
Kleinman, P. J. A., R. B. Bryant, and W. S. Reid. 1999. Development of pedotransfer
functions to quantify phosphorus saturation of agricultural soils. J. Environ.
Quality. 28: 2026-2030.
Kleinman, Peter J. A., Sharpley, A. N., Gartley, K., Jarrell, W. M., Kuo, S., Menon, R.
G., Myers, R., Reddy, K. R. and Skogley, E. O.(2001)'Interlaboratory comparison
of soil phosphorus extracted by various soil test methods',Commun. inSoil Sci.
and Plant Analysis. 32:15,2325- 2345
Kleinman, P.J.A. and A.N. Sharpley. 2002. Estimating soil phosphorus sorption
saturation from Mehlich-3 data. Commun. Soil Sci. Plant Anal. 33:1825-1839.
Kleinman, P.J.A., A.N. Sharpley, B.J. Moyer, and G.F. Elwinger. 2002a. Effect of
mineral and manure P sources on runoff P. J. Environ. Qual. 31:2026-2033.
Kleinman, P.J.A. and A.N. Sharpley. 2003. Effect of broadcast manure on runoff P
concentrations over successive rainfall events.J.Environ.Qual.32:1072-1081.
Knudsen, D., G.A. Peterson and P. Pratt. 1982. Lithium, sodium, and potassium. pp.
225–246 In: Page, A.L. (Ed.), Methods of Soil Analysis, Part, Vol. 2. American
Society of Agronomy, Soil Science Society of America, Madison, Wis.
Koopmans, G.F., M.E. Van Der Zeeuw, P.F.A.M. Romkens, W.J. Chardon, and O.
Oenema. 2001. Identification and characterization of phosphorus rich sandy
soils. Neth. J. Agric. Sci. 49:369-384.
Kowalenko, C.G., O. Schmidt and G. Hughes-Games. 2007. Fraser Valley soil nutrient
study 2005. A survey of the nitrogen, phosphorus and potassium contents of
Lower Fraser Valley agricultural soils in relation to environmental and agronomic
concerns.
Page 216
201
Kuo, S.1996. Phosphorus. pp. 869-919. In D.L. Sparks (ed.) Methods of soil analysis.
Part 3. Chemical methods. SSSA Book Ser. 5. SSSA. Madison, WI.
Lalande, R., B. Gagnon, R.R. Simard, and D. Cote. 2000. Soil microbial biomass and
enzyme activity following liquid hog manure application in a long-term field trial.
Can. J. Soil Sci. 80:263-269.
Larney, F.J. and X. Hao. 2007. Composting as a management alternative for beef
feedlot manure in southern Alberta, Canada. J. Bioresour. Technol. 98:3221-
3227.
Larson, W. E., C.E. Clapp, W.H. Pierre, and Y.B. Morachan. 1972. Effects of increasing
amounts of organic residues on continuous corn: II. Organic carbon, nitrogen,
phosphorus and sulfur. Agronomy J. 64: 204–208.
Leaver, J. D. 1984. Milk production from grazed temperate grassland. J. Dairy Res. 52:
313–344.
Leinweber, P., R. Meissner, K.U. Eckhardt and J. Seeger. 1999. Management effects
on forms of phosphorus in soil and leaching losses. Eur. J. Soil Sci. 50: 413-424.
Lindsay, W.L. 1979. Chemical equilibria in soils. John Wiley & Sons. New York.
Lindley, J.A., D.W. Johnson, and C.J. Clanton. 1988. Effects of handling and storage
systems on manure value. ASAE. Applied Engr. Agric. 4(3): 246-252.
Linquist, B.A., P.W. Singleton, and K.G.Cassman. 1997. Inorganic and organic
phosphorus dynamics during a buildup and decline of available phosphorus in an
ultisol. Soil Sci. 162:254-264.
Lucero, D.W., D.C. Martens, J.R. McKenna, and D.E. Starner. 1995. Accumulation and
movement of phosphorus from poultry litter application on a Starr clay loam.
Commun. Soil Sci. Plant Anal. 26:1709-1718.
Page 217
202
Lyamuremye, F., R.P. Dick, and J. Baham. 1996. Organic amendments and
phosphorus dynamics: II. Distribution of soil phosphorus fractions. Soil
Sci.161:436-443.
Magdoff, F.R., C. Hryshko, W.E. Jokela, R.P. Durieux, and Y. Bu. 1999. Comparison of
phosphorus soil tests extractants for plant availability and environmental
assessments. Soil Sci. Soc. Am. J. 63:999-1006.
Maguire, R.O., and J.T. Sims. 2002a. Soil testing to predict phosphorus leaching. J.
Environ. Qual. 31:1601-1609.
Mallarino, A.P. 1997. Interpretation of soil phosphorus tests for corn in soils with varying
pH and calcium carbonate content. J. Prod. Agric. 10:163-167.
Mallarino, A.P., J.M. Bordoli, and R. Borges. 1999. Phosphorus and potassium
placement effects on early growth and nutrient uptake of no-till corn and
relationship with grain yield. Agron. J. 91:37-45.
Mallarino, A.P., Barbazan, M.M. and Wittry, D.J. 2005. Swine manure phosphorus use
for crop production in Iowa. North Central Extension-Industry Soil Fertility
Conference. 2005. Vol. 21. Des Moines, IA.
Mallarino, A.P., and R. Borges. 2005. Distribution of soil-test phosphorus and potassium
in soil as affected by tillage and long term deep-band fertilization. Soil Sci.Soc.
Am. J.
Martin, J.K. 1970. Organic phosphate compounds in water extracts of soils. Soil Sci.
109 (6):362-375.
Mattingly, G.E.G.1975. Labile phosphate in soils. Soil Sci.119:369-375.
McDowell, L.L., J.D. Schreiber, and H.B. Pionke. 1980. Estimating soluble (PO4-P) and
labile phosphorus in runoff from crop lands. pp. 505-553. In CREAMS- A field
scale model for chemicals runoff and erosion from agricultural management
systems. USDA Conserv. Res. Rep. 26 U.S. Gov. Print Office, Washington, DC.
Page 218
203
McDowell, R., A.N. Sharpley, P. Brookes, and P. Poulton. 2001. Relationship between
soil test phosphorus and phosphorus release to solution. Soil Sci. 166:137-149.
McDowell, R.W. and A.N. Sharpley. 2001c. Approximating phosphorus release from
soils to surface runoff and subsurface drainage. J. Environ. Qual. 30: 508-520.
McKenzie, R. H., J. W. B., Stewart, J. F Dormaar, and G. B. Schaalje. 1992a. Long-term
crop rotation and fertilizer effects on phosphorus transformations: I. In a
Chernozemic soil. Can. J. Soil Sci. 72: 569-579.
McKenzie, R. H., J. W. B. Stewart, J. F. Dormaar, and G. B. Schaalje. 1992b. Long-term
crop rotation and fertilizer effects on phosphorus transformations: II. In a
Luvisolic soil. soil. Can. J. Soil Sci. 72: 582-589.
McLaughlin, J.R., J.C. Ryden, and J.K. Syers.1977. Development and evaluation of a
kinetic model to describe phosphate sorption by hydrous ferric oxide gels.
Geoderma. 18:295-307
McLaughlin, M.J., A.M. Alston, and J.K. Martin. 1988. Phosphorus cycling in wheat-
pasture rotations.lll. Organic phosphorus turnover and phosphorus cycling. Aust.
J. Soil Res. 26:343-353.
Meek, B.D., L.E. Graham, T.J. Donovan, and K.S. Mayberry. 1979. Phosphorus
availability in a calcareous soil after high loading rates of animal manure. Soil
Sci. Soc. Am. J. 43:741-743.
Meek, B., L. Graham, and T. Donovan. 1982. Long-term effects of manure on nitrogen,
phosphorus, potassium, sodium, organic matter and water infiltration. Soil Sci.
Soc. Am.J. 46:1014-1020.
Mehlich, A. 1984. Method 3 soil test extractants: A modifcation of Mehlich 2 extractant.
Commun. Soil Sci. and Plant Anal. 15:1409-1416.
Menalled, E.D., M. liebman, and D.D. Buhler. 2002. Impact of composted swine manure
on crop and weed establishment and growth. pp.183. In Proc. Workshop Eur.
Weed Res. Soc. Working Group on Physical and Cultural Weed Control, 5th,
Page 219
204
Pisa, Italy. 11-13 Mar. 2002. Institut de Malherbologie, Ste. Anne de Bellevue,
QC, Canada.
Menon, R.G., L.L. Hammond, and H.A. Sissingh. 1989. Determination of plant-available
phosphorus by iron hydroxide-impregnated filter paper (Pi) soil test. Soil Sci. Soc.
Am. J. 53:110-115.
Menon, R.G., S.H. Chien, and L.L. Hammond. 1990. Development and evaluation of the
Pi soil test for plant available phosphorus. Commun. Soil Sci. Plant Anal.
21:1131-1150.
Mikkelson, R.L.1997. Agricultural and environmental issues in the management of
swine waste. pp.110-119. In J. E. Rechcigl and H.C. MacKinnon (ed.) Agricultural
uses of by-products and wastes. Am. Chemical Society. Washington, D.C.
Mikkelson, R. L. 2000. Beneficial use of swine by-products: Opportunities for the future.
In Land application of agricultural, Industrial, and Municipal By-products, Book
series no.6. JF Powers, WA Dick (eds.). SSSA, Madison, WI, 451-480.
Miller, M.H. 1979. Contribution of nitrogen and phosphorus to subsurface drainage
water from intensively cropped mineral and organic soils in Ontario. J. Environ.
Qual. 8:42-48.
Mnkeni, P.N.S. and A.F. MacKenzie. 1985. Retention of ortho- and polyphosphates in
some Quebec soils as affected by added organic residues and calcium
carbonate. Can. J. Soil Sci. 65:575-585.
Moore, P.A., Jr., M.L. Self-Davis, T.C. Daniel, W.E. Huff, D.R. Ed wards, D.J. Nichols,
W.F. Jaynes, G.R. Huff, J.M. Balog, N.C.Rath, P.W. Waldroup, and V. Raboy.
1998. Use of high available P corn and phytase enzyme additions to broiler diets
to lower phosphorus levels in poultry litter. In J.P. Blake and P.H. Patterson (ed.)
Proc. 1998 Natl. Poultry Waste Symp., Springdale, AR. 19–21Oct. 1998. Auburn
Univ. Print. Serv., Auburn, AL.
Page 220
205
Morel, C., H. Tunney, D. Plenet, and S. Pellerin. 2000. Transfer of phosphorus ions
between soil and solution: perspectives in soil testing. J. Environ. Quality. 29:
50–59.
Motavalli, P. P. and R. J. Miles. 2002. Soil phosphorus fractions after 111 years of
animal manure and fertilizer applications. Biol Fertil Soils 36:35–42.
Mozaffari, M. and J.T. Sims. 1994. Phosphorus availability and sorption in an Atlantic
coastal plain watershed dominated by animal-based agriculture. Soil Sci. 157:97-
107.
Murphy, J. and J.R. Riley, 1962. A modified single solution method for the determination
of phosphate in natural water. Anal.Chim.Acta 27:31-36.
Muukkonen, P., H. Hartikainen, K. Lahti, A. Särkelä, M. Puustinen & L. Alakukku. 2007.
Influence of no-tillage on the distribution and lability of phosphorus in Finnish clay
soils. Agriculture, Ecosystems, and Environment 120:299-306.
Myers, R.G., G.M. Pierzynski, and S.J. Thien. 1995. Improving the iron oxide sink
method for extracting soil phosphorus. Soil Sci. Soc. Am. J. 59:853-857.
Myers, R.G., A. N. Sharpley, S. J. Thien, and G. M. Pierzynski. 2005. Ion-Sink
Phosphorus Extraction Methods Applied on 24 Soils from the Continental USA.
Soil Sci. Soc. Am. J. 69:511–521.
Nagarajah, S., A.M. Posner, and J.P. Quirk. 1970. Competitive adsorption of phosphate
with polygalacturonate and other organic anions on kaolinite and oxide surfaces.
Nature. 228:83-85
Nair, V.D., A.A. Graetz, and K.M. Portier. 1995. Forma of phosphorus in soil profiles
from dairies of South Florida. Soil Sci. Soc. Am. J. 59: 1244-1249.
N’Dayegamiye, A. and D. Cote. 1989. Effect of long-term pig slurry and solid cattle
manure application on soil chemical and biological properties. Can. J. soil Sci.
69:39-47.
Page 221
206
Nearing, M.A., R.M. Risse, and L.F. Rogers. 1993. Estimating daily nutrient fluxes to a
large Piedmont reservoir from limited tributary data. J. Environ. Qual. 22:666-
671.
Nguyen, M.L., and K.M. Goh. 1992. Nutrient cycling and losses based on a mass-
balance model in grazed pasture receiving long-term superphosphate
applications in New Zealand: 1. Phosphorus. J. Agric. Sci. (Camb.) 119:89-106.
Nuernberg, N.J.,J.E. Leal, and M.E.Summer, 1998. Evaluation of an anion-exchange
membrane for extracting plant available phosphorus in soils. Commun. Soil Sci.
Plant Anal.29: 467-479.
Oberson, A. and E.J. Joner. 2005. Microbial turnover of phosphorus in soil. In:
B.L.Turner, E. Frossard, D.S. Baldwin (eds). Organic phosphorus in the
environment , 1st edn. CABI Publishing, Cambridge, pp 133-164.
O’Halloran, I.P., R. G. Kachanoski and J.W.B. Stewart.1985. Spatial variability of soil
phosphorus as influenced by soil texture and management. Can. J. Soil Sci.
65:475-487
O’Halloran, I.P., W.J.B. Stewart and E. De Jong. 1987a. Changes in P forms and
availability as influenced by management practices. Plant Soil. 100:113-126.
O’Halloran, I.P., W.J.B. Stewart and R.G. Kachanoski. 1987b. Influence of texture and
management practices on the forms and distribution of soil phosphorus. Can. J.
Soil Sci. 67:147-163.
O’Halloran, I.P. 1993. Effect of tillage and fertilization on inorganic and organic soil
phosphorus. Can. J. Soil Sci. 73: 359-369.
O’Halloran, I.P. and A. Sigrist, 1993. Influence of incubating monocalcium phosphate
with liquid hog manure on inorganic phosphorus, organic phosphorus and
phosphorus availability in two Quebec soils. Can. J. Soil Sci. 73: 371-379.
Page 222
207
Olsen, S. R., C. V. Cole, F.S. Watanabe, and, L. A. Dean. 1954. Estimation of available
phosphorus in soils by extraction with sodium bicarbonate. US Department of
Agriculture, Washington, DC. Circ. 939.
Olsen, S.R., and L.E. Sommers. 1982. Phosphorus.pp.403-429. In A.L.Page et al. (ed.)
methods of soil analysis, Part 2. 2nd Ed. Am. Soc. Agronomy, Madison, WI.
OMAFRA (Ontario Ministry of Agriculture, Food and Rural Affairs), 2002. Agronomy
Guide for Field Crops, Publication 811, p. 300.
Oniani, O.G., M. Chater, and G.E.G. Mattingly. 1973. Some effects of fertilizers and
farmyard manure on the organic phosphorus in soils. J. Soil Sci. 24:1-9.
Ott, P. and H. Vogtmann. 1982. Composting Farmyard Manure. Basic Tech Ecol Farm.
Birkhauser Verlag, Basel, Switzerland. pp. 357-365.
Ozanne, P.G., D. J. Kirten, and T.C. Shaw. 1961. The loss of phosphorus from sandy
soils. Aust. J. Agric. Res. 12:409-423.
Parfitt, R.L.1978. Anion adsorption by soil and soil materials. Adv. Agron. 30:1-50.
Pautler, M.C. and J.T. Sims, 2000. Relationships between soil test phosphorus, soluble
phosphorus, and phosphorus saturation in Delaware soils. Soil Sci. Soc. Am. J.
64:765-773.
Pellerin, A., L.E. Parent, J. Fortin, C. Tremblay, L. Khiari and M. Giroux. 2006.
Environmental Mehlich-III soil phosphorus saturation indices for Quebec acid to
near neutral soils varying in texture and genesis. Can. J. Soil Sci. 86, 711-723.
Phillips, P.A., J.L.B. Culley, F.R. Hore, and N.K. Patni. 1981. Pollution potential and
corn yields from selected rates and timing of liquid manure applications.
Picone, L., I. Capozzi, E. Zamuner, E.Echeverria, and H. Saniz Rozas. 2007.
Transformaciones de fosforo en un mollisol bajo sistemas de labranza
contrastantes. Ciencia del Suelo 25(2) :99-107.
Page 223
208
Pierzynski, G.M. and T.J. Logan. 1993. Crop, soil, and management effects on
phosphorus soil test levels. J. Prod. Agric. 6:513-519.
Pote, D.H., T.C.Daniel, P.A. Moore, Jr., A.N. Sharpley, D.R. Edwards, and D.J. Nichols.
1995. Phosphorus: relating soil tests to runoff concentrations across five soil
series. Agronomy Abstracts, P. 294, Am. Soc. Agron., Madison, WI.
Pote, D. H., T. C. Daniel, A.N. Sharpley, P. A., Moore, Jr., D. R. Edwards, and D. J.
Nichols. 1996. Relating extractable soil phosphorus to phosphorus losses in
runoff. Soil Sci. Soc. Am. J. 60:855–859.
Pote, D.H., T.C. Daniel, D.J. Nichols, A.N. Sharpley, P.A. Moore, Jr., D.M. Miller, and
D.R. Edwards. 1999b. Relationship between phosphorus levels in three Ultisols
and phosphorus concentrations in runoff. J. Environ. Qual. 28:170-175.
Qian, S.S., P. Yangdong, and S.K. Ryan. "Soil total phosphorus threshold in the
Everglades: a Bayesian changepoint analysis for multinomial response
data."Ecological Indicators 4.1 (2004): 29-37.
Qian, P. and J. J. Schoenaru. 2000. Fractionation of P in soil as influenced by a single
addition of liquid swine manure. Can. J. Soil Sci. 80:561–566.
Qian, P. and J. J. Schoenaru and R.E. Karmanos. 1994. Simultaneous extraction of
available phosphorus and K with a new soil test: a modification of Kelowna
extraction. Commun. Soil Sci. Plant Anal. 25, 627-635.
Qian, P., J.J. Schoenaru, and W.Z. Huang. 1992. Use of ion exchange membranes in
routine soil testing. Commun. Soil Sci. Plant Anal. 23:1791-1804.
Racz, G.J. 1979. Release of P in organic soils under aerobic and anaerobic conditions.
Can. J. Soil Sci.59:337-339.
Rajan, S.S.S. and R.L. Fox. 1975. Phosphate adsorption by soils: ll. Reactions in
tropical acid soils. Soil Sci. Am. Proc. 39:846-851.
Page 224
209
Rao, S.M. and A. Sridharan. 1984. Mechanism of sulfate adsorption by Kaolinite. Clay
and Clay Minerals. 32:414-418.
Raven, K.P. and L.R. Hossner.1993. Phosphorus desorption quantity-intensity
relationships in soils. Soil Sci. Soc. Am. J. 57:1501-1508.
Reddy, D.D., A.S. Rao, and P.N. Takkar. 1999. Effects of repeated manure and fertilizer
phosphorus additions on soil phosphorus dynamics under a soybean wheat
rotation. Biol. Fertil. Soil 28:150-155.
Reddy, K.R., G.A. O’Connor, and P.M. Gale. 1998. Phosphorus sorption capacities of
wetland soils and stream sediments impacted by dairy effluent. J. Environ. Qual.
27:438-447.
Richards, J.E., T.E. Bates, and S.C. Sheppard. 1995. Changes in the forms and
distribution of soil phosphorus due to long-term crop production. Can. J. Soil. 75:
311-318.
Royer, I. 2003. High phosphorus soils: Management issues in eastern Canada.
Ryden, J.C. and P.F. Pratt. 1980. Phosphorus removal from wastewater, applied to
land. Hilgardia. 48:1-36.
Ryden, J.C., J.K. Syers, and J.R. Mclaughlin. 1977. Effects of ionic strength on
chemisorption and potential-determining sorption of phosphate. J. Soil Sci.
28:62-71.
Rynk, R., M.Van de kamp, G. B. Wilson, M.E. Singley, T.L. Richard, and J.J. Kolega.
1992. On-Farm composting Handbook. Northeast Regional Agric. Eng. Serv.
(NRAES)-54. Ithaca, New York.
Saggar, S., M.J. Hedley, and R.E. White.1990. A simplified resin membrane technique
for extracting phosphorus from soils. Fert. Res. 24:173-180.
Saggar, S., M.J. Hedley, R.E. White, P.E.H. Gregg, K.W.Perrot, and I.S.Cornforth.
1992. Development and evaluation of an improved soil test for phosphorus. 2.
Page 225
210
comparison of the Olsen and mixed cation-anion exchange resin tests for
predicting the yield of ryegrass growth in pots. Fert.Res.33:135-144.
Saleque, M.A., U.A. Naher, A. Islam, A.B.M.B.U. Pathan, A.T.M.S. Hossain, and C.A.
Meisner. 2004. Inorganic and organic phosphorus fertilizer effects on the
phosphorus fractionation in wetland rice soils. Soil Sci. Soc. Am. J. 68:1635-
1644.
Sample, E.C., F.E. Khasawneh, E.J. Kamprath(e), P.A. Sanchez, K.D. Shepherd, M.J.
Soule, F.M. Place, R.J. Buresh, and A.M.N. Isak. 1980. Reactions of phosphate
fertilizers in soils. In The Role of Phosphorus in Agriculture. (F. E. Khasawneh, E.
C. Sample and E. J. Kamprath, ed.). Madison, Wisconsin, USA: American
Society of Agronomy).
Savant, N.K. and G.J. Racz.1973. Reaction products of applied pyrophosphates in
some Manitoba soils. Can. J. Soil Sci. 53:111-117.
Schmidt, J.P., S.W. Buol, and E.J.Kamprath.1996. Soil P dynamics during seventeen
years of continuous cultivation: Fractionation analysis. Soil Sci. Soc. Am.J.60:
1168-1172.
Schoenau, J.J. and W.Z. Huang. 1991. Anion exchange membrane, water and sodium
bicarbonate extractions as soil tests for phosphorus. Commun. Soil Sci. Plant
Anal. 22: 465-492.
Schoenau, J.J., J.W. B. Stewart, and J.R. Bettany. 1989. Forms and cycling of
phosphorus in prairie and boreal forest soils. Biogeochemistry. 8:223-237.
Schoumans, O.F. and P. Groenendijk. 2000. Modelling soil phosphorus levels and
phosphorus leaching from agricultural land in the Netherlands.J. Environ. Qual.
29:111-116.
Schreier, H., R. Bestbeir and G. Derksen. 2003. Agricultural nutrient management
trends in the Lower Fraser Valley of B.C. (Based on Agricultural Census 1991-
Page 226
211
2001). CD from Institute for Resources and Environment, The Univ. of British
Columbia, Vancouver.
Schroeder, P.D., D.E. Radcliffe, M.L. Cabrera, and C.D. Belew. 2004. Relationship
between soil test phosphorus and phosphorus in runoff: Effects of soil series
variability. J. Environ. Qual. 33:1452-1463.
Self-Davis, M.L., P.A. Moore, and B.C. Joern. 2000. Determination of water and/or
dilute salt-extractable P. pp.22-26. In G.M. Pierzynski (ed.) Methods of
phosphorus analysis for soils, sediments, residuals and waters. Southern
Cooperative Series Bulletin no. 396. North Carolina State University.
Selles, F., B.G. McConkey, and C.A. Campbell. 1995. Distribution and forms of P under
cultivator- and Zero-tillage for continuous and fallow wheat cropping systems in
the semi-arid Canadian prairies. Soil Till Res. 51:47-59.
Shafqat, M.N., G.M. Pierzynski, and K.Xia. 2009. Phosphorus source effects on soil
organic phosphorus: A 31P NMR study. Communications in Soil Science and
Plant Analysis.Volume 40:11-12 (2009): 1722-1746.
Sharpley, A.N. and J.K. Syers. 1979. Loss of nitrogen and phosphorus in tile drainage
as influenced by urea application and grazing animals. New Zealand J.
Agriccultural Research. 22:127-131.
Sharpley, A.N. and S.J. Smith. 1983. Distribution of phosphorus forms in virgin and
cultivated soil and potential erosion losses. Soil Sci. Soc. Am. J. 47:581-586.
Sharpley, A.N., S.J. Smith, B.A. Stewart, and A.C. Mathers. 1984a. Forms of
phosphorus in soil receiving cattle feedlot waste. J. Environ. Qual. 13:211-215.
Sharpley, A.N.1985. Depth of surface soil-runoff interaction as affected by rainfall, soil
slope, and management. Soil Sci. Soc. Am. J. 49:1010-1015.
Sharpley, A.N.1985. Phosphorus cycling in unfertilized and fertilized agricultural soils.
Soil Sci. Soc. Am. J. 49:905-911.
Page 227
212
Sharpley, A.N., S.J. Smith, J.R. Williams, O.R. Jones, and G.A. Coleman. 1991. Water
quality impacts associated with sorghum culture in the Southern Plains. J.
Environ. Qual. 20:239-244.
Sharpley, A.N. 1991. Soil phosphorus extracted by iron-aluminum-oxide impregnated
filter paper. Soil Sci. Soc. Am. J. 55:1038-1041.
Sharpley, A.N. 1993. An innovative approach to estimate bioavailable phosphorus in
agricultural runoff using iron oxide-impregnated paper. J. Environ. Qual. 22:597-
601.
Sharpley, A.N., S.J. Smith, and W.R. Bain. 1993. Nitrogen and phosphorus fate from
long-term poultry litter applications to Oklahoma soils. Soil Sci. Soc. Am. J.
57:1131-1137.
Sharpley A.N, S.C. Chapra, R Wedepohl, J.T. Sims, T.C. Daniel, and, K.R. Reddy.
1994. Managing agricultural phosphorus for protection 139 of surface waters:
issues and options. J. Environ. Qual. 23:437-451.
Sharpley, A.N., J.T. Sims, and G.M. Pierzynski. 1994a. Innovative soil phosphorus
indices: Assessing inorganic phosphorus.P.115-142. In J. Havlin, J. Jacobsen, P.
Fixen, and G. Hergert (ed.) New directions in soil testing for nitrogen, phosphorus
and potassium. Soil Sci.Soc. Am, Madison, WI.
Sharpley, A.N. 1995. Identifying sites vulnerable to phosphorus loss on agricultural
runoff. J. Environ. Qual. 24:947-951.
Sharpley, A.N. and S.J. Smith. 1995. Nitrogen and phosphorus forms in soils receiving
manure. Soil Sci. 159:253-258.
Sharpley, A.N. 1996. Availability of residual phosphorus in manured soils. Soil Sci. Soc.
Am. J. 60:1459-1466.
Sharpley, A.N., T.C. Daniel, J.T Sims, and D.H. Pote. 1996. Determining
environmentally sound soil phosphorus levels. J. Soil water Conserv. 51:160-
166.
Page 228
213
Sharpley, A.N. and I. Sisak. 1997. Differential availability of manure and inorganic
sources of phosphorus in soil. Soil Sci. Soc. Am. J. 61:1503-1508.
Sharpley, A.N., J.J. Meisinger, A. Breeuwsma, J.T. Sims, T.C. Daniel and J.S.
Schepers. 1998. Impacts of animal manure management on ground and surface
water quality. Pp. 173-242. In J. Hatfield (ed) Effective management of animal
waste as a soil resource. Arbor Press, Chelsea, MI.
Sharpley, A.N., T. Daniel, T. Sims, J. Lemunyon, R. Stevens, and R. Parry. 1999.
Agriculture phosphorus and eutrophication. ARS-149, U.S. Dep. of Agric.,
Washington DC.
Sharpley, A.N. 2000. Phosphorus availability, pp. D-18-D38, In M.E.Summer (ed.),
Handbook of soil Science (New York: CRC Press).
Sharpley, A.N. and B. Moyer, 2000. Phosphorus forms in manure and compost and
their release during simulated rainfall. J. Environ. Qual. 29:1462-1469.
Sharpley, A.N., B. Foy, and P. Withers. 2000. Practical and innovative measures for the
control of agricultural phosphorus losses to water: an overview. J. Environ.
Qual.29:1-9.
Sharpley, A.N., J.L. Weld, D.B. Beegle, P.J.A. Kleinman, W.J. Gburek, P.A. Moore, Jr.,
and G. Mullins. 2003. Development of phosphorus indices for nutrient
management planning strategies in the United States. J. Soil and water
conservation 58:137-152.
Sharpley, A.N., R.W McDowell, and P.J.A. Kleinman. 2004. Amounts, forms, and
solubility of phosphorus in soils receiving manures. Soil Sci. Soc. Am. J.
68:2048-2057.
Sharpley, A.N. 2008. Bioavailable phosphorus in soil. pp. 37-42. In G.M. Pierzynski
and J.L. Kovar (eds.), Methods for Phosphorus Analysis for Soils, Sediments,
Residuals, and Waters. Southern Cooperative Series Bulletin.
Page 229
214
Sibbesen, E., 1977. A simple ion-exchange resin procedure for extracting plant-
available elements from soil. Plant Soil 46: 665-669.
Sibbesen, E., 1978. An investigation of the anion-exchange resin method for soil
phosphate extraction. Plant Soil 50:305-321.
Sibbesen, E.1983. Phosphate soil tests and their suitability to assess the phosphate
status of soil. J. Sci. Food Agric. 34: 1368-1374.
Sibbesen, E. and A.N. Sharpley, 1997. Setting and Justifying Upper Critical Limits for
Phosphorus in Soils. In: Phosphorus Loss from Soil to Water, Tunney, H. et al.
(Ed.). CAB International. Press, Cambridge, UK., pp: 151-176.
Simard, R.R., D. Cluis, G. Gangbazo, and S. Beauchemin. 1995. Phosphorus status of
forest and agricultural soils from a watershed of high density. J. Environ. Quality
24:1010-1017.
Simard, R.R., S. Beauchemin, I. Royer, and G.Barnett. 2001. Long-term manure impact
on soil nutrient status and surface water quality in Proc. Livestock-Options for the
future. Winnipeg, MB.
Sims, J.T. (ed.) 1998. Soil testing for phosphorus: Environmental uses and implications.
So. Coop. Series Bull. No.389. Univ. Delaware, Newark, DE.
Sims, J.T., R.R. Simard, and B.C. Joern. 1998. Phosphorus losses in agricultural
drainage: Historical prespective and current research. J. Environ. Quality.
27:277-293.
Sims, J. T., A. C. Edwards, O. F. Schoumans, and R. R. Simard. 2000. Integrating soil
phosphorus testing into environmentally based agricultural management
practices. J. Environ. Quality. 29:60-71
Sims, J. T. 2000a. Soil test phosphorus: Olsen P. pp 20–21 In G. M. Pierzynski, ed.
Methods of phosphorus analysis for soils, sediments, residuals and waters.
Southern Cooperative Series Bull. No. 396, Kansas State University, Manhttan,
KS.
Page 230
215
Sims, J.T., R.O. Maguire, A.B. Leytem, K.L. Gartley, and M.C. Pautler. 2002. Evaluation
of Mehlich-3-P as an agri-environmental soil phosphorus test for the mid-Atlantic
USA. Soil Sci. Soc. Am. j. 66: 2016-2032.
Sissingh, H. A. "Analytical technique of the Pw method, used for the assessment of the
phosphate status of arable soils in the Netherlands." Plant and Soil 34.1 (1971):
483-486.
Smith, D.R., P.A. Moore, Jr., C.L. Griffis, T.C. Daniel, D.R. Edwards, and D.L. Boothe.
2001b. Effects of alum and aluminum chloride on phosphorus runoff from swine
manure. J. Environ. Qual. 30:992-998.
Somasiri, L.L.W. and A.C. Edwards. 1992. An ion exchange resin method for nutrient
extraction of agricultural advisory soil samples. Commun. Soil Sci. Plant Anal 23:
645-657.
Sommerfeldt, T. G. and C. Chang. 1985. Changes in soil properties under annual
applications of feedlot manure and different tillage practices. Soil Sci. Soc. Am. J.
49: 983-987.
Sommerfeldt, T.G., C. Chang, and T. Entz.1988. Long-term annual manure applications
increase soil organic matter and nitrogen, and decrease carbon to nitrogen ratio.
Soil Sci. Soc. Am. J. 52:1668-1672.
Sommers, L. E., and A. L. Sutton. 1980. Use of waste materials as sources of
phosphorus. p. 515-544. In: F. E. Khasawneh et al. (ed.) The role of phosphorus
in agriculture. ASA, CSSA, and SSSA, Madison, WI.
Song, C. X.Z. Han, C. Tang. 2007. Changes in phosphorus fractions, sorption and
release in Udic Mollisols under different ecosystems. Biology and Fertility of soils.
44:37-47.
Sotomayor-Ramirez, D., G.A. Martinez, R.S. Mylavarapu, O. Santana, and J.L.
Guzman. 2004. Phosphorus soil tests for environmental assessment in
subtropical soils. Commun. Soil Sci. Plant Anal. 35:1485-1503.
Page 231
216
Steffens, D. 1994. Phosphorus release kinetics and extractable phosphorus after long-
term fertilization. Soil Sci. Soc. Am. J. 58:1702-1708.
Stevenson, F.J. 1994. Humus chemistry: Genetics, composition, reactions. pp 113-140.
john Wiley and Sons, New York.
Stevenson, F.J. 1986. Cycles of soil C, N, P, S, Micronutrients. John Wiley & Sons, New
York, pp 231-284.
Stevenson, F.J. and M.A. Cole.1986. The phosphorus cycle. In cycles of soil:carbon,
nitrogen, phosphorus, sulfur, micronutrients, pp. 231-284. John Wiley and sons,
New york, NY.
Stewart, J.W.B., M.J.Hedley, and B.S. Chauhan. 1980. The immobilization,
mineralization and redistribution of phosphorus in soils. Western Canada
Phosphate Symposium. Proceedings of the Alberta Soil Sci. Workshop, March,
1980, pp. 276-306.
Stewart, J.W.B., and H. Tiessen. 1987. Dynamics of soil organic phosphorus.
Biogeochem. 4: 41-60.
Subba Rao, A., R.K. Sammi, and P.N. Takkar. 1995. Phosphorus management-a key to
boost productivity of soybean-wheat cropping system on swell-shrink soils. Fert
News 40:87-95.
Sui, Y., M. L. Thompson, and C.W. Mizc.1999. Redistribution of biosolids derived total P
applied to a Mollisol. J. Environ. Qual. 28:1068-1074.
Sutton, A.L., D.W. Nelson, D.T. Kelly, and D.L. Hill. 1986. Comparison of solid vs. liquid
dairy manure application on corn yield and soil composition. J.Environ. Qual. Vol.
5:4.
Swenson, R.M., C.V. Cole, and D.H. Sieling.1949. Fixation of phosphate by iron and
aluminum and replacement by organic and inorganic anions. Soil Sci. 67:3-22.
Page 232
217
Syers, J. K., G.W. Smillie, and J.D.H. Williams. 1972. Calcium fluoride formation during
extraction of calcareous soils with fluoride: I. Implication to inorganic P
fractionation schemes. Soil Sci. Soc. Am. Proc. 36:20-26.
Syers, J.K. and D. Curtin. 1989. Inorganic reactions controlling phosphorus cycling. P.
17-29. In H. Tiessen (ed.) Phosphorus cycles in terrestrial and aquatic
ecosystems. Saskachewan Institute of Pedology, Saskatoon, Canada.
Tabbara, H. 2003. Phosphorus loss to runoff water 24-hours after application of liquid
swine manure or fertilizer. J. Environ.qual. 32:1044-1052
Tan, C. S. and T. Q. Zhang. 2011. Surface and sub-surface tile phosphorus losses
under regular free drainage and controlled drainage with sub-irrigation systems.
Can. J. Soil Sci. 91: 349-359.
Tang, J., A. Leung, C.Leung, and B.L. Lim. 2006. Hydrolysis of precipitated phytate by
three distinct families of phytases. Soil Biol. Biochem. 38: 1316-1324.
Tate, R. and R.H. Newman. 1982. Phosphorus fractions of a climosequence of soils in
New Zealand tussock grassland. Soil Biol. Biochem. 14:191-196.
Thomas, G. W., "Soil pH and soil acidity." Methods of soil analysis. Part 3-chemical
methods. (1996): 475-490.
Thomas, R., R.W. Sheard, and I.P. Moyer.1967. Comparison of conventional and
automated procedures for nitrogen, phosphorus and potassium analysis of plant
material using a single digest. Agron. J. 99:240-243.
Tiessen H, J. W. B. Stewart, and J. Q. Moir. 1983. Changes in organic and inorganic
phosphorus composition of two grassland soils and their particle size fractions
during 60-90 years of cultivation. J. Soil Sci. 34: 815-823.
Tiessen, H., J. W. B. Stewart, and C. V. Cole. 1984. Pathways of phosphorus
transformation in soils of differing pedogenesis Soil Sci. Soc. Am. J. 48:853-858.
Page 233
218
Tiessen, H. and J.W.B. Stewart. 1985. The biogeochemistry of soil phosphorus. In:
Caldwell DE et al. (eds). Planetary ecology. Van Norstrand-Reinhold, New York.
Pp 463-472.
Tiessen, H. and J.O. Moir. 1993. Characterization of available P by sequential
extraction. pp. 75-86. In M.R. Carter (ed) Soil sampling and methods of analysis.
CRC Press, Boca Raton, FL.
Tiessen, H., P. Chacon, and E. Cuevas.1994. Phosphorus and nitrogen status in soil
and vegetation along a toposequence of dystrophic rainforests on the upper Rio
Negro. Oecologia. 99:145-150.
Tiessen, H. 2008. Phosphorus in the global environment. In White, P.J., J.P. Hammond,
(eds.) Ecophysiology of Plant-Phosphorus Interactions. Springer, New York, pp
1–8.
Tisdale, S.L., W.L. Nelson, J.D. Beaton, and J.L. Havlin. 1993. Soil and fertilizer
phosphorus. pp. 176-229. In Soil Fertility and fertilizers, 5th ed. Macmillan Publ.,
New York.
Toor, G.S. and G.S. Bahl. 1997. Effect of solitary and integrated use of poultry manure
and fertilizer phosphorus on the dynamics of P availability in different soils.
Bioresour. Technol. 62:25-28.
Torrent, J. and A. Delgado. 2001. Using phosphorus concentration in the soil solution to
predict phosphorus desorption to water. J. Environ. Qual. 30:1829-1835.
Tran, T.S. and A. N’dayegamiye. 1995. Long- term effects of fertilizers and manure
application on the forms and availability of soil phosphorus. Can. J. Soil Sci. pp
281-285.
Tran, T.S., R.R. Simard, and J.C. Fardeau. 1992. A comparison of four resin extraction
and 32P isotopic exchange for the assessment of plant-available P. Can. J. Soil
Sci. 72: 281-294.
Page 234
219
Tunney, H. and B. Pommel.1987. Phosphorus uptake by ryegrass from monocalcium
phosphate and pig manure on two soils in pots. Ir J. Agric Res 26:189–198.
Turner, B.L. and A.B. Leytem. 2004. Phosphorus compounds in sequential extracts of
animal manures: chemical speciation and a novel fractionation procedure.
Environ Sci Technol 38: 6101-6108
Turner, B.L., L.M. Condron, S.J. Richardson, D.A. Peltzer, and V.J. Allison. 2007. Soil
organic phosphorus transformations during pedogenesis. Ecosystems 10:1166-
1181.
USEPA: US Environmental Protection Agency. 1996. Environmental indicators of water
quality in the United States. Washington DC.
USEPA: US Environmental Protection Agency. 2000. Nutrient Criteria Technical
Guidance Manual: Rivers and Streams. EPA-822-B-00-002. Office of Water and
Office of Science and Technology, United States Environmental Protection
Agency. Washington DC. 152.
UUSITALO, R., M. YLI-HALLA. 1999. Estimating errors associated with extracting
phosphorus using iron oxide and resin methods. J. Environ. Qual. 28(6): 1891-
1897.
Van der Paauw, F. 1971.An effective water extraction method for the determination of
plant available soil phosphorus. Plant and Soil, 34: 467-481.
Van Leirop, W. 1988. Determination of available P in acid and calcareous soils with
Kelowna multiple-element extractant. Soil Sci. 146: 284-291.
Verma, S., S.K. Subehia, and S.P. Sharma. 2005. Phosphorus fractions in an acid soil
continuously fertilized with mineral and organic fertilizers. Biol Fertil Soils 41:295-
300.
Wager, B. I. and J. W. B. Stewart, and, J. O. Moir. 1986. Changes with time in the
formand availability of fertilizer phosphorus on Chernozemic soils. Can. J. Soil
Sci. 66:105-119.
Page 235
220
Waldrip-Dail, H., Z. He, M.S. Erich, and C.W. Honeycutt. 2009. Soil phosphorus
dynamics in response to poultry manure amendment. Soil Sci. 174:195–201
Wandruszka, R. 2006. Phosphorus retention in calcareous soils and the effect of
organic matter on its mobility. Geochem. Trans. 7:1-8.
Wang, X., D.W.Lester, C.N. Guppy, P.V. Lockwood, and C.Tang. 2007. Changes in
phosphorus fractions at various soil depths following long-term P fertilizer
application on a Black Vertisol from south-eastern Queensland. Australian
Journal of Soil Research 45:524-532.
Wang, Y.T., T.Q. Zhang, Q.C. Hu, C.S. Tan, I. O’Halloran, C.F. Drury, K. Reid, B.L. Ma,
B. Ball-Coelho, J. Lauzon, W.D. Reynolds, and T. Welacky. 2010. Estimating
dissolved phosphorus concentration in surface runoff water from major Ontario
soils. J. Environ. Qual. 39:1771-1781.
Wang, Y.T., T.Q. Zhang, Q.C. Hu, I. O’Halloran, C.S. Tan, and K. Reid. 2012. Soil tests
as risk indicators for leaching of dissolved phosphorus from agricultural soils in
Ontario. Soil Sci. Soc. Ame. J. 76:220-229.
Watanabe, F. S. and S.R. Olsen. 1965. Test of an ascorbic acid method for determining
phosphorus in water and NaHCO3 extracts from soil. Soil Sci. Soc. Am. Proc.
29:677-678.
Whalen, J. K., C. Chang, G.W. Clayton, and J.D. Carefoot. 2000. Cattle manure
amendment can increase pH of acid soils. Soil Sci. Soc. Am. J., 64: 963-966.
Whalen, J. K. and C. Chang. 2001. Phosphorus accumulation in cultivated soils from
longterm annual applications of cattle feedlot manure. J. Environ. Qual. 30: 229-
237.
Whalen, J. K. and C. Chang. 2001. Phosphorus accumulation in cultivated soils from
long-term annual application of cattle feedlot manure. J. Environ. Qual. 30: 229-
237.
Page 236
221
Williams, J.D.H. and T.W. Walker. 1967. Fractionation of soil inorganic phosphate by a
modification of Chang and Jackson’s procedure. Soil Sci. Soc. Am. Proc. 31:736-
739.
Williams, J.D.H. and T.W. Walker. 1969. Fractionation of phosphate in a maturity
sequence of New Zealand basaltic soil profiles: 2. Soil Sci. 107, 213-219.
Williams, J. D. H., J. K. Syers, R. F. Harris, and D. E. Armstrong.1971. Fractionation of
inorganic phosphate in calcareous lake sediments. Soil Sci. Soc. Am. Proc. 35:
250-255.
Williams, J.D.H., T. Mayer, and J.O. Nriagu. 1980. Extractability of phosphorus from
phosphate minerals common in soils and sediments. Soil Sci. Soc. Am. Proc.
35:250-255.
Wolf, A. M. and D. E. Baker. 1985. Comparisons of soil test phosphorus by Olsen, Bray-
PI. Mehlich I. and Mehlich 111 methods. Commun. Soil Sci. Plant Anal.16:467-
484.
Xie, R. J., J. W. Fyles, A.F. MacKenzie, and I.P. O’Halloran. 1991. Lignosulphate
retention in a clay soil: causal modeling. Soil Sci. Soc. Am. J. 55:711-716.
Yang, J.E., E.O. Skogley, S.J. Georgitis, B.F. Schaff, and A.H. Ferguson. 1991.
Phytoavailability soil test: Development and verification of theory. Soil Sci. Soc.
Am. J. 55:1358-1365.
Yang, J.E., C.A.Jones, H.J. Kim, and J.S. Jacobsen. 2002. Soil inorganic phosphorus
fractions and Olsen-P in phosphorus-responsive calcareous soils. Effects of
feretilizer amount and incubation time. Commun. Soil Sci. Plant Anal. 33:855-
871.
Ylivainio, K., R. Uusitalo, and E. Turtola. 2008. Meat bone meal and fox manure as P
sources for ryegrass (Lolium multiflorum) grown on a limed soil. Nutr. Cycl.
Agroecosyst. 81:267–278
Page 237
222
Zamuner E.C. L.I. Picone, and A.B. Diez. 2012. Effect of lonr-term phosphorus
fertilization on soil phosphorus fractions. Spanish J.of Soil Sci. Volume 2: 50-61.
Zhang, T. Q. and A.F. MacKenzie. 1997a. Changes of soil phosphorous fractions under
long-term monoculture corn (Zea mays L.). Soil Sci. Soc. Am. J. 61:485-493.
Zhang, T.Q. and A.F. MacKenzie. 1997b. Changes of phosphorous fractions under
continuous corn production in a temperate clay soil. Plant and Soil 192:133-139.
Zhang, T.Q., A.F. Mackenzie, B.C. Liang, and C.F. Drury. 2004. Soil test phosphorus
and phosphorus fractions with long-term phosphorus addition and depletion. Soil
Sci. Soc. Amer. J. 68:519-528.
Zhang, T.Q., A.F. McKenzie, B.C. Liang, and C.F. Drury. 2004. Soil test phosphorus
and phosphorus fractions with long-term phosphorus addition and depletion. Soil
Sci. Soc. Am. J. 68:519-528.
Zhang, Q., G.H. Wang, Y.K. Feng, Q.Z. Sun, C. Witt and A. Dobermann. 2006.
Changes in soil phosphorus fractions in a calcareous paddy soil under intensive
rice cropping. Plant Soil. 288: 141-154.
Zhang, T.Q. Chandra A. Madramootoo, and C.S. Tan. 2009. What are the P losses to
tile drains? Great Lakes Phosphorus Forum. Windsor, ON, Canada, July 28-31.
Zheng, Z., R. R. Simard, J. Lafond, and L. E. Parent. 2001. Changes in phosphorus
fractions of a Humic Gleysol as influenced by cropping systems and nutrient
sources. Can. J. Soil Sci. 81:175-183.
Zheng, Z., R. R. Simard, J. Lafond, and L. E. Parent. 2002. Pathways of soil
phosphorus transformation after eight years of cultivation under contrasting
cropping practices Soil Sci. Soc. Am. J. 66: 999-1007.
Zheng, Z., R.R. Simard and L.E. Parent. 2003. Anion Exchange and Mehlich-III
phosphorus in Humaquepts varying in Clay Content. Soil Sci. Soc. Am. J. 67:
1287-1295.