COSMOS, Vol. 3, No. 1 (2007) 103–124 c World Scientific Publishing Company CHEMICAL INTERACTIONS AT NOBLE METAL NANOPARTICLE SURFACES — CATALYSIS, SENSORS AND DEVICES A. SREEKUMARAN NAIR, RENJIS T. TOM, V. R. RAJEEV KUMAR, C. SUBRAMANIAM and T. PRADEEP ∗ DST Unit on Nanoscience, Department of Chemistry and Sophisticated Analytical Instrument Facility Indian Institute of Technology, Madras Chennai-600036, India ∗ [email protected]Received 11 November 2007 In this paper, a summary of some of the recent research efforts in our laboratory on chem- ical interactions at noble metal nanoparticle surfaces is presented. The article is divided into five sections, detailing with (i) interactions of simple halocarbons with gold and sil- ver nanoparticle surfaces at room temperature by a new chemistry and the exploitation of this chemistry in the extraction of pesticides from drinking water, (ii) interaction of biologically important proteins such as Cyt c, hemoglobin and myoglobin as well as a model system, hemin with gold and silver nanoparticles and nanorods forming nano–bio conjugates and their surface binding chemistry, (iii) formation of polymer–nano com- posites with tunable optical properties and temperature sensing characteristics by single and multi-step methodologies, (iv) nanomaterials-based flow sensors and (v) composites of noble metal nanoparticles and metallic carbon nanotubes showing visible fluorescence induced by metal–semiconductor transition. Keywords : Nanomaterials; halocarbons; nano–bio conjugates; microgels; flow sensors; carbon nanotubes. 1. Introduction Research on nanomaterials has evinced keen interest in recent years because of the new opportunities they present in nanocomposites, catalysis, environmental reme- diation and sensing. 1–5 Metal nanoparticles have potential applications in catalysis because of their large surface to volume ratio and unusual chemical reactivity. 6 Metal nanoparticles of different shapes could catalyze the reactions with differ- ent efficiencies because nanocrystals of different shapes represent various facets. ∗ Corresponding author. 103
CHEMICAL INTERACTIONS AT NOBLE METALNANOPARTICLE SURFACES — CATALYSIS,
SENSORS AND DEVICES
A. SREEKUMARAN NAIR, RENJIS T. TOM, V. R. RAJEEV KUMAR,C. SUBRAMANIAM and T. PRADEEP∗
DST Unit on Nanoscience, Department of Chemistryand Sophisticated Analytical Instrument Facility
Indian Institute of Technology, MadrasChennai-600036, India∗[email protected]
Received 11 November 2007
In this paper, a summary of some of the recent research efforts in our laboratory on chem-ical interactions at noble metal nanoparticle surfaces is presented. The article is dividedinto five sections, detailing with (i) interactions of simple halocarbons with gold and sil-ver nanoparticle surfaces at room temperature by a new chemistry and the exploitationof this chemistry in the extraction of pesticides from drinking water, (ii) interaction ofbiologically important proteins such as Cyt c, hemoglobin and myoglobin as well as amodel system, hemin with gold and silver nanoparticles and nanorods forming nano–bioconjugates and their surface binding chemistry, (iii) formation of polymer–nano com-posites with tunable optical properties and temperature sensing characteristics by singleand multi-step methodologies, (iv) nanomaterials-based flow sensors and (v) compositesof noble metal nanoparticles and metallic carbon nanotubes showing visible fluorescenceinduced by metal–semiconductor transition.
Research on nanomaterials has evinced keen interest in recent years because of thenew opportunities they present in nanocomposites, catalysis, environmental reme-diation and sensing.1–5 Metal nanoparticles have potential applications in catalysisbecause of their large surface to volume ratio and unusual chemical reactivity.6
Metal nanoparticles of different shapes could catalyze the reactions with differ-ent efficiencies because nanocrystals of different shapes represent various facets.
∗Corresponding author.
103
104 A. S. Nair et al.
Nanoparticles of silver, gold, copper, iron and its oxides, palladium and platinumhave found applications in catalyzing reactions,7–11 which offer immense scope forgreen chemistry. Iron and its oxide nanoparticles are excellent materials for environ-mental remediation.4 Nanoscale materials are used as sorbents for contaminants, innanofiltration and in reactive membranes.12 The use of metal nanoparticles in sens-ing could bring about a revolution in biology, healthcare, military and day-to-daylife.13
In this paper, we present various aspects of our studies on the chemical inter-actions at noble metal nanoparticle surfaces, touching upon (i) the investigation ofthe chemical reactivity of Au and Ag nanoparticles towards simple halocarbons by anew chemistry14–16 and its extension in achieving the removal of common pesticidesfrom drinking water,17,18 (ii) the immobilization of biologically important proteinson nanosurfaces and their surface binding chemistry,19,20 (iii) fabrication of polymerpolymer–nano composites by single-step methodologies such as polymerization ofmolecules on nanosurfaces21 and multi-step strategies,22–24 (iv) fabrication of flowsensors from metal nanoparticles25,26 and (v) formation of composites from single-walled carbon nanotubes (SWNT) and noble metal nanoparticles.27 Simple halo-carbons, which pose severe environmental hazards could be degraded by Au andAg nanoparticles to metal halides and carbon at room temperature.14 The samechemistry was used as a methodology for making oxide nanobubbles15 from core–shell nanoparticles and also to investigate the porosity16 of core–shell nanosystems.The interaction of biologically important proteins such as cytochrome c (Cyt c),myoglobin (Mb) and hemoglobin (Hb) with Au and Ag nanostructures leads tothe formation of bio–nano conjugates.19,20 We have succeeded in bringing aboutthe polymerization of certain molecules such as benzylthiocyanate on nanoparticlesurfaces21 resulting in polymer–nano composites. Temperature sensitive poly (N-isopropylacrylamide)-capped smart Au nanogels were recently synthesized.22 Goldnanorods were grown in microgels, which respond to temperature and pH changes inthe environment.23 Poly (o-toluidine) capped Au nanoparticles were synthesized bya one-pot methodology and the utility of the material in pH sensing was explored.24
An array of Au nanoparticles on conducting glass surfaces was fabricated, whichshowed excellent flow sensing characteristics.25,26 Also, composites of Au and Agnanostructures with carbon nanotubes showed new and exciting phenomena.27 Wewill illustrate more detail in the following section.
2. Experimental
Syntheses of citrate-capped Au and Ag nanoparticles and Au nanorods; methodolo-gies for getting nano–bio composites of Cyt c, myoglobin, hemoglobin and heminwith Au and Ag nanoparticles and Au nanorods, polymer–nano composites by sin-gle and multi-step processes, fabrication of nanoparticles on conducting glass sur-faces for flow sensors, the formation of nanoparticles-nanotubes composites; and theexperimental methodology associated with each one of these studies are described
Chemical Interactions at Noble Metal Nanoparticle Surfaces 105
in detail in the cited references. Characterization of the above nanomaterialsinvolved UV–visible spectroscopy (Perkin–Elmer Lambda 25), infrared spectroscopy(Perkin–Elmer Spectrum One), fluorescence spectroscopy (Hitachi F-4500 spec-trofluorimeter and Jobin–Vyon fluorolog instrument), Raman spectroscopy (Con-focal Raman spectrometer CRM 200 of Witec), matrix assisted laser desorptionionization (MALDI) mass spectrometry (Voyager DE PRO Biospectrometry Work-station of Applied Biosystems), transmission electron microscopy (JEOL 3010 UHRoperating at 300 kV), and AFM (CRM 200 of Witec with Alpha SNOM). Samplesof extracted metallic SWNT (mSWNT), Au–mSWNT composite and Au–SWNTcomposites were investigated through point-contact current imaging-atomic forcemicroscopy (PCI-AFM). As-received SWNT samples were thoroughly cleaned toremove impurities. PCI-AFM measurements were done at several places on eachof these samples and also across several samples to confirm the authenticity andreliability of the data reported. In case of pure extracted mSWNTs, the samplewas drop casted on a freshly cleaved mica surface and allowed to dry in a vacuumdesiccator. For composite samples, the material was lifted from the aqueous–airinterface (after evaporation of the organic layer) and drop cast on the mica surface.This was also subsequently dried in a vacuum desiccator. Half of the dried sampleswere masked using a clean cover glass slip and placed inside the thermal evaporationchamber. This chamber consists of a resistive heating wire on which a piece of puregold metal was placed. The entire chamber was pumped using a turbo–molecularpump to a vacuum of 10−6 torr. A quartz crystal plate interfaced to a microbalanceunit was held at the same level as the sample, to allow monitoring of the amountand thickness of the gold layer deposited. After pumping the system to vacuum,the evaporation of the gold was carried out by increasing the current through theresistive wire. This causes the gold to evaporate and deposit all around the evap-oration chamber, including the unmasked portion of the sample. The evaporationwas carried out till a gold pad thickness of 30–40nm was achieved on the sample,which was monitored using the quartz crystal. The evaporation was then stoppedand the chamber was brought slowly to room temperature with constant pumping.Finally, the samples were removed from the chamber, the mask was lifted carefullyand the samples were preserved until further use.
PCI-AFM measurements were carried out on a JEOL JSPM-4210 instrumentequipped with two function generators (WF 1946, NF Corporation). The I–V char-acteristics along the long axis of the nanotube composite were measured usingPt-coated conductive cantilevers. From the large area topographic image, it wasensured that the tubes selected for I–V measurements were indeed in contact withthe gold electrode. The bias voltage was applied on the gold electrode and the can-tilever was grounded. The entire experiment was carried out in a housing purgedwith N2 gas to minimize the effects of humidity. The I–V data corresponds to thepoint of contact which reflects the local symmetry. The PCI-AFM image was con-structed for 128 × 128 pixels with topographic and I–V characteristics acquiredsimultaneously.
106 A. S. Nair et al.
3. Results and Discussion
3.1. Interaction of halocarbons with metal nanoparticle
surfaces — a novel chemistry for environmental remediation
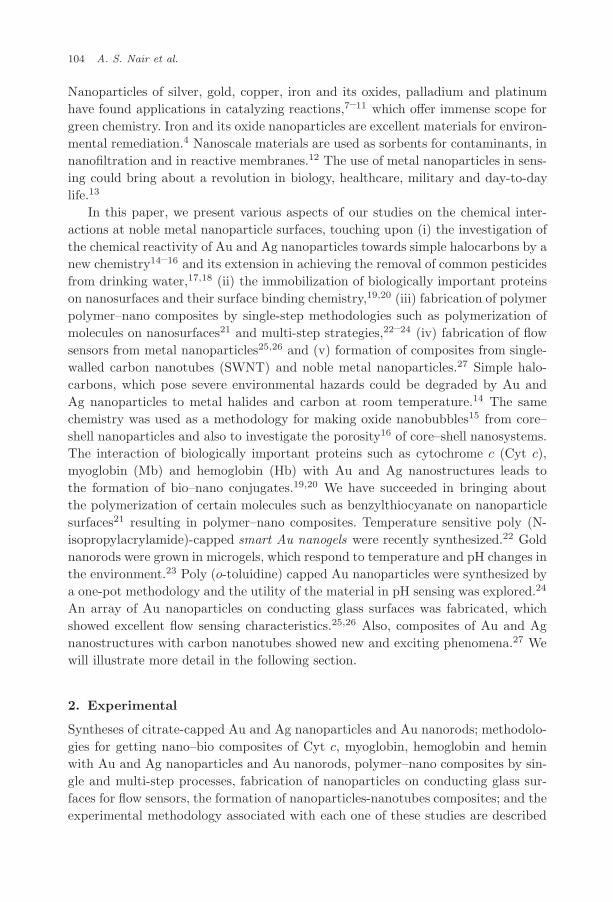
We have invented new reactions between the nanoparticles of Au and Ag (detailsare described in Ref. 14) and simple halocarbons such as CCl4, CHBr3, CCl3F andbenzylchloride, whereby the halocarbons are degraded by the nanoparticles to metalhalides and amorphous carbon at room temperature.14 We have systematicallyinvestigated the reactions in detail by spectroscopy, microscopy, pH and conductiv-ity measurements to gain an understanding of the mechanistic aspects of the degra-dation. We have noted that the Au and Ag nanoparticles degrade the halocarbons bydifferent reaction pathways.14 While the halocarbons directly react at the nanopar-ticle surfaces in the case of Ag, they adsorb onto the surfaces of Au nanoparticlesand degrade completely over a period of time, bringing about interesting features inthe surface plasmon characteristics. The chemical reactivity of Au and Ag towardsthe halocarbons and the corresponding changes to the surface plasmon feature of thenanoparticles were monitored by UV–visible spectroscopy in a time-dependent man-ner. These are illustrated in Fig. 1. Figure 1(a) is the UV–visible spectra showing theinteraction of Ag nanoparticles (70-nm diameter) with CCl4. The progressive reduc-tion in the intensity of the surface plasmon peak is attributed to the time dependentconversion of Ag into AgCl by CCl4. Complete conversion of Ag into AgCl occursin 12 h of interaction. The interaction of halocarbons with Au (∼15 nm diameter)follows a different pathway, as is evident from Fig. 1(b). The binding of the halocar-bon (benzylchloride) on Au results in time-dependent changes in the surface plas-mon feature due to the adsorbate-induced aggregation of the nanoparticles.14 Theadsorbate-induced aggregation of Au nanoparticles was confirmed by TEM studies.The adsorbed halocarbons then react with the Au nanoparticles over a period of48 h, resulting in their complete degradation to AuCl3 and amorphous carbon. Theformation of metal halides (AgCl and AuCl3) was confirmed by X-ray diffraction andabsorption spectroscopy respectively, and amorphous carbon by infrared (IR) andRaman spectroscopy.14 The insets of Figs. 1(a) and 1(b) are the photographs depict-ing the color changes before (left) and after (right) the reaction with the respectivenanoparticles. The pH and conductivity during the course of the reaction weremonitored in a time-dependent manner. The pH of the reaction showed a decreasefrom 9.7 (that of the starting reaction mixture) to 1.2 (after complete degradation)during the course of the reaction and the conductivity of the solution showed amarked increase from 3.32 × 10³ µS cm−1 to 3.51 × 10⁴ µS cm−1. The conversionof 2-propanol (in the reaction mixture) to acetone (CH3–CHOH–CH3 → CH3–CO–CH3+2H++2e, the formation was confirmed by gas chromatographic measure-ments) via ketyl radical formation during the reaction is supposed to be the mainsource of protons. Hence the reason for the drastic reduction in pH. The chemi-cal reactivity was also investigated with other halocarbons such as benzylchloride,
Chemical Interactions at Noble Metal Nanoparticle Surfaces 107
800
Wavelength (nm)
300 400 500 600 700
0.0
0.4
0.8
1.2
1.6
S
R
CBA
Ab
sorb
ance
800
Wavelength (nm) 500 600 700
0.0
0.1
0.2
U
T
S
CB
A
Ab
sorb
ance
(a) (b)
Ab
sorb
ance
400 500 600 7000.0
0.2
0.4
0.6
0.8
1.0
CG
B
A
Wavelength (nm)
800 1400 1200 1000 800
55
60
65
70
75
C−Cl
C−F
B
A
% T
ran
smit
tan
ce
Wavenumber (cm-1)
(c) (d)
Fig. 1. (a) Variation in the UV–visible spectrum of silver nanoparticles upon the interactionwith CCl4. Spectrum of the pure nanoparticles, (A) shows the plasmon excitation at 438 nm,characteristic of silver nanoparticles of 60–80 nm diameter. Trace (B) was recorded just afterthe addition of 50 µL of CCl4 to 2.5mL of the solution. Subsequent traces were taken at 20minsintervals (C to R) and trace (S) was recorded after 12 h showing the complete disappearance of theplasmon excitation. (b) Changes in the absorption spectra during the reaction between Au@citrateand benzylchloride. Trace (A) is the absorption spectrum of pure Au@citrate. Trace (B) was taken
immediately after the addition of benzylchloride. Subsequent traces, (C–S) were taken at 20minsintervals. The absorption spectrum U was taken after 48 h. (c) UV–visible spectra of the reactionbetween Ag@citrate and CHBr3 in a time-dependent manner. The traces were taken at intervalsof 3mins. Note the rapid decrease in the intensity of the plasmon excitation of Ag@citrate (A)by the addition of 50 µL of bromoform to 2.5mL of Ag@citrate (B–G). (d) A comparison of theinfrared spectra of CCl3F (trace A) and its reaction product with Ag@citrate (trace B). Note thatthe C–Cl and C–F features disappeared in the reaction product and a sharp peak correspondingto amorphous carbon emerged (indicated by an arrow) at 1384 cm−1.
108 A. S. Nair et al.
CH2Cl2, CHBr3 and CCl3F. The kinetics of binding and degradation of benzylchlo-ride with Ag and Au were found to be faster compared to the CCl4 case. Thefastest reaction observed was with CHBr3. Figure 1(c) shows the time-dependentUV–visible spectra of the reaction between CHBr3 and Ag. The surface plasmonpeak of Ag disappears just after 10 mins of their interaction. In the degradationof CCl3F, analysis of the reaction product (Fig. 1(d), trace B) by infrared spec-troscopy revealed the complete disappearance of the C–F and C–Cl bonds (seenin CCl3F, Fig. 1(d), trace A) and the appearance of the carbonaceous peak (indi-cated by arrow). Similarly, no C–H frequency was seen in the reaction products ofCH2Cl2 and CHCl3 indicating their complete degradation. In view of the mechanis-tic details of the reaction investigated, the degradation reaction in the case of Agmay be represented as (4Ag(s) + CCl4(l) → 4AgCl(s) + C(graphite), ∆H = −379.8KJmol−1, considering ∆H0
f 298 of CCl4 and AgCl as −128.2 and −127.0kJ mol−1,respectively). The large negative ∆H value accounts for the fast reaction of halocar-bons with the Ag nanoparticles. Thermochemistry suggests a less exothermic reac-tion (4Au(s)+3 CCl4(l) → 4AuCl3(s)+C(graphite), ∆H = –85.8 kJ mol−1) for gold,(∆Hfo298 for AuCl3 = −117.6kJ mol−1) which could be the reason for the slowreaction between Au nanoparticles and the halocarbons. The chemistry of halo-carbons with metal nanoparticles was used to selectively leach metal cores fromcore–shell nanoparticles, namely Ag@ZrO2, Au@ZrO2 and Au@SiO2 (metal coresprotected with oxide shell of ZrO2 and SiO2, respectively).
The selective removal of Au and Ag nanoparticles resulted in ZrO2 and SiO2
nanobubbles/nanoshells.15,28 The reaction of CCl4 with Au@SiO2 nanoparticlesresulted in the growth of carbon onions inside the SiO2 shell.28 The halocarbonchemistry was also used to investigate the porosity of the shells.16 This novel chem-istry opens up a feasible means to incorporate molecules in nanoshells and investi-gate their spectroscopy in a confined atmosphere.29 The methodology also enablesus to incorporate drugs in nanoshells and study their controlled delivery.30
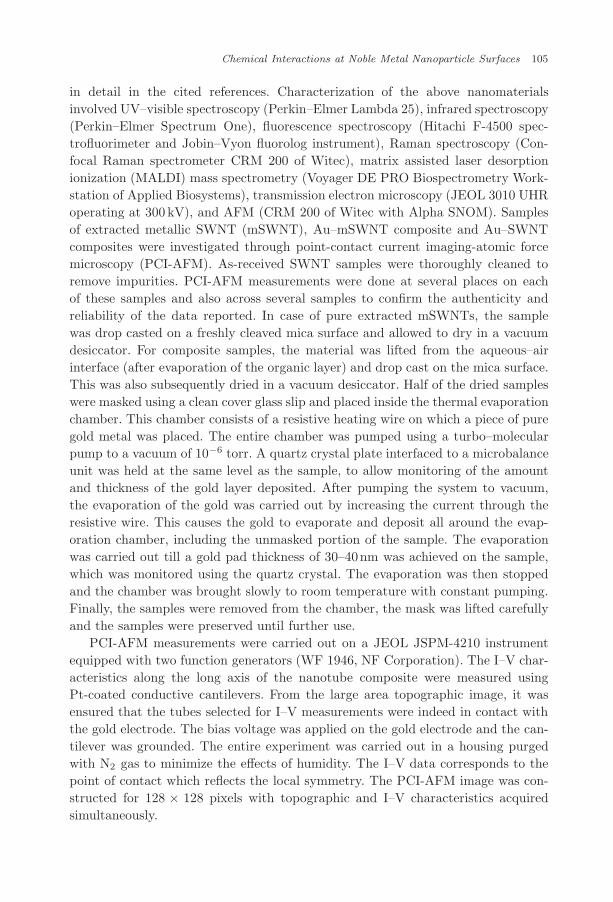
While searching for a feasible field of application for this new chemistry, the pes-ticide contamination in drinking water in India and some parts of the world cameto our attention. Incidentally, most of the pesticides of interest (those detected inwater) are either halocarbons or molecules with sulfur. These pesticides are endo-sulfan, chlorpyrifos and malathion, their presence in drinking water and soft drinkshas become a huge environmental issue in India. Our initial experiments were usingbare nanoparticles for their detection and extraction from water. Figure 2(a) showschanges to the absorption spectrum when endosulfan of different concentrations wasexposed to Au nanoparticles.17 The resultant color change is shown in the inset.The decrease in the intensity of the surface plasmon feature at 532nm and theconcomitant emergence of absorption peaks at longer wavelengths is characteris-tic of adsorbate-induced aggregation of the nanoparticles (and the resultant inter-plasmon coupling). This is clearer in Fig. 2(b), which shows the time-dependentUV–visible spectral changes of the interaction of endosulfan with Au nanoparti-cles. Note the reduction in the intensity of the 532 nm peak and the emergence of
Chemical Interactions at Noble Metal Nanoparticle Surfaces 109
400 500 600 700 800 900 1000 1100
0.0
0.1
0.2
0.3
0.4
0.5
EDCBA
Ab
sorb
an
ce
Wavelength (nm)
400 500 600 700 800 900 1000 11000.0
0.1
0.2
0.3
0.4
CB
T
A
Ab
sorb
an
ceWavelength (nm)
(a) (b)
300 400 500 600 700 8000.00
0.05
0.10
0.15
Abs
orb
ance
Wavelength (nm)
s
r
c
b
a
0 100 200 300 400 500 6000.00
0.04
0.08
0.12
0.16
Abs
orb
ance
Time (minutes)
(c) (d)
Fig. 2. (a) UV–visible spectrum of (A) citrate stabilized gold nanoparticles and the effect ofexposure of endosulfan at various concentrations: (B) 2 ppm, (C) 10 ppm, (D) 100 ppm, and (E)250 ppm. The spectra were recorded 9 h after exposure to endosulfan. The solutions have thesame composition, except for endosulfan. A photograph of the solutions is shown in the inset,(A) pure citrate stabilized nanoparticles; (B), (C) and (D) correspond to 2, 10 and 100 ppm,respectively. (b) Time-dependence of the UV–visible absorption spectrum of citrate stabilizedgold nanoparticles upon exposure of 10 ppm endosulfan. (A) Original nanoparticle solution, (B)3mins after adding endosulfan solution, (C) to (T), at 20 mins intervals thereafter. (c) shows thetime-dependent UV–visible spectra showing the adsorption of 1 ppm chlorpyrifos on [email protected] A is the absorption spectrum of 1 ppm chlorpyrifos and traces (B–R) were taken at 20minsintervals after the interaction with the nanoparticles. Trace s was taken after 10 h showing thecomplete disappearance of chlorpyrifos from water. The inset shows decrease in absorbance vs.time from the absorption spectroscopy data for the traces (A–S). The dotted line in the insetshows a fit of the exponential decrease in absorbance with time. (d) Photograph of a pesticidefilter devise using supported nanoparticles.
110 A. S. Nair et al.
another absorption peak at longer wavelength in a time-dependent manner. Thebinding of endosulfan on Au and Ag was also confirmed by spectroscopic means.Similarly, we have found that chlorpyrifos and malathion also bind to the nano sur-faces effectively.18 Having established the binding of pesticides on nano surfaces, wethought of making a pesticide filter by the incorporation of nanoparticles on suitablesupports for water purification purposes. Activated alumina is a good adsorbent anda known player in water purification area. The activated alumina-supported Ag andAu nanomaterials were used for pesticide removal studies and device fabrication.Figure 2(c) shows the time-dependent UV–visible spectra of the interaction of chlor-pyrifos with the supported nanoparticles of Ag.18 Complete uptake of the pesticideby the supported nanoparticles occurs after 10 h of their interaction. This kind of anapproach was used for column studies in which the nanoparticle loaded alumina wasloaded in a column. Pesticide-spiked water was passed through at 50 ppb concentra-tion and complete removal was detected using gas chromatography using electroncapture detection. Taking data from such studies, we devised a filter (Fig. 2(d)),which is now in the market as part of a domestic water purifier.
3.2. Interaction of biomolecules with nanoparticles-formation of
nano–bio conjugates
Nano–bio conjugates represent a class of interesting materials having widespreadapplications in gene and drug delivery. A study of chemical interactions ofbiomolecules with nanosurfaces is important as the conformations and hence thebiological activity of the biomolecules could be modified by the interactions. Wehave investigated the chemical interactions of biologically important molecules suchas Cyt c, hemoglobin (Hb) and myoglobin (Mb) on Au and Ag nanostructuresresulting in the formation of nano–bio conjugates.19,20 In order to study the inter-action of the protein and the effect of such interactions on the functions of theactive site, a model system, namely hemin was used. In the case of Au, experimentswere conducted with ∼15nm particles, whereas for Ag, ∼ 4 nm (hereafter Ag(I))and ∼ 70 nm (hereafter Ag(II)) particles, synthesized by standard methodologies,were employed. Figure 3 shows UV–visible traces of the nano–bio conjugates ofhemin with Au (Fig. 3(a)) and Ag (Fig. 3(b) and Fig. 3(c)). Both the Ag nanopar-ticles showed more aggregation tendency after hemin binding compared to the Aunanoparticles owing to the presence of carboxyl groups in hemin (Ag has more affin-ity towards –COOH groups), which make particle interlinking feasible. On the otherhand, the surface plasmon feature of Au is well defined even after hemin binding, thecorresponding feature of Ag is broadened, indicative of aggregation due to greaterinteraction between particles. The peak maxima of Ag(I) and Ag(II) particles areshifted to higher and lower values as a result of the interaction. Figure 3(d) showstime-dependent UV–visible traces of the interaction of Ag(I) with hemin, the tracesbeing taken at an interval of 10mins. Shape changes in the surface plasmon bandindicate the formation of aggregates of the nano–bio conjugates.
Chemical Interactions at Noble Metal Nanoparticle Surfaces 111
Fig. 3. (a–c). UV–visible spectra of Au, Ag (II), and Ag (I) particles, respectively taken in 20%aqueous ethanol. Traces (I), (II), and (III) represent the Hem capped nanoparticles, M@Hem,citrate capped nanoparticles, M@Cit and 0.004 mg/mL hemin chloride, respectively. (d) Timedependent binding of Hem on Ag (4 nm) particle monitored at a time interval of 10 mins for theinitial 6 h. Thick curve in (d) corresponds to the parent nanoparticle solution. Traces has beenoffset for clarity.
Figure 4 illustrates the absorption and emission spectra of Cyt c bound Au(Au@Cyt c, Figs. 4(a) and 4(b), respectively) and Ag (Ag@Cyt c, Figs. 4(c) and4(d), respectively) nanoparticles. Traces I, II and III in Figs. 4(a) and 4(c) denotethe absorption spectra of Cyt c bound nanoparticles, citrate capped nanoparticles(showing the surface plasmon resonance) and, pure Cyt c (showing a strong Soretband at 408nm and a weak Q-band at 540nm), respectively. The binding of Cyt c
to the nanoparticles results in changes in the dielectric constant of the neighboringenvironment and hence the red-shift in the surface plasmon band. Figure 4(c) detailsthe broadening and shift in the surface plasmon band of Ag as a result of Cyt c
binding. Figure 4(d) shows an enlarged view of Fig. 4(c) in the region 350–480nm,showing the shift in the peak maximum clearly. Figure 4(b) shows the fluorescencespectra of Cyt c and Au@Cyt c conjugates, respectively. The emission maxima for
112 A. S. Nair et al.
Fig. 4. (a) and (b) Absorption and emission spectra, respectively of the Au@Cyc system. Traces(I), (II), and (III) correspond to 0.2mg/mL Au@Cyt c, 0.1mg/mL Au@Cit and 0.1mg/mL Cyt c,respectively. (B) Excitation and emission spectra of [(I) and (III)] free Cyt c (0.01mg/mL) and[(II) and (IV)] Au@Cyt c (0.05mg/mL) taken in water. (c) is the absorption data of the Ag(I)nanoparticle system. The traces (I), (II), and (III) correspond to similar systems as in A. (d) Anenlarged view of panel C in the region, 350–480 nm.
both Cyt c (trace III) and Au@Cyt c (trace IV) are at 532nm, and the absenceof shifts in the excitation and emission features of free Cyt c and the conjugateindicates that the fluorophore is away from the surface of the nanoparticles. Thedecreased fluorescence is because of quenching of the excited flourophore by thenanoparticles. The nano–bio conjugates were characterized by TEM, IR, Ramanspectroscopy and matrix assisted laser desorption ionization (MALDI) mass spec-troscopy. TEM images indicated well-separated nanoparticles in the case of Au,whereas aggregated structures in the case of Ag. Infrared and Raman spectra gavespectroscopic signatures of the binding of the biomolecules on Au and Ag. Sim-ilarly, we have investigated the formation of bioconjugates from myoglobin (Mb)and hemoglobin (Hb) with Au (Au@Mb) and Ag (Ag@Mb) nanostructures. Theconjugates were characterized by absorption spectroscopy. The UV–visible spectraof the bioconjugates showed the Soret band of Mb and Hb at 408 and 407 nm,respectively. The surface plasmon band of Au red-shifted from 520 nm to 543 nmand 527nm, respectively after the binding with Mb and Hb. UV–visible spectraof Ag@Mb and Ag@Hb showed broad peaks due to aggregation of the conjugates.The nano–bio conjugates formed were further characterized by TEM, IR, Raman,and MALDI techniques. TEM images showed well-separated particles in the case
Chemical Interactions at Noble Metal Nanoparticle Surfaces 113
Fig. 5. (a) UV–visible spectra of AuNR@Mb (I), pure AuNR (II), and Mb(III) 0.1 mg/mL inPBS. HRTEM images of neat AuNR (b, c) and AuNR@Mb (d, e). Images (c) and (e) are latticeresolved.
of Au and aggregated structures in the case of Ag. Infrared and Raman spectrashowed the spectral features of the biomolecules on the nanosurfaces. The spec-tral features of the biomolecules in the nano–bio conjugates were broadened andred-shifted compared to the pure biomolecules, indicative of their surface binding.
We have also studied the conjugate formation of Mb with Au nanorods(AuNR@Mb). This is shown in Fig. 5. Traces I and II correspond to the absorp-tion spectra of AuNR@Mb and pure AuNR solution, respectively (Fig. 5(a)). TheAuNRs show two absorption bands at 510 and 736nm, respectively, correspondingto the transverse and longitudinal plasmons (trace II). After binding to Au, thesurface plasmon bands are shifted to 534 and 740nm, respectively. The dampeningand broadening of the longitudinal plasmon is due to aggregation of the nanorodsas a result of biomolecule binding. This is further illustrated in the HRTEM images(Figs. 5(b)–5(e)). Figures (5(b), 5(c)) and (5(d), 5(e)) show the TEM images ofpure Au nanorods and AuNR@Mb bioconjugates, respectively. As can be seen, theconjugate showed aggregate structures, further confirming the observations in theUV–visible spectra. The protein binding did not cause any change in the morphol-ogy of the nanorods, as can be seen from the high-resolution images in Figs. 5(c)(before binding) and 5(e) (after binding).
3.3. Formation of nanomaterials-polymer composites
Nanomaterials–polymer composites provide enormous flexibility in devising smartmaterials with advantageous optical, electrical and mechanical properties. We haveexplored the possibility of making nanoparticle–polymer composites by single and
114 A. S. Nair et al.
multi-step methodologies. Our investigations revealed that benzylthiocyanate poly-merizes on Ag nanoparticle surfaces to give a nanoparticle–polymer composite (here-after Ag@PBT) at room temperature.21 The Lewis acidity of the Ag+ ion was usedto initiate the polymerization reaction. The composite formed was characterized byspectroscopy and microscopy. We also tried to tune the optical properties of thecore–shell material by increasing the shell thickness. This was achieved by start-ing the reaction with a larger concentration of benzylthiocyanate. As expected, theplasmon position showed a red-shift with increasing the thickness of the shell. Thesurface plasmon is very sensitive to the core radius and shell thickness. Since the coresize remains invariant, the growth of the shell around the silver core is the mainreason for the red-shift observed in the UV–Vis spectrum. The robustness of thepolymeric shell for ion permeability was checked by treating the core–shell materialwith cyanide ions. The shell did not allow the ions to permeate and react with themetal core. This is shown in Fig. 6(a). Up to 2mM CN−, the core was stable. How-ever, at larger ionic concentration, the core is completely destroyed within severalminutes. The gradual build up of a thick polymeric shell around the nanoparticles’surfaces caused a red-shift in the surface plasmon peak to higher values. The newposition of the surface plasmon peak coincides with the wavelength of the laser lineused to measure the Raman spectrum leading to a resonance enhancement in theRaman signal. The Raman spectrum of the composite measured using the resonanceenhancement is shown in Fig. 6(b). The intense Raman line at 1600 cm−1 due to–C=N– was used to image the material. The Raman image generated using the1600 cm−1 line is shown in the inset of Fig. 6(b). Since the Raman imaging is a
300 400 500
AB
C
D
600 700 8000.0
0.2
0.4
0.6
Ab
sorb
an
ce
Wavelength (nm)
Fig. 6. (a) UV-vis spectrum of Ag@PBT treated with cyanide in water- isopropyl alcohol mixture.The silver core remained stable even for a day in 2mM NaCN. Curve A indicates the UV–visspectrum of Ag@PBT in water-isopropyl alcohol mixture. Curve B is the UV–vis spectrum ofAg@PBT measured 1 h after the addition of 2mM CN and curve C is after 24 h. Curve D is afteradding 10mM NaCN−. (b) shows the Raman spectrum of Ag@PBT. Inset shows Raman imageof the material generated by summing up the intensity at 1600 cm−1.
Chemical Interactions at Noble Metal Nanoparticle Surfaces 115
low-resolution technique, it was not possible to image the core–shell geometry of asingle particle. However, the image showed aggregates of core–shell structures. Theintensity was maximum at the center of the aggregate and fading away as we moveto the periphery of the aggregate, which is expected for a collection of particles.Protons generated from the conversion of isopropyl alcohol to acetone via the for-mation of ketyl radicals are supposed to bring about the polymerization of benzylthiocaynate.
Functional polymers such as poly(N-isopropyl)acrylamide (PNIPAm) can beused to incorporate metal nanoparticles inside them. Such polymers can form largeparticles of well defined shape. We have succeeded in making gold nanorod pat-terns using PNIPAm microgels by a template assisted method.23 CTAB-cappedAu nanoparticles were used as seed particles to grow nanorods over the microgelparticles. 2mL of the purified microgel dispersion was mixed with the same vol-ume of the nanoparticle seed solution and left undisturbed for adsorption for suffi-cient time. The nanoparticle-adsorbed microgel, removed by centrifugation, wasanalyzed by absorption spectroscopy and TEM. The seed loaded microgel waskept in a growth solution containing 40mL of 100mM CTAB, 1.7mL of 10mMHAuCl4·3H2O, 250µL of 10mM AgNO3 and 270µL of 100mM ascorbic acid. Thisresults in the growth of nanorods on the surface of the microgels. The nanorod-coated microgel was separated by centrifugation and analyzed by spectroscopy andmicroscopy. The microgel structures showed a larger population of nanorods at theperiphery as the TEM image is a two-dimensional projection. A large area imageof the nanorod-loaded microgel is shown in image (I) of Fig. 7(a). Image (II) showsa single microgel decorated with nanorods. A high-resolution image of an adsorbednanorod is shown in (III). We allowed the microgel to self assemble by keeping thesame in water for two days. The UV–visible spectrum of the material showed trans-verse and longitudinal plasmon bands of nanorods, which are red-shifted comparedto the nanorod-coated microgel due to greater interaction between the nanorods inthe self-assembled structure. A large area image of the hexagonal pattern is shownin the image (I) in Fig. 7(b). In the self-assembled pattern, each microgel particlewas surrounded by six others. A large area image of the hexagonal pattern withthe defect sites marked with white circles is shown in the image (iii) in Fig. 7(b). Aschematic of the self-assembly is shown in Fig. 7(c). The spherical microgel particleschange to hexagonal in shape during self-assembly to fill the voids. The materialshowed regions with the absence of nanorod marking. The polydispersity of theprepared microgel contributed to defects.
We have found that redispersible nanocomposites of gold nanoparticles andnanorods could be made by using PNIPAm.22 Trace a in Fig. 8(a) shows the UV–Vis spectrum of gold nanoparticle-PNIPAm hydrogel in water below the transitiontemperature and trace B corresponds to that of the dispersion above the phasetransition temperature. Trace C is after bringing the solution back to the initialtemperature. The UV–Vis spectrum of the material showed surface plasmon reso-nance peak around 520nm, characteristic of gold nanoparticles. The sample above
116 A. S. Nair et al.
(a)
(b)
(c)
Fig. 7. (a) Image (I) shows the large area image of the nanorod-coated microgels. The decorationof microgels by nanorods at the periphery is clear in image (II). A high resolution TEM imageof nanorod part of microgel is given in image (III). (b) Image (I) shows the large area image ofa hexagonal pattern. The rectangle in (II) shows the largely parallel arrangement of nanorods atthe junction. A large area image of the hexagonal pattern with defects is given in (III). The defectsites are shown by dashed circles. Schematic showing the formation of a hexagonal pattern by thefusion of nanorod-coated microgels is shown in (c).
the transition temperature (32◦C) showed increased absorption. This is attributedto scattering due to the precipitation of the polymer from the solution. The solutionafter switching (25◦C) came back to the initial condition, indicating the reversiblenature of the switching. Photograph in the inset of Fig. 8(a) shows the color changeof the solution during switching. The color of the solution changed from wine red toopaque red during the phase transition. Interestingly, the solution does not show anydrastic color change, which is expected when nanoparticles aggregate. This indicatesthat shrinking of the gel does not reduce the inter-particle distance below the limitnecessary for plasmon coupling. The switching can be repeated any number of times.
Chemical Interactions at Noble Metal Nanoparticle Surfaces 117
(a) (b)
200 nm 200 nm
(c) (d)
Fig. 8. (a) The UV–Vis spectrum of gold nanoparticle–PNIPAm composite. Trace A is beforeswitching. Trace B is above the phase transition temperature, showing significant scattering. TraceC is after cooling the solution to room temperature, showing complete reversibility. The inset showsthe photograph of the material below (L) and above (U) the phase transition temperature. Insetin (a) at the bottom left shows the photograph of the dried composite after one time loading ofthe nanoparticles. (b) shows the UV–Vis spectrum of the gold nanoparticle–PNIPAm compositeshowing the effect of loading. Traces (A–I) correspond to repeated loading of the same amount ofnanoparticle with the same gel. Inset shows the intensity of the surface plasmon peak as a functionof nanoparticle loading, (c) shows the TEM image of the gold nanoparticle–PNIPAm compositeafter first loading and (d) after saturation loading.
The bottom inset in Fig. 8(a) shows a photograph of the vacuum dried sample. Toget an idea about the empty space inside the gel and to see whether the materialshows any change in the electronic properties with the nanoparticle concentration,the material was loaded repeatedly with gold nanoparticles. Figure 8(b) shows theUV–Vis spectrum of the material during each loading. 2mL of the gel was foundto take up 14mL of gold citrate solution. This material will have approximately
118 A. S. Nair et al.
17.734 × 10⁹ gold nanoparticles inside the voids. The uptake of nanoparticles intothe gel (Fig. 8(c) is the TEM image of the gel after first loading of the nanoparti-cles) was linear and the gel showed a saturation loading as seen from the leveling ofthe absorbance at the plasmon peak position. As we can see from the TEM imageof the gel after saturation loading (Fig. 8(d)), particles do not interact with eachother. As a result, the absorption spectrum shows no shifts upon repeated loading.The same experiment was repeated with the gold nanorods. The position of bothlongitudinal as well as transverse peak remained the same throughout the switchingeven though the intensity increased, which indicates that the inter-particle interac-tion is very weak in the case of gold nanorod–PNIPAm composite. The switchingwas reversible as concluded from the position as well as the intensity of both thelongitudinal and the transverse peaks. For the composite made from CTAB cappedgold nanorods, saturation-loading experiments were performed. 250µL of the asprepared gel was found to absorb 25µL of the gold nanorod solution. This amountsto a loading of 3.07 × 10¹⁰ gold nanorods into 250µL of the gel.
3.4. Nanoparticle-based flow sensors-transverse
electrokinetic effect
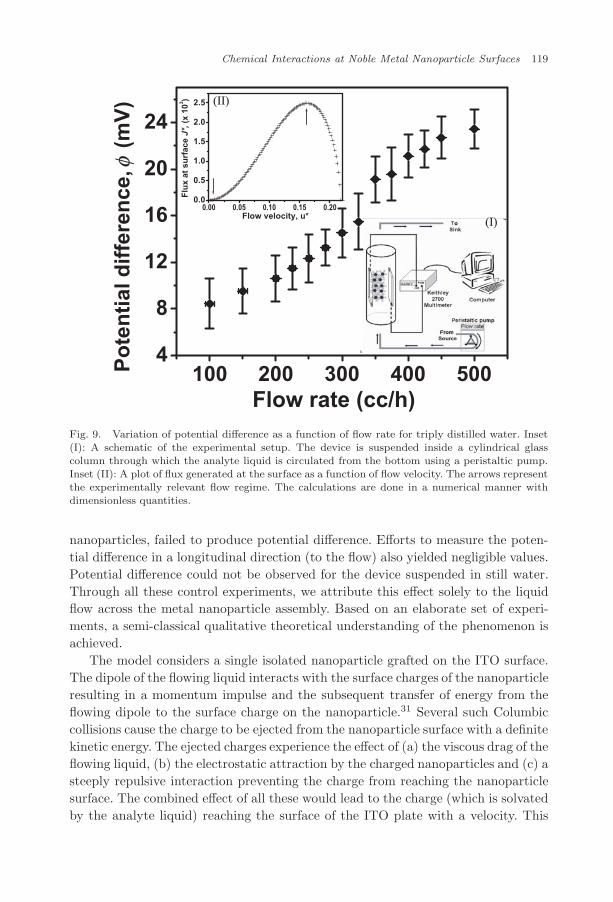
We report the generation of a potential difference due to flow of a liquid acrossa metal nanoparticle multilayer assembly. The nanoparticles are self-assembled onan indium doped tin oxide conducting glass plate (ITO) by covalent interactionsand characterized by UV–visible absorption spectrophotometry. A device is fabri-cated by arranging two ITO plates, one containing the nanoparticle assembly andthe other without it, with their conducting surface facing each other. The edgesare separated by a thin inert spacer so that the two conducting surfaces are not indirect contact. Electrical leads taken from the conducting surfaces are connected tothe terminals of a Keithley 2700 digital multimeter for online data acquisition andstorage. The schematic of the experimental setup is shown in inset (I) of Fig. 9. Wefind that a potential difference is generated when a liquid flows across the nanopar-ticle assembly. This potential difference is generated in a direction transverse to thedirection of the flow. The magnitude of the potential difference is found to dependon various factors such as the flow rate, dipole moment, viscosity and ionic con-centration of the flowing analyte liquid. It is also found to be dependent on thesurface coverage of the nanoparticles on the ITO plate. A plot of potential differ-ence generated for various flow rates, with water as the analyte liquid, is shownin Fig. 9. Similar calibration plots could be generated for other parameters likedipole moment, viscosity, ionic concentration and surface coverage. Interestingly,the phenomenon could be observed with other metal nanoparticle assemblies likethat of silver (mean diameter 60 nm) and gold nanorods (diameter 11 nm, aspectratio 2.8). However, nonmetallic systems such as SiO2 assemblies failed to show thiseffect. Control experiments done with two ITO plates neither of them containing the
Chemical Interactions at Noble Metal Nanoparticle Surfaces 119
0.00 0.05 0.10 0.15 0.200.0
0.5
1.0
1.5
2.0
2.5
Flu
x a
ts
urf
ac
eJ*
, (x
103 )
Flow velocity, u*
(II)
100 200 300 400 5004
8
12
16
20
24P
ote
nti
al d
iffe
ren
ce,
(m
V)
φ
Flow rate (cc/h)
(I)
Fig. 9. Variation of potential difference as a function of flow rate for triply distilled water. Inset(I): A schematic of the experimental setup. The device is suspended inside a cylindrical glasscolumn through which the analyte liquid is circulated from the bottom using a peristaltic pump.Inset (II): A plot of flux generated at the surface as a function of flow velocity. The arrows representthe experimentally relevant flow regime. The calculations are done in a numerical manner withdimensionless quantities.
nanoparticles, failed to produce potential difference. Efforts to measure the poten-tial difference in a longitudinal direction (to the flow) also yielded negligible values.Potential difference could not be observed for the device suspended in still water.Through all these control experiments, we attribute this effect solely to the liquidflow across the metal nanoparticle assembly. Based on an elaborate set of experi-ments, a semi-classical qualitative theoretical understanding of the phenomenon isachieved.
The model considers a single isolated nanoparticle grafted on the ITO surface.The dipole of the flowing liquid interacts with the surface charges of the nanoparticleresulting in a momentum impulse and the subsequent transfer of energy from theflowing dipole to the surface charge on the nanoparticle.31 Several such Columbiccollisions cause the charge to be ejected from the nanoparticle surface with a definitekinetic energy. The ejected charges experience the effect of (a) the viscous drag of theflowing liquid, (b) the electrostatic attraction by the charged nanoparticles and (c) asteeply repulsive interaction preventing the charge from reaching the nanoparticlesurface. The combined effect of all these would lead to the charge (which is solvatedby the analyte liquid) reaching the surface of the ITO plate with a velocity. This
120 A. S. Nair et al.
velocity is used to calculate the flux of charges at the surfaces, which is proportionalto the potential difference observed. The validity of this theoretical model is seenwhen the flux of the charges at the ITO surface is plotted as a function of the flowrate of the analyte liquid, as shown in inset (II) of Fig. 9. Excellent agreement withthe experimental observation is seen, for the region marked within the arrows ininset (II) of Fig. 9. Similar agreement is observed with dipole moment and viscosity,thereby validating the theoretical model.
3.5. Visible fluorescence from metal nanoparticle–single walled
carbon nanotube composites
We have reported that as a result of interaction between nanoparticles and SWNT toform a composite, the latter emits in the visible region of the electromagnetic spec-trum. The composites, prepared by the interaction of purified SWNTs and metalnanoparticles at the liquid–liquid interface, were probed using micro Raman spec-troscopy. The usual Raman modes of SWNTs like the RBM, D, G and G‘ bandswere observed along with a sharp visible emission, as shown in Fig. 10. Furtherstudies, using varying excitation sources, established the emission to be fluores-cent in nature. The strong fluorescent signal allowed the spectroscopic mapping ofthe SWNTs present in the composite through microRaman microscopy. Transmis-sion SNOM at sub-diffraction limits was also achieved on the composite, using thestrong fluorescence signal. The fluorescence was observed for all metal nanoparticlecomposites such as gold nanoparticle (mean diameter 12 nm), silver nanoparticles(mean diameter 60 nm) and gold nanorods (mean diameter 11nm, aspect ratio 2.8).However, it was not observed in pristine nanoparticles, nanorods or SWNTs. Thus,the fluorescence is attributed to the inherent states of modified SWNTs present in
0 2000 4000 6000 80000
5k
10k
15k
20k
25k
RBM
E
D
C
B
A
G` band
669649606Wavelength (nm)
874.4744.2647.8573.5Wavelength (nm)
514.5
Inte
nsi
ty (
arb
. un
its)
Raman Shift (cm-1)
D
G
Fig. 10. Raman spectra of Ag–SWNT composite (trace A), AuNR-SWNT (trace B) and Au-SWNT (trace C) composites. Trace D and E pertain to control experiments with pristine SWNTsand SWNTs heated with tridsodium citrate, respectively. The corresponding emission wavelengthsare marked. The emission maxima occur at 606 and 652 nm. The RBM, D and G bands are marked.
Chemical Interactions at Noble Metal Nanoparticle Surfaces 121
the composite. The discovery poses important questions about the metallic statesof SWNTs, which are bound to be present in the composite.
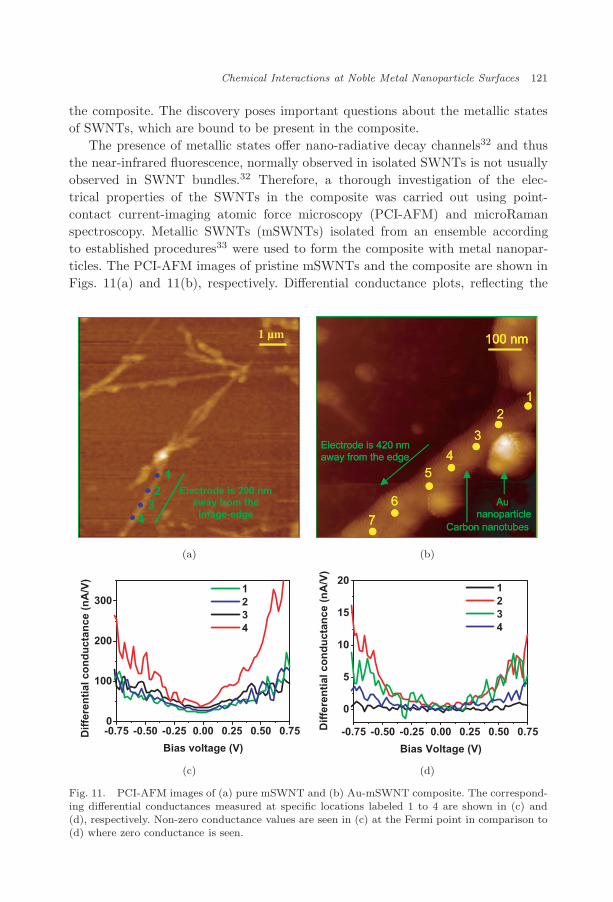
The presence of metallic states offer nano-radiative decay channels32 and thusthe near-infrared fluorescence, normally observed in isolated SWNTs is not usuallyobserved in SWNT bundles.32 Therefore, a thorough investigation of the elec-trical properties of the SWNTs in the composite was carried out using point-contact current-imaging atomic force microscopy (PCI-AFM) and microRamanspectroscopy. Metallic SWNTs (mSWNTs) isolated from an ensemble accordingto established procedures33 were used to form the composite with metal nanopar-ticles. The PCI-AFM images of pristine mSWNTs and the composite are shown inFigs. 11(a) and 11(b), respectively. Differential conductance plots, reflecting the
Electrode is 200 nmaway from the
image-edge
12
34
Electrode is 200 nmaway from the
image-edge
12
34
100 nm
12
3
45
6
7
Electrode is 420 nmaway from the edge
Carbon nanotubes
Au nanoparticle
100 nm
12
3
45
6
7
Electrode is 420 nmaway from the edge
Carbon nanotubes
Au nanoparticle
100 nm100 nm
12
3
45
6
7
Electrode is 420 nmaway from the edge
Carbon nanotubes
Au nanoparticle
(a) (b)
-0.75 -0.50 -0.25 0.00 0.25 0.50 0.750
100
200
300
Dif
fere
nti
al c
on
du
ctan
ce (
nA
/V)
Bias voltage (V)
1 2 3 4
-0.75 -0.50 -0.25 0.00 0.25 0.50 0.75
0
5
10
15
20
Dif
fere
nti
al c
on
du
ctan
ce (
nA
/V)
Bias Voltage (V)
1 2 3 4
(c) (d)
Fig. 11. PCI-AFM images of (a) pure mSWNT and (b) Au-mSWNT composite. The correspond-ing differential conductances measured at specific locations labeled 1 to 4 are shown in (c) and(d), respectively. Non-zero conductance values are seen in (c) at the Fermi point in comparison to(d) where zero conductance is seen.
122 A. S. Nair et al.
density of states of SWNTs for mSWNTs and SWNT composite are shown inFigs. 11(c) and 11(d), respectively.
The conductance in the Fermi region for SWNT composite being zero, reflectsthe semiconducting states of the SWNTs in the composite. This is in contrast tothe non-zero conductance near the Fermi region for mSWNTs, which is the startingmaterial. Thus mSWNTs are converted to semiconducting SWNTs upon formationof the composite. Thus, a metal–semiconductor transition was observed in SWNTsdue to interaction with metal nanoparticles. The nature of this interaction has beenprobed and established to be electrostatic in nature.
4. Conclusions
In this paper, we have reviewed our research on chemical interactions at noblemetal surfaces in some detail. Simple halocarbons degrade at the surfaces of metalnanoparticles to metal halides and amorphous carbon at room temperature by anew chemistry, which offers a simple and effective methodology for environmentalremediation. The new chemistry was exploited for devising a filter for the effectiveremoval of common pesticide contaminants from drinking water. Immobilization ofbiologically important molecules such as hemin, Cyt c, hemoglobin and myoglobinon Au and Ag nanostructures lead to nano–bio conjugates and their surface bindingchemistry was explored in detail. The nano–bio conjugates were characterized byspectroscopy and microscopy. Polymer–nano composites with tunable optical prop-erties were prepared by single and multi-step methodologies and the utility of themin sensing was investigated. Smart nanogel–nanoparticle composites and nanogel–nanorod patterns were made from PNIPAM based on a template-assisted method.An array of noble metal nanostructures fabricated on conducting glass substratesshowed excellent flow sensing characteristics by the transverse electrokinetic effect.Composites made from noble metal nanostructures and metallic single walled car-bon nanotubes showed concomitant visible fluorescence and metal to semiconductortransition, as shown by Raman and PCI-AFM measurements.
Acknowledgements
TP acknowledges financial support from the Department of Science and Technology,Government of India for supporting his research program on nanomaterials. RenjisT. Tom and C. Subramaniam thank the Council of Scientific and Industrial Researchfor research fellowships.
References
1. Lu Y and Liu J, Smart nanomaterials inspired by biology: Dynamic assembly of error-free nanomaterials in response to multiple chemical and biological stimuli, Acc ChemRes 40:315–323, 2007.
2. Lee BI, Qi L and Copeland T, Nanoparticles for materials design: Present & future,J Ceram Process Res 6:31–40, 2005.
Chemical Interactions at Noble Metal Nanoparticle Surfaces 123
3. Daniel MC and Astruc D, Gold nanoparticles: Assembly, supramolecular chemistry,quantum-size-related properties and applications toward biology, catalysis, and nan-otechnology, Chem Rev 104:293–346, 2004.
4. Zhang WX, Nanoscale iron particles for environmental remediation: An overview,J Nanopart Res 5:323–332, 2003.
5. Fan J and Gao Y, Nanoparticle-supported catalysts and catalytic reactions — A mini-review, J Exp Nanosci 1:457–475, 2006.
6. Mayer ABR, Colloidal metal nanoparticles dispersed in amphiphilic polymers, PolymAdv Technol 12:96–106, 2001.
7. Son S, Park IK, Park J and Hyeon T, Synthesis of Cu2O coated Cu nanoparticles andtheir successful applications to Ullmann-type amination coupling reactions of arylchlorides, Chem Commun 778–779, 2004.
8. Crooks RM, Zhao M, Sun L, Chechik V and Yeung LK, Dendrimer-encapsulated metalnanoparticles: Synthesis, characterization and applications to catalysis, Acc Chem Res34:181–190, 2001.
9. Rahim EH, Kamounah FS, Frederiksen J and Christensen JB, Heck reactions cat-alyzed by PAMAM-dendrimer encapsulated Pd(0) nanoparticles, Nano Lett 1:499–501, 2001.
10. Moreno-Manas M and Pleixats R, Formation of carbon–carbon bonds under catalysisby transition-metal nanoparticles, Acc Chem Res 36:638–643, 2003.
11. Stevens PD, Fan J, Gardimalla HMR, Yen M and Gao Y, Superparamagneticnanoparticle-supported catalysis of Suzuki cross-coupling reactions, Org Lett 7:2085–2088, 2005.
12. Savage N and Diallo MS, Nanomaterials and water purification: Opportunities andchallenges, J Nanopart Res 7:331–342, 2005.
13. Coyle S, Wu SY, Lau KT, Rossi DD, Wallace G and Diamond D, Smart nanotextiles:A review of materials and applications, Mater Res Bullt 32:434–442, 2007.
14. Nair AS and Pradeep T, Halocarbon mineralization and catalytic destruction by metalnanoparticles, Curr Sci 84:1560–1564, 2003.
15. Nair AS, Tom RT, Suryanarayanan V and Pradeep T, ZrO2 bubbles from core–shellnanoparticles, J Mater Chem 13:297–300, 2003.
16. Suryanarayanan V, Nair AS, Tom RT and Pradeep T, Porosity of core–shell nanopar-ticles, J Mater Chem 14:2661–2666, 2004.
17. Nair AS, Tom RT and Pradeep T, Detection and extraction of endosulfan by metalnanoparticles, J Environ Monitor 5:363–365, 2003.
18. Nair AS and Pradeep T, Quantitative extraction of chlorpyrifos and malathion fromwater by metal nanoparticles, J Nanosci Nanotechnol 7:1871–1877, 2007.
19. Tom RT and Pradeep T, Interaction of azide ion with hemin and Cyt c immobilizedon Au and Ag nanoparticles, Langmuir 21:11896–11902, 2005.
20. Tom RT, Samal AK, Sreeprasad TS and Pradeep T, Hemoprotein bioconjugates ofAu and Ag nanoparticles and Au nanorods: Structure–function correlations, Langmuir23:1320–1325, 2007.
21. Rajeevkumar VR and Pradeep T, Polymerization of benzyl thiocyanate on silvernanoparticles and the formation of polymer coated nanoparticles, J Mater Chem16:837–841, 2006.
22. Rajeevkumar VR and Pradeep T (unpublished results).23. Rajeevkumar VR and Pradeep T, Gold nanorods grown on microgels leading to hexag-
onal nanostructures, Langmuir 23:8667–8669, 2007.24. Subramaniam C, Tom RT and Pradeep T, On the formation of protected gold nanopar-
ticles from AuCl−4 by the reduction using aromatic amines, J Nanopart Res 7:209–217,2005.
124 A. S. Nair et al.
25. Subramaniam C, Pradeep T and Chakrabarti J, Flow induced transverse electricalpotential across an assembly of gold nanoparticles, Phys Rev Lett 95:164501–164504,2005.
26. Subramaniam C, Pradeep T and Chakrabarti J, Transverse electrokinetic effect: Apotential flow sensor, J Phys Chem C (in press).
27. Subramaniam C, Sreeprasad, TS, Pradeep T, Pavan Kumar GV, Narayana C, YajimaT, Sugawara Y, Tanaka H, Ogawa T and Chakrabarti J, Metal–semiconductor tran-sition induced visible fluorescence in single walled carbon nanotubes–noble metalnanoparticle composites, Phys Rev Lett 99:167404–167407, 2007.
28. Rose MJ, Mac Laren I and Pradeep T, Carbon onions within silica nanoshells, Carbon42:2352–2356, 2004.
29. Rosemary MJ, Suryanarayanan V, MacLaren I and Pradeep T, Aniline incorporatedsilica nanobubbles, J Chem Sci 118:375–384, 2006.
30. Rosemary MJ, MacLaren I and Pradeep T, Investigations of the antibacterial prop-erties of ciprofloxacin@SiO2, Langmuir 22:10125–10129, 2006.
31. Jackson JD, Classical Electrodynamics, Wiley Press, New York, 1998.32. O’Connell MJ, Bachilo SM, Huffman CB, Moore VC, Strano MS, Haroz EH, Rialon
KL, Boul PJ, Noon WH, Kittrell C, Ma J, Hauge RH, Weisman RB and SmalleyRE, Band gap fluorescence from individual single-walled carbon nanotubes, Science297:593–596, 2002.
33. Maeda Y, Kimura SI, Kanda M, Hirashima Y, Hasegawa T, Wakahara T, Lian Y,Nakahodo T, Tsuchiya T, Akasaka T, Lu J, Zhang X, Gao G, Yu Y, Nagase S,Kazaoui S, Minami N, Shimizu T, Tokumoto H and Saito R, Large-scale separa-tion of metallic and semiconducting single-walled carbon nanotubes, J Am Chem Soc127:10287–10290, 2005.


![Hydrogen-Evolution Catalysts Based on Non-Noble Metal ... · cial processes unattractive. Several non-noble metal materi-als, such as transition-metal chalcogenides,[2] carbides,[3]](https://static.documents.pub/doc/80x56/5d1f5e3088c993ce268cad2c/hydrogen-evolution-catalysts-based-on-non-noble-metal-cial-processes-unattractive.jpg)


