Chemical Management Chemical Management Services: Services: Outsourcing the Headache Outsourcing the Headache Implementation of CMS at Stanford Linear Accelerator Center Implementation of CMS at Stanford Linear Accelerator Center Brian Sherin, CSP – EORM, Inc. Principal Consultant Lawrence “Butch” Byers – SLAC Acting Safety Manager, ESH Division Brian Sherin, CSP – EORM, Inc. Principal Consultant Lawrence “Butch” Byers – SLAC Acting Safety Manager, ESH Division
Transcript
Chemical Management Chemical Management Services: Services:
Outsourcing the HeadacheOutsourcing the Headache
Implementation of CMS at Stanford Linear Accelerator Center
Implementation of CMS at Stanford Linear Accelerator Center
Brian Sherin, CSP – EORM, Inc.Principal Consultant
Lawrence “Butch” Byers – SLAC Acting Safety Manager, ESH Division
Brian Sherin, CSP – EORM, Inc.Principal Consultant
Lawrence “Butch” Byers – SLAC Acting Safety Manager, ESH Division
Program performance metricsThe Business CaseThe Future
Stanford Linear Accelerator Center
Operated by Stanford University for the US Dept. of Energy – established 1962Mission:– Mission: Discovery, Training, Safety– Photon Science Discoveries
• To make discoveries in photon science at the frontiers of the ultrasmall and ultrafast in a wide spectrum of physical and life sciences
– Particle and Particle Astrophysics Discoveries• To make discoveries in particle and astroparticle
physics to redefine humanity’s understanding of what the universe is made of and the forces that control it
– Operate Safely; Train the Best• To operate a safe laboratory that employs and trains
the best and brightest, helping to ensure the future economic strength and security of the nation
Photon Science
Use of the linear accelerator to study the ultra-small and ultra-fast– Use of synchrotron radiation for
x-ray spectroscopy study for energy and biological research
LCLS: Linac Coherent Light Source– New $350M project to build an x-ray laser
• Brightness 109x any other x-ray source on Earth• 1.5-15 Å diameter photons; <0.1 nm-10 nm range
– Be able to capture images of individual molecules reacting…works like a “strobe” flash
• 1 – 100 femtoseconds (10-15)– Light travels only 1 µm in 3 fs
Particle & Particle AstrophysicsAccelerate electrons and anti-electrons to nearly the speed of light, down a 2.5 mi (4.1 km) tube, into rings, and slam them together and…presto!– Photons– Bosons/Mesons– Gluons– Leptons– Quarks– Antimatter
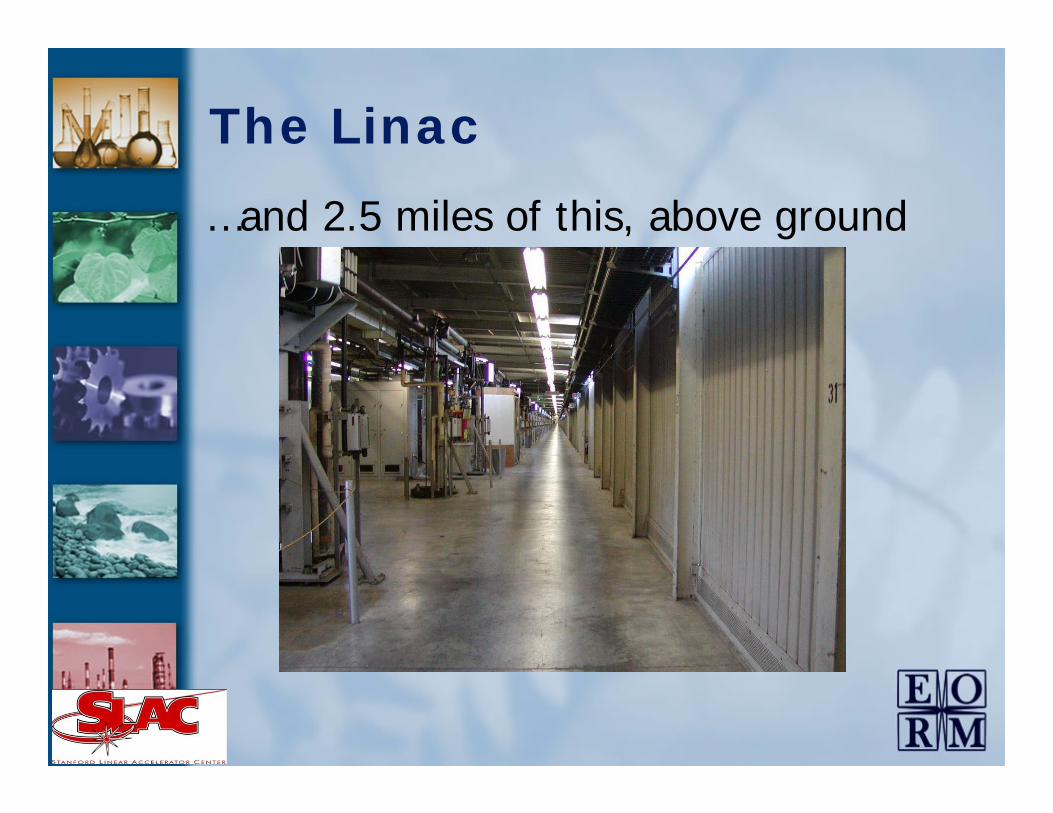
The Linacthere are 2.5 MILES of this…60 feet below ground…
…and 2.5 miles of this, above ground
The Linac
End Station B, End Station B, ““The Beam Stops HereThe Beam Stops Here””
End of the line…
Chemical Management Lifecycle
ProcurementProcurement
InspectionInspection
InventoryInventory
DeliveryDeliveryStorage Storage & Use& Use
CollectionCollection& Disposal& Disposal
RecoveryRecoveryReuse, RecycleReuse, Recycle
Liability Liability
Scrap/spoilageScrap/spoilage
SLAC Chemical Operations
Initially only 2 elements of the lifecycle were being effectively tracked– Inventory, Collection/Disposal
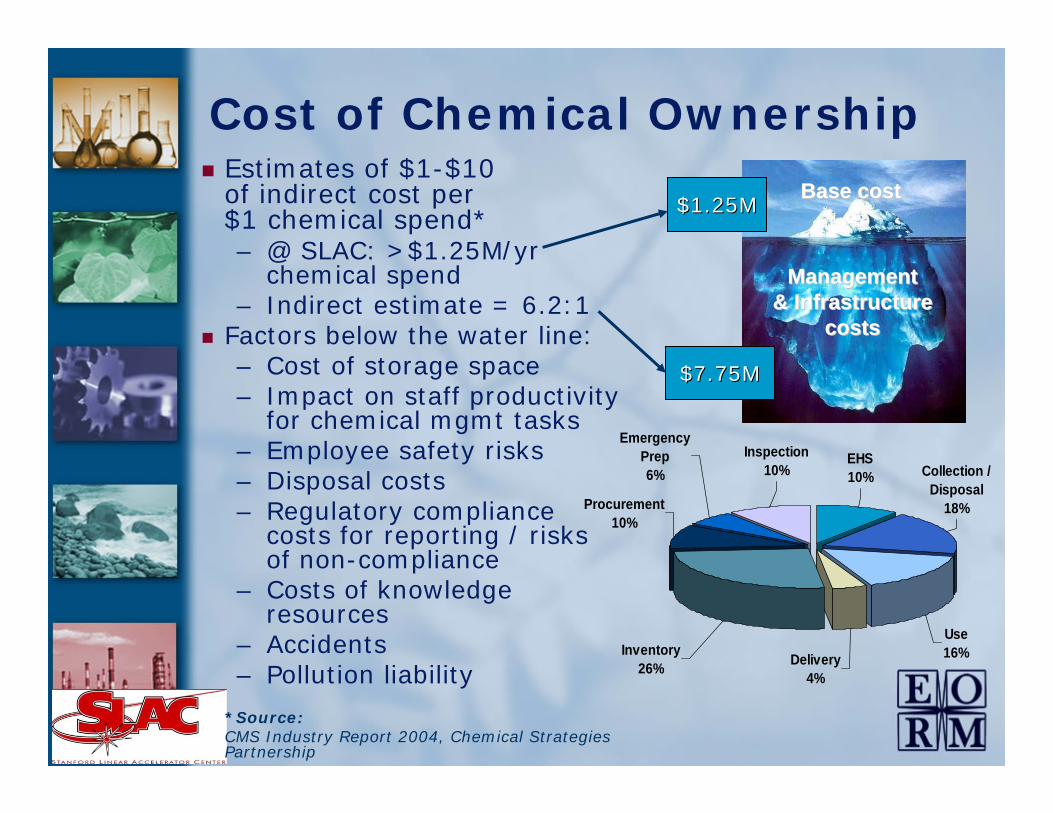
200+ purchasers, 250+ suppliers, on-site stores (and risks)Chemical Management isn’t core to SLAC’s mission…physics research and doing it safely isCosts and Liabilities exist at each stage of chemical life cycle managementHow to make it better?
Changing the supply chain model results inpotential costs savings and environmental gains
Why a Chemical Management System?
Buyer
Wan
ts t
o de
crea
seW
ants
to
decr
ease
Buyer
Wan
ts t
o de
crea
seW
ants
to
decr
ease
Service provider
Wan
ts t
o de
crea
seW
ants
to
decr
ease
Alignment of formerly conflicting driversAlignment of formerly conflicting drivers
0% 20% 40% 60% 80% 100%% respondents
Decreased process downtime
Reduced overhead costs
Reduced labor costs
Improved delivery
Reduced waste / scrap costs
Reduced chemicalusage
Reduced chemical purchase costs
Improved inventory management
Improved data management
Major Benefits to CMS Users
Greatest benefits from:Greatest benefits from:ImprovedImproved data data managementmanagementInventory Inventory managementmanagementReduced chemical Reduced chemical purchase costspurchase costs–– Hard savings up to Hard savings up to
Source: CMS Industry Report 2004, Chemical Strategies Partnership
0%
10%
20%
30%
40%
50%
60%
70%
80%
Year 1 Year 2 Year 3 Year 5 Year 10
% of respondents
16-20%11-15%6-10%0-5%
Reported financial benefits
First 3 years has the greatest savings in hard costs– Reduction in volume
of chemicals– Reduction in price
of chemicals– Process
improvements“Soft” savings estimated at 5-40%– Time savings– Liabilities Source: CMS Industry Report 2004,
Chemical Strategies Partnership
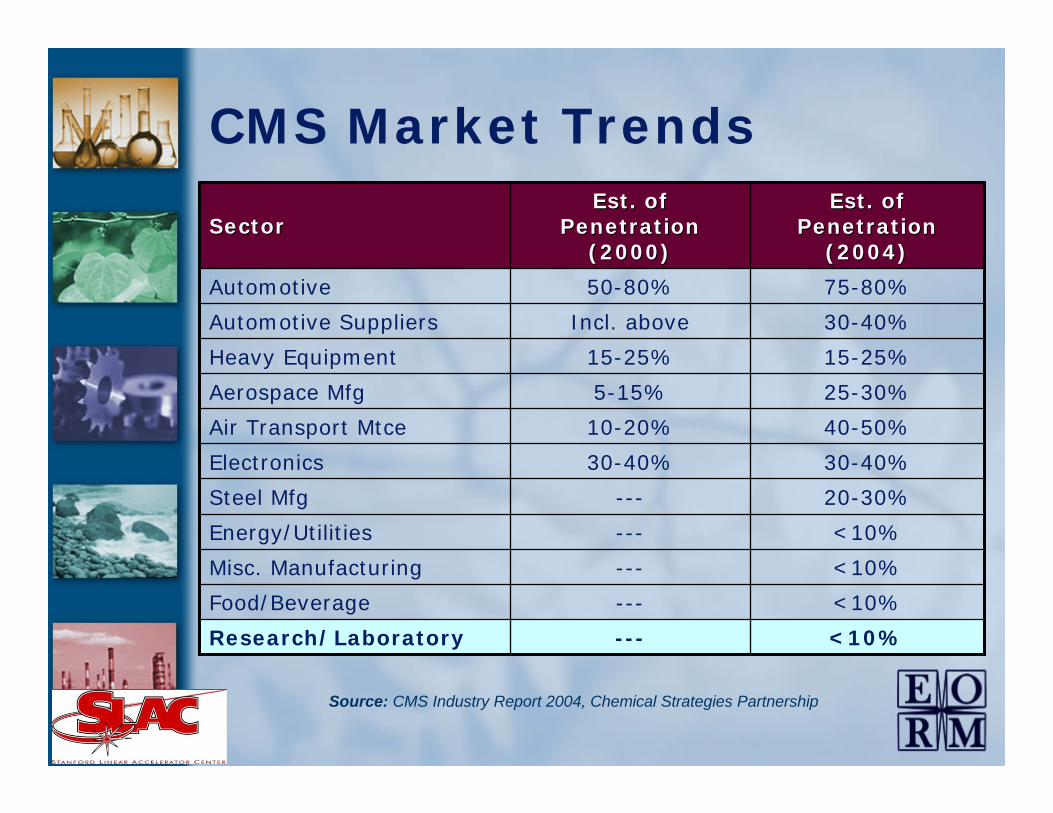
CMS Market Trends
<10%---Research/Laboratory
<10%---Food/Beverage
<10%---Misc. Manufacturing
<10%---Energy/Utilities
20-30%---Steel Mfg
30-40%30-40%Electronics
40-50%10-20%Air Transport Mtce
25-30%5-15%Aerospace Mfg
15-25%15-25%Heavy Equipment
30-40%Incl. aboveAutomotive Suppliers
75-80%50-80%Automotive
Est. of Est. of Penetration Penetration
(2004)(2004)
Est. of Est. of Penetration Penetration
(2000)(2000)SectorSector
Source: CMS Industry Report 2004, Chemical Strategies Partnership
Industry Example:
$20B+, 80,000 employeesPilot at Tucson plant in 1996, company-wide initiative in 1999Covers 45 plants in US, 98% of total chemical, gas and waste spendDrivers:– Reduce chemical lifecycle
costs– Outsource non-core
competencies– Strategic supplier
alliances– Reduce costs of materials– Reduce waste– Improve data
management– “One company” across
multiple systems & procedures
Scope:– Supply side mgmt and
sourcing of everything– Inspection– QC– “Standardized” custom
labeling– Inventory management
(offsite)– Just-in-time delivery– Delivery to point of use– Data mgmt & EH&S
reporting– Tech support and process
optimization– Process efficiency
improvement
Source: Case Study Raytheon, Chemical Strategies Partnership
Industry Example:
35 (mostly contract)
75*Headcount
99.90%96.93%Acceptance rate
$0.28 MM$3.7 MMInventory spoilage, per year
< 9K (-93%)>120KWarehouse floor space (sq. ft)
$0.5 MM$7.0 MMInventory value
523Inventory turn per year
02,000MSDS processed per year
11,300Suppliers
450Sites in program
043,000Purchase Orders per Year
15Accounts Payable
15.5%MinimalCommodity Cost Savings
AfterAfterBeforeBeforeBenefitsBenefits
* Most moved to over areas/roles
Source: Case Study Raytheon, Chemical Strategies Partnership
Academia Example:
10,800 undergrads + 2,000 grad studentsrural Durham, NHno central chemical control…all researchers / staff purchased own materialsFirst campus wide inventory not until 1998Drivers:– Regulatory compliance
• 1997 EPA inspection/fines
– Minimize stockpiling of outdated chemicals
– Optimize purchase and disposal
– Improve laboratory safety and emergency preparedness
– Increase awareness of chemical use and substitution
Scope:– Web-based Chemical
Environmental Management System (CEMS)• UNH EH&S + Research
Computing Center– Inventory of 50K chemical
containers– Procurement tracking (not
single provider)– Allows for transfer between
departments– Automated waste disposal
tracking– Door signs + MSDS– FD access to data
$322K to build; $160K to operate & Maintain
Source: Case Study UNH, Chemical Strategies Partnership
Recommended CMS Process
Conduct pilot programs to assess total lifecycle costs and likely impact of CMS on operations
Source: Chemical Strategies Partnership
CMS @ SLAC: History
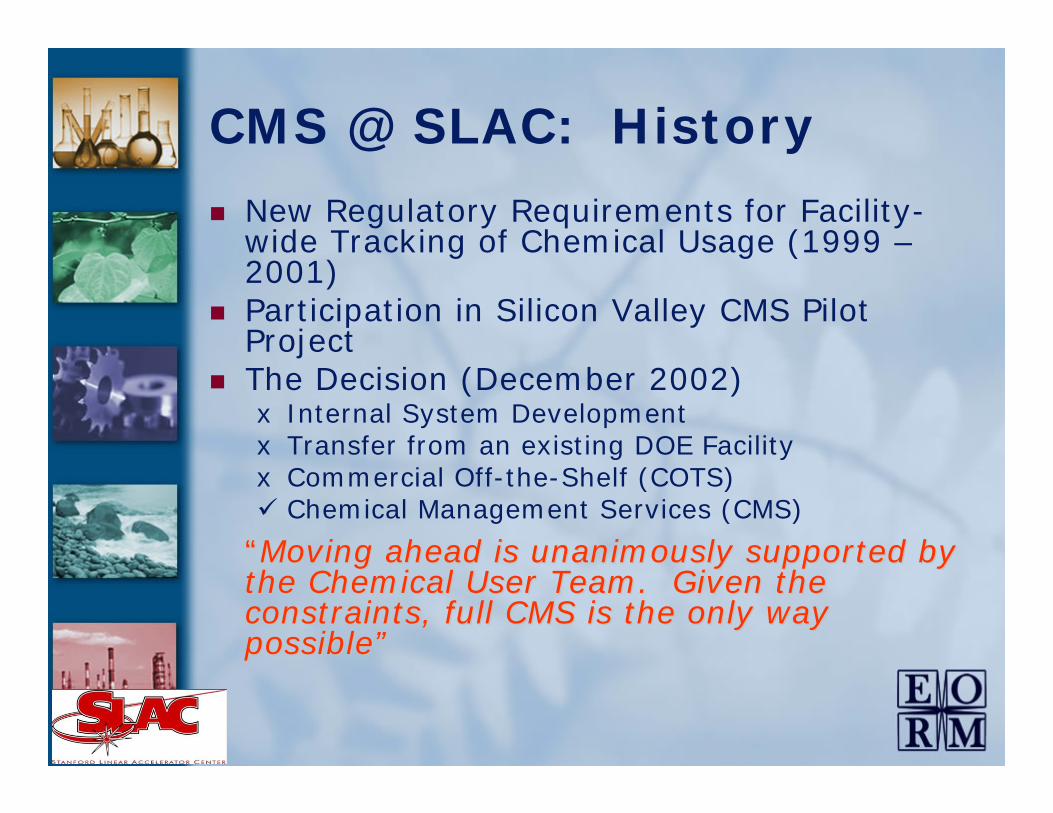
New Regulatory Requirements for Facility-wide Tracking of Chemical Usage (1999 –2001)Participation in Silicon Valley CMS Pilot ProjectThe Decision (December 2002) x Internal System Developmentx Transfer from an existing DOE Facilityx Commercial Off-the-Shelf (COTS)
Chemical Management Services (CMS)
““Moving ahead is unanimously supported by Moving ahead is unanimously supported by the Chemical User Team.the Chemical User Team. Given the Given the constraints, full CMS is the only way constraints, full CMS is the only way possiblepossible””
CMS @ SLAC: History2003: The RFP, Owner Site Visits, and Vendor Selection– Haas TCM selected as the vendor
2004: Master Services Agreement and Pilot ProjectNov 2004 – July 2005: Pilot Project Morphs Into Extended RolloutFeb 2005 – July 2005: Formal tcmIS training of over 90 SLAC users June 2005: SLAC stores inventory transferred to Haas hub over single weekendJune-December 2005: gas cylinder management & clean up; chemical mapping program; bulk nitrogen system evaluation; integration of tcmIS into new ESH Manual ChapterAugust 1, 2005: Formal “Transfer Date”; Haas TCM assumes all responsibilitiesJanuary 31, 2006: first 6 months complete – Formal Management Reviews in March
CMS @ SLAC: ScopeHaas e-commerce business system (tcmIS) – Electronic cataloguing, ordering,
order tracking, data tracking, MSDS management, electronic invoicing, cost reporting and EHS reporting
Haas central warehouse– Maintains min/max inventory
of chemicals commonly used by SLAC; provides next business day just-in-time (JIT) delivery
Haas Supply Management– All sourcing, purchasing,
expediting, and Tier 2 vendor management support for all non-radioactive chemicals and gases used by SLAC
Special projects– Tank decommissioning
• e.g., nitric tank, isobutane tank, H2SO4, etc
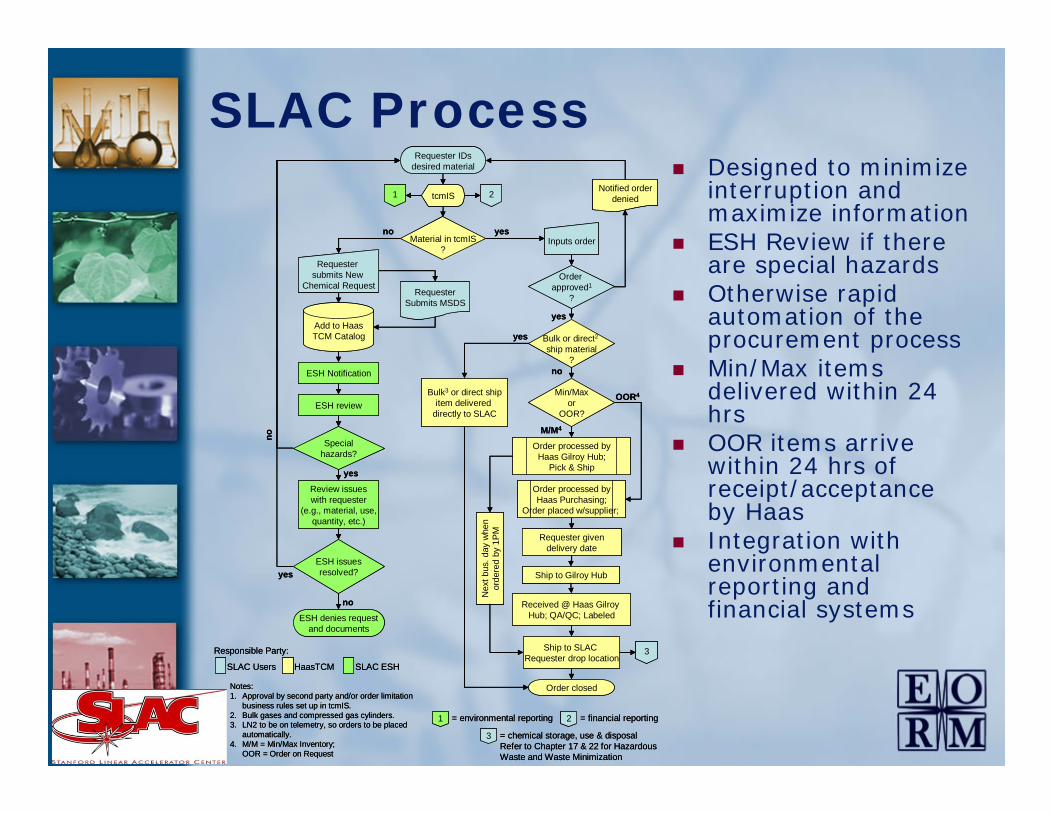
SLAC ProcessDesigned to minimize interruption and maximize informationESH Review if there are special hazardsOtherwise rapid automation of the procurement processMin/Max items delivered within 24 hrsOOR items arrive within 24 hrs of receipt/acceptance by HaasIntegration with environmental reporting and financial systems
Requester IDsdesired material
Material in tcmIS?
Add to HaasTCM Catalog
RequesterSubmits MSDS
Specialhazards?
ESH Notification
no
Review issueswith requester
(e.g., material, use,quantity, etc.)
ESH issuesresolved?
ESH denies requestand documents
no
ESH review
yes
yes
no
Inputs order
Order approved1
?
Bulk or direct2ship material
?
yes
yes
Min/Maxor
OOR?
no
M/M4
Order processed byHaas Gilroy Hub;
Pick & Ship
Order processed byHaas Purchasing;
Order placed w/supplier;
OOR4
Received @ Haas Gilroy Hub; QA/QC; Labeled
Ship to SLAC Requester drop location
Order closed
Bulk3 or direct shipitem delivered
directly to SLAC
yes
Notes:1. Approval by second party and/or order limitation
business rules set up in tcmIS.2. Bulk gases and compressed gas cylinders.3. LN2 to be on telemetry, so orders to be placed
automatically.4. M/M = Min/Max Inventory;
OOR = Order on Request
Nex
t bus
. day
whe
nor
dere
d by
1PM
Ship to Gilroy Hub
Requester submits New
Chemical Request
Requester givendelivery date
Notified orderdenied
3
1 = environmental reporting
SLAC Users HaasTCM SLAC ESH
Responsible Party:
tcmIS1 2
2 = financial reporting
3 = chemical storage, use & disposalRefer to Chapter 17 & 22 for HazardousWaste and Waste Minimization
CMS Website
Physical Inventory
Plating Shop Photo ARoom115
Building025
Performance Metrics
100%Mission Critical (He & LN2)
GOALGOALMETRICMETRIC
tbdHazardous Waste Reduction
On-goingParticipation in Infrastructure Improvement/ISMS
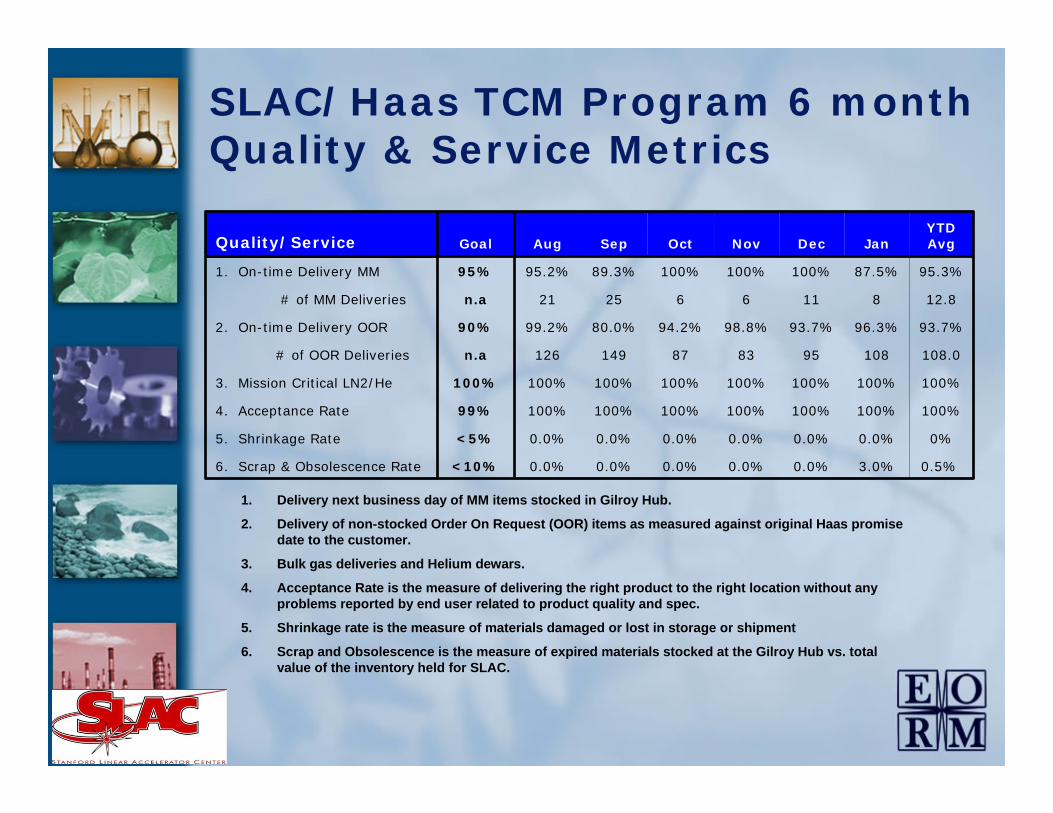
93.7%96.3%93.7%98.8%94.2%80.0%99.2%90%2. On-time Delivery OOR
12.8811662521n.a# of MM Deliveries
95.3%87.5%100%100%100%89.3%95.2%95%1. On-time Delivery MM
YTD AvgJan DecNovOctSepAugGoalQuality/Service
1. Delivery next business day of MM items stocked in Gilroy Hub.
2. Delivery of non-stocked Order On Request (OOR) items as measured against original Haas promise date to the customer.
3. Bulk gas deliveries and Helium dewars.
4. Acceptance Rate is the measure of delivering the right product to the right location without any problems reported by end user related to product quality and spec.
5. Shrinkage rate is the measure of materials damaged or lost in storage or shipment
6. Scrap and Obsolescence is the measure of expired materials stocked at the Gilroy Hub vs. total value of the inventory held for SLAC.
SLAC/Haas TCM Program 6 month Quality & Service Metrics
tbd5. Hazardous Waste
Reduction
11Ongoing4. Infrastructure
Improvement Projects
100%100%100%100%100%100%100%100%3. Training
000000002. Chemical Spills
Releases
000000001. Injury/Illness
YTD AvgJanDecNovOctSepAugGoalESH
1. No Injuries or Illness related to chemical management activities on site.
2. No chemical spills or releases by Haas TCM personnel or contractors during the period.
3. All employees and subcontractors trained to meet SLAC contractual requirements
4. Conversion from bulk H2SO4 to bottles and removal of propane tanks for seismic problems.
5. Waste not currently in scope but tcmIS waste module under consideration for implementation.
SLAC/Haas TCM Program 6 month EHS Metrics
CMS @ SLAC: Statistics
1,662 active chemicals currently set up in the catalogue122 are Min/Max items and 1,540 are “Order on Request” (OOR) items 2,044 Material Requests have been filled during first 6 months$445,628 chemical/gas spend total from Aug 2005 thru Jan 2006– Running at 5.4% reduction, but total spend
is only at 74% of target$52+K in Haas owned inventory stocked for JIT delivery171 SLAC users in 35 work areas with access to tcmIS
Accomplishments
First government facility to successfully implement the CMS modelFirst truly paperless “e-business” system @ SLACPO cycle time for chemicals averages < 1 dayElimination of annual hazardous materials inventoryDevelopment of CMS Mapping Tool Elimination of out of date/orphaned gas cylinders (evaluated more than 1,500 cylinders)Overall streamlining of chemical supply chain
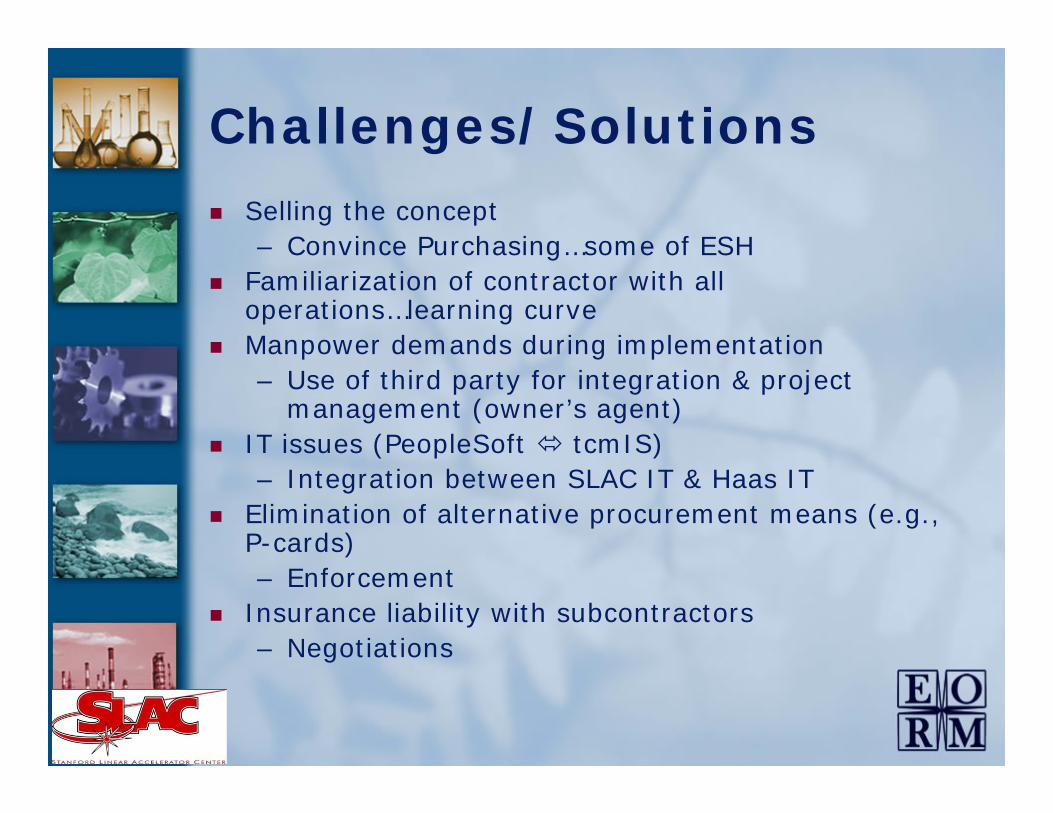
Challenges/Solutions
Selling the concept– Convince Purchasing…some of ESH
Familiarization of contractor with all operations…learning curveManpower demands during implementation– Use of third party for integration & project
management (owner’s agent)IT issues (PeopleSoft tcmIS)– Integration between SLAC IT & Haas IT
Elimination of alternative procurement means (e.g., P-cards)– Enforcement
Insurance liability with subcontractors– Negotiations
Business Case
Annual service feeHard cost savings:– ESH Savings (Requisition approval, MSDS, HMBP)– BSD Savings (Purchasing, Stores, A/P)– Material purchase cost savings (min. 5%)– Stores inventory carrying costs– Elimination of annual Haz Mat inventories– Ongoing regulatory compliance reports (TRI, Title
V, SMOP)Estimated annual savings: ($73K) to $88K– Excluding liability reduction (how to measure?)
Break-even probably at about $1.1M annual spend (2005 $’s)
The Future
Continue to monitor against metricsInfrastructure Improvement Projects– Liquid Nitrogen Bulk Tanks