The flow of two immiscible fluids was investigated in rectangular glass microchannels with equivalent di-ameters of 269 and 400�m. Deionised water, dyed toluene and hexane were selected as probe fluids. Flowpatterns were obtained for Y- and T-junction of two micro-channels and monitored by a photo-camera.Volumetric velocities of water and organic phase varied between 1 and 6ml/h. The formation mechanismof slug and parallel flow was studied and the mass transfer performances of two flow patterns werecompared. The shape of the interface between the immiscible liquids was controlled by a competitionbetween the viscous forces and the local interfacial tension. The flow patterns could be correlated withthe mean Capillary and Reynolds numbers. The mass transfer coefficients for parallel and slug flow weredetermined using instantaneous neutralisation (acid–base) reaction. The two flow patterns showed thesame global volumetric mass transfer coefficients in the range of 0. 2–0. 5 s−1, being affected mainly bythe base concentration in water for parallel flow and by the linear velocity in the case of the slug flow.
Intensification of chemical processes aiming at the effective useof raw materials and energy implies miniaturisation of chemicalreactors. Microstructured reactors (MSR) are systems with a well-defined structure of channels with an internal diameter in the rangeof 10–500�m (Lowe and Ehrfeld, 1999). Due to the small diametersof the channels and the high specific surface area of MSR (in theorder of 10, 000–50, 000m2/m3, Jahnisch et al., 2004), high heattransfer performance can be achieved with heat transfer coefficientsup to 25, 000W/(m2 K) (Ehrfeld et al., 2000). Moreover, the heatexchanger is often integrated within the reactor allowing efficientcontrol of the highly exothermic or endothermic reactions. In thecase of multiphase systems, the specific interface is also drasticallyincreased in comparison with traditional reactors. The specific in-terfacial area of multiphase systems can be obtained in the range of5000–30, 000m2/m3 (Ehrfeld et al., 2000). Therefore, microreactorsallow an intensification of the fast and strongly exothermic or en-dothermic reactions as shown recently by Lomel et al. (2006) for thecase of organometallic synthesis. Other important characteristics ofMSR are the narrow residence time distribution and the easy scale-up with inherent reactor safety (Kiwi-Minsker and Renken, 2005).
All these advantageswarrant the study ofmicroreactors and their usefor production of chemicals. The trend in this direction is acceleratingat the present time (Hessel and Lowe, 2005).
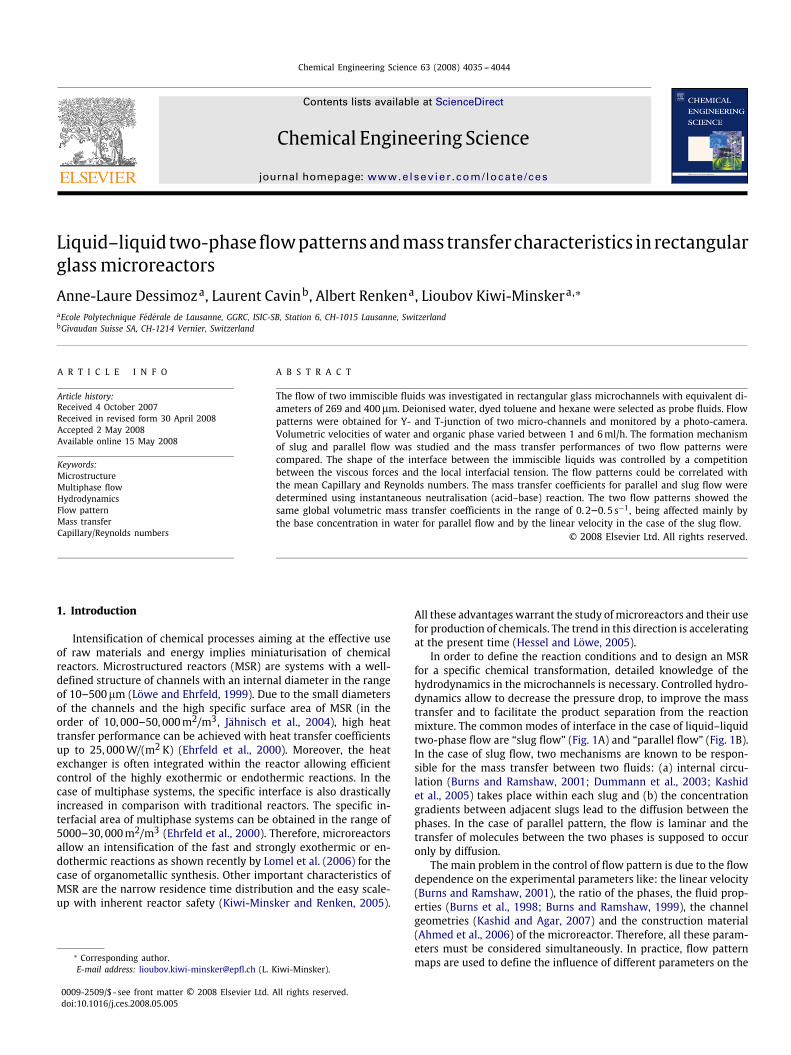
In order to define the reaction conditions and to design an MSRfor a specific chemical transformation, detailed knowledge of thehydrodynamics in the microchannels is necessary. Controlled hydro-dynamics allow to decrease the pressure drop, to improve the masstransfer and to facilitate the product separation from the reactionmixture. The common modes of interface in the case of liquid–liquidtwo-phase flow are “slug flow” (Fig. 1A) and “parallel flow” (Fig. 1B).In the case of slug flow, two mechanisms are known to be respon-sible for the mass transfer between two fluids: (a) internal circu-lation (Burns and Ramshaw, 2001; Dummann et al., 2003; Kashidet al., 2005) takes place within each slug and (b) the concentrationgradients between adjacent slugs lead to the diffusion between thephases. In the case of parallel pattern, the flow is laminar and thetransfer of molecules between the two phases is supposed to occuronly by diffusion.
The main problem in the control of flow pattern is due to the flowdependence on the experimental parameters like: the linear velocity(Burns and Ramshaw, 2001), the ratio of the phases, the fluid prop-erties (Burns et al., 1998; Burns and Ramshaw, 1999), the channelgeometries (Kashid and Agar, 2007) and the construction material(Ahmed et al., 2006) of the microreactor. Therefore, all these param-eters must be considered simultaneously. In practice, flow patternmaps are used to define the influence of different parameters on the
4036 A.-L. Dessimoz et al. / Chemical Engineering Science 63 (2008) 4035 -- 4044
Channel wall
Organic phase
Aqueous phase
Fig. 1. Types of liquid–liquid two-phase flow patterns in glass microreactors: (A)slug flow; (B) parallel flow.
Table 1Dimensionless numbers
Reynolds numberInertial forcesViscous forces
Re = � · u · dH�
Weber numberInertial forces
Liquid–liquid surface tensionWe = u2 · dH · �
�
Capillary numberViscous forces
Liquid–liquid surface tensionCa = � · u
�
hydrodynamics. In so-called flow pattern maps, the axes representthe superficial velocities or the volumetric flow rates of both phasesand the flow patterns are plotted with distinct markers. Kashid andAgar (2007) made experiments in Y-shaped PTFE capillary microre-actors with a chemical inert system containing water and cyclohex-ane. The effects of the linear velocity, the channel diameter and theratio of the volumetric flow rates on the stability of the slug flowregime were represented in a flow pattern map. Zhao et al. (2006)investigated the stability of different flow patterns using a T-junctionrectangular microreactor made of PMMA with deionised water andkerosene. In the flow pattern map, the phase Weber numbers (Table1) were used. The stability domains of the different flow patterns de-pend on the flow ratio and the volumetric flow rates. However, themodel cannot be applied to different geometries of microchannelsand to other fluids since it is valid only for the specific fluid systemin the specific microreactor. Tice et al. (2004) analysed the condi-tions required to form slugs of aqueous reagents in flows of immisci-ble carrier fluid within rectangular microreactor. Flow pattern mapspresented the water fraction plotted against the Capillary numbers(Table 1). The influence of the fluid viscosity, linear velocity and theratio of the phases on the stability of slug flow were studied. How-ever, systematic experimental study of the effect of fluid properties(�,�,�) on flow patterns stability has not been reported.
In direct link with the hydrodynamics, the mass transfer is ofparticular importance because microstructured devices are mostlyapplied for reacting systems. Parallel flow and slug flow form a well-defined environment for mass transfer during multiphase chemi-cal reactions. The internal circulation that arises in slugs when theymove through the channel have been described and numerical mod-els of mass transfer between slugs have been developed (Dummannet al., 2003; Harries et al., 2003; Kashid et al., 2005). However, onlyBurns and Ramshaw (2001) provide data on mass transfer perfor-mance during chemical reaction based on experimental results forthe slug flow regime without wall film formation. The mass transfercharacteristics for the parallel flow have not been reported so far.Moreover, no clear mathematical description of the mass transferprocess is available for the two flow patterns.
The objective of the present work is to determine the influenceof the fluid properties on liquid–liquid two-phase flow patterns inY- and T-shaped glass microchannels. Moreover, the mass transferperformance for the parallel and slug flow was studied using aninstantaneous neutralisation reaction. A mathematical descriptionbased on a filmmodel is suggested to rationalise the observed results.
2. Experimental
2.1. Materials
The experiments were carried out with a Y- or a T-junctionglass microreactor (MIKROGLAS, Mainz, D) placed in the same set-up shown in Fig. 2. The glass unit was fixed in an aluminium frame.The frame pressed the connection tubes with fittings (ERCATECK P-200Nx and P-245x) onto the glass surface. All the connection tubeswere 1.5mm outer diameter and 0.6mm inner diameter PTFE tubes.The two immiscible liquids were introduced inside the glass mi-croreactor by two syringe pumps (ISMATEC kdScientific 100). Thebehaviour of the fluids in the microchannel was followed under alight source with camera-snapshots (photo camera Panasonic, LumixDMC-LX1 or Canon, EOS 350D).
2.2. Characterisation of liquid–liquid two-phase flow patterns
The influence of the fluid properties on two-phase flow patternswas investigated in each microreactor using deionised water andtoluene. Solutes were added in both phases in order to change thedensity, the viscosity and the interfacial tension of the fluid system.Three series of experiments were executed with the following fluids:(1) water and toluene, (2) water with NaOH 0.15M and toluene,(3) water and toluene with CCl3COOH 0.6M. For the visualisationof the flow, bromothymol blue was added to the aqueous phaseor Sudan III to the organic phase. In each series of experiments,the volumetric flow rate of each phase was varied between 1 and6ml/h. All experiments were performed at ambient temperature andpressure. In order to verify the reproducibility of the experiments,two camera-snapshots were taken for each flow and repeated twice.
2.3. Determination of mass transfer coefficients
For the determination of the global mass transfer coefficient(K1,org) in slug flow and in parallel flow, the neutralisation (Eq. (1))was used as a model reaction. The reaction is instantaneous andtherefore, is controlled by mass transfer. Burns and Ramshaw (2001)used acetic acid. The trichloroacetic acid applied in this study is astrong acid and gives a colour change at pH 7 due to bromothymolblue used as an indicator.
CCl3COOHorg + NaOHaqu → CCl3COO−Na+
aqu + H2O (1)
A saturated solution of bromothymol blue in deionised water wasused to prepare aqueous solutions containing NaOH from 0.1 to0.3M. The trichloroacetic acid was dissolved in toluene or hexanewith the concentration of 0.6M. In some experiments, Sudan III wasadded to the organic phase for flow visualisation. Experiments werecarried out in two microreactors with different concentrations ofNaOH in the aqueous phase (see Table 2). For each series of experi-ments, the total linear velocity was varied between 3 and 46mm/s(2–12ml/h) and the ratio of the organic/aqueous phase was keptconstant 1:1.
Sodium hydroxide is not soluble in the organic phase whereastrichloroacetic acid is soluble in water. Therefore, the trichloroaceticacid has to diffuse through the interface to react with NaOH. Thereaction leads to a colour change (blue → yellow) in the aqueousphase which takes place at pH 7 and indicates the end of the neu-tralisation reaction.
A.-L. Dessimoz et al. / Chemical Engineering Science 63 (2008) 4035 -- 4044 4037
Considering the microreactor as an ideal plug flow reactor, themass balance under steady state conditions can be expressed as:
dCid�R
= Ri (2)
where �R is the time needed to complete the neutralisation reaction.As mentioned above, the reaction is instantaneous and the rate-limiting step is the mass transfer of the trichloroacetic acid. Themolar flux of the acid from the organic to the aqueous phase can beexpressed by (Trambouze and Euzen, 2002):
J1 = K1,org · (C1,org − CE1,org) (3)
where J1 is the molar flux of trichloroacetic acid, K1,org is the globalmass transfer coefficient from organic to aqueous phase, C1,org is
the acid concentration in the organic phase and CE1,org is the acid
concentration at the interface in equilibriumwith the aqueous phase.The rate of disappearance of trichloroacetic acid can be expressed
as:
−R1 = J1 · a = K1,org · (C1,org − CE1,org) · a (4)
Due to the instantaneous reaction taking place in the aqueous phase,the concentration of the acid, C1,aqu, becomes zero close to the in-terface. As a consequence:
CE1,org = m · C1,aqu = 0 ⇒ −R1 = K1,org · C1,org · a (5)
Therefore, the mass balance can be rewritten as:
dCid�R
= −K1,org · a · C1,org (6)
The integration gives the global volumetric mass transfer coefficient:
K1,org · a = − 1�R
· ln(
C1,orgC1,org0
)(7)
The distance along the microchannel before the colour change wasmeasured to calculate the time �R. Moreover, the colour change ap-pears at pH 7 and corresponds to an amount of acid transferred tothe aqueous phase being equivalent to the initial amount of NaOH.So, the acid concentration in the organic phase after the neutralisa-tion reaction is given by:
C1,org = C1,org0 − C2,aqu0 with Qorg = Qaqu (8)
3. Results and discussions
3.1. Liquid–liquid two-phase flow patterns in glass microreactors
In the Y-shapedmicroreactor, the water and toluene system leadsto a parallel flow for all volumetric flow rates. The addition of NaOHin the aqueous phase increases the viscosity, the density of water(Vazquez et al., 1996) and the interfacial tension leading to slug flowobserved for all flow rates. The effect of acid addition to organicphase was also investigated. However, the CCl3COOH is soluble inwater and diffuses through the interface influencing the properties
4038 A.-L. Dessimoz et al. / Chemical Engineering Science 63 (2008) 4035 -- 4044
of the aqueous phase. The trichloroacetic acid increases the den-sity and the viscosity of water (Lide, 2007), but in contrast to theNaOH, it decreases the interfacial tension betweenwater and tolueneresulting in a parallel flow observed for all the flow rates. The val-ues of the interfacial tension corresponding to the addition of acidand base were calculated from the data reported for the water/airsurface tension (Lide, 2007; Weast, 1971), via extrapolation. The sol-vents properties used during the present work are summarised inTable 3.
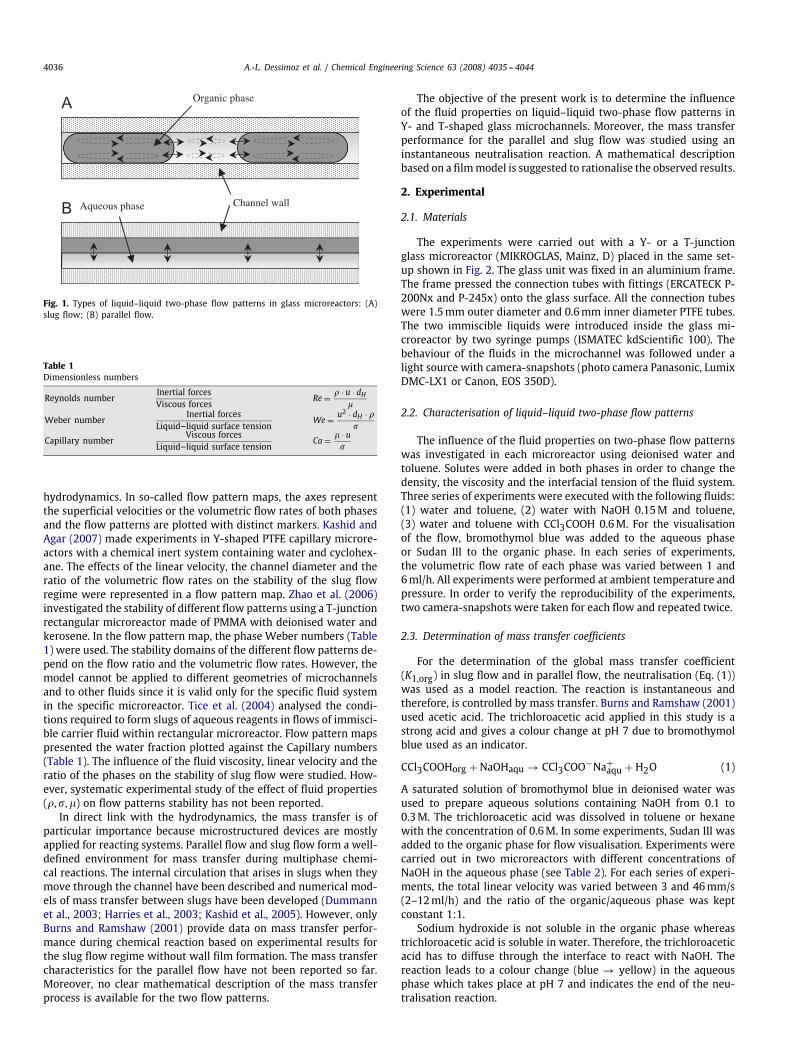
For the T-shaped microreactor the same experiments were car-ried out. The water/toluene system forms a slug flow, which is sta-bilised by the addition of NaOH. The addition of CCl3COOH gives twotypes of flow patterns. The parallel flow appears with an increase ofthe linear velocity. A typical flow pattern map for T-shaped microre-actor is shown in Fig. 3.
In summary, the main parameters varied are the linear velocityand the interfacial tension. The results show that an increase of theinterfacial tension is favourable for slug flow and that a decrease ofthe interfacial tension results in parallel flow. The parallel flow is alsoobserved with an increase of the linear velocity. These experimentsconfirm that the physical properties of fluids influence the observedflow pattern. The theory behind these observations is discussedin the next section and will rationalise the experimental resultsobtained.
Table 3Characteristics of the solvents at 20 ◦C
� [kg/m3] � [Pa s] �water/liquid [kg/s2]
Water 998.2 0.001Toluene 866.7 0.00059 0.0371Hexane 659.4 0.0003 0.0511
Volumetric flow rate of organic phase
10.08.0
5 mm
0.0
2.0
4.0
6.0
8.0
10.0
0.0
[ml/h]
Volu
met
ric fl
ow ra
te o
f aqu
eous
phas
e [m
l/h]
6.04.02.0
Fig. 3. Flow pattern map: example for the T-shaped microreactor. Organic phase= toluene with Sudan III. Aqueous phase=water with NaOH 0.15M and bromothymol blue.
3.2. Analysis of the flow patterns based on Capillary and Reynoldsnumbers
Most of the microfluidic devices operate at low Reynolds number.The Navier–Stokes equation is linear and the flow is laminar. In thecase of multiphase systems, the Reynolds numbers are low, but theflow can be nonlinear due to interactions at the interface betweenthe immiscible fluids (Thorsen et al., 2001). In the case of two-phaseflow in microchannels, the interfacial tension (∼ �/d) and the vis-cous forces (∼ � ·u/d) control the flow patterns because they dependon the channel diameter (Ahmed et al., 2006; Akbar et al., 2003;Kreutzer et al., 2005). The effects of gravity (∼ � · g · H) and inertia(∼ � · u2) become negligible at the micrometer scale (Atencia andBeebe, 2005). The competition between the main forces can be quan-tified using dimensionless numbers (Akbar et al., 2003; Squires andQuake, 2005).
In order to define quantitatively the influence of the interfacialtension and of the linear velocity on the flow patterns, the Capillaryand the Reynolds numbers (Table 1) were calculated for all the ex-periments with equal volumetric flow rates of the two phases. TheCapillary and Reynolds numbers were calculated for each phase andthen the mean value between the two phases was considered. Meandimensionless numbers were used to take in consideration the influ-ence of the properties of both phases on flow patterns. The Capillarynumber was chosen because the viscous forces and the interfacialtension are the dominating forces in microfluidic devices.
For the Y-shaped microreactor (Fig. 4A), the addition of NaOHdecreases slightly the Capillary number in comparison to thewater/toluene system due to the effect of the interfacial tension forthe identical linear velocity. Therefore, the addition of NaOH in theaqueous phase increases the interfacial tension in comparison to vis-cous forces. If the flow of two immiscible fluids is dominated by theinterfacial tension, slugs are formed because the interfacial tension
A.-L. Dessimoz et al. / Chemical Engineering Science 63 (2008) 4035 -- 4044 4039
0.0
2.0x10⁻⁴
4.0x10⁻⁴
6.0x10⁻⁴
8.0x10⁻⁴
1.0x10⁻³
1.2x10⁻³
0.0
2.0x10⁻⁴
4.0x10⁻⁴
6.0x10⁻⁴
8.0x10⁻⁴
1.0x10⁻³
1.2x10⁻³
Water/Toluene with acid: Parallel flowWater/Toluene: Parallel flowWater with base/Toluene: Slug flow
Water/Toluene with acid: Parallel flowWater/Toluene with acid: Slug flowWater/Toluene: Slug flowWater with base/Toluene: Slug flow
Remean [-]
Increase viscous forces
Increase interfacial tension
Increase inertial forcesIncrease viscous forces
Parallel flow
Transitionregion
Slug flow
8
0 2 4 6Remean [-]
8
Fig. 4. Flow transition maps based on mean Capillary and mean Reynolds numbersfor flow ratio of 1: (A) Y-shaped microreactor; (B) T-shaped microreactor.
Organic phase
Aqueous phase
End of reaction
Organic phase
End of reaction
5 mm
5 mm
Aqueous phase
Fig. 5. (A) Neutralisation reaction with parallel flow. (B) Neutralisation reaction with slug flow (on the left a diagram and on the right a photograph).
reduces the interfacial area (Joanicot and Ajdari, 2005; Squires andQuake, 2005).
The acid addition in the organic phase increases the mean Capil-lary number in comparison to the water/toluene system. This meansthat the viscous forces increase in comparison to interfacial tension.Viscosity produces a resistance to shear (Atencia and Beebe, 2005)and the viscous stresses act to extend and drag the interface down-stream (Joanicot and Ajdari, 2005; Squires and Quake, 2005). If theviscous stress is the main forces, a parallel flow will arise.
The increase of the mean Capillary number with the acid addi-tion compared to the water/toluene system is big, but the decreaseof mean Capillary number with the base addition as compared tothe water/toluene system corresponds only to 1%. The Capillary andReynolds numbers for the system with NaOH represent the stabilitylimit for the two types of flow patterns.
For the T-shaped microreactor (Fig. 4B), the same trend wasobserved. Moreover, the effect of the linear velocity was observedfor the acid system. An increase in the linear velocity leads to anincrease in the viscous forces and produces the parallel flow.
As can be observed in Fig. 4, the inertia forces tend to produceslug flow. More precisely, inertia counters parallel movement creat-ing turbulence. For all the experiments reported, the mean Webernumbers are smaller than 1. Therefore, the interfacial tension dom-inates the inertia forces producing slugs. Zhao et al. (2006) showedthat if inertia forces dominate (We>10), the turbulence appears andchaotic or annular flow are observed.
So, the observed flow patterns can be explained by a competitionbetween the main forces due to interfacial tension and viscosity.Comparing two graphs in Fig. 4A and B, it can be seen that stabilitydomains of flow patterns depend on the geometry of the microre-actor: in the T-shaped microreactor the slug flow is easily obtained.These graphs allow predicting the flow patterns for known Reynoldsand Capillary numbers if volumetric flow rates of the two phasesare equal.
3.3. Mass transfer performance of parallel flow and slug flow
Based on the previous results, the Y-shaped microreactor wasused to generate parallel flow and the T-shaped microreactor was
4040 A.-L. Dessimoz et al. / Chemical Engineering Science 63 (2008) 4035 -- 4044
0.000.0
0.1
0.2
0.3
0.4
0.5
0.6
0.7
NaOH 0.2 MNaOH 0.15 MNaOH 0.1 M
K1,
org*
a [s
-1]
K1,
org*
a [s
-1]
u [m/s]
Parallel flow
0.0
0.1
0.2
0.3
0.4
0.5
0.6
0.7
Slug flow Parallel flow
NaOH 0.3 MNaOH 0.2 MNaOH 0.15 M
0.050.040.030.020.01
0.00u [m/s]
0.030.020.01
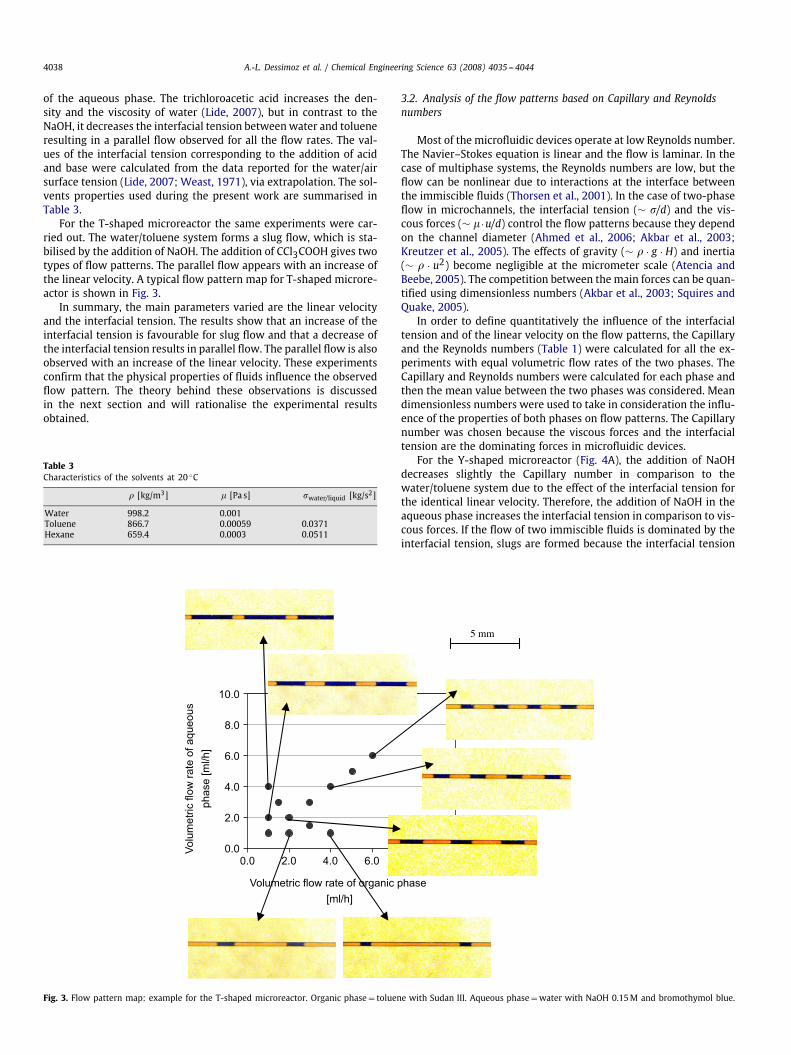
Fig. 6. Volumetric mass transfer coefficient in function of the linear velocity:(A) parallel flow. Organic phase=toluene with CCl3COOH 0.6M and Sudan III.Aqueous phase=water with NaOH and bromothymol blue. (B) Slug flow. Organicphase=hexane with CCl3COOH 0.6M and Sudan III. Aqueous phase=water withNaOH and bromothymol blue.
chosen as suitable to generate slug flow. In the case of a neutralisa-tion reaction, the salt produced by the reaction also influences theflow pattern. To obtain stable slug flow in the T-shaped microreac-tor, the hexane/water system was used instead of toluene/water dueto the higher interfacial tension. This was necessary in order to avoidnon-defined flow patterns. These results confirm the importance offluid properties on the flow pattern produced.
An example of the neutralisation reaction with parallel flow isshown in Fig. 5A. For parallel flow, the values of the global volumetricmass transfer coefficient (K1,org · a) range from 0.2 to 0. 5 s−1. Theydepend on the NaOH concentration and linear velocity (Fig. 6A). Forthe determination of the specific interfacial area, a flat interface in themiddle of the channel was assumed. The specific interfacial area wascalculated based on the volume of the organic phase. A constant valueof 6850m−1 was estimated. The resulting mass transfer coefficient isin the range of 3×10⁻⁵–8×10⁻⁵ m/s for the parallel flow dependingon the NaOH concentration and the linear velocity.
An example of the neutralisation reaction in a slug flow regimeis shown in Fig. 5B. The global volumetric mass transfer coefficientwas found to be approximately 0. 2–0. 5 s−1. As shown in Fig. 6B, thevolumetric mass transfer coefficient for slug flow depends on the
0.000.0
1.0x10⁻⁴
2.0x10⁻⁴
3.0x10⁻⁴
4.0x10⁻⁴
5.0x10⁻⁴
6.0x10⁻⁴
NaOH 0.3 MNaOH 0.2 MNaOH 0.15 M
K1,
org
with
out f
ilm [m
/s]
K1,
org
with
film
[m/s
]
u [m/s]
0.0
1.0x10⁻⁵
2.0x10⁻⁵
3.0x10⁻⁵
4.0x10⁻⁵
5.0x10⁻⁵
6.0x10⁻⁵
NaOH 0.3 MNaOH 0.2 MNaOH 0.15 M
0.030.020.01
0.00u [m/s]
0.030.020.01
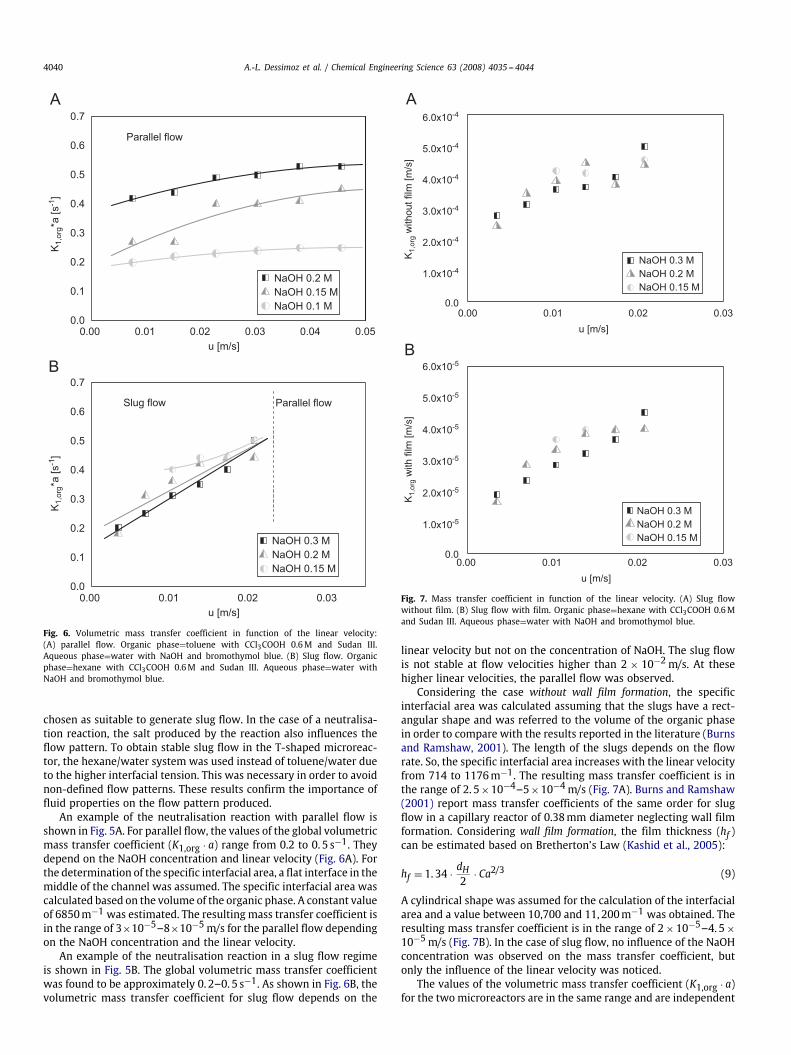
Fig. 7. Mass transfer coefficient in function of the linear velocity. (A) Slug flowwithout film. (B) Slug flow with film. Organic phase=hexane with CCl3COOH 0.6Mand Sudan III. Aqueous phase=water with NaOH and bromothymol blue.
linear velocity but not on the concentration of NaOH. The slug flowis not stable at flow velocities higher than 2 × 10⁻² m/s. At thesehigher linear velocities, the parallel flow was observed.
Considering the case without wall film formation, the specificinterfacial area was calculated assuming that the slugs have a rect-angular shape and was referred to the volume of the organic phasein order to compare with the results reported in the literature (Burnsand Ramshaw, 2001). The length of the slugs depends on the flowrate. So, the specific interfacial area increases with the linear velocityfrom 714 to 1176m−1. The resulting mass transfer coefficient is inthe range of 2. 5×10⁻⁴–5×10⁻⁴ m/s (Fig. 7A). Burns and Ramshaw(2001) report mass transfer coefficients of the same order for slugflow in a capillary reactor of 0.38mm diameter neglecting wall filmformation. Considering wall film formation, the film thickness (hf )can be estimated based on Bretherton’s Law (Kashid et al., 2005):
hf = 1. 34 · dH2
· Ca2/3 (9)
A cylindrical shape was assumed for the calculation of the interfacialarea and a value between 10,700 and 11, 200m−1 was obtained. Theresulting mass transfer coefficient is in the range of 2× 10⁻⁵–4. 5×10⁻⁵ m/s (Fig. 7B). In the case of slug flow, no influence of the NaOHconcentration was observed on the mass transfer coefficient, butonly the influence of the linear velocity was noticed.
The values of the volumetric mass transfer coefficient (K1,org · a)for the two microreactors are in the same range and are independent
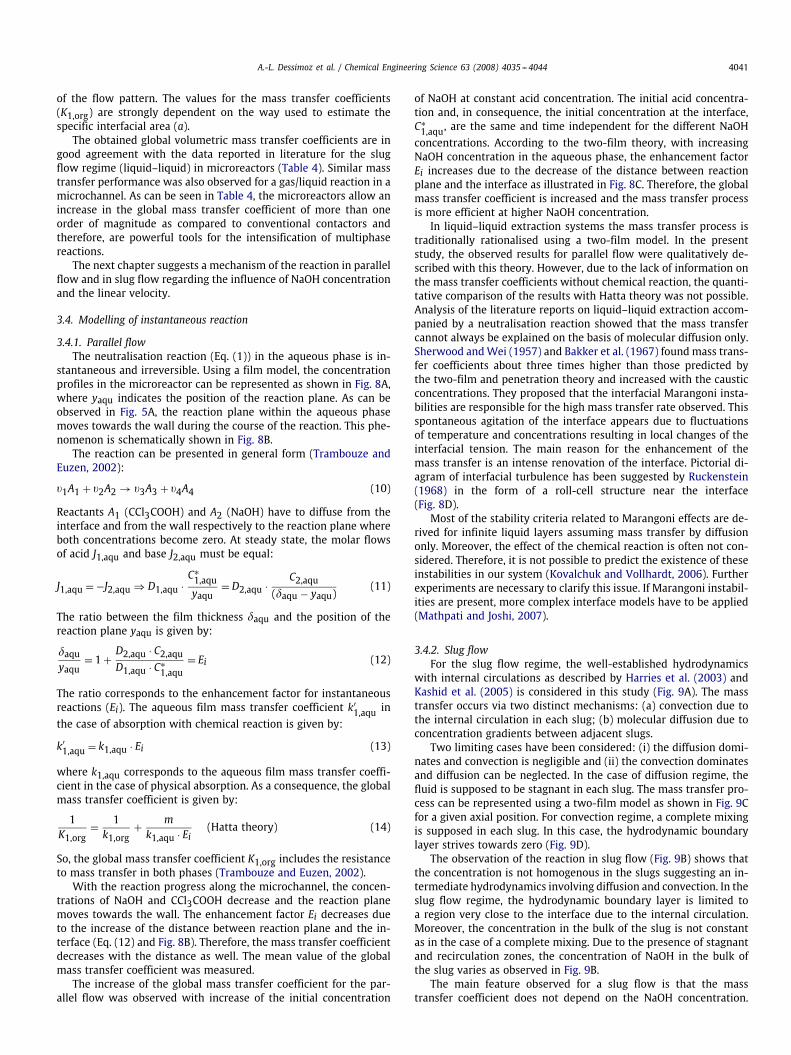
A.-L. Dessimoz et al. / Chemical Engineering Science 63 (2008) 4035 -- 4044 4041
of the flow pattern. The values for the mass transfer coefficients(K1,org) are strongly dependent on the way used to estimate thespecific interfacial area (a).
The obtained global volumetric mass transfer coefficients are ingood agreement with the data reported in literature for the slugflow regime (liquid–liquid) in microreactors (Table 4). Similar masstransfer performance was also observed for a gas/liquid reaction in amicrochannel. As can be seen in Table 4, the microreactors allow anincrease in the global mass transfer coefficient of more than oneorder of magnitude as compared to conventional contactors andtherefore, are powerful tools for the intensification of multiphasereactions.
The next chapter suggests a mechanism of the reaction in parallelflow and in slug flow regarding the influence of NaOH concentrationand the linear velocity.
3.4. Modelling of instantaneous reaction
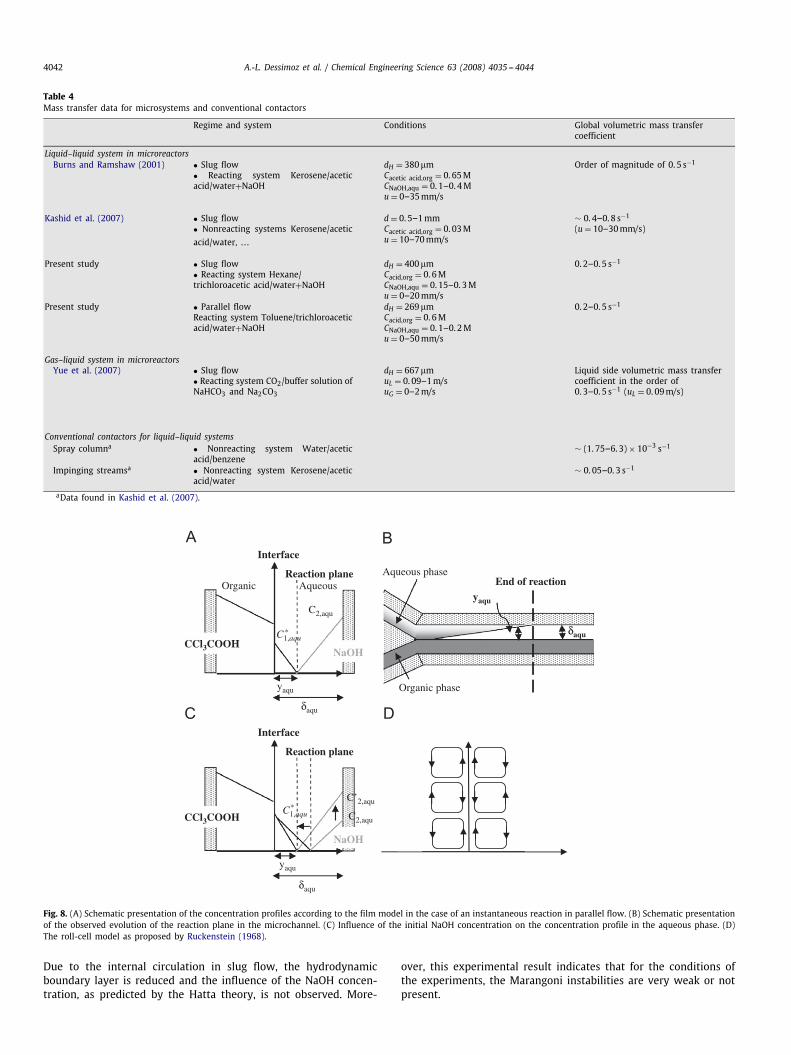
3.4.1. Parallel flowThe neutralisation reaction (Eq. (1)) in the aqueous phase is in-
stantaneous and irreversible. Using a film model, the concentrationprofiles in the microreactor can be represented as shown in Fig. 8A,where yaqu indicates the position of the reaction plane. As can beobserved in Fig. 5A, the reaction plane within the aqueous phasemoves towards the wall during the course of the reaction. This phe-nomenon is schematically shown in Fig. 8B.
The reaction can be presented in general form (Trambouze andEuzen, 2002):
�1A1 + �2A2 → �3A3 + �4A4 (10)
Reactants A1 (CCl3COOH) and A2 (NaOH) have to diffuse from theinterface and from the wall respectively to the reaction plane whereboth concentrations become zero. At steady state, the molar flowsof acid J1,aqu and base J2,aqu must be equal:
J1,aqu = −J2,aqu ⇒ D1,aqu ·C∗1,aquyaqu
= D2,aqu · C2,aqu(�aqu − yaqu)
(11)
The ratio between the film thickness �aqu and the position of thereaction plane yaqu is given by:
�aquyaqu
= 1 + D2,aqu · C2,aquD1,aqu · C∗
1,aqu= Ei (12)
The ratio corresponds to the enhancement factor for instantaneousreactions (Ei). The aqueous film mass transfer coefficient k′
1,aqu in
the case of absorption with chemical reaction is given by:
k′1,aqu = k1,aqu · Ei (13)
where k1,aqu corresponds to the aqueous film mass transfer coeffi-cient in the case of physical absorption. As a consequence, the globalmass transfer coefficient is given by:
1K1,org
= 1k1,org
+ mk1,aqu · Ei (Hatta theory) (14)
So, the global mass transfer coefficient K1,org includes the resistanceto mass transfer in both phases (Trambouze and Euzen, 2002).
With the reaction progress along the microchannel, the concen-trations of NaOH and CCl3COOH decrease and the reaction planemoves towards the wall. The enhancement factor Ei decreases dueto the increase of the distance between reaction plane and the in-terface (Eq. (12) and Fig. 8B). Therefore, the mass transfer coefficientdecreases with the distance as well. The mean value of the globalmass transfer coefficient was measured.
The increase of the global mass transfer coefficient for the par-allel flow was observed with increase of the initial concentration
of NaOH at constant acid concentration. The initial acid concentra-tion and, in consequence, the initial concentration at the interface,C∗1,aqu, are the same and time independent for the different NaOH
concentrations. According to the two-film theory, with increasingNaOH concentration in the aqueous phase, the enhancement factorEi increases due to the decrease of the distance between reactionplane and the interface as illustrated in Fig. 8C. Therefore, the globalmass transfer coefficient is increased and the mass transfer processis more efficient at higher NaOH concentration.
In liquid–liquid extraction systems the mass transfer process istraditionally rationalised using a two-film model. In the presentstudy, the observed results for parallel flow were qualitatively de-scribed with this theory. However, due to the lack of information onthe mass transfer coefficients without chemical reaction, the quanti-tative comparison of the results with Hatta theory was not possible.Analysis of the literature reports on liquid–liquid extraction accom-panied by a neutralisation reaction showed that the mass transfercannot always be explained on the basis of molecular diffusion only.Sherwood andWei (1957) and Bakker et al. (1967) found mass trans-fer coefficients about three times higher than those predicted bythe two-film and penetration theory and increased with the causticconcentrations. They proposed that the interfacial Marangoni insta-bilities are responsible for the high mass transfer rate observed. Thisspontaneous agitation of the interface appears due to fluctuationsof temperature and concentrations resulting in local changes of theinterfacial tension. The main reason for the enhancement of themass transfer is an intense renovation of the interface. Pictorial di-agram of interfacial turbulence has been suggested by Ruckenstein(1968) in the form of a roll-cell structure near the interface(Fig. 8D).
Most of the stability criteria related to Marangoni effects are de-rived for infinite liquid layers assuming mass transfer by diffusiononly. Moreover, the effect of the chemical reaction is often not con-sidered. Therefore, it is not possible to predict the existence of theseinstabilities in our system (Kovalchuk and Vollhardt, 2006). Furtherexperiments are necessary to clarify this issue. If Marangoni instabil-ities are present, more complex interface models have to be applied(Mathpati and Joshi, 2007).
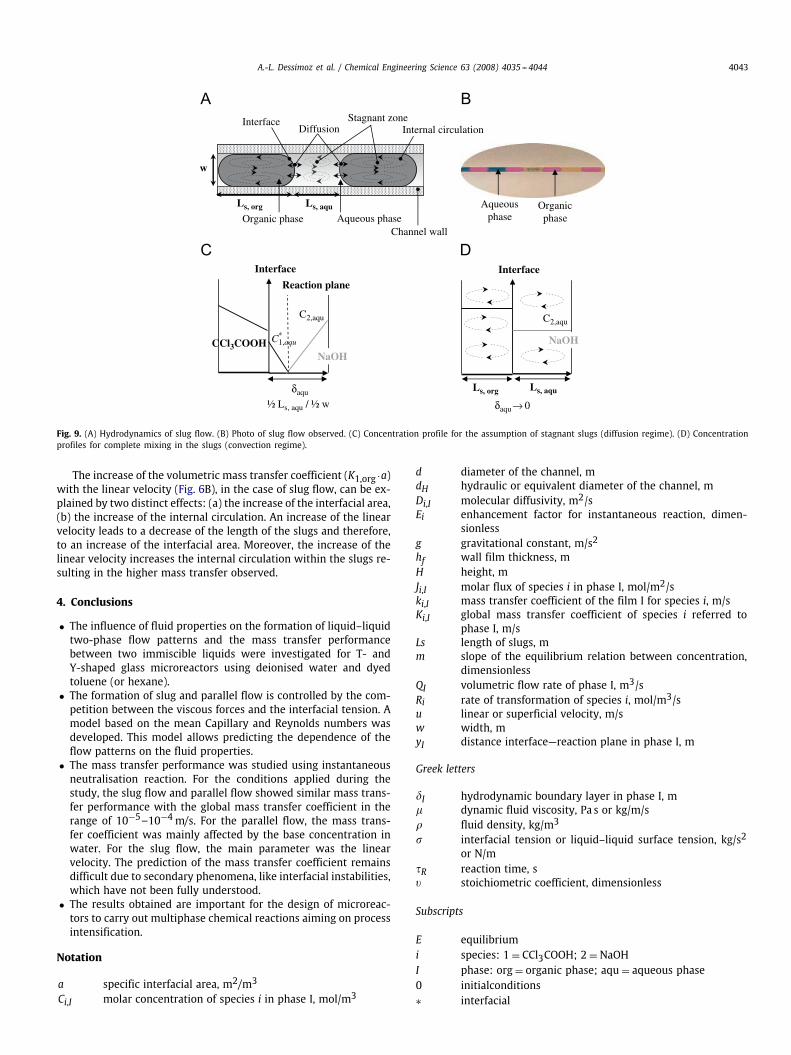
3.4.2. Slug flowFor the slug flow regime, the well-established hydrodynamics
with internal circulations as described by Harries et al. (2003) andKashid et al. (2005) is considered in this study (Fig. 9A). The masstransfer occurs via two distinct mechanisms: (a) convection due tothe internal circulation in each slug; (b) molecular diffusion due toconcentration gradients between adjacent slugs.
Two limiting cases have been considered: (i) the diffusion domi-nates and convection is negligible and (ii) the convection dominatesand diffusion can be neglected. In the case of diffusion regime, thefluid is supposed to be stagnant in each slug. The mass transfer pro-cess can be represented using a two-film model as shown in Fig. 9Cfor a given axial position. For convection regime, a complete mixingis supposed in each slug. In this case, the hydrodynamic boundarylayer strives towards zero (Fig. 9D).
The observation of the reaction in slug flow (Fig. 9B) shows thatthe concentration is not homogenous in the slugs suggesting an in-termediate hydrodynamics involving diffusion and convection. In theslug flow regime, the hydrodynamic boundary layer is limited toa region very close to the interface due to the internal circulation.Moreover, the concentration in the bulk of the slug is not constantas in the case of a complete mixing. Due to the presence of stagnantand recirculation zones, the concentration of NaOH in the bulk ofthe slug varies as observed in Fig. 9B.
The main feature observed for a slug flow is that the masstransfer coefficient does not depend on the NaOH concentration.
4042 A.-L. Dessimoz et al. / Chemical Engineering Science 63 (2008) 4035 -- 4044
Table 4Mass transfer data for microsystems and conventional contactors
Regime and system Conditions Global volumetric mass transfercoefficient
Liquid–liquid system in microreactorsBurns and Ramshaw (2001) • Slug flow dH = 380�m Order of magnitude of 0. 5 s−1
Gas–liquid system in microreactorsYue et al. (2007) • Slug flow
• Reacting system CO2/buffer solution ofNaHCO3 and Na2CO3
dH = 667�muL = 0. 09–1m/suG = 0–2m/s
Liquid side volumetric mass transfercoefficient in the order of0. 3–0. 5 s−1 (uL = 0. 09m/s)
Conventional contactors for liquid–liquid systemsSpray columna • Nonreacting system Water/acetic
acid/benzene∼ (1. 75–6. 3) × 10−3 s−1
Impinging streamsa • Nonreacting system Kerosene/aceticacid/water
∼ 0. 05–0. 3 s−1
aData found in Kashid et al. (2007).
δaqu
yaqu
yaqu
δaqu
C2,aqu
Interface
Aqueous
*C1,aqu
*C1,aqu
OrganicReaction plane
NaOHCCl3COOH
CCl3COOH
Interface
Reaction plane
NaOH
C’2,aqu
C2,aqu
Aqueous phase
Organic phase
End of reactionyaqu
δaqu
Fig. 8. (A) Schematic presentation of the concentration profiles according to the film model in the case of an instantaneous reaction in parallel flow. (B) Schematic presentationof the observed evolution of the reaction plane in the microchannel. (C) Influence of the initial NaOH concentration on the concentration profile in the aqueous phase. (D)The roll-cell model as proposed by Ruckenstein (1968).
Due to the internal circulation in slug flow, the hydrodynamicboundary layer is reduced and the influence of the NaOH concen-tration, as predicted by the Hatta theory, is not observed. More-
over, this experimental result indicates that for the conditions ofthe experiments, the Marangoni instabilities are very weak or notpresent.
A.-L. Dessimoz et al. / Chemical Engineering Science 63 (2008) 4035 -- 4044 4043
Organic phase Aqueous phase Channel wall
Internal circulation Interface
Diffusion Stagnant zone
Aqueousphase
Organicphase
CCl3COOH
δaqu
δaqu 0½ Ls, aqu / ½ w
Interface
*C1,aqu
C2,aqu
NaOH
Ls, aqu
w
Interface
C2,aqu
NaOH
Ls, org
Ls, org Ls, aqu
→
Reaction plane
Fig. 9. (A) Hydrodynamics of slug flow. (B) Photo of slug flow observed. (C) Concentration profile for the assumption of stagnant slugs (diffusion regime). (D) Concentrationprofiles for complete mixing in the slugs (convection regime).
The increase of the volumetric mass transfer coefficient (K1,org ·a)with the linear velocity (Fig. 6B), in the case of slug flow, can be ex-plained by two distinct effects: (a) the increase of the interfacial area,(b) the increase of the internal circulation. An increase of the linearvelocity leads to a decrease of the length of the slugs and therefore,to an increase of the interfacial area. Moreover, the increase of thelinear velocity increases the internal circulation within the slugs re-sulting in the higher mass transfer observed.
4. Conclusions
• The influence of fluid properties on the formation of liquid–liquidtwo-phase flow patterns and the mass transfer performancebetween two immiscible liquids were investigated for T- andY-shaped glass microreactors using deionised water and dyedtoluene (or hexane).
• The formation of slug and parallel flow is controlled by the com-petition between the viscous forces and the interfacial tension. Amodel based on the mean Capillary and Reynolds numbers wasdeveloped. This model allows predicting the dependence of theflow patterns on the fluid properties.
• The mass transfer performance was studied using instantaneousneutralisation reaction. For the conditions applied during thestudy, the slug flow and parallel flow showed similar mass trans-fer performance with the global mass transfer coefficient in therange of 10−5–10−4 m/s. For the parallel flow, the mass trans-fer coefficient was mainly affected by the base concentration inwater. For the slug flow, the main parameter was the linearvelocity. The prediction of the mass transfer coefficient remainsdifficult due to secondary phenomena, like interfacial instabilities,which have not been fully understood.
• The results obtained are important for the design of microreac-tors to carry out multiphase chemical reactions aiming on processintensification.
Notation
a specific interfacial area, m2/m3
Ci,I molar concentration of species i in phase I, mol/m3
d diameter of the channel, mdH hydraulic or equivalent diameter of the channel, mDi,I molecular diffusivity, m2/sEi enhancement factor for instantaneous reaction, dimen-
sionlessg gravitational constant, m/s2
hf wall film thickness, mH height, mJi,I molar flux of species i in phase I, mol/m2/ski,I mass transfer coefficient of the film I for species i, m/sKi,I global mass transfer coefficient of species i referred to
phase I, m/sLs length of slugs, mm slope of the equilibrium relation between concentration,
dimensionlessQI volumetric flow rate of phase I, m3/sRi rate of transformation of species i, mol/m3/su linear or superficial velocity, m/sw width, myI distance interface—reaction plane in phase I, m
Greek letters
�I hydrodynamic boundary layer in phase I, m� dynamic fluid viscosity, Pa s or kg/m/s� fluid density, kg/m3
� interfacial tension or liquid–liquid surface tension, kg/s2
or N/m�R reaction time, s� stoichiometric coefficient, dimensionless
4044 A.-L. Dessimoz et al. / Chemical Engineering Science 63 (2008) 4035 -- 4044
Acknowledgements
Financial support by the Swiss National Science Foundation andthe Swiss Commission for Technology and Innovation (CTI) is grate-fully acknowledged.
References
Ahmed, B., Barrow, D., Wirth, T., 2006. Enhancement of reaction rates by segmentedfluid flow in capillary scale reactors. Advanced Synthesis and Catalysis 348,1043–1048.
Akbar, M.K., Plummer, D.A., Ghiaasiaan, S.M., 2003. On gas–liquid two-phase flowregimes in microchannels. International Journal of Multiphase Flow 29, 855–865.
Atencia, J., Beebe, D.J., 2005. Controlled microfluidic interfaces. Nature 437, 648–655.Bakker, C.A.P., Fentener van Vlissingen, F.H., Beek, W.J., 1967. The influence of
the driving force in liquid–liquid extraction—a study of mass transfer withand without interfacial turbulence under well-defined conditions. ChemicalEngineering Science 22, 1349–1355.
Burns, J.R., Ramshaw, C., 1999. Development of a microreactor for chemicalproduction. Transactions of the Institution of Chemical Engineers 77, 206–211.
Burns, J.R., Ramshaw, C., 2001. The intensification of rapid reactions in multiphasesystems using slug flow in capillaries. Lab on a Chip 1, 10–15.
Burns, J.R., Ramshaw, C., Harston, P., 1998. Development of a microreactor forchemical production. Topical Conference Preprints: Process Miniaturization-IMRET2: 2nd International Conference on Microreaction Technology, NewOrleans, Louisiana, pp. 39–44.
Dummann, G., Quittmann, U., Groschel, L., Agar, D.W., Worz, O., Morgenschweis, K.,2003. The capillary-microreactor: a new reactor concept for the intensificationof heat and mass transfer in liquid–liquid reactions. Catalysis Today 79–80,433–439.
Ehrfeld, W., Hessel, V., Lowe, H., 2000. State of the art of microreaction technology.Microreactors: New Technology for Modern Chemistry. Wiley-VCH, Weinheim.pp. 1–14.
Harries, N., Burns, J.R., Barrow, D.A., Ramshaw, C., 2003. A numerical model forsegmented flow in a microreactor. International Journal of Heat and MassTransfer 46, 3313–3322.
Hessel, V., Lowe, H., 2005. Organic synthesis with microstructured reactors. ChemicalEngineering and Technology 28, 267–284.
Jahnisch, K., Hessel, V., Lowe, H., Baerns, M., 2004. Chemistry in microstructuredreactors. Angewandte Chemie International Edition 43, 406–446.
Joanicot, M., Ajdari, A., 2005. Droplet control for microfluidics. Science 309, 887–888.Kashid, M.N., Agar, D.W., 2007. Hydrodynamics of liquid–liquid slug flow capillary
microreactor: flow regimes, slug size and pressure drop. Chemical EngineeringJournal 131, 1–13.
Kashid, M.N., Gerlach, I., Goetz, S., Franzke, J., Acker, J.F., Platte, F., Agar, D.W., Turek,S., 2005. Internal circulation within the liquid slugs of a liquid–liquid slug-flow capillary microreactor. Industrial and Engineering Chemistry Research 44,5003–5010.
Kashid, M.N., Harshe, Y.M., Agar, D.W., 2007. Liquid–liquid slug flow in a capillary:an alternative to suspended drop or film contactors. Industrial and EngineeringChemistry Research 46, 8420–8430.
Kiwi-Minsker, L., Renken, A., 2005. Microstructured reactors for catalytic reactions.Catalysis Today 110, 2–14.
Kovalchuk, N.M., Vollhardt, D., 2006. Marangoni instability and spontaneous non-linear oscillations produced at liquid interfaces by surfactant transfer. Advancesin Colloid and Interface Science 120, 1–31.
Kreutzer, M.T., Kapteijn, F., Moulijn, J.A., Heiszwolf, J.J., 2005. Multiphase monolithreactors: chemical reaction engineering of segmented flow in microchannels.Chemical Engineering Science 60, 5895–5916.
Lide, D.R. (Ed.). 2007. CRC Handbook of Chemistry and Physics, Internet Version2007, 87th ed. Taylor and Francis Boca Raton, FL 〈http://www.hbcpnetbase.com〉.
Lomel, S., Falk, L., Commenge, J.M., Houzelot, J.L., Ramdani, K., 2006. The microreactor.A systematic and efficient tool for the transition from batch to continuousprocess. Transactions of the Institution of Chemical Engineers, Part A, ChemicalEngineering Research and Design 84, 1–7.
Lowe, H., Ehrfeld, W., 1999. State-of-the-art in microreaction technology: concepts,manufacturing and applications. Electrochimica Acta 44, 3679–3689.
Mathpati, C.S., Joshi, J.B., 2007. Insight into theories of heat and mass transferat the solid–fluid interface using direct numerical simulation and large Eddysimulation. Industrial and Engineering Chemistry Research 46, 8525–8557.
Ruckenstein, E., 1968. Mass transfer in the case of interfacial turbulence inducedby the Marangoni effect. International Journal of Heat and Mass Transfer 11,1753–1760.
Tice, J.D., Lyon, A.D., Ismagilov, R.F., 2004. Effects of viscosity on droplet formationand mixing in microfluidic channels. Analytica Chimica Acta 507, 73–77.
Trambouze, P., Euzen, J.-P., 2002. Les Reacteurs chimiques; De la conception a lamise en oeuvre. Ed. Technip, Paris.
Vazquez, G., Alvarez, E., Varela, R., Cancela, A., Navaza, J.M., 1996. Density andviscosity of aqueous solutions of sodium dithionite, sodium hydroxide, sodiumdithionite+sucrose, and sodium dithionite+sodium hydroxide+sucrose from25 ◦C to 40 ◦C. Journal of Chemical and Engineering Data 41, 244–248.
Weast, R.C., Ed., 1971. CRC Handbook of Chemistry and Physics. 52nd ed. ChemicalRubber, Cleveland, OH.
Yue, J., Chen, G., Yuan, Q., Luo, L., Gonthier, Y., 2007. Hydrodynamics and masstransfer characteristics in gas–liquid flow through a rectangular microchannel.Chemical Engineering Science 62, 2096–2108.