228
The Single Market Review h>** SUBSERIES I: IMPACT ON MANUFACTURING Volume 5 Ch

The Single Market Review
h>**
SUBSERIES I: IMPACT ON
MANUFACTURING
Volume 5
Ch


The Single ¿Ucirfaet Reviei
M P A C T O N M A N U F A C T U R I N G
CHEMICALS

The Single Market Review series Subseries Volume:
Subseries Volume:
Subseries Volume:
Subseries Volume:
Subseries Volume:
Subseries Volume:
I — 1 2 3 4 5 6 7 8
II -1 2 3 4 5 6 7 8 9 10 11
III -1 2 3 4 5 6
IV -1 2 3 4
V -1 2 3 4
VI -1 2 3 4 5
Impact on manufacturing Food, drink and tobacco processing machinery Pharmaceutical products Textiles and clothing Construction site equipment Chemicals Motor vehicles Processed foodstuffs Telecommunications equipment
Impact on services Insurance Air transport Credit institutions and banking Distribution Road freight transport Telecommunications: liberalized services Advertising Audio-visual services and production Single information market Single energy market Transport networks
- Dismantling of barriers Technical barriers to trade Public procurement Customs and fiscal formalities at frontiers Industrial property rights Capital market liberalization Currency management costs
- Impact on trade and investment Foreign direct investment Trade patterns inside the single market Trade creation and trade diversion External access to European markets
Impact on competition and scale effects Price competition and price convergence Intangible investments Competition issues Economies of scale
- Aggregate and regional impact Regional growth and convergence The cases of Greece, Spain, Ireland and Portugal Trade, labour and capital flows: the less developed regions Employment, trade and labour costs in manufacturing Aggregate results of the single market programme
Results of the business survey

E U R O P E A N C O M M I S S I O N
The S¿ngie 2kícLrfcet Review
M P A C T O N M A N U F A C T U R I N G
CHEMICALS
The S ¿ni/¿e JUarket Re f i e tv
S U B S E R I E S I : V O L U M E 5
OFFICE FOR OFFICIAL PUBLICATIONS OF THE EUROPEAN COMMUNITIES
K O G A N PAGE . E A R T H S C A N

This report is part of a series of 39 studies commissioned from independent consultants in the context of a major review of the Single Market. The 1996 Single Market Review responds to a 1992 Council of Ministers Resolution calling on the European Commission to present an overall analysis of the effectiveness of measures taken in creating the Single Market. This review, which assesses the progress made in implementing the Single Market Programme, was coordinated by the Directorate-General 'Internal Market and Financial Services' (DG XV) and the Directorate-General 'Economic and Financial Affairs' (DG II) of the European Commission.
This document was prepared for the European Commission
by
KPMG It does not, however, express the Commission's official views. Whilst every reasonable effort has been made to provide accurate information in regard to the subject matter covered, the Consultants are not responsible for any remaining errors. All recommendations are made by the Consultants for the purpose of discussion. Neither the Commission nor the Consultants accept liability for the consequences of actions taken on the basis of the information contained herein.
The European Commission would like to express thanks to the external experts and representatives of firms and industry bodies for their contribution to the 1996 Single Market Review, and to this report in particular.
© European Communities, 1997
No part of this book may be reproduced, stored in a retrieval system, or transmitted in any form or by any means, electronic, mechanical, photocopying, recording or otherwise without written permission from the copyright holder.
Office for Official Publications of the European Communities 2 rue Mercier, L-2985 Luxembourg ISBN 92-827-8772-9 Catalogue number: C1-67-96-005-EN-C
Kogan Page.Earthscan 120 Pentonville Road, London N1 9JN ISBN 0 7494 2309 9

I'ablc of contents
Table of contents
List of tables ix
List of figures χ
List of abbreviations xii
1. Summary 1
2. Introduction 5
2.1. Purpose of the study 5 2.2. Methodology 5 2.3. Report structure 8 2.4. Sectors covered 8 2.5. Relevance of the sector with regard to the single market 8 2.6. Overview 9
2.6.1. Basic industrial chemicals, excluding petrochemicals 13 2.6.2. Petrochemicals 14 2.6.3. Paints, varnishes, coatings and printing inks 16 2.6.4. Agrochemicals 17 2.6.5. Man-made fibres 19 2.6.6. Speciality, maintenance and other chemicals 20
3. Legal and administrative measures taken to complete the single market 23
3.1. Implementation of sector-specific measures 24 3.1.1. List of measures 24 3.1.2. Nature of the barriers to cross-border transactions 25 3.1.3. Manner in which these measures are intended to overcome the barriers 26 3.1.4. Assessment of their functioning in practice, including aspects of timing,
transposition, enforcement and redress 27 3.1.5. Relevance for small and medium-sized firms 28
3.2. Horizontal measures with an impact on the sector 28 3.2.1. Environment 28 3.2.2. Technical standards 30 3.2.3. Employment legislation 31 3.2.4. Competition policy 31 3.2.5. Other horizontal measures 33
3.3. Effectiveness of measures 33 3.4. Remaining legal or administrative obstacles and/or shortcomings 34
3.4.1. Energy 35 3.4.2. Environment 35 3.4.3. Chemical legislation 36 3.4.4. Intellectual and industrial property rights 36 3.4.5. Competition policy 36

Chemicals
3.4.6. Summary of measures and perceived impacts 37
4. Impact of the single market programme on sectoral performance 39
4.1. Changes in market access resulting from the SMP 39 4.1.1. Aggregate data 39 4.1.2. Survey results 50 4.1.3. Conclusions 63
4.2. Development of cross-border sales and marketing 64 4.2.1. Aggregate data 64 4.2.2. Survey results 64 4.2.3. Conclusions 66
4.3. Scale and scope effects and foreign direct investment 66 4.3.1. Aggregate data 67 4.3.2. Turnover 67 4.3.3. Number of companies 68 4.3.4. Plant size 69 4.3.5. Mergers and acquisitions 71 4.3.6. Survey results 73 4.3.7. Foreign direct investment 74 4.3.8. Conclusions 78
4.4. Sourcing patterns and upstream/downstream linkages 79 4.4.1. Aggregate data 79 4.4.2. Survey results 79 4.4.3. Conclusions 79
4.5. Changes in competition, price differentials and market concentration 80 4.5.1. Aggregate data 80 4.5.2. Survey results 83 4.5.3. Conclusions 90
4.6. Direct short-term impact on costs 90 4.6.1. Aggregate data 90 4.6.2. Environmental expenditure 91 4.6.3. Survey results 92 4.6.4. Conclusion 97
4.7. Productivity and competitiveness 98 4.7.1. Aggregate data 98 4.7.2. Labour costs 98 4.7.3. Survey results 100 4.7.4. Conclusion 101
4.8. Effects on employment 101 4.8.1. Aggregate data 102 4.8.2. Conclusions 103
4.9. Contribution to sustainable development 104 4.9.1. Aggregate data 104 4.9.2. Survey results 105 4.9.3. Conclusions 105

Table of contents
5. Corporate strategy 107
5.1. Implications of the single market programme for corporate strategy and nature of strategic responses 107
5.2. Corporate strategy - Case studies 109 5.2.1. German agrochemicals company 109 5.2.2. Italian fibres company 109 5.2.3. UK plastics company 110
111 111
113
113 113 114 114 115 116 117 117 118 118 119 119 120 120 121 121 122 122 123 123 124 124 125 126 127 127 128
129
130 130 130 130 130 132
5.3. 5.4.
6.
6.1.
6.2.
6.3.
6.4.
Conclusions A synthesis of results
Case studies
German agrochemicals company 6.1.1. Company background 6.1.2. Products and markets 6.1.3. Production and productivity 6.1.4. Impact of single market legislation and initiatives 6.1.5. Product registration 6.1.6. Trade barriers 6.1.7. Pricing 6.1.8. Corporate strategy 6.1.9. Conclusions Italian fibres company 6.2.1. Company background 6.2.2. Impact of single market legislation and initiatives 6.2.3. Environmental legislation 6.2.4. Taxation and company legislation 6.2.5. Harmonization of technical standards and procedures 6.2.6. Pricing 6.2.7. Production and productivity 6.2.8. Impact of internal legislation on the cost base 6.2.9. Conclusion UK plastics company 6.3.1. C ompany background 6.3.2. Impact of single market legislation and initiatives 6.3.3. Production and productivity 6.3.4. Employment 6.3.5. Corporate strategy Conclusions
Appendix A: Major data source differences
Appendix B: Details of the petrochemicals sector
B.l. Base petrochemicals B.l.l. Olefins B.l.2. Aromatics Β. 1.3. Ethylene Β. 1.4. Propylene

Chemicals
Β. 1.5. Butadiene 132 Β. 1.6. Higher olefins 133 Β. 1.7. Benzene 133
Appendix C: Intra-EC imports as a share of total imports, by country and sector 135
Appendix Dl: Intra-EC exports as a share of total exports, by country and sector 137
Appendix D2: Foreign direct investment data 138
Appendix E: Regression results, analysis and data 140
E. 1. Background to the regression analysis 140 E.2. General specification of the explanatory variables used in the export share
and import penetration models 140 E.3. Specification for the share of intra-EC exports to total EC exports 141
E.3.1. Specification for the share of intra-EC exports to total EC exports by sector 141
E.3.2. Specification for intra-EC penetration and total EC penetration 142 E.3.3. Specification for the share of intra-EC penetration and total EC
penetration by sector 143 E.3.4. Specification for mergers and acquisitions 144
E.4. Description of the regression terminology 145 E.5. Regression output for the best specifications 146
E.5.1. Intra-EC exports to total EC exports 146 E.5.2. Import penetration 149
Appendix F: Postal questionnaire and face-to-face interview responses 154
Appendix G: Ethylene and propylene production capacity, by country
and plant 166
Appendix H: Number of companies 170
Appendix II: Employee numbers 172
Appendix 12: Energy consumption and CO2 emissions 176
Appendix J: Methodology 177
Appendix Kl: Face-to-face interview questionnaire 180 Appendix K2: Postal survey questionnaire 197 Appendix L: List of companies and trade associations interviewed 205
Bibliography 207

List of tables
List of tables
Table 2.1. Table 2.2. Table 2.3.
Table 3.1.
Table 4.1. Table 4.2. Table 4.3.
Table 4.4.
Table 4.5. Table 4.6. Table 4.7. Table 4.8.
Table 6.1.
T a b l e d . Table C.2. Table C.3. Table C.4.
EC chemicals postal survey: characteristics of the sample 6 Chemicals industry production by sector in the EC 9 Distribution across EC countries of extra-EC exports and imports 15
Brief summary of aims and expected impact of legislation 3 8
Regression results: dependent variable import penetration, 1980-92 43 Intra-EC to total exports (%) by country and sector 45 Regression results: dependent variable share of intra-EC exports, 1980-92 47 Percentage of companies with sales in other EC countries - excluding non-replies 66 Potential for economies of scale in some chemical sectors 67 Mergers and acquisitions in the chemicals industry 72 Real price trends and impact of the SMP 87 Environmental costs as a proportion of cost of sales 92
Distribution in the European agrochemicals sector 114
Intra-EC imports as a share of total imports by country 135 Intra-EC imports as a share of total EC imports by sector 135 Total import penetration 136 Intra-EC import penetration 136
Table D. 1.1. Intra-EC exports as a share of total EC exports by country 13 7 Table D.1.2. Intra-EC exports as a share of total EC exports by sector 137 Table D.2.1. Net FDI in reporting country 138 Table D.2.2. Net FDI from reporting country 139
Table E. 1. Model specification for intra-EC exports/equations and regression results, 1980-92 141
Table E.2. Model specification/equations and regression results, 1980-92 142 Table E.3. Model specification/equations for intra-EC and total EC import penetration
and regression results, 1980-92 143 Table E.4. Model specification/equations for intra-EC and total imports penetration
by sector and regression results, 1980-92 144 Table E.5. Export share data 153 Table E.6. M&As data 153
Table G. 1. Ethylene production capacity by country and by plant Table G.2. Propylene production capacity by country and by plant
Table L. 1. Companies interviewed Table L.2. Trade associations interviewed
167 168
206 206

Chemicals
List of figures
Figure 2.1. Chemicals industry production by sector in the EC, 1994 9 Figure 2.2. World chemical turnover 10 Figure 2.3. Turnover percentage share in the EC, 1993 10 Figure 2.4. GDP and chemical sector turnover in the EC 11 Figure 2.5. Performance indicators of the chemical sector in the EC 11 Figure 2.6. ECU/US$ exchange rate and nominal chemical sector turnover in the EC 12 Figure 2.7 EU real turnover of basic industrial chemicals (1990 prices) 13 Figure 2.8. Contribution of European countries to 1992 volume production in paints
and varnishes 17 Figure 2.9. The global agrochemical market, 1993 18 Figure 2.10. EC synthetic fibres real turnover 20 Figure 2.11. EC speciality and other chemicals real turnover 21
Figure 4.1. Intra-EC exports as a % of total exports, 1993 40 Figure 4.2. Intra-EC imports as a % of total imports, 1993 40 Figure 4.3. Index of intra-EC and total EC exports 44 Figure 4.4. Real chemical sector trade balance in Europe, the USA and Japan 46 Figure 4.5. Intra-EC and total exports for basic industrial chemicals and petroleum 48 Figure 4.6. Intra-EC exports and total exports in the man-made fibres industry 49 Figure 4.7. Intra-EC exports and total exports in paints, varnishes and printing inks 49 Figure 4.8. Intra-EC import penetration for paints, varnishes and inks in four EC
countries 50 Figure 4.9. Impact of single market measures on overcoming barriers and
obstacles to trade 52 Figure 4.10. Impact of specific chemical legislation measures on overcoming
barriers and obstacles to trade 56 Figure 4.11. Impact of other EC initiatives on overcoming barriers and obstacles to trade 57 Figure 4.12. Remaining obstacles to trade 61 Figure 4.13. Dismantling barriers to cross-border trade, by sector 62 Figure 4.14. Dismantling barriers to cross-border trade, by country 62 Figure 4.15. Relative significance of the SMP 63 Figure 4.16. Impact of the SMP on ability to sell/export to other countries, by sector 64 Figure 4.17. Impact of the SMP on ability to sell/export to other EC countries, by
country 65 Figure 4.18. Real turnover, 1980-92 68 Figure 4.19. Number of companies in the UK, France and Spain 69 Figure 4.20. Average ethylene plant size, EC, 1985-95 69 Figure 4.21. Average ethylene plant size, France, 1985-95 70 Figure 4.22. Average ethylene plant size, UK, 1985-95 70 Figure 4.23. Average ethylene plant size, Germany, 1985-95 71 Figure 4.24. Average propylene plant size, EC, 1985-95 71 Figure 4.25. Intra-EC M&As 72 Figure 4.26. Into-EC M&As 73 Figure 4.27. Impact of the SMP on cross-border M&As and joint ventures 74 Figure 4.28. Impact of the SMP on cross-border M&As and joint ventures 74 Figure 4.29a. Ownership of capacity, UK, ethylene, 1985-95 75

List of figures
Figure 4.29b. Ownership of capacity, UK, propylene, 1985-95 75 Figure 4.30a. Net FDI from Germany to destination of investment 76 Figure 4.30b. Net FDI from the UK to destination of investment 76 Figure 4.30c. Net FDI from France to destination of investment 77 Figure 4.30d. Net FDI from EC 12 to destination of investment 77 Figure 4.30e. Net FDI in EC 12 by origin of source 78 Figure 4.31. Gross operating surplus and producer price minus unit labour costs 82 Figure 4.32. Gross operating surplus as a percentage of turnover in the USA and the EC 83 Figure 4.33. Impact of the SMP on entry, by sector 84 Figure 4.34. Impact of the SMP on entry, by country 84 Figure 4.35. Impact of the SMP on entry, by origin of entrants 85 Figure 4.36. The impact of the SMP on competition, by sector 86 Figure 4.37. The impact of the SMP on competition, by country 86 Figure 4.38. Cost trends resulting from increased competition, by sector 88 Figure 4.39. Cost trends resulting from increased competition, by country 89 Figure 4.40. Changes in concentration levels resulting from the SMP 89 Figure 4.41. Impact of the SMP on company exit, by country 90 Figure 4.42. Chemical industry capital spending on environmental protection, 1992 91 Figure 4.43a. Direct impact of the SMP and single market measures on costs 92 Figure 4.43b. Direct impact of sector-specific legislation on costs 93 Figure 4.43c. Direct impact of other EC measures oncosts 94 Figure 4.44. Direct impact on costs of environmental legislation, by company size 96 Figure 4.45. Direct impact of legislation on costs 96 Figure 4.46. Direct impact of legislation on costs, by type of cost 97 Figure 4.47. EC chemical industry producer price, unit labour cost and crude oil price 98 Figure 4.48. Real labour costs in the EC 12 99 Figure 4.49. Real labour costs, by country 99 Figure 4.50. Impact of the SMP on sales efforts to non-EC countries, by sector 100 Figure 4.51. Impact of the SMP on sales efforts in non-EC countries, by country 101 Figure 4.52. Employee number changes in European countries 102 Figure 4.53. Change in employment in the chemical sector in the EC, the USA
and Japan 103 Figure 4.54a. Output, fuel consumption and CO2 emissions in the EC 104 Figure 4.54b. Energy consumption per unit of chemical output 105
Figure 5.1. Strategic responses adopted as a result of the SMP 108 Figure 5.2. Response to increased competition resulting from the SMP 108
Figure 6.1. VAT rates by European country 116 Figure 6.2. Italian fibres company: company sales, geographic distribution 119 Figure 6.3. UK plastics company: 1995 cost structure 125
Figure J. 1. Survey results, sectoral split 177 Figure J.2. Survey results, geographical split 178 Figure J.3. Face-to-face interviews, sectoral split 179

Chemicals
List of abbreviations
bn CEFIC DM EC ECN EFTA EC12
ECR ECU Eurostat FDI GATT GDP JV LIT m M&As N/A NACE
NIC SMP tpa USD/USS VAT
Billion European Chemical Industry Council German mark European Community European Chemical News European Free Trade Association Belgium, Denmark, Germany, Greece, Spain, France, Ireland, Italy, Luxembourg. Netherlands, Portugal, United Kingdom European Court Reports European currency unit Statistical Office of the European Communities Foreign direct investment General Agreement on Tariffs and Trade (UN) Gross domestic product Joint venture Italian lira Million Mergers and acquisitions Not available General industrial classification of economic activities within the European Communities Newly industrialized country Single market programme Tonnes per annum US dollar Value added tax

Summary
1. Summary
The objective of this study was to assess the impact of the single market programme (SMP) on the European chemical industry.
The specific aims were to:
(a) establish the extent to which the SMP has facilitated trade in chemicals within the European Community;
(b) assess the extent to which the SMP has increased competition in the EC, through lowering the barriers to trade;
(c) determine the overall impact of the SMP on the competitiveness of the European industry;
(d) explore the possible qualitative impacts of the SMP on areas like environmental performance and job mobility;
(e) indicate the strategies adopted by companies as a response to the SMP; (f) identify the areas where obstacles to trade remain due to differences in interpretation and
implementation of the existing legislation between Member States or the absence of legislation at the European level.
The main sources used for the study were:
(a) analysis of aggregate data on the industry from official statistics at national and European level as well as from industry and trade associations;
(b) a postal survey of 7,000 chemicals companies, which received 377 replies; (c) a face-to-face survey of 60 companies in the industry; (d) three case studies.
The chemicals sector represents an interesting sector within the SMP sectoral study programme because it has always had a relatively high degree of intra-EC and international trade. Indeed, there were no measures specifically in the SMP aimed at the sector but rather a series of amendments to existing common standards for classifying, registering, labelling and marketing dangerous substances and preparations. In addition, the general SMP legislation was expected to make it easier to trade within Europe.
The key conclusions of the study were as follows:
(a) Impact of the single market programme (SMP) on the European chemical industry: The single market programme has reduced obstacles to trade in the European chemical industry and has led to increased competition. This implied lower prices than would otherwise be the case and lower costs, as firms expanded and merged to take advantage of the economies of scale in the industry. According to our survey, however, the SMP and related EC initiatives have led on average to an increase in short-term production costs, but the results vary depending on the nature of the legislation and the type of cost. Environmental legislation is thought to have led to the most significant increases in costs. The available evidence suggests, however, that this has not led to a loss of international market share, mainly because environmental costs are a small proportion of the total.

Chemicals
(b) Relative significance of the SMP: the economic cycle, general market trends and technology were assessed as more significant than the SMP in affecting the development of the European chemical industry over the last ten years.
(c) The SMP and market access: overall, the data support the hypothesis that the SMP has facilitated market access. Intra-EC exports have increased relative to total exports since 1987. This can reasonably be assumed to be the date when companies started to anticipate the SMP in their decisions. The increase in intra-EC trade share to total trade, however, can also be partially attributed to a fall in the European chemical sector trade balance with other major trading blocks.
Intra-EC import penetration also increased at a higher rate between 1987 and 1992 than between 1980 and 1986 although total import penetration increased over the same period too. Regression analysis of the share of intra-EC imports in total chemical imports was found to support the hypothesis. Areas where barriers remain include energy costs and the adoption and implementation of equal standards and procedures.
(d) The SMP and cross-border sales and marketing: the aggregate trade data support the hypothesis that the SMP has facilitated cross-border sales and marketing as do the survey responses which indicate that a significant majority of companies considered that the SMP assisted them, at least to a limited extent, with their sales and export effort to other EC countries. There is little sectoral or geographical variation although the inorganics sector and Greece/Portugal have been affected more positively than the overall average.
(e) The SMP and economies of scale: the available data suggest that the chemical sector has exploited the economies of scale that have existed in the sector over the last 5-10 years. The survey evidence suggests that the SMP has played some role in this process. It also suggests that the SMP facilitated cross-border M&As and joint ventures with one third of the companies considering the single market as the main reason for seeking joint ventures with companies in other EC countries.
(f) The SMP and sourcing: the SMP has facilitated sourcing from the EC but has not had any significant impact on the amount of inputs bought from the EC, over and above the other factors determining sourcing (price and value for money). This is not unexpected given the global nature of the industry and the competitive pressures felt by European manufacturers at a world level.
(g) The SMP, competition and concentration: the aggregate data indicate that there has been a marked reduction in the overall profitability of the chemical sector in Europe. The weakness of the USD and the slowdown in European economic activity have affected the profitability of the sector, in addition to the structural SMP effects. The survey responses revealed, however, that the SMP led to a significant increase in competition, especially in southern European countries. This was translated into lower real prices than would otherwise have been the case and led companies to seek cost reductions through efficiency gains and reductions in overhead costs. Concentration is also considered to have increased, but the increase in competition seems to have outweighed any potentially detrimental effects from increased concentration.

Summary
(h) Short-term direct impact of the SMP on costs: the survey results suggest that on balance the SMP measures and sector-specific legislation may have increased costs, though the results differ by type of cost: certification procedures and harmonization of technical regulations and standards were considered to have increased short-term costs along with legislation on classification and registration of chemicals and labelling. Trade facilitation legislation and transport deregulation have reduced trade related and transport costs as did the liberalization of capital movements for capital and finance costs. In terms of other related EC measures, environmental legislation on pollution control and waste management was considered to have increased costs. A number of companies, however, recognized the benefits of such measures in terms of fairer competition.
(i) The SMP, productivity and competitiveness: productivity and competitiveness should have been affected indirectly by the SMP through the pressures for efficiency exercised through increased competition and through the ability to make cost savings in sourcing and trade related costs. The survey evidence supports this hypothesis. More than 40% of the companies surveyed considered the SMP to have contributed to the significant productivity improvements achieved over the last five to ten years. There is little evidence, however, that the SMP has indirectly helped sales efforts to non-EC countries.
(j) The SMP and employment: employment is affected by the SMP indirectly through two channels: output expansion and efficiency gains. Expansion of output due to lower prices resulting from increased competition should exert a positive effect on employment. Efforts to maintain profitability through efficiency gains would, on the other hand, exert a negative influence on employment. During a period of significant restructuring in the chemical industry, any attribution of observed employment changes to the SMP could therefore be inaccurate and misleading. Our interview survey suggests that the SMP facilitated internal EC job mobility, although some barriers still remain. Health and safety legislation was perceived to have had a beneficial effect by the face-to-face survey participants but this may reflect their relatively bigger size. Legislation related to workers councils had no noticeable impact.
(k) The SMP and environmental performance: there has been a significant trend for improved environmental performance amongst EC chemical companies in response to pressures from customers, the public and interested parties. The SMP has clearly influenced this process with nearly two-thirds of companies in the EC saying that the SMP had some impact on their environmental performance.
(1) The SMP and corporate strategy: the SMP had an impact on strategy through the intensification of competition and the resulting reactions of companies that tried to reduce costs through reorganization and efficiency gains from M&As and investment. Companies also accepted lower profit margins, although this was particularly true of the smaller companies in the sector. When companies were asked about the direct impact of the SMP on their strategy, the responses reveal that the SMP has not affected strategic decisions, over and above the effects identified already. Response categories where some influence was noted are managerial reorganization, internationalism and innovation. The majority of respondents also felt that the SMP did not result in upstream

Chemicals
or downstream integration within the EC, although one in five companies felt the SMP played some role.
(m) Remaining barriers to trade: interviews with companies and the case studies have identified a number of areas where further progress toward a single market would be desirable. These include a more consistent application of harmonized standards (especially in environmental legislation), harmonization of VAT rates, exchange rate movements and competition policy/state aids in some sectors.

Introduction
2. Introduction
2.1. Purpose of the study The aim of this study is to assess the impact of the single market programme (SMP) on the European chemical industry. The industry covers a number of different sub-sectors ranging from the production of high volume, low value added bulk chemicals (such as ethylene and propylene) to the development and selling of specialized, value added chemicals for use in specific applications (such as food additives and photographic materials). The sector is characterized as having a high degree of trade and the major companies of the sector have operated at a pan-European and a global level well before the introduction of the SMP. The key purpose of the study was therefore to:
(a) establish the extent to which the SMP has facilitated trade in chemicals within the European Community;
(b) assess the extent to which the SMP has increased competition in the EC, through a lowering of the barriers to trade and the facilitation of entry to other European countries;
(c) determine the overall impact of the SMP on the competitiveness of the European industry;
(d) explore the possible qualitative impacts of the SMP on areas like environmental performance and job mobility;
(e) indicate the strategies adopted by companies as a response to the SMP; (f) identify the areas where obstacles to trade remain due to differences in interpretation and
implementation of the existing legislation between Member States or the absence of legislation at the European level.
An additional purpose of the study was to identify key areas of concern to the industry which, although not necessarily related to the single market, may require action at the European level. The study finally aimed to highlight any differences in the way that the SMP has affected companies by sub-sector, country and company size.
2.2. Methodology Our methodology consisted of four elements:
(a) collection and analysis of aggregate data, (b) face-to-face interviews, (c) a postal survey, (d) three case studies.
The main source of the aggregate data was Eurostat but we also used other sources, for example trade magazines for data on mergers and acquisitions (M&As). Apart from the basic analysis of trends prior to and post 1987/88, we also performed multivariate regression analysis in order to isolate the impact of the SMP on trade and M&As.
The face-to-face survey covered more than 60 companies active in the European chemical sector, including non-EC companies like Sandoz and Dow Chemicals. The face-to-face survey covered the largest companies in each EU country and the relatively larger SMEs. The companies were selected in a way that ensured coverage of all countries and sectors. The

Chemicals
postal survey involved sending a questionnaire to 7,000 companies across the EC and aimed to ensure that small and medium-sized enterprises (SMEs) would also be covered by our survey. The sample of 7,000 was selected randomly from a population of 16,000 chemical companies held with the Kompass database. The aim of the surveys was specifically to identify and separate the impact of the SMP from a number of other factors that have affected the industry in the last ten years. Table 2.1 provides the basic characteristics of the postal survey sample.
Table 2.1. EC chemicals postal survey: characteristics of the sample
Sample size
Country distribution (%) Sector distribution
(%) Sector distribution (number of employees) (%)
377 (companies surveyed: 7,000)
D 21
I 8
Petrochem
7 0 - 9
48
E 4
Ρ 2
Inorganics
15 50-199
32
GR 3 Dyes& Pigments 9 200-499
10
DK 2 Plastics
10 500-1,000
6
NL 4
F 19
Fibres
2
UK 20
1RL 6
Agro-chems
6 > 1.000
3
B/L 6 Paints
28
Other
40
In terms of statistical confidence, as a general rule, the reliability of estimates based on samples drawn randomly from any given large population does not depend on the population size but rather on sample size (for example, one can estimate just as accurately the height distribution of the population in Denmark and the UK with a sample of the same size; the greater the sample size, however, the greater the accuracy). The qualitative nature of the questionnaire (where we are estimating in most cases frequencies) reinforces this point and implies that the key determinant of the reliability of the responses is the overall sample size by dimension examined. For overall responses (i.e. not by country or by sector) the sample size of 377 is sufficient to provide relatively reliable results to yes/no type questions.1
Responses given by country and/or sector must be assessed on the basis of overall sample size for the country or sector (when the population is large) and representativeness (when the population is not large). We therefore consider that differences in responses from the average associated with:
(a) (b) (c) (d) (e) (f) (g)
inorganics; paints; petrochemicals plastics; Germany; France; the UK
are more reliable than differences in responses associated with:
(a) fibres;
A randomly selected sample of 400 from a population of 30,000 companies (the size of the European chemical industry according to the Panorama of EU industiy) will produce estimates of frequencies, ±5%. with a confidence interval of 95%.

Introduction
(b) agrochemicals; (c) Spain; (d) the Netherlands.
It should be noted, however, that estimates of the overall frequencies, based on a sample of 377, are more reliable than estimates of frequencies for any individual sector or country.
In our reporting of the results we have taken the above into account and have not reported results where the sample size was very small (or warned that this was the case). The face-to-face survey covered 60 companies including all of the top ten companies in the sector (see Appendix L). The top ten companies account for approximately 48.6% of European chemical sector turnover (according to the Panorama of EU industry).
In terms of information collected, the postal questionnaire enquired about the impact of the SMP in the following areas:
(a) the impact of legislation on trade; (b) remaining trade barriers; (c) cross-border trading and marketing; (d) competition and efficiency; (e) prices; (f) industry structure; (g) cost base; (h) sourcing.
In addition to the above, the face-to-face questionnaire covered also:
(a) production and productivity; (b) employment; (c) environmental impact; (d) corporate strategy.
When reporting the results of the surveys in Chapter 4, we used the postal survey responses as the basis for all those areas covered by the postal survey.
Where the face-to-face responses differed significantly from the postal responses, we also reported the face-to-face results. The survey results reported for the remaining areas (production, employment, environmental impact and strategy) are based on the face-to-face survey.
The case studies aimed to explore in more depth the way in which the SMP affected companies, its impact on corporate strategy and the ways in which companies reacted to the more competitive environment that the SMP aimed to establish.
Appendices J to L provide detailed information on the methodology adopted, the surveys carried out, the questionnaires used and the companies and trade associations interviewed. Appendix E provides details of the regression analysis.

Chemicals
2.3. Report structure This report is organized as follows:
(a) Chapter 1 (Summary) presents the main findings of the study; (b) Chapter 2 provides an introduction with a description of the key developments in the
sector over the last ten years; (c) Chapter 3 summarizes the relevant legislation and indicates areas where obstacles still
remain; (d) Chapter 4 presents the impact of the single market programme on the chemical sector; (e) Chapter 5 provides an analysis of the corporate strategy implications of the SMP; (f) Chapter 6 summarizes the results from our three case studies.
2.4. Sectors covered The overall scope of the study is to cover the European chemical sector. A key exclusion from the study is the pharmaceutical sector, which along with fertilizers, and soaps, detergents, perfumes and toiletries do not form part of this study. The sectors under review in this report are:
(a) basic/heavy industrial chemicals; (b) petrochemicals and plastics; (c) paints, varnishes, coatings and printing inks; (d) agrochemicals; (e) man-made/synthetic fibres; (f) speciality and other chemicals.
Aggregate data availability implies that, for some variables, data may not cover all of the above sectors. In our postal and face-to-face surveys we also made a distinction between petrochemicals and plastics.
2.5. Relevance of the sector with regard to the single market
The European chemical sector has a high degree of intra-EC and international trade. There were therefore no single market measures aimed specifically at the sector, but rather a series of amendments to pre-existing chemical legislation. This pre-existing chemical legislation (which first appeared in 1967) and its amendments are aimed at establishing a level playing-field by ensuring common EC procedures for classifying, registering, labelling and, more recently, marketing dangerous substances and preparations.
The general single market legislation would also be expected to have affected the chemical sector by making it easier to trade within Europe. The sector consists, however, of a significant number of very large companies that operate at a global level and have had production plants and marketing outlets in a number of EC countries prior to implementation of the SMP. This implies that wherever and whenever possible such companies would conceive and establish ways to overcome barriers to trade, where that would lead to further expansion in other profitable markets. The SMP should not be expected, therefore, to enable the overall creation of significant trade and/or intra-EC direct investment activity, as may be the case in some other sectors, but rather to facilitate the trade and cross-border production that was already taking place. This will clearly vary, however, by country and sector, and in

Introduction
the areas where small to medium-sized enterprises (SMEs) can and do compete effectively
with larger companies (e.g. paints and varnishes), the SMP could be expected to have created
more significant new opportunities.
2.6. Overview
This section of the report provides an overview of developments in each chemical sector
throughout Europe. The European chemicals sector comprises the nine major sub-sectors
listed in Table 2.2. In this report, the two major secondary data sources are the Eurostat DEBA
database and Frost & Sullivan. Differences exist in sectoral definitions between these data
sources (as tabulated in Appendix A) and reference to both sources is made in this section.
Table 2.2. Chemicals industry production by sector in the EC
Sector
Heavy industrial chemicals
Petrochemicals and plastics
Synthetic fibres
Fertilizers
Agrochemicals
Soaps, detergents, perfumes, toiletries
Paints, varnishes, coatings, inks
Pharmaceuticals
Speciality and other chemicals
Total
(billion ECU)
1994
33.5
66.2
17.0
3.8
6.4
35.1
12.3
64.2
28.9
267.4
Source: Frost and Sullivan. A Strategic Assessment of the European Chamical Industry.
Figure 2.1 shows the predominance of pharmaceuticals and petrochemicals which together
account for almost one-half of chemical sector turnover in the EC in 1994.
Figure 2.1. Chemicals industry production by sector in the EC, 1994
Speciality and other chemicals Heavy industrial chemicals 11% ' 13%
Pharmaceuticals 24%
Petrochemicals and plastics 25%
Synthetic fibres 6%
Soaps, detergents, /■ . ·ι ■ ' Aerochemicals 1%
perfumes, toiletries ->o' 13% -'"
Source: Frost and Sullivan.

10 Chemicals
Figure 2.2 illustrates the growth in world chemical turnover for the three major global
competitors, the EC, the USA and Japan. All three have seen significant growth, but Japan is
capturing a growing share of world markets due partly to its proximity to the booming markets
of SouthEast Asia. Note that the sharp reduction in the US turnover figures in 198687 is due
to the significant drop in the value of the dollar during that period (see Figure 2.6).
Figure 2.2. World chemical turnover
Turnover
(million
ECU) '
USA
Japan
EC
Source: CEFIC.
Within the EC, Germany has the highest share of turnover at 29%, followed by France, the UK
and Italy (Figure 2.3). These four countries account for threequarters of 1993 chemicals
turnover in the EC.
Figure 2.3. Turnover percentage share in the EC, 1993
I r e l and . D e n m a r k ,
N e t h e r l a n d s P o r t u R a l
Β elg ¡um
Source: CEFIC.
It should be noted that Figures 2.2 to 2.5 include data on the pharmaceuticals sector.

Introduction 11
Fluctuations of turnover over the longer time frame of the last 10 to 15 years in the EC are shown in Figure 2.4, where the growth in GDP has outpaced chemical sector turnover in the EC. Following four years of negligible turnover growth rates in the chemical sector in the EC from 1989 to 1992, CEFIC reported a growth of 5.6% in the sector in 1994, reflecting the economic recovery world-wide, including Europe.
Figure 2.4. GDP and chemical sector turnover in the EC
' E C nom ina ! G D P
' E C c h e m i c a l n o m i n a l t u r n o v e r
Source: CEFIC.
Figure 2.5. Performance indicators of the chemical sector in the EC
Average growth in value
(% per annum)
1985-1992 1980-1992
Turnover Exports Imports Apparent consumption
Source: Eurostat, DEBA.
Average annual growth rates of turnover (in nominal terms), exports, imports and apparent consumption are provided in Figure 2.5. We calculated this for the 1980-92 period as a whole and for the 1985-92 period, which is when the SMP measures were announced and implemented. Growth rates have been lower in the late 1980s and 1990s due to:
EC turnover is defined as total sales of EC producers to the EC.

12 Chemicals
(a) recessionary pressures felt first by British, then Italian and French based companies. The effects in Germany were felt later, in 1992;
(b) increased competition from US producers resulting from the relative weakness of the USD (Figure 2.6) which has led to a mild negative trend in the EC trade balance (see Section 4.1, Figure 4.4). This can perhaps be offset to some extent (over a longer time horizon) with new opportunities for Western European companies in Eastern Europe;
(c) the strength of the chemicals markets of the newly industrialized countries (NICs) as exemplified by expected growth rates of about 13% per annum in the markets of Singapore, Indonesia, Thailand, Malaysia, the Philippines, Brunei and Vietnam. The importance of the emerging South-East Asian markets must not be underestimated; for example, Hoechst talks of a market the size of Switzerland being added every three months in China and India. ICI, which has eight new manufacturing plants underway in the region, estimates that the total Asia Pacific chemical market will have expanded from ECU 221bn in 1990 to ECU 400bn by 2000.
Figure 2.6. ECU/USS exchange rate and nominal chemical sector turnover in the EC
ECU/S Turnover (million ECU)
330,000
H 1 I 1 ! L 150,000 1983 1984 1985 1986 1987 1988 1989 1990 1991 1992 1993 1994
"Exchange rate ~*~Turnover
Source: CEFIC, Eurostat.
Having set out the key trends affecting the chemical industry overall, the report now considers the key elements of each major sector.

Introduction 13
2.6.1. Basic industrial chemicals, excluding petrochemicals
This sector of the chemicals industry includes the production of inorganic chemicals (excluding fertilizers), electrochemical products, mineral pigments and organic dyestuffs, and products obtained from the distillation of tar and benzole. The Eurostat DEBA definition of the 'basic industrial chemicals' sector includes petrochemicals. In this section, however, petrochemicals is discussed separately in Section 2.6.2.
Heavy chemicals are mainly used as inputs in other chemical processes. Industry demand represents about two thirds of basic chemicals' sales. More than 45% of this intermediate demand comes from the speciality chemicals sector. The basic chemicals sector itself accounts for another 13% of its own sales and the rubber and plastics sector for about 11%.
Following some growth in the first half of the 1980s, the sector experienced a sharp decline in 1986, as shown in Figure 2.7. This is partly due to the dollar weakness which would have detrimentally affected European competitiveness in this sector. From 1989 to 1991, production growth slowed in the EC, the USA and in Japan, with the EC most badly affected. From 1990 onward, the recessions in Europe and North America have depressed demand for basic chemicals although Japan was able to maintain positive, though decelerating, production growth.
Figure 2.7. EC real turnover of basic industrial chemicals (1990 prices)
Real turnover
ι (million ECU)
1980 1981 1982 1983 1984 1985 1986 1987 1988 1989 1990 1991 1992 1993 1994
Year
Source: Eurostat, DEBA.
Employment in the sector in Europe started to decline in the early 1980s and the trend is ongoing. From 1982 to 1991, the number of people employed decreased by about 45,000.
In terms of global production, the EC is the world's largest producer of heavy industrial chemicals. In 1991, EC production was about 2% higher than US production and this margin has remained fairly constant throughout the 1980s. Japan ranks third in the world basic chemicals market, but its production is half the size of those of the EC and the USA. The EC

14 Chemicals
trade balance in heavy chemicals has decreased during the 1980s because of rising imports and weak exports. This is detailed further in Section 4.1.
The sector has a strong technological base and energy is the main input cost for the sector. High capital investment in processing equipment and technology is essential and, together with the availability of raw materials, represents a significant entry barrier. The leading EC producers of basic chemicals are BASF, Hoechst and Bayer (Germany), ICI (United Kingdom), Rhône-Poulenc (France) and Enichem (Italy). Other important European basic chemicals companies are Ciba, Sandoz and Roche (Switzerland), Neste (Finland), Dyno Industrier (Sweden) and Norsk Hydro (Norway).
The sector is characterized by products being mainly used as inputs in other chemical processes. As such, the outlook for growth world-wide is likely to be closely related to growth in GDP and this would therefore imply a continued steady expansion in demand for these products world-wide. The upturn in economic growth world-wide in 1993 coincides with the first increase in real EC turnover in this sector for four years (Figure 2.7). At the European level, the competitive pressures, particularly from the newly industrialized countries, may well erode the EC growth rates in this sector, although the EC has a strong technological base which compares favourably with all other major trading blocks.
2.6.2. Petrochemicals
Petrochemicals represent more than half of basic chemicals and a quarter of the total chemical industry in terms of turnover. The primary products are:
(a) primary petrochemicals - unsaturates, aromatics, methanol, ammonia and carbon black; (b) petrochemical intermediates - vinyl chlorides, acrylonitrile, cyclohexane, ethyl benzene,
styrene and phenol; (c) petrochemical products - plastics, synthetic fibres, solvents, surface active agents,
synthetic rubber and intermediates for other fine and speciality chemicals manufacturing.
Key building block substances such as ethylene and propylene are included in the primary petrochemicals category. A more detailed description of the products comprising base petrochemicals is given in Appendix B.
The EC is a major producer of petrochemical products. The EC has the largest output of butadiene and benzene, and is second to the USA in production of ethylene and propylene. In volume terms, EC petrochemical production is about double that of Japan. Nevertheless the entry into the market of countries from South-East Asia, South America and the Middle East is beginning to erode the established position of Europe. This year also showed the importance of China to the petrochemicals and plastic markets, in revealing that it accounts for 31% of the global market in petrochemicals and plastics.
Petrochemical products are used in a variety of downstream industries, including the construction, electrical, packaging, transport, metal working, mining, agriculture, rubber and petroleum refining industries. Demand for primary and intermediate petrochemicals depends on:
(a) the economic cycle;

Introduction
(b) inter-product competition, such as between different types of plastics or between plastics and other materials;
(c) the emergence of new products; (d) the effect of environmental restrictions.
EC trade in petrochemicals was reasonably well balanced from 1983 to 1991 with both extra-EC exports and imports growing. However, extra-EC imports have risen sharply since 1988 leaving the export/import ratio at 1.14 in 1991 from 1.73 in 1983. This rapid change is partly a consequence of the increased competitiveness in this sector from the NICs mentioned above. In conjunction with this was the severe recession in the late 1980s and early part of this decade. Within the EC, Germany is both the major exporting and importing country (Table 2.3).
Table 2.3. Distribution across EC countries of extra-EC exports and imports
Country
Germany Netherlands United Kingdom France Italy Belgium
% of extra-EC exports
41 12 11 11 10 6
% of extra-EC imports
23 13 13 13 14 12
Source: Frost and Sullivan. 1995.
The sector is currently experiencing severe problems of over-capàcity. There has been some restraint among European producers of ethylene, the basic building block for many petrochemicals, where investments have been linked to particular plants. Outside Europe, however, expansion is much faster despite having no indication of excess demand for ethylene. In the USA, five new ethylene plants are planned and in Asia a plant building programme is set to add nearly 90% to ethylene capacity. This expansion is driven more by the business cycle with 'cash-rich' companies looking to invest with a view to gain advantage over competitors, rather than by insufficient capacity.
In the downstream plastics sector the markets in Europe are also likely to face over-supply in the near future. When Shell announced that it would be doubling the output of its PET plant in Italy and also acknowledged that by the time the new capacity came on-stream, the market would be oversupplied, other companies such as ICI, Eastman, Hoechst, Wellman and Rhône-Poulenc followed suit with similar expansion announcements.
From 1987 to 1991, European companies invested heavily in plant modernization and the development of new technologies, aiming to increase their overall competitive position. Since 1991, the recession and new production from NICs have reduced the need for extra capacity.
In Europe, petrochemical production is dominated by large multinational companies that have undergone extensive restructuring and consolidation since the oil crises and recessions of the 1970s and the beginning of the 1980s. In 1985, there were 25 producers of ethylene in the EC, but by 1991 there were only 19. Of the five leading European chemicals companies, four of

16 Chemicals
them are involved in the production of basic and intermediate petrochemicals; BASF, Bayer and Hoechst (Germany) ascribe proportions of turnover of 20%, 14% and 12% respectively to petrochemicals, while ICI (United Kingdom) ascribes 19% of turnover to petrochemicals.
The largest producers of basic petrochemicals in Europe are chemical subsidiaries of multinational oil companies: Shell Chemicals (Netherlands/United Kingdom), BP Chemicals (United Kingdom), Exxon (United States), Statoil (Norway), and Elf Atochem (France). Dow Chemicals of the USA is also established in the EC petrochemical sector.
In summary, the industry is traditionally very cyclical and currently has surplus capacity due to the presence of too many players with too many manufacturing sites following large scale expansion in the early 1980s. The spate of recent expansion announcements in both upstream and downstream petrochemical and plastic products by most major companies, particularly in South-East Asia, appears to be less of a response to excess demand and more of a competitive strategy to increase market share.
2.6.3. Paints, varnishes, coatings and printing inks
The four main categories which this sector encompasses are:
(a) architectural coatings, including exterior and interior house paint, primers, finishing coats, pore fillers, varnish and dyes;
(b) coatings used for a wide range of industrial and consumer products such as wood or metal furnishing, automotive, aerospace, machinery and equipment;
(c) special coatings designed for specific applications or for use in special conditions, including products for the repainting of cars and machines, high-performance maintenance, road markings, bridge maintenance and metallic coatings;
(d) printing inks used for a series of printing processes, such as letterpress, offset/litho, gravure, flexography and screen printing.
Of these four main categories, paints and varnishes account for almost 90% of production volume and 85% of value of the sector. In 1991, production of paints and varnishes reached approximately 4.4 million tonnes or ECU 8.7bn. Figure 2.8 indicates the contribution of major EC producers to volume output of paints and varnishes in 1992. Germany contributes 24% of total EC volume production in paints and varnishes, and more than 40% of printing inks volume. Within Europe, France, the UK, Italy and Germany dominate production levels.
Production of paints, varnishes and inks grew at an average yearly rate of 4.2% from 1982 to 1991, outpacing consumption which rose 3.9% per year. Extra-EC imports rose at a yearly rate of 6% during the same period, while export growth has been sluggish, particularly from 1985 to 1991. Employment in the sector has recently started to recover after falling to its lowest level in 1988.
Products in this sector tend to be less globally traded than in many other sectors, because they are characterized as being high volume, costly to transport, bulky and low technology. Consequently, EFTA countries are the main trading partners for EC producers and consumers. Although grouped in one sector, market demand for each category is driven by different factors. Industrial paints and coatings are vulnerable to changes in demand for customer industry products, particularly in the automotive, marine and construction industries. One exception to this is in the vehicle repainting market. Architectural paints are driven largely by

Introduction 17
construction activity. In general, production of printing inks is less affected by fluctuations in levels of industrial activity and consumer durables.
Figure 2.8. Contribution of European countries to 1992 volume production in paints and varnishes
£§$&"$$.: Álít-̂ ̂ ' « ^ ^ 5 ? ^ \
France 13%
Italy 13%
Source: Chemical Week.
Powder coatings are estimated to be the fastest growing segment in the world, with annual volume increases averaging about 15% during the 1980s. Powders contain no solvents and are therefore more environmentally friendly.
All EC countries have paint production plants, although a considerable number of these are to be found in the major EC countries. In terms of concentration, in 1989 the ten biggest paint and varnish companies held about one third of the world market. In the printing inks sector, four countries - Germany, the United Kingdom, France and Italy - account for 71.3% of the market.
The European leaders are ICI (United Kingdom), which is also the world's leading producer, BASF (Germany), Herberts (Germany, a Hoechst subsidiary), Akzo (Netherlands) and Courtaulds (United Kingdom). Nobel Industries (Sweden) was acquired by Akzo in 1993. Only a limited number of multinational firms produce printing inks. Generally, production units in southern EC countries are often family-run and considerably smaller than in the northern countries, as illustrated by the relatively large number of companies in the southern EC countries.
2.6.4. Agrochemicals
The two main branches in this sector are fertilizers, which are not covered in this study, and chemical products for crop protection. Western Europe, North America and East Asia together accounted for 81% of the global agrochemicals market value of ECU 21.1bn in 1993. The share of Western Europe fell from 27% in 1988 to 23% in 1993. France, Italy, the United Kingdom, Spain and Germany are the largest producers in the EC, and are also the largest

Chemicals
consumers of plant protection chemicals, using about 95% of the herbicides, 97% of the fungicides and 77% of total pesticides consumed in Europe.
France constitutes the major EC market and the third biggest market in the world, after the USA and Japan. In 1993, the West European plant protection market was estimated at around ECU 5.8bn, which was 23% of the world market. In comparison, the US market accounted for ECU 6.5bn. The agrochemical market is divided into four major product categories, as shown in Figure 2.9.
Figure 2.9. The global agrochemical market, 1993
Others 5%
Fungicides 19%
Source: European Chemical News (ECN).
The EC is a net exporter of crop protection products. The European trade surplus increased until 1985; since then the EC has been losing market share abroad, causing the trade surplus to decline. Although extra-EC exports have continued to grow (by less than 4% in 1991, compared to much higher growth in the early 1980s), import growth has been consistently stronger than export growth throughout the 1980s.
Demand for agrochemicals is directly linked to the dynamism of the agricultural sector, which represents almost its only end-market. European legislation related to the Common Agricultural Policy, which is independent of the single market programme, has a direct effect on the demand for agrochemicals, as well as environmental factors such as climate. Both 1992 and 1993 were very difficult years for agrochemicals in Western Europe. Although globally the 1993 market value was a marginal increase from 1992, this translated into a 1.7% dip in real terms - the third year in succession of real decline.
Nearly all companies active in the sector are multinational chemical companies whose agrochemical activities represent a relatively small part of the total sales of the parent group.

Introduction 19
In 1993, the major European producers of crop protection agrochemicals were Ciba (Switzerland), ICI/Zeneca (United Kingdom), Rhône-Poulenc (France), Bayer, Hoechst and BASF (Germany). In herbicides, Ciba is considered to be the leading producer, with an estimated world market share of 13%.
Profitability has been very low for EC manufacturers since 1980. Massive restructuring and downsizing have already taken place. Employment has fallen from 110,000 in 1983 to 40,000 in 1991. Regulatory pressure, combined with heightened environmental concerns, have significantly increased the cost of doing business in the pesticide industry, causing a reduction in the number of active firms. Nevertheless, company profits for most agrochemical producers improved during 1994, bringing optimism to the sector after several years of decline.
2.6.5. Man-made fibres
The three main categories in this sector are synthetic fibres, cellulosic fibres, and mineral fibres. Synthetic fibres accounted for 84% of world chemical fibre production in 1991. Mineral fibres are not included in this report.
The dominance of synthetic fibres over cellulosic products is becoming more and more pronounced. Cellulosic fibres now represent 16% of the fibres production in the EC. The sector has undergone extensive restructuring since the late 1970s. The low rate of European textile consumption during the 1970s (following the first oil crisis) contributed to this structural change. The development of chemical fibre production facilities in the rest of the world, arising in part from investments made by European companies, caused a growing deficit in the EC's textile and clothing trade balance.
Between 1978 and 1985, one third of the total European capacity was cut. Technological changes also reduced manpower requirements, so that employment in the chemical fibres sector declined significantly. It has suffered a 38% cut since 1980, a decline that was accompanied by a significant improvement in apparent labour productivity.
Since 1977, the EC synthetic fibres industry has been losing ground in the production of all types of fibres. Production from the newly industrialized countries accounts for an increasing share of world output, displacing the former dominance of the US and the EC. The European industry is increasingly focusing on higher value-added products, while pursuing an investment policy aimed at rationalization and research and development. The crisis in the textile industry, together with the economic gloom of recent years, brought about a marked slowdown in turnover growth in 1991 and 1992 (Figure 2.10).
Among the EC Member States, the largest producers of synthetic fibres are Germany with 24% of EC production in 1993, Italy (27%) and the UK (16%). Germany is also the largest exporter of synthetic fibres, accounting for 41% of EC exports, but is also the leading importer, with 18% of total imports.

20 Chemicals
Figure 2.10. EC synthetic fibres real turnover
13,000
Real turnover 900° (million ECU) ».oco
7,000
6,000 1980 1981 1982 1983 1984 1985 1986 1987 1988 1989 1990 1991 1992 1993 1994
Year
Source: Eurostat. DEBA.
The European synthetic fibres sector is dominated by a small number of big companies, many of which have recently seen a recovery in profits. BASF fibre products division, having opted to focus solely on nylon products and shed 30% of the workforce, has seen 1995 first quarter profits up 152% at DM 880m, and sales up 29% in the fibres and plastic division. Hoechst saw profits rise by 96% in the first half, while turnover at its US fibres subsidiary rose 19% to $4.1 billion. CIRFS (the European trade association) report that such improvements are largely due to the companies refocusing on higher value-added materials.
2.6.6. Speciality, maintenance and other chemicals
This sector is distinct from basic industrial chemicals in that it is characterized by higher value-added products. The two sectors are combined in this section, using Frost and Sullivan information, although the categories below include some sectors not covered in the market analysis in Chapter 4. The speciality and other chemicals sector includes:
(a) compressed gases; (b) liquid and solid adhesives and glues; (c) chemically treated or modified animal and vegetable oils, fats and waxes; (d) essential oils and natural and artificial flavourings and perfume materials; (e) auxiliary products for the treatment of leather and textiles; (f) miscellaneous chemicals for industrial purposes; (g) photographic chemical materials; (h) polishes for household use; (i) chemical products for office use; (j) other chemical products not intended for industrial use.

Introduction 21
The sector is typified by having smallscale production made to order (bespoke). Speciality
chemicals are also characterized by profit margins that are often markedly higher than those
for commodity chemicals. The sector performed well from 1983 to 1989 (Figure 2.11),
reflecting the increasing focus of the European market on valueadded products. The turnover
decline since 1989 can be attributed to the recession and a consequent buildup of surplus
capacity.
Figure 2.11. EC speciality and other chemicals real turnover
14.500 Γ
Ι 4.000
13,500
Real
turnover
(million
ECU)
13,000
12,500
12.000
11,500
1980 1981 1982 1983 1984 1985 1986 1987 1988 1989 1990 1991 1992 1993 1994
Year
Source: Eurostat. DEBA.
From 1982 extraEC exports of speciality chemicals increased annually by 6%. ExtraEC
imports rose even faster, at 8.1%. IntraEC trade rose faster still, 8.6% annually over the same
period. This is an interesting finding in the context of the single market programme since the
sector is characterized as having globally tradable goods where barriers could have been
significant. The high intraEC trade growth may also reflect the other major characteristic of
the sector which is the high valueadded nature of products where quality may be important as
a purchase decision criterion. The inference is that EC companies can exploit technological
advantage and a relatively high degree of vertical integration in response to competition from
other trading blocks.
Purchases of speciality chemicals are often based on performance rather than on price.
Technical development, especially product quality and consistency, is becoming one of the
leading factors that influence market competition. An increasingly important research and
development driver is the need to control the toxic characteristics of the products, with clients
increasingly eager to create a 'green' image for their products.
Large, integrated companies, mediumsized firms and small niche players all compete in the
speciality chemicals markets. Some of the larger companies include ICI (United Kingdom)
and Henkel (Germany) with speciality surfactants, RhônePoulenc (France) for flavourings,

22 Chemicals
Atochem (France) for polymers for leather and textiles, Bayer (Germany) for dyes, pigments and optical brighteners, Hoechst (Germany) for food additives, pigments and industrial gases, and Tessenderlo Chemie (Belgium) for food additives and gelatine. The smaller companies tend to serve national or regional markets. These companies are often active not only in the chemical consumer products sector, but also in other consumer product sectors.

Legal and administrative measures taken to complete the single market 23
3. Legal and administrative measures taken to complete the single market
Member States have sought to place restrictions and conditions on the manufacture and use of chemical substances and products, with the central aims of protecting human health and the environment. However, differing regulations and levels of protection among Member States could present obstacles to the free movement of goods within the Community.
Community legislation from an early stage sought to address both these aims, taking as its basis a high level of protection (and often providing the regular updates to take account of technical progress) while seeking to institute a system of harmonization of national rules in order to prevent the fragmentation of the Community market. The major pieces of Community legislation in this area date from the late 1960s and early 1970s.
For the chemicals sector, the Commission's 1985 White Paper4 (and subsequent legislation) was therefore the continuation of a process which had been underway for some time. Projected chemicals legislation is featured in the White Paper programme at Section 5.2.5, as part of the programme to eliminate technical barriers to trade. The principal measures listed were the extension of the 1976 Marketing and Use Directive to include products already addressed by the legislation of certain Member States; a reworking of the 1973 Directive in order to cover all preparations containing at least one dangerous substance; and specific measures relating to fertilizers and detergents, which fall outside the scope of this study.
This chapter is intended to give a brief outline of the objectives, methods and effects of the principal Community legislative measures and policies which affect the internal chemicals market. The scope of the chapter covers the specific dangerous substances and preparations legislation, but extends also to horizontal measures in other more general areas which affect the sector, i.e. environment, employment, energy, and competition.
For each group of measures, the chapter seeks to provide the following information:
(a) an assessment of the nature of the barriers to cross-border transactions which the Community legislation was intended to address;
(b) the manner in which the measures were intended to overcome these barriers; (c) their relevance, where appropriate, for small and medium-sized firms; (d) their functioning in practice; (e) an assessment of their effectiveness, on the basis of the postal survey and the face-to-
face interview programme with chemicals companies and associations.
European Commission: Completing the internal market: White Paper from the Commission to the European Council, COM(85) 310 final.

24 Chemicals
3.1. Implementation of sector-specific measures
3.1.1. List of measures
The following are the key measures which in principle or practice are specific to the chemicals sector:
(a) Directive on the classification of substances: Council Directive 67/548/EEC of 27 June 1967 on the approximation of the laws, regulations and administrative provisions relating to the classification, packaging and labelling of dangerous substances. (OJ L 196, 16.8.67, p. 1.)
(b) Directive on the marketing and use of substances and preparations: Council Directive 76/769/EEC of 27 July 1976 on the approximation of the laws, regulations and administrative provisions of the Member States relating to restrictions on the marketing and use of certain dangerous substances and preparations. (OJ L 262, 27.9.76, p. 201.)
(c) Directive on the classification of preparations: Council Directive 88/379/EEC of 7 June 1988 on the approximation of the laws, regulations and administrative provisions relating to the classification, packaging and labelling of dangerous preparations. (OJ L 187, 16.7.88, p. 14.)
(d) Directive on the classification of pesticides: Council Directive 78/631/EEC of 26 June 1978 on the approximation of the laws of the Member States relating to the classification, packaging and labelling of dangerous preparations (pesticides). (OJ L 206, 29.7.78, p. 13.)
(e) Directive on the prohibition of some pesticides, etc.: Council Directive 79/117/EEC of 21 December 1978 prohibiting the placing on the market and use of plant protection products containing certain active substances. (OJ L 33, 8.2.79, p. 36.)
(f) Directive on the placement of pesticides, etc.: Council Directive 91/414/EEC of 15 July 1991 concerning the placing of plant protection products on the market. (OJ L 230, 19.8.91, p. 1.)
(g) Council Decision 88/540/EEC of 14 October 1988 concerning the conclusion of the Vienna Convention for the protection of the ozone layer and the Montreal Protocol on substances that deplete the ozone layer. (OJ L 297, 31.10.88, p. 8.) This Decision approves, on behalf of the Community, the Vienna Convention for the protection of the ozone layer and the Montreal Protocol thereto on substances that deplete the ozone layer. The Decision requires the President of the Council to deposit the act of approval of the Vienna Convention and the Montreal Protocol with the Secretary-General of the United Nations on behalf of the Community. It also requires the Member States which have not already done so to take the steps necessary to deposit instruments of ratification, acceptance, approval or accession to the Vienna Convention and the Montreal Protocol by 31 October 1988. The Montreal Protocol sets out a programme for reductions in the consumption of chlorofluoro-carbons and halons which the parties to the Protocol are to implement. In addition, it sets out rules concerning the production, importation and exportation of these products. It requires a standstill of production of chlorofluoro-carbons and halons at 1986 levels. Member States were required to take the necessary steps to deposit their instruments of ratification, as far as possible simultaneously, before 1 January 1989. Regulation (EEC) No 3322/88 (OJ L 297, 31.10.88, p. 1) (now largely replaced by Regulation (EEC) No 594/91 (OJ L 67, 14.3.91, p. 1) which itself is due to be replaced by a new proposal) implements the Community's obligations under the Montreal Protocol.

Legal and administrative measures taken to complete the single market 25
(h) Council Regulation (EEC) No 793/93 of 23 March 1993 on the evaluation and control of risks of existing substances. (OJ L 84, 5.4.93, p. 1.) The Regulation deals with the collection, circulation and accessibility of information on existing substances and with the evaluation of the risks of such substances to man and the environment.
The Regulation consists of three parts:
(a) Part 1, dealing with the systematic reporting of data and the establishment of a list of priority substances;
(b) Part 2, dealing with risk evaluation; (c) Part 3, dealing with the management aspects.
The Regulation includes three annexes. The first one gives a listing of existing substances which are produced or imported within the Community in a quantity exceeding 1,000 tonnes per year. The second annex gives the list of substances exempt from the notification requirements and the third annex gives the procedures and information required from the producer/importer. The producer/importer is obliged to provide the Commission with the information as required in Annex III when he has imported/produced more than 1,000 tonnes of a particular substance at least once in the three years preceding the adoption of the Regulation and/or the year following adoption.
3.1.2. Nature of the barriers to cross-border transactions
It is clear that manufacturing of, and trade in, certain chemical products and substances may present dangers to human health and the environment. For this reason, it is natural for the Member States to seek to place restrictions on these activities and to ensure that they are carried out in a way which minimizes such risks. This is also an aim of the Community's environmental policy which, as outlined in Article 130r(2) of the EC Treaty, must aim at a high level of protection according to the precautionary principle.
On the other hand, the Community also has the fundamental task of creating a single market where goods, services, capital and workers circulate freely. At an early stage it became apparent that Member States' rules on dangerous substances and preparations had at least the potential to create obstacles to the free movement of goods and to distort competition in the single market. Different approaches in the Member States towards classification of substances could lead to situations whereby a product is restricted in one Member State and may be freely used in another. Differing levels of restriction could disadvantage imports as compared with domestically produced products, or require production to different specifications to comply with the rules in the different Member States. Even if a product is acceptable in all Member States, notification and testing procedures may need to be needlessly repeated in order to market the product legally in more than one State. This in turn may discriminate in terms of costs and delays against products from other Member States as, compared to the manufacturer, an importer may not have full or immediate access to the information required for notification.
Differing national provisions on labelling and packaging may have the effect of dividing the single market by requiring differentiated presentation of products for different parts of the Community. Although larger companies may be used to working internationally and to complying with different local rules, differentiations relating to products or presentation have the greatest impact as barriers to smaller or nationally oriented companies seeking to enter new EC markets.

26 Chemicals
Even if a product could be freely imported into a Member State because it complied with the provisions of the classification and placement Directives, different national legislation on marketing and use of a chemical could act as a barrier to free cross-border trade. Member States could prohibit the marketing or the use of a certain substance or preparation in their territory. Thus, even if the product in question complies with the labelling and packaging requirements of the EC Directives, it could be impossible to sell it or its use will be limited to certain cases. This is another type of barrier to trade that concerns the product itself rather than the conditions under which it would be presented to the consumer.
National legislation prohibiting the marketing of the product or limiting its use to a reduced number of cases could imply that certain products are marketed and used in some countries but not in others. This would act as an indirect barrier to entry and lead to a continuation of inefficient production and a restriction of trade. It should be noted, however, that the number of chemical substances affected is relatively small in proportion to over 100,000 substances and two million preparations on the market.
3.1.3. Manner in which these measures are intended to overcome the barriers
Directives on classification of dangerous substances (67/548), of dangerous preparations (88/379), and of pesticides (78/631)
These Directives seek to create a common system of rules which, while respecting Member States' concerns over levels of protection of health and the environment, oblige them to accept without additional requirements products approved in other Member States. The principal areas where these Directives are effective may be termed 'hazard identification' and 'hazard communication'.
As regards hazard definition, they set down common definitions of terms for dangerous properties such as toxic, irritant, flammable, explosive etc., establish an inventory of existing chemical substances and a notification system for new substances as well as provide for test guidelines which must be applied when chemicals are tested. Classification and labelling requirements have been harmonized by the Community for some thousands of chemical substances. Otherwise the producer or importer shall himself assess dangerous properties and classify the substances either on the basis of test results or other available data. Testing is required only in some well defined cases, like for new substances.
As regards hazard communication, the Directives provide for harmonized rules on the safety of packaging and presentation of labels. Member States may not prohibit, restrict or impede, on grounds of notification, classification, packaging or labelling, the placing on the market of products which comply with the requirements of the Directives.
Directives on marketing and use of substances/preparations (76/769) and on prohibition and placement on the market of pesticides (79/117, 91/414)
Rather than abstract 'hazards', these Directives are principally concerned with an assessment of the 'risks' which products in fact have, due to the way they are used or the levels of exposure which they present. From this point of view, they provide for the phasing out or prohibition of the marketing and use of certain products, considered to present unacceptable risks to man or the environment. Again, Member States may in general not implement specific national rules which conflict with these provisions, for example by permitting the manufacture

.egal and administrative measures taken to complete the single market 27
or use in their territory of products not conforming with the Directives. (See, however, the limited ability of Member States to deviate from harmonized Community rules, outlined in Section 3.2.1.)
3.1.4. Assessment of their functioning in practice, including aspects of timing, transposition, enforcement and redress
Since 1991 amendments to the Directive on the classification of substances (67/548) have not been fully transposed in all EC Member States. None of the Member States, with the exception of Finland, has transposed all the Directives (Austria and Sweden have a derogation). Countries like Belgium, Italy, Portugal and the UK have not communicated to the Commission their national laws transposing any of the latest amendments to Directive 67/548. Other countries, like Greece, Spain, Ireland, Luxembourg or the Netherlands, had not communicated the implementation of most of the Directives issued after 1991. Directive 92/32," which introduces a new notification procedure, has not been implemented by Belgium, Greece, Spain, France, Italy, Luxembourg, Portugal or the UK.6 In terms of infringement cases raised by the Commission, the situation is that procedures are ongoing for Belgium, Italy and Portugal concerning four of the last adaptations to technical progress. Procedures are also ongoing for those three Member States on the 7th amendment to the Directive. The two last current procedures concern the United Kingdom but are limited to the interpretation of the situation of the territory of Gibraltar regarding the EU legislation.
The Directive on marketing and use of substances/preparations (76/769) and its amending Directives have been implemented by most Member States. Only Belgium has not complied with any of the deadlines for implementation since 1992. Italy has not complied on one occasion and the Netherlands on another. In the interviews, one company mentioned the additional problem that warehousing standards are implemented differently in Member States.
The two latest amendments to the Directive on the classification of preparations (88/379) have not been implemented by any Member State, with the exception of Finland. Only seven countries have implemented one of the two amendments. Austria and Sweden have got a derogation by virtue of the Accession Treaty.
The Directive on the classification of pesticides (78/631), as amended by subsequent legislation, has been fully implemented by the different Member States but is now out of date.
While the Directive on the prohibition of some pesticides (79/117) has been fully implemented by all Member States, the Directive on the placement of pesticides, etc. (91/414) has not been implemented by Denmark, Greece, Italy and the UK. The 1993 amendment to the latter directive has not been implemented by Belgium and Portugal. The Annex to this Directive (91/414), which will contain a list of the chemicals that can be used to prepare pesticides and herbicides, is currently empty. The Commission is in the process of preparing an initial list in consultation with the Member States.
5 OJL 154, 5.6.92. p. 6 As of 15.4.95.

28 Chemicals
3.1.5. Relevance for small and medium-sized firms The aim of the sector-specific Directives is to establish a common, Community-wide, procedure for classifying, packaging and labelling new dangerous chemical substances and pesticides. These procedures are costly; notification and classification procedures in one country for one substance can cost up to ECU 30,000. Furthermore, the maintenance of national procedures for existing substances is likely to affect unevenly smaller companies, for which the costs of monitoring compliance can be prohibitively high in relation to their turnover and is likely therefore to be a constraint in their efforts to expand to other European markets. The differential impact of such legislation depending on company size is addressed in more detail in Chapter 4.
3.2. Horizontal measures with an impact on the sector
3.2.1. Environment
The Single European Act (February 1986)7 provided the legal basis for Community legislation in the environment sector (Articles 130r, s and t). These articles established the principles that guide Community action on the environment. These are:
(a) preventative action; (b) rectification of environmental damage at the source; (c) the 'polluter pays' principle.
Secondary environment legislation affecting the chemical industry can be divided into four sectors:
(a) general environmental protection legislation; (b) water protection legislation; (c) atmospheric pollution legislation; (d) waste management legislation.
Article 130t can be applied for legislation on environmental conditions adopted on the basis of Article 130s and allows Member States to maintain or introduce more stringent protective measures. These measures have to be compatible with the Treaty and be notified to the Commission.
Once harmonized measures have been adopted at Community level in accordance with Article 100a, Member States are no longer entitled to apply national legislation (unless pre-existing national legislation is entirely in accordance with the Community measures adopted). However, Article 100a(4) provides that if, after the adoption of harmonization measures, a Member State deems it necessary to apply national provisions for the protection of certain imperative requirements (this includes high environmental standards and protection of health), the Member State shall notify those measures to the Commission. The latter shall confirm these provisions after having verified that they are not a means of arbitrary discrimination or disguised restriction on trade between Member States. In the chemicals sector, Article 100a(4) can be applied by a Member State wanting to deviate from the harmonized Directive if it
OJL 169.29.6.87.

Legal and administrative measures taken to complete the single market 29
proves that health and environmental conditions specific to the Member State do not allow marketing and use of the chemicals complying with the harmonized Directive.
Nature of the barriers to cross-border transactions Environmental protection measures were not in themselves perceived as direct obstacles to cross-border trade. However, the Single European Act provided that the environment must be integrated into the definition and implementation of other Community policies, aiming at achieving the highest degree of protection possible. Therefore, the 'environmental dimension' became a key element in the construction of the single market. The creation of the single market could not result in an increase of pollution or damage to the environment.
Different national legislation on environmental standards, however, may cause market distortions of the single market through the maintenance of an uneven playing field in the cost of production.
Furthermore, national environmental measures which imposed certain requirements on the marketing or on the specifications of products were considered as obstacles to cross-border trade because they render it more difficult for imported products to access national markets. One example is the 'Danish bottle' case where a Danish law created a system under which the marketing of beer and soft drinks is authorized only for those in re-usable containers and established a deposit-and-return system for empty containers. In order to make the system workable only certain types of approved bottles could be used. The Commission considered this law to be in breach of the free movement of goods provision of the Treaty (Article 30), because it rendered it more difficult for importers to enter the Danish market. However, in this case, the Court of Justice ruled in favour of the Danish government after having assessed all
Q
the specific circumstances of this case.
Manner in which the measures are intended to overcome these barriers
The EC environmental legislation is not aimed directly at creating a level playing field but rather at establishing common environmental standards throughout the Community to protect the environment. The possibility of national discrepancies leading to the creation of some barriers to trade was recognized however. Countries are therefore required to satisfy the Commission that their national environmental legislation does not create an uneven playing field when establishing environmental standards or procedures which are 'above and beyond' Community standards (Article 130t and Article 100a(4)).
In terms of the environmental protection measures adopted, the EC has harmonized national legislation with respect to a broad number of issues relating to water and atmospheric pollution. In these areas Community action has been mainly concentrated on the establishment of limit values for emissions and subjecting the discharge of certain substances to prior authorization.
The 'polluter pays' principle has also been applied in the waste management area by establishing that the cost of disposal falls upon the holder of the waste or upon the entity disposing of it.
Case 302/86 Commission v Denmark [ 1988] ECR 4607.

30 Chemicals
Concerning the impact of environmental measures in practice, these issues have been addressed through our interview programme with the relevant Commission officials, companies and national trade associations, with comments and results given in Sections 3.4.6 and 4.9.
Relevance for small and medium-sized firms Measures imposing the adoption of stricter environmental standards tend to have a stronger impact on small and medium-sized companies which do not possess the technical and financial resources necessary for that purpose. On the other hand, smaller companies are less likely to be affected by image problems. Large companies are also likely already to maintain the same standards throughout their European production facilities, irrespective of national legislation.
3.2.2. Technical standards
The potential of differing Member State technical standards to create barriers to trade has been recognized in Directive 83/189/EEC which lays down a procedure for the provision of information in the field of technical standards and regulations.9
The Directive provides that Member States' standards bodies must inform the Commission of their national work programmes by 31 January every year. Draft national standards must be communicated to the Commission, unless they are merely transpositions of European standards. Member States and the Commission may comment upon such drafts and must deliver an opinion within three months if they wish to amend such a draft. The proposal may not then be adopted for a period of six months after that date. This period may be extended to 12 months if the Commission gives notice of intention of proposing or adopting a Directive on the subject within three months of the original date of notification. If the protection of public health or safety requires the preparation of regulations with consultation, Member States may state the grounds for their urgent adoption in the notification.
National standards institutions should not draw up or introduce standards whilst a European standard is being drawn up. However, they may proceed if the European standard has not been introduced within six months after the expiry of any time-limit set by the Commission in its request for the formulation of the standard.
In 1995, the Council and Parliament adopted a new Decision (3052/95/EC)10 establishing a procedure for the exchange of information on national measures derogating from the principle of free movement of goods within the Community. From 1 January 1997, Member States will have to notify the Commission of national decisions denying market access to particular products legally marketed in other Member States. The system will function similarly to Directive 83/189. The more transparent system is intended to help elicit reactions from Member States, businesses and consumers to potentially restrictive national measures, and to facilitate remedial action by the Commission, if necessary.
9 OJL 109. 26.4.83, p. 8. 10 OJ L 321, 30.12.95, p. 1

Legal and administrative measures taken to complete the single market 31
3.2.3. Employment legislation
For the purposes of our study the most important employment related legislation identified is health and safety legislation. These measures are aimed at protecting workers from their exposure to chemical, physical and biological agents at work.
Nature of the barriers to cross-border transactions
Employment legislation in general and more precisely, health and safety legislation were not among the measures included in the Commission's White Paper of 1985. However, the Commission and the Member States realized that the creation of the single market could not leave aside its social dimension and have enacted legislation on health and safety. There are 15 pieces of legislation relating to health and safety, including a proposal on the protection of workers from risks related to chemical agents at work.
Health and safety measures are intended to guarantee a high level of protection for the European worker. Different national standards of protection can, as in the case of environmental measures, cause distortions within the European market, by concentrating hazardous industries in countries with more relaxed social legislation. Higher standards may also impose higher costs, especially in the chemical industry, which involves a relatively large number of processes that can potentially affect adversely workers' health and safety. Companies following the highest standards can therefore be at a competitive disadvantage compared with companies following less stringent health and safety rules and regulations.
Manner in which the measures are intended to overcome these barriers
Harmonized social legislation at a European level will eliminate distortions due to different degrees of worker protection among EC members. Health and safety measures have been established for certain agents at work: time of exposure to certain agents, number of workers coming into contact with dangerous agents, provisions on information on potential risks, technical measures and precautions to be observed, the banning of certain agents or certain work activities, obligations to use personal protective equipment in the workplace, etc.
These measures, by creating the basis for a common set of health and safety rules and legislation throughout the Community, should establish a level playing field on the cost of complying with health and safety regulations throughout the Community. This should reduce or eliminate any cost differences due to levels of health and safety regulations.
Relevance for small and medium-sized firms
The legislation is relevant for both large and small companies. The key issue, in terms of possible differences in the cost implications of complying with health and safety regulations, is the degree to which monitoring and enforcement of the regulation is effectively undertaken in large and small companies.
3.2.4. Competition policy
There is no specific competition legislation in the 1985 Single Market White Paper but competition policy rules are provided in the EC Treaty and in Community legislation.

32 Chemicals
Nature of the barriers to cross-border transactions Agreements between undertakings fixing prices, sharing markets, imposing export bans, etc., may eliminate or restrict competition between companies and have a direct effect on cross-border trade. The behaviour of a dominant company which imposes excessively high prices on its customers, or that discriminates among them, or that refuses to supply, will also restrict competition within the EC market and may affect trade between Member States.
Competition between private companies can also be distorted by the action of public bodies. State aids granted to private or public undertakings have an adverse effect on the competition conditions in the market. Tax cuts, low interest rates, capital injections, etc., granted by a public body are typical examples of public measures that can distort competition among companies and thus affect trade between Member States.
Manner in which the measures are intended to overcome these barriers
Articles 85 and 86 Article 85(1) of the EC Treaty prohibits any form of agreement or concerted practice by two or more independent firms/economic operators which has the object or effect of distorting competition, and which is liable to affect trade between Member States. Both agreements between competing companies and those between suppliers and distributors may be covered by Article 85(1).
Article 86 of the EC Treaty prohibits a company (or companies) which has (have) a dominant position in a given market from abusing that position of strength. Mere dominance is not in itself prohibited; there must be an additional abuse of the market power resulting therefrom.
Merger control
Council Regulation 4064/89 of 21 December 1989 on the control of concentrations between undertakings" established a system of prior clearance by the European Commission of all mergers and acquisitions having a 'Community dimension', in order to examine whether they create or strengthen a dominant position in the EC market which significantly impedes effective competition.
'Community dimension' mergers or acquisitions are then subject to a single control system, and no parallel filing to Member State competition authorities is required. Companies interviewed were on the whole reasonably satisfied with the working of the procedures. One major European chemical company reported that 'the Merger Control Regulation procedures are quick and effective'.
State aids
Under the EC competition rules related to state subsidies, known in EC law as 'state aids' (Articles 92-94, EC), any form of aid by a Member State or through state resources which distorts or threatens to distort competition shall be incompatible with the common market in so far as it affects trade between Member States (Article 92(1), EC). Aid is interpreted very broadly and can include direct grants, loans at reduced rates of interest, tax concessions, state
" OJL 395. 30.12.89. p. 1.

Legal and administrative measures taken to complete the single market 33
guarantees, the provision of goods and services on preferential terms and state participation in a business. Aid from local public authorities is also covered.
Assessment of their functioning in practice, including aspects of timing, transposition, enforcement and redress Competition rules have been implemented by various regulations and informal European Commission notices and applied in numerous cases by the European Commission and national courts. However, scarcity of Commission resources devoted to this area has made the Commission's action more selective, concentrating on the more significant competition restrictions.
3.2.5. Other horizontal measures
The following measures were also examined:
(a) public procurement; (b) free movement for labour and the professions; (c) access to new sources of capital as a result of capital liberalization; (d) company law and accounting legislation; (e) corporate taxation; (f) intellectual and industrial property.
These measures were included in our questionnaire but, with the exception of capital liberalization, they stimulated very little comment. From the face-to-face interviews the main reasons were that the issue in question is of little relevance to the chemicals industry (such as public procurement), that differences in national approach are accepted and involve little effort (company law) or that the industry has been working across boundaries for many years (freedom of movement of labour).
3.3. Effectiveness of measures
While it appears that Member States have not been timely in implementing all these measures, this is clearly due to the fact that the measures in question have been the object of numerous technical updates and substantive amendments. In fact, the key basic provisions have been implemented, and the Member States' record is generally positive.
On the other hand, our interviews often showed significantly differing methods and stringency of enforcement among the Member States. This was particularly so in Member States such as Germany, where many issues of relevance to the chemicals industry are addressed at a regional level.
It was clear that many companies interviewed did not understand well the purpose and structures of Community legislation. Some saw only the direct impact (i.e. perceived additional administration and costs) and not the indirect impact of the creation of a single market.
The notification and labelling Regulation was most controversial. Its effects were perceived as very varied across different industry sectors and types and sizes of organization. There was a feeling that the procedures may indeed encourage responsibility, and exclude unscrupulous

34 Chemicals
operators from the market. However, there was a feeling that the system could have been set up in a more industry-friendly way and that the Commission could have consulted more widely with different players, including SMEs. On the other hand, some interviewees, and particularly those from Member States with a high level of environmental protection and awareness, agreed that any common Community system was better than differing national ones.
In terms of overall effectiveness, our postal survey showed that 43% of respondents considered the functioning of single market (SM) measures to have completely or mostly succeeded in dismantling barriers to trade - Section 4.1.2 provides more detail and differences in responses by country and sub-sector. A further 31% of companies considered the functioning of SM measures to have succeeded partially in dismantling barriers to trade. The next section in this chapter provides a more detailed assessment of remaining barriers to trade and Section 4.1.2 reports the relevant survey results.
In terms of overall awareness of the measures, the postal survey response rates for each measure can be used to assess the degree of awareness. Our postal survey results suggest that more than three-quarters of the companies participating in the survey expressed a view about the success of all the 19 measures for which they were asked (SMP, sector specific and horizontal) with the exception of:
(a) simplified patenting procedures; (b) the opening up of public procurement; (c) the liberalization of capital movements; (d) double-taxation agreements; (e) marketing and distribution of dangerous substances; (f) state aids and free movement of labour.
Given the size distribution of the companies participating in the survey, with more than 40% of companies employing fewer than 50 employees, this indicates a relatively high level of awareness of the main EC initiatives throughout the EC.
3.4. Remaining legal or administrative obstacles and/or shortcomings
We provide below an assessment of the areas where legal or administrative obstacles to achieving a single market still remain. This is based on:
(a) the interviews and survey results; (b) industry views as expressed through CEFIC; (c) discussion with the European Commission; (d) an assessment of current Commission legislative proposals.
In terms of relative significance the most important remaining barriers are in the energy market, followed by the uneven application of environmental measures. Other areas identified were some aspects of sector-specific legislation, intellectual and industrial property rights and competition policy.

Legal and administrative measures taken to complete the single market 35
3.4.1. Energy
There continue to be significant legal obstacles to the creation of a single market for energy. In most Member States energy import and export are national monopolies, and transmission and distribution are subject to local, regional or national exclusive rights, with little competition even at the level of generation. The chemical industry is generally highly energy intensive and would stand to benefit considerably if permitted to procure supplies across borders from cheaper suppliers, or if distributors had a free choice of the generating capacity which could be called up.
In the market for natural gas, there is virtually no competition in distribution. In addition, gas resources are spread very unequally across the Member States. Chemicals and fertilizer companies have been particularly critical of the slow progress of action at Community level. The last official proposal from the Commission seeking the introduction of limited competition in this area dates from December 1993. The proposal followed closely the approach taken in electricity, but appears to have been withdrawn. It is now generally accepted that gas raises significantly different issues from electricity, usually being sourced across borders and often from outside the EU. The Irish and Dutch Presidencies of the EU Council, in particular, are expected to support more rapid progress in this area during their successive terms of office (July 1996 to June 1997).
In electricity, agreement was reached in June 1996 on a timetable for limited liberalization. Available information indicates that the Member States will be permitted to limit the opening of their markets initially to around 22%, rising after six years to 32%. As a first step, only very large consumers (over 100 GWh) will be permitted access to cross-border markets, either via a single buyer or negotiated third party access through the local distributor, at the choice of each Member State.
It is clear that this compromise only partially meets the concerns of industry with regard to competition in the electricity market. It is notable that the extent to market opening is rather limited. Belgium and Ireland are permitted to delay introducing even this limited degree of liberalization by an additional year, and Greece by two years. A 'market equilibrium clause' will permit safeguards to be imposed in order to prevent suppliers from less liberal markets taking disproportionate advantage of more open markets. In addition, smaller users will not be permitted to negotiate with cross-borders suppliers, and will stand to benefit only from indirect competition in generation or supply to distributors. A review of the system is planned after four and a half years of its operation.
3.4.2. Environment
The main issue raised was the use of the subsidiarity principle and Article 100a(4) (see Section 3.2.1) to justify the maintenance of non-harmonized environmental protection measures. Key areas include:
(a) regulation on 'movement of waste'; (b) packaging and waste packaging national rules; (c) eco-labelling.

36 Chemicals
A recent case on this issue was the Commission's authorization to Germany to derogate from the provisions of Directive 91/173/EEC12 on the restrictions on marketing and use of pentachlorophenol. This seems to be a common concern for all chemical sectors.
A Community eco-labelling scheme, established under Regulation (EEC) No 880/92,13 has been in force since 1993. Although common sets of criteria for the award of the label have been established for a number of products, few applications for use of the label have been made, and the scheme is not yet well known. At least for the present, national labels are very well established and have even been regarded as imposing de facto standards for entry to certain markets. In this context, a more developed scheme at Community level is seen as desirable, although there was some concern in our interviews that safeguards would be required to ensure that the criteria would be objective and proportionate. In the present context, it is worth remembering that national eco-labels affect trade between Member States only in end-user markets and not in the kind of business-to-business transactions which make up the bulk of turnover in the chemicals industry. Here, national rules on packaging and waste recovery may potentially be much more significant barriers to trade in the single market.
3.4.3. Chemical legislation
The following areas have been identified:
(a) there is still disagreement between Member States on the adoption of a fully harmonized system for the control over exports of precursors for chemical weapons;
(b) there are still a certain number of cases in which uncertainties are causing disagreement between the Member States about the danger posed by particular substances;
(c) some Member States prohibit the marketing of toxic and very toxic substances to the general public;
(d) technical barriers have resulted from German limits on dioxins in chemicals and from bans on asbestos by Germany, Denmark, the Netherlands and Italy;14
(e) the current Commission proposal on exports of so-called 'dual use goods' or strategic goods.
3.4.4. Intellectual and industrial property rights
The absence of a unified Community system on the protection of intellectual and industrial property rights may create hindrances to cross-border trade. Different national legislation on patent and know-how protection and lengthy regulatory procedures, etc. may impede cross-border trade. Although different efforts have been made at a European level to have common registration procedures, national intellectual property rights legislation remains, and differences between national systems are significant. This is relevant to the agrochemicals sector in particular, where R&D forms a significant part of overall expenditure.
3.4.5. Competition policy
The key areas identified are the following:
12 OJL 85, 5.4.91, p. 34. 13 OJ L 99, 11.4.92, p. 1.
The new Member States (Austria. Finland and Sweden) also have bans on asbestos.

Legal and administrative measures taken to complete the single market 37
(a) further progress in providing complete, timely and transparent information on any state aid and reasoning behind the continuation of state aid;
(b) further lowering of the thresholds for application of the EC Merger Control Regulation; (c) granting of similar treatment to co-operative joint ventures (JVs) as to concentrative JVs
or M&As.
3.4.6. Summary of measures and perceived impacts
The aim of the main elements of the SMP and related legislation and a brief summary of the expected effect on market access, competition, costs, and scale, are given in Table 3.1. The term 'variable' indicates that the expected impact is uncertain and detailed information from companies would clarify what the actual impact was, if any. This is due partly to the existence of national legislation which could affect the impact of SMP measures (e.g. certification), making it more difficult to identify the SMP impact. The term 'indirect increase' in the competition and scale effects column indicates that the specific piece of legislation would have neither:
(a) a direct impact on competition but rather, through creating a level playing-field, indirectly increase competitive pressure; nor
(b) a direct impact on scale but rather, through facilitating cross-border trade and market access encourage companies to expand production and output.
The aim of the table is to give an overall picture of the expected impact of SMP and related legislation. As can be seen from the table, different pieces of legislation would be expected to have similar effects on market access, competition, costs and scale. For example, no specific measure can be considered solely responsible for increasing competition; it is rather the whole series of measures plus the momentum created by the SMP that encouraged a more competitive environment through the creation of a more level playing field and the reduction of barriers to trade. We have aimed nevertheless to identify, where relevant, the relative significance of the different measures in affecting market access, competition, scale and costs.

38 Chemicals
Table 3.1. Brief summary of aims and
Single market measures
Harmonization of technical regulations and/or standards
Mutual recognition of technical regulations and standards
Certification procedures
Simplified patenting procedures
The elimination of customs documentation
Deregulation of freight transport
The elimination of delays at frontiers
The change in VAT procedures for intra-EC sales
The liberalization of capital movements
Double-taxation agreements
Specific chemical legislation
Packaging, labelling and classification of dangerous substances (67/548)
Packaging, labelling and classification of dangerous preparations (88/379)
Packaging, etc. of agrochemicals-pesticides, herbicides, etc (78/631)
Marketing and distribution of dangerous substances (76/769)
Other European initiatives
Access to cheaper sources of input (energy, transport, etc.)
Competition policy and the control of state aids
Environmental legislation
Free movement of labour
Health and safety legislation
Aim
Reduce costs/facilitate market entry
Reduce costs/facilitate market entry
Unify procedures/ reduce costs
Reduce costs
Facilitate trade and reduce costs
Increase trade, reduce costs and increase competition
Increase trade and reduce costs
Reduce costs
Reduce costs -Increase competition
Reduce costs
Protection of health environment, unify procedures, free movement of goods
Protection of health environment, unify procedures, free movement of goods
Protection of health environment, unify procedures, free movement of goods
Protection of health environment, unify procedures, free movement of goods
Reduce costs
Increase efficiency
Social objectives
Reduce costs
Social objectives
expected impact of legislation
Expected impact
Market access
Facilitate
Facilitate
Facilitate
None
Increase
Increase
Facilitate
None
None
None
Facilitate
Facilitate
Facilitate
Facilitate
Increase
Variable
None
None
None
Competition
Increase
Increase
Increase
None
Increase
None
None
Variable
Variable
None
Indirect increase
Indirect increase
Indirect increase
Indirect increase
Increase
Variable
None
None
None
Short-run costs
Variable
Variable
Variable
Reduce
Reduce
Reduce
Reduce
Reduce
Reduce
Reduce
Increase
Increase
Increase
Increase
Decrease
None
Increased
Decrease
Increase
Scale effects
Indirect increase
Indirect increase
None
None
Indirect increase
None
None
None
None
None
Indirect increase
Indirect increase
Indirect increase
Indirect increase
Indirect increase
Variable
None
None
None

Impact of the single market on sectoral performance 39
4. Impact of the single market on sectoral performance
The aim of this section is to evaluate the impact of the SMP in the following areas of the chemical sector:
(a) market access; (b) cross-border sales and marketing; (c) scale and scope effects and foreign direct investment; (d) sourcing; (e) competition, price differentials across the EC and market concentration; (f) direct impact on costs; (g) productivity and competitiveness; (h) employment; (i) environmental performance.
In each of the above areas, we first present and analyse the aggregate data available and then present the survey responses which concentrate on the identification and isolation of the impact of the single market programme (SMP).
4.1. Changes in market access resulting from the SMP
In this section the aim is to test the hypothesis that the single market programme has facilitated market access for EC and non-EC companies based in one EC Member State to other Member States. This hypothesis was tested with questions in the face-to-face and postal surveys,15 by reference to information from market reports, data relating to imports and exports from official statistical sources and quantitative analysis. The hypothesis is based on the assumption that reductions in cross-border transaction costs together with standardization of regulations and technical standards, resulting from the SMP, have:
(a) reduced barriers to entry; (b) established a more level playing-field; (c) made intra-EC market access easier and more attractive for EC and non-EC producers.
4.1.1. Aggregate data
Trade flows
In the sector as a whole, intra-EC exports and imports are more important than exports with the rest of the world as shown in Figures 4.1 and 4.2.
15 The postal and face-to-face surveys covered similar areas, but the face-to-face survey enabled us to collect much more qualitative evidence. We therefore only report the quantitative results for the face-to-face survey where they differ significantly from the postal results or where they cover an area not covered by the postal survey.

40 Chemicals
Figure 4.1. Intra-EC exports as a % of total exports, 1993
Per cent
80
75
70
65
60
55
50
59% 59% 57%
64%
73%
Heavy industrial
chems.
Paints, varnishes and printing inks
Agrochemicals
Sector
Speciality and other chems.
Synthetic fibres
Source: Eurostat. DEBA.
Differences in the share exist at country and sectoral levels. Figure 4.1 shows that sectorally man-made/synthetic fibres have a higher proportion of intra-EC exports than other sectors, reflecting the relatively higher degree of product differentiation in the sector. Only in the case of Portugal do intra-EC exports contribute less than half of total exports. For basic industrial chemicals, including petroleum, in most countries the intra-EC to total export ratio is between 50% and 75%.
Figure 4.2. Intra-EC imports as a % of total imports, 1993
90
80 Per cent
70
60
50
70%
81%
• r
64%
' " 't
74%
Heavy industrial
chems.
Paints, varnishes and printing inks
Agrochemicals
Sector
Speciality and other chems.
Synthetic fibres
Source: Eurostat. DEBA.

Impact of the single market on sectoral performance 41
The import data reflect the importance of geographical proximity for trade in chemicals. One of the sectors in which this ratio has a high variability between countries is paints, varnishes and printing inks. France, the Benelux, the UK, Ireland, and Germany all have ratios above 50% whereas the ratio is far lower for southern European countries. The detailed results are provided in Appendices C and D.
The key aggregate data indicators of the relative success of the SMP in facilitating cross-border market access are related to the significance of intra-EC trade. As trade barriers are reduced and the European market becomes more integrated, companies should find it easier to enter neighbouring markets. This implies that the share of intra-EC exports as a proportion of total exports should increase (and for a given EC trade balance, the share of intra-EC imports as a proportion of total imports).
Analysis of intra-EC import trends
Import penetration is an important measure used as a proxy to indicate changes in market access. Import penetration is the ratio of imports to apparent consumption and as EC markets become more integrated this ratio would be expected to increase.
According to the DEBA overall import penetration increased by 19 percentage points from 1985 to 1991, from 61% to 80% (see Appendix C). Import penetration over the five previous years (from 1980 to 1985) grew by 9 percentage points. Intra-EC imports penetration increased by 12 percentage points between 1985 and 1991, from 43% to 56%. Over the previous five years, intra-EC import penetration grew by 4 percentage points.
There has therefore been a significant increase in the overall level of import penetration consistent with the integration of the EC market in the 1985-92 period.16
The increase in intra-EC and extra-EC imports is, however, proportionally the same (i.e. they both increased by about 30%); this is confirmed by the data on the share of intra-EC imports in total imports for the EU (see again Appendix C); this has remained virtually unchanged over the period at around 70%.'7 The available evidence suggests therefore that the single market has offered similar opportunities to both EU and non-EU producers.
Regression analysis - import penetration The direct observation of an increased intra-EC import share supports the hypothesis of increased market access due to the SMP. However, in order to isolate the SMP impact it is necessary to take into account the other factors that may be affecting the share of intra-EC imports.
16
17
Note that in terms of timing, there was a steep jump in import penetration from 1985 to 1986 (after the accession of Spain and Portugal), a mild increase between 1986 and 1989. and then an accelerated increase between 1989 and 1992.
Sapir ('Europe's Single Market: the Long March to 1992", CEPR Discussion Paper 1245. September 1995) who analysed the change in import penetration from 1966 to 1992. found that the overall increase was almost equally shared between intra-EC and extra-EC imports.

42 Chemicals
In general terms, import penetration is assumed to be a function of relative prices, incomes and structural changes brought about as a result of the SMP. The postulated relationship takes the form:
MP = ƒ (XR, GDP, SMP)
where:
MP: intra-EC and total import penetrations,
XR: ECU/Yen, ECU/$ exchange rates,
GDP: the GDP level of the EC, the US, Japan and South-East Asia, and
SMP: a constant shift dummy variable picking up the impact on MP of the SMP.
There may be other variables that affect import penetration but data availability restricts us in terms of the number of independent drivers we could test. We therefore chose to test the most significant ones and caution that the results must be interpreted carefully and considered as indicative rather than precise estimates. This is an observation valid for all the regression results reported in this study.
The expected impact of the drivers on MP are as follows:
(a) a weaker dollar (or yen) makes US (or Japanese) products more attractive. This should lead to an increase in imports from these countries at the expense of domestic production and imports from other EC countries. A weaker dollar (or yen) - i.e. a reduction in the ECU/$ or ECU/Yen exchange rate - should therefore lead to a lower level of intra-EC import penetration. The effect on total import penetration is uncertain; total imports will increase if there is a switch from domestic production to imports over and above any switch from intra-EC to non-EC imports;
(b) an increase in relative growth of EC GDP should lead to an increase in import penetration; and
(c) the integration of the EC markets through the reduction in barriers to trade should lead to a 'structural' increase in the overall level of import penetration (both intra-EC and total).
Intra-EC import penetration and total EC import penetration were regressed against the ECU/Yen, ECU/$ exchange rates, EC, US, South-East Asian and Japanese GDP and a dummy variable for 1990-92 to capture the SMP impact. We chose the 1990-92 period in all trade regressions, because it is plausible to expect barriers to be effectively reduced closer to the 'deadline' for the creation of the single market.
The coefficients and associated t-statistics for the best regression equations are provided in Table 4.1.

Impact of the single market on sectoral performance 43
Table 4.1. Regression results: dependent variable import penetration, 1980-92
Variable
ECU/Yen
EC ÜDP
US GDP
SMP impact (1990 to 1992) R-squared adjusted Durbin-Watson S.E of regression Mean of dependent variable
Equation (t-statistics in parentheses)
Intra-EC penetration -0.0004
(-1.8505) 0.5875
(1.6102) -0.1853
(-0.5631) 0.0379
(1.6076) 0.9461 1.4390 0.0156 0.4600
Total EC penetration -0.0006
(-2.1588) 0.8918
(1.8636) -0.3002
(-0.6954) 0.0519
(1.6767) 0.9563 1.4427 0.0205 0.6524
The above equations suggest that EC GDP, and the ECU/Yen exchange rate have a significant impact on both intra-EC import penetration and total EC penetration. Note that the ECU/Yen negative coefficient in the intra-EC import penetration regression is rather implausible, although only marginally significant. The above results suggest that Japan's GDP, South-East Asia's GDP and the ECU/$ exchange rates do not have a significant impact on the models.
The SMP dummy variable is marginally significant in both models but its positive sign supports the hypothesis that the single market programme has encouraged a growth in intra-EC import penetration and total EC import penetration. The quantitative estimate is that the SMP has added an extra 3.8 percentage points in intra-EC import penetration and 5.2 points in total import penetration. Intra-EC penetration has grown from around 47% in 1987 to 58% in 1992, so the SMP is estimated to have accounted for more than one-third of the increase. Total import penetration has grown from 66% to 83%, so the SMP is estimated to be responsible for 30% of the increase. In view of the statistical weakness of these results, however, these estimates should be interpreted as rough approximations.
Analysis of intra-EC export trends
A review of the total chemical sector exports over time (excluding pharmaceuticals) indicates that exports from the EC 12 to other countries in the EC 12 increased relative to total EC 12 exports from about 1986, and this increase has continued through to 1992, as shown in Figure 4.3. This provides strong evidence that the SMP has indeed facilitated intra-EC trade by creating a more integrated market.

44 Chemicals
Figure 4.3. Index of intra-EC and total EC exports
Index
(1980
=100) ■ Total EC exports
- Intra-EC exports
1980 1981 1982 1983 1984 1985 1986 1987 1988 1989 1990 1991 1992
Year
Source: Eurostat, DEBA.
When disaggregated by sector, differences emerge as shown in Table 4.2 which details the
average intra-EC to total EC export ratio for each country and sector over two time periods,
1980-87 and 1988-92. The split is made in order to capture any anticipation of the SMP in the
second period compared to the first. The most noticeable result is that in almost all sectors and
countries the share was higher on average over the period 1988-92 compared to the earlier
period.

Table 4.2. Intra-EC to total exports (%) by country and sector
Country Germany France Italy Netherlands Lux. & Belgium UK Ireland Denmark Greece Spain Portugal Ell 12
Basic industrial chemicals
Avg. 1980-87 45 64 46 67 53 53 64 27 44 39 71 54
Avg. 1988-92 46 69 53 72 79 54 62 30 60 56 74 58
Paints, varnishes & printing inks
Avg. 1980-87 53 57 28 66 74 39 94 45 49 1
21 53
Avg. 1988-92 56 66 40 70 80 54 93 42 54 6 25 59
Agrochemicals
Avg. 1980-87 49 52 43 66 71 44 68 28 46 47 80 52
Avg. 1988-92 52 58 52 67 75 51 71 26 52 25 88 57
Speciality and other chemicals
Avg. 1980-87 52 70 59 62 56 62 79 35 58 16 70 59
Avg. 1988-92 53 75 58 66 63 66 88 53 64 34 88 62
Synthetic fibres
Avg. 1980-87 60 69 56 77 84 28 93 22 54 64 57 58
Avg. 1988-92 66 76 69 85 84 54 92 25 61 86 53 68
c 3_ -α o —t
3
Source: Eurostat, DEBA.

46 Chemicals
It is important to consider the overall trend of increasing intra-EC total export shares in the context of the overall trade flow between the major trading blocks, because a sudden decrease in European exports in absolute terms would, ceteris paribus, increase the intra-EC to total export ratio. This is reviewed in Figure 4.4 in which the real chemical sector trade balance in Europe is seen to decline in real terms from 1985 to 1992. However, the percentage fall from 1987 to 1992 is only about 6% so although this may account to some extent for the increase in the intra-EC to total EC export ratio, it is likely that the SMP also had an impact by facilitating intra-EC market access.
Figure 4.4. Real chemical sector trade balance in Europe, the USA and Japan
30.0
25.0 -
Real 1990 prices (billion ECU)
5.0 -
0.0 -
-5.0 -1985
i 1986
1
1987 1988 1989
—A
1990 1991 1992
i
Source: CEFIC.
Regression analysis - export shares
A number of factors affect intra-EC exports as a proportion of total exports from the EC:
(a) the value of the dollar relative to the ECU (see Figure 2.6). The relative weakness of the dollar since 1986 could, ceteris paribus, result in an erosion of the EC share of world exports and this should, therefore, result in an increase in the above ratio;
(b) the value of the Yen. The relative rise in its value could result in a reduction in the intra-EC export market share due to increased exports to Japan and an erosion of Japan's world exports share;
(c) the relative growth of EC GDP compared to the rest of the world and the associated increased presence of competitors from NICs.

Impact of the single market on sectoral performance 47
We therefore examined the relationship between the overall intra-EC export share and:
(a) exchange rates; (b) GDP growth rates; and (c) the SMP
1 8
by undertaking regression analysis with data from 1980 to 1992. The basic modelling framework is similar to the one presented when analysing import penetration. The key aim is to identify whether the SMP had a positive impact on the intra-EC export share over and above changes in exchange rates and GDP. Appendix E provides the detailed regression results and discusses the various tests we performed. Table 4.3 reports the main form of the equation estimated. Note that the growth in EC GDP is statistically significant and has the expected impact.
The variable capturing the impact of the SMP is a constant shift dummy taking the value of unity from 1990 to 1992, as in the import penetration regressions. The results are quite poor with the dummy having a positive but insignificant coefficient. This was found to be quite unstable as well and we therefore cannot use these regression results to derive any reliable quantitative conclusions about the impact of the SMP.
Table 4.3. Regression results: dependent variable is share of intra-EC exports, 1980-92
Variable
Constant
ECU/Dollar
EC GDP
SMP impact (Dummy=l, 1990-92) R-squared adjusted S.E. of regression Durbin-Watson Mean of dependent variable
Equation (t-statistics in parentheses)
-0.40 (-2.37) -0.023 (-1.68)
0.20 (5.78) 0.0048 (0.58) 0.9298 0.0078
1.75 0.55
Source: see Appendix E.
Trade trends by sub-sector
Characteristics within each sector, where they vary significantly from the overall results, are given below.
Heavy/basic industrial chemicals
Although exports have not increased as much as imports, Figure 4.5 indicates that intra-EC exports have increased at a faster rate than total exports since 1986, again supporting the hypothesis that market access has improved as a result of the SMP. The rate at which market
The abolition of EC customs controls in 1992 has caused some inconsistencies in data between 1992 and 1993/94: we therefore chose not to use data bevond 1992.

48 Chemicals
share has increased and the time at which the share begins to increase is very similar to that for
the sector as a whole. The import penetration trend also supports the hypothesis. For Europe as
a whole the intra-EC import penetration ratio in the basic industrial chemicals and petroleum
sectors averaged 32% from 1980 to 1986, and this increased to 40% from 1987 to 1992. This
trend is reflected in all countries for which data were available.
Figure 4.5. Intra-EC and total exports for basic industrial chemicals and petroleum
■ Total EC exports
- Intra-EC exports
1980 1981 1982 1983 1984 1985 1986 1987 1988 1989 1990 1991 1992
Year
Source: Eurostat, DEBA, 1995.
Synthetic fibres
Intra-EC imports in this sector represent about 71% of total EC imports, which illustrates the
high degree of trade between Member States. A possible explanation for this may be that the
restructuring in the 1980s together with competition from the NICs encouraged the European
synthetic fibres sector to focus more on higher value-added products for which there is
significant demand in Europe.
Man-made fibres show a large relative increase in intra-EC exports compared to total exports,
as shown in Figure 4.6, again supporting the overall hypothesis. Intra-EC import penetration is
also quite high in this sector compared to other sectors. From 1980 to 1986 the ratio averaged
44% compared to 52% from 1987 to 1992.

Impact of the single market on sectoral performance 49
Figure 4.6. Intra-EC exports and total exports in the man-made fibres industry
Index
(1980
=100) I10
• Total EC exports
IntraEC exports
1980 1981 198 1983 1984 1985 1986 1987 19
Year
1989 1990 1991 1992
Source: Eurostat, DEBA, 1995.
Paints, varnishes and printing inks
Figure 4.7 shows again that intraEC exports have increased at a faster rate than total exports,
although the differential is not as great as in some of the other sectors.
Figure 4.7. Intra-EC exports and total exports in paints, varnishes and printing inks
Index
(1980 20
°
=100)
■ Total EC exports
IntraEC exports
l»80 1981 1982 1983 1984 1985 1986 1987 1988 1989 1990 1991 1992
Year
Source: Eurostat. DEBA. 1995.

50 Chemicals
This is not surprising, however, since this sector's products are not as tradable as other sectors' products. A lowering of trade barriers would be less likely to have a strong impact on the ratio of intra-EC to total exports.
Intra-EC import penetration in this sector has risen slowly but steadily in most countries (see Figure 4.8).
Figure 4.8. Intra-EC import penetration for paints, varnishes and inks in four EC countries
Source: Eurostat, DEBA, 1995.
The trade indicators for other sectors, both intra-EC exports and import penetration, are largely similar to the overall trend. Detailed numbers are provided in Appendices C and D.
Regression analysis
We also performed regression analysis to explain the intra-EC trade shares by sub-sector. The results are reported in Appendix E.3.1. The only sector for which the SMP dummy coefficient was found to be positive and statistically significant was speciality and other chemicals. The SMP was found to have led to an increase of intra-EC export shares of 3.2 percentage points in this sector. In all other sectors the SMP dummy was either insignificant or wrongly signed. Therefore, the regression results again cannot provide a reliable basis for estimating quantitatively the impact of the SMP.
4.1.2. Survey results
The face-to-face and postal surveys enquired about the success of SMP measures and related sector-specific and other EC initiatives in overcoming barriers and obstacles to trade. We began by examining the impact of SMP measures, followed by the impact of sector-specific legislation and other EC initiatives. This is followed by an assessment of the remaining barriers to trade based on the interview programme and other literature. The section concludes with the survey results on the assessment of the overall success of the SMP and the relative

Impact of the single market on sectoral performance 51
significance of the SMP for the industry compared to market and technological trends over the period.
Figure 4.9 presents the results of the postal survey relating to a series of 11 sets of SMP measures. Overall the measures have succeeded in having some or a large positive effect in overcoming barriers to trade, especially in:
(a) the elimination of delays at frontiers and customs documentation; (b) deregulation of freight transport; (c) the mutual recognition and harmonization of technical regulations/standards; (d) certification procedures.
The relative success of the different measures showed some variations by sector and country.

Figure 4.9. Impact of single market measures on overcoming barriers and obstacles to trade
45%
Postal questionnaire overall responses For each of the following single market measures please indicate if the SMP has had a positive or negative effect in
overcoming barriers and obstacles to trade.
Harmonization Mutual Certification Simplified The opening The elimination Deregulation of The elimination The change in The Double-of technical recognition of procedures patenting up of public of customs freight of delays at VAT liberalization of taxation regs. and/or technical regs. procedures procurement documentation transport frontiers procedures for capital agreements standards and standards intra-EC sales movements
1 Negative effect I No effect Π Some positive effect D Large positive effect
η

Impact of the single market on sectoral performance 53
The harmonization of regulations and standards seems to have affected, in particular, plastics manufacturers, inorganics producers and agrochemicals producers. It also seems to have favoured larger companies, who have been more able to take advantage of the harmonized rules and have probably benefited more from the establishment of a level playing-field. The legislation related to mutual recognition of regulations and standards has, on the other hand, benefited mostly the smaller companies. Such companies would clearly face relatively more significant costs in trying to meet all the different requirements in the various EC Member States.19 The mutual recognition legislation seems also to have affected more significantly the peripheral Member States, Spain, Italy, Greece, and Ireland. Legislation on certification procedures has affected more positively the sectors that are involved the most with such procedures, such as plastics, inorganics and agrochemicals.
• ~)(\ The most positively affected sectors from the trade and transport related legislation are fibres, dyes and pigments, plastics and agrochemicals. These are sectors where transport costs are significant with a relatively high degree of intra-EC trade. The most positively affected countries from such legislation are Ireland, Greece, Italy, Spain and Portugal. The elimination of customs documentation has affected more positively the larger companies, but deregulation of freight transport and elimination of delays at frontiers seem to have affected similarly SMEs and large companies.
The liberalization of capital movements has affected more favourably the medium-sized companies. Smaller companies (fewer than 50 employees) seem to be less affected by such legislation as are the very large companies (more than 1,000 employees) which have access to international financing services. Double-taxation agreements affected mostly the large companies.
Comments from company interviews also showed a variation in perceptions of success of measures. German companies in particular commented that harmonization is positive in that it sets a 'level playing-field'. One UK company was more specific in saying that benefits have arisen from the harmonization of 17 different sets of regulations into one. They went on to point out, however, that, in capital intensive industries, new investment is only permitted if national emission standards are met. These standards are not all harmonized, allowing large differences in environmental performance.
Some concern was expressed also for the change in VAT procedures and the harmonization of technical regulations and standards. One major concern expressed by several companies was basically that VAT rates need to be harmonized. More specifically, one company indicated that, for VAT changes, the principle of final consumption (rather than production) as the point of tax (avoiding allocation of credits) has not yet been accepted. The current situation is very
The European Commission has conducted a Business Survey {The Single Market Review, Results of the business sw-vey. Office for Official Publications of the EC and Kogan Page.Earthscan. 1997) which provides data on the impact of the single market on 20.000 companies within the manufacturing and services sector. Respondents to this survey include approximately 800 chemical companies. The results of the EC Business Survey and the KPMG questionnaire were used to make comparisons at the aggregate chemicals industry level, where there was overlap between the two surveys. In general, the results of the two surveys are largely similar. In the case of the impact of legislation, for example. 38% of the EC Business Survey respondents claimed that the harmonization of technical regulations and/or standards had a positive impact on eliminating barriers to trade, compared to 50% of KPMG respondents. On the issue of mutual recognition of technical standards and regulations. 50% of EC Business Survey respondents and 39% of KPMG respondents claimed that this measure had a positive impact on eliminating/overcoming barriers to trade.
Elimination of customs documentation and delays at borders and deregulation of freight transport.

54 Chemicals
much a halfway house, with the clearing house (to allocate credits between producing and consuming countries) being far too bureaucratic.
Sector-specific legislation
Turning to the assessment of the impact of chemical legislation, Figure 4.10 presents the results related to sector-specific legislation.
The overall results suggest that the legislation had some or a large positive effect. There are also concerns, however, with more than 15% of companies considering that the legislation on packaging, classification and labelling of substances and preparations had a negative effect on trade. Our interviews and case studies (see Italian case study in Chapter 6) suggest that this is due to:
(a) inconsistent application of the rules across the EC; and (b) for smaller companies, an increase in costs as a result of the more stringent requirements
of the Directives. This could therefore inhibit indirectly their efforts to export to other EC countries.
A recent report by Imperial College21 suggests also that smaller companies in the dyes and pigments sector were adversely affected by the 6th and 7th amendments of the directive on classification and labelling of dangerous substances (67/548). In particular it was felt that the increase in the cost of registering a new substance has led companies, especially smaller ones, to refocus their activities towards development of existing substances rather than establishment of new substances. Directive 78/631 has not had really any noticeable impact in any sector other than agrochemicals, where the majority of companies (52%) felt it had at least some positive effect. The Directive establishes the general rules for use of substances in agrochemicals but the annex which will list the substances that can be used is currently empty.
Our case study of a German agrochemical company also identified some concerns about the product registration procedures. The registration of new agrochemical products, and particularly herbicides, is a lengthy and costly process within the EU. Legislation is becoming increasingly stringent, largely driven by the Scandinavian countries who want to minimize the use of agrochemicals. For example, Denmark has not registered a fungicide in the last ten years.
The result is that companies either:
(a) only register new products, eliminating older products from the range as they are too expensive to register; or
(b) offer older products to more restrictive markets, such as Denmark. This is possible because politically it is acceptable to restrict new registrations but less so for older products, whose unrestricted use has been previously sanctioned by the same legislature; or
(c) move more towards generics production.
'The Impact of the 6th and 7th amendments of EC Directive 67/548 on the registration and development of substances and preparations'. Imperial College, 1994.

Impact of the single market on sectoral performance 55
The EC Product Registrations in Brussels has proposed recently the following changes, which are supported by the company:
(a) approval of product field trials in one country should be transferable to others, given the same soil conditions, etc. - avoiding the need for repetition of the same trial in each country in which registration is required;
(b) toxicological evaluation should be centralized in one location within the EU; (c) formulation evaluation should be carried out locally, unless previously repeated
elsewhere in the EU, when transfer of results should be possible; (d) product registration should be centralized within the EU. Currently, EU legislation is
superimposed on national laws, creating a two-tier system.
To achieve the latter objective will require the current national structures or 'power bases', requiring registration staff in each country, to be broken. Achieving the US model where, although there are both federal and state laws, registration is not decentralized, will substantially reduce costs and speed up the registration process.

Figure 4.10. Impact of specific chemical legislation measures on overcoming barriers and obstacles to t rade
Postal questionnaire overall responses
For each of the following specific chemical legislation measures please indicate if the SMP has had a positive or
negative effect in overcoming barriers and obstacles to trade.
Packaging, labelling and classification
of dangerous substances. 67/548
Packaging, labelling and classification
of dangerous preparations, 88/379
Packaging, etc. of agrochemicals
- pesticides, herbicides etc., 78/631
Marketing and distribution
of dangerous substances, 76/769
1 Negative effect I No effect □ Some positive effect Π Large positive effect
η

Impact o f the s ingle market on sectoral performance 57
Horizontal measures
Turning to other EC legislation, Figure 4.11 presents the perceived effectiveness of other
horizontal EC initiatives in overcoming obstacles to trade.
Figure 4.11. Impact of other EC initiatives in overcoming barriers and obstacles to
trade
Postal questionnaire overall responses
For each of the following EC initiatives please indicate if they had a positive or negative effect in
overcoming barriers and obstacles to trade.
Compétition
policy and the
conlrol of
stale aids
Β Negative efTect
■ No effect
Q Some positive
effect
□ Large positive
effect
Environmental
legislation
Free
movement of
labour
Health and
safety
legislation
As expected, given the nature of the sector, environmental legislation and health and safety
regulation are the most significant initiatives. The apparently conflicting responses to the
effectiveness of the environmental legislation reflect:
(a) the positive perception of some companies that considered the legislation to have made
progress towards establishing a level playing-field;
(b) the negative perception of other companies that witnessed their costs increasing as a
result, especially smaller companies, in the southern Member States.
Face-to-face company interviews reflected the range of views:
(a) Some respondents believed environmental regulation to be sometimes over-done
(regarding, for example, packaging, drinking water, incineration). Others felt that
freedom given to Member States to deviate from EC measures was inappropriate.
(b) Some respondents felt that the volume of this legislation increases year on year and
tends to focus on theoretical rather than practical measures. Compliance is thought to be
good from large companies and poor from small. There is a view that regulation results
in EC companies becoming less competitive versus the rest of the world (see Italian
fibre company case study in Chapter 6). Lack of harmonization results in countries with
strict legislation, for example Germany and the Netherlands (with environmental taxes),
becoming less competitive versus the rest of the EC.
With the exception of agrochemicals, which is the most negatively affected sub-sector, all
other sectors seem to have a similar split between negative and positive effect. There seems to
be also a size effect, with medium-sized and very large companies most negatively affected.

58 Chemicals
The countries that seem to be the most negatively affected are the Netherlands and the UK.
This may well be reflecting delays in introduction in other countries as well as relatively
stronger monitoring and enforcement mechanisms in those two countries.
Note, however, that studies of the link between environmental legislation and competitiveness
have reported that higher environmental standards in developed countries have not tended to
lower their international competitiveness. There has been little systematic relationship
between higher environmental standards and competitiveness in environmentally sensitive
goods (those that incurred the highest pollution abatement and control costs...).22 A similar
conclusion comes out of a literature review by economists of Harvard University, the US
National Bureau of Economic Research and Resources for the Future, namely that 'studies
attempting to measure the effect of environmental regulation on net exports, overall trade
flows and plant location decisions have produced estimates that are small, statistically ■yi
insignificant or not robust...' (see also Section 4.6.1).
Furthermore, companies do recognize the level playing-field created by harmonized
environmental legislation in the long run; this was stressed in our case study with an Italian
fibre company (see Chapter 6).
Health and safety regulation is considered to have had a positive effect, possibly because the
cost implications of such legislation compared to environmental legislation are less
significant. Competition policy and the control of state aids were clearly perceived to have a
relatively more significant positive effect for larger companies.
Remaining barriers
Turning next to remaining barriers, companies were also asked to assess the extent to which a
series of potential obstacles were still a significant trade barrier. The list of obstacles was
constructed following a series of preliminary meetings with companies, European trade
associations and the European Commission. Figure 4.12 presents the answers of the postal
survey.
Other than language, the key obstacles are:
(a) environmental taxes (especially for Spain, the Netherlands and Denmark and
agrochemicals and inorganics) and cost of energy. In the case of environmental taxes,
concerns are likely to be reflecting the uneven playing-field within the EC and the need
for harmonization of legislation;
(b) non-adoption and lack of full mutual recognition of equal standards, consistent with the
concerns expressed about the sector-specific chemical legislation (see, for example, the
relevant section in the Italian fibre company case study in Chapter 6);
(c) anti-competitive behaviour and industry subsidies. This reflects the concentration of the
sector, especially in some sub-sectors and the existence of publicized cases of alleged
anti-competitive behaviour, more recently in plastics.
2.1
Piritti Sorsa, Competitiveness and Environmental Standards, Washington DC. World Bank Policy Research Working
Paper 1249, 1994.
Adam Jalle. Steve Peterson. Paul Porlney and Tobert Stavins. 'Environmental Regulation and the Competitiveness of
US Manufacturing: What Does the Evidence Tell Us?", Journal of Economic Literature, March 1995.

Impact of the single market on sectoral performance 59
It is interesting to note that countries where standards are considered relatively high and rigorously enforced (e.g. Germany, the UK, France) did not seem to consider the non-adoption of equal standards as a more significant trade barrier. A significantly higher proportion of companies in Denmark and the Netherlands considered, however, that non-adoption of equal standards was still a trade barrier. Companies in these countries would therefore seem to face stronger competition from producers in countries were standards may be lower or unevenly enforced.
Many companies in the face-to-face survey were particularly critical of inaction in the energy area. As reported by one company, '... fuel oil can be sourced competitively across Europe and beyond at free market prices. Electricity, however, cannot be produced internationally and is more expensive rather than cheaper. Big UK chemical companies have complained about price differences which are driven by the monopolistic situation in Europe'.
With regard to state aids, the assessment of industry views indicates that these still form a considerable barrier to trade across the Community and that these are likely to affect more disproportionately SMEs, which, by virtue of their size, are unlikely to be able to have access to state aid to the same degree as larger companies (see also Chapter 6). A number of companies elaborated on the subject beyond the scope of the questionnaire. The overall impression from interviews is that the state aids policy is not effective and may be biased in favour of large countries in Europe. The main specific points made were:
(a) synthetic fibres is a new industry with the first plants in the EC built in the 1950s and 1960s. With the help of state aids, capacity quickly built up until a high excess capacity forced the EC to consider how to slow down investment with a law disallowing state aids to the fibre industry. Such practices still continue, however (see Italian fibre company case study in Chapter 6), creating competitive disadvantages for some of the more efficient companies;
(b) petrochemicals is the subject of significant state subsidies. Major projects are said to be heavily subsidized, for example enormous investments in the former East Germany, creating unfair competitive advantage;
(c) state aid policy is felt by some to be ineffective, because small countries or those with less influence always lose out. This may not affect the sector directly; for example, the French are said to have invested huge amounts in domestic electricity via state aid despite major over-capacity. Industry is now selling subsidized electricity at incremental cost. A second example cited with severe over-capacity was the salt industry, with the Dutch government subsidizing a new domestic mine.
The following issues were also raised in our interviews (and our case studies, see Chapter 6):
(a) the move towards a single currency and EMU - at least one company in the interviews commented that the key barrier to trade within the EC is exchange rate movements;
(b) absence of harmonization of employment legislation regarding pensions, retirement, etc. with particular reference to mobility of managerial staff;
(c) inconsistency of standards on fibres used in furniture; (d) significant differences in redundancy legislation act as exit barriers and may also deter
entry.

60 Chemicals
A recent study by the UK Department of Trade and Industry (DTI)24 on barriers in the chemical sector in the single market also examined obstacles to trade in the chemical sector in the EC. It points out that lack of or partial harmonization and over-regulation have the potential to inhibit trade.
This study undertook a survey of UK chemical companies to understand the market perceptions of these factors as potential barriers to trade. The study reports that the overall impression is that the chemical sector is complex and heavily regulated. In terms of the functioning of the single market, however, it was found to function well overall. The study identifies a number of areas of difficulty and of potential difficulty.
Where problems were identified in the DTI study, the majority related to health, safety and the environment (HS&E) (28% of total references); standards (18%); labelling and packaging (16%); and transport (16%). When disaggregated by sector, those sectors covered in our study most affected by barriers to trade were plastics processing (7%), specialized organics (6%), and agrochemicals (5%). It was difficult to establish any strong correlation between the sectors of the industry affected and the type of barrier alleged to exist except in the case of agrochemicals, where 60% of cases related in some way to standards; and specialized organics, where 50% of cases related to HS&E issues, and 50% to, inter alia, labelling and packaging.
Overall success of the SMP
Figures 4.13 and 4.14 summarize the results from our survey of the answers on the overall success of the SMP, by sector and by country. The majority of companies consider the SMP to have been overall successful in dismantling barriers to trade.25 A significant number of companies consider, however, this success to have been partial, and this is particularly true in agrochemicals and plastics. Upstream sectors (petrochemicals and inorganics) seem also to be overall more satisfied with the SMP success, but this may also reflect the fact that those two sectors were more integrated when the whole process began. As the chairman of the Association of Petrochemicals Producers in Europe (APPE) said: 'We [the petrochemicals sector] had an internal market in Europe since the seventies.' Denmark stands out as clearly considering the single market programme to have been only marginally successful, with Portugal and Ireland the most positively affected.
UK. Department of Trade and Industry [1995], 'Study of barriers to trade in chemicals in the single market'.
The majority of EC Business Survey respondents, approximately 43%. found that single market legislation has been a success in eliminating obstacles to EU trade. This is broadly similar with our findings that 41% of firms believe that the single market has 'completely' or 'mostly' succeeded in dismantling barriers to cross-border trade.

Figure 4.12. Remaining obstacles to trade
•α
Industry
subsidies
from the state
Postal questionnaire overall responses
Please indicate the extent to which the following are still a trade barrier.
Anti
competitive
behaviour
Mutual
recognition of
standards and
procedures
Non
adoption of
equal
standards
Distribution Technical or
technological
differences
Cost of
energy
Environmental
taxes
S*«^B $"**■■ 1 ' 1 '•Ά ' ■ : ■ 1 ■
ii :
,.
' . . i j r i i
^ :.',-' »"»ι .Sí·1
ί$ - I t ·;
'■- -Vi
i ■
Language
El Insignificant Some significance D Significant D Very significant

62 Chemicals
Figure 4.13. Dismantling barriers to cross-border trade, by sector
Postal questionnaire sector responses
Overall, has the functioning of single market measures succeeded in dismantling barriers to cross-
border trade?
40% -
35%
30%
20%
15%
10% Ρ
5% |
I 0%
m
-|
1 ι II
1
J ï .il 1 ■ 1
Π ,
■
l !
^
li ii I l i J_l _J_I
-1
1 1 11 ι
Ξ Yes, completely
■ Mostly
D Partially
Π Hardly at all
■ Notatall
Average Petro Inorganic Pigments Plastics Fibres Agro Paints and Other chemicals and dyes chemicals varnishes
Figure 4.14. Dismantling barriers to cross-border trade, by country
Postal questionnaire country responses
Overall, has the functioning of single market measures succeeded in dismantling barriers to cross-
border trade?
70%
60%
50%
' 40%
30%
1 20%
10%
0% Ü i IJ Average Germany Italy Spain Portugal Greece Denmark The France UK Ireland Belgium
Netherlands
H Yes. completely
■ Mostly
D Partially
□ Hardly at all
■ Notatall
Relative significance of the SMP
In the facetoface survey companies were also asked to identify the relative significance of the
SMP when compared with developments in other key drivers of the sectors' activities and
structure, including the economic cycle and technology.

Impact of the single market on sectoral performance 63
Figure 4.15 presents the results. Clearly, market trends and technology were more significant
over the last five to ten years. The SMP was, however, assessed as more important than a
number of other international trade and competition drivers.
It must be stressed that the survey results reported in this section stress the direct effect of the
SMP, sector-specific and related legislation. The indirect effects of such legislation, through
the creation of a level playing-field and the exploitation of economies of scale, are addressed
in detail in Sections 4.3, 4.5, 4.7 and 4.9.
Figure 4.15. Relative significance of the SMP
Face -to-face interview responses What other developments have had a major impact on your
business over the last ten years?
The development was:
. Ξ Much more important
■ More important
: 0 As important
| D Less important
Trade
barriers
outside EC
Quotas or
similar
4.1.3. Conclusions
Overall, the data support the hypothesis that the single market programme has facilitated
market access. The aggregate data test this hypothesis by using two key indicators:
(a) intra-EC exports share to total exports;
(b) import penetration.
Both these indicators support the hypothesis. Intra-EC exports are seen to increase relative to
total exports, from about 1988, which can be reasonably assumed to be the date that most
companies started including anticipation of the single market programme in their decisions.
The increase in intra-EC trade share to total trade is, however, also seen to be partially
attributed to a fall in the trade balance of Europe in the chemical sector compared to other
major trading blocks.
Intra-EC import penetration is also seen to increase overall at a higher rate from 1986 to 1992
than over the 1980 to 1985 period although total import penetration has also increased over the
same period. Regression analysis of the share of intra-EC imports in total chemical imports
was also found to support the hypothesis.
The survey results were also supportive of the SMP and related measures having had a
beneficial effect on intra-EC market access. The legislation was particularly successful in
eliminating customs documentation and delays at frontiers and in deregulating freight

64 Chemicals
transport. Areas where barriers remain include energy costs and the adoption of equal
standards and procedures.
4.2. Development of cross-border sales and marketing
This section overlaps with the hypothesis set out in Section 4.1 that the SMP has increased
market access to other EC countries. In this section the emphasis is more on qualitative
impacts. The basic hypothesis is that the SMP has encouraged and facilitated the development
of crossborder sales and marketing activity.
4.2.1. Aggregate data
As shown in Section 4.1 the trade flow statistics which compare intraEC exports with total
exports show a higher relative growth in intraEC exports than total exports in all sectors and
also a higher rate of intraEC import penetration over the 198792 period. These factors
support the hypothesis that greater market access and therefore increased development of
crossborder sales and marketing have taken place.
4.2.2. Survey results
The postal survey enquired about the extent to which the single market programme facilitated
selling and/or exporting to other EC countries. Figure 4.16 presents the results on average and
by sector.
Figure 4.16. Impact of the SMP on ability to sell/export to other EC countries, by sector
Postal questionnaire sector responses
Overall, to what extent has the functioning of the single market facilitated your ability- to sell/export to
other EC countries?
45%
J 40%
■ 35%
30%
25%
20%
15%
10%
5%
0%
Average Petro
chemicals
Inorganic
GNocMent
■ Limited cMcm
GSomccMcnl
O Significant extent
Dyes and
pigments Agro Paints and chemicals varnishes

Impact of the single market on sectoral performance 65
More than half the companies responded that the SMP facilitated their selling/exporting to
other countries to at least some extent. If, however, we exclude the companies that gave no
answer to this question then nearly two-thirds of the companies that replied felt that the SMP
had helped.
The sectoral breakdown of responses reveals some differences by sector. Fibres and paints and
varnishes seem to be the least affected sectors. This is not surprising since the paints and
varnishes sector is characterized by products that are relatively bulky and costly to transport so
that trade tends to take place in the more high value segments of the market. National markets
tend to be dominated therefore by domestic producers who have managed to maintain a
competitive cost advantage in the high volume, relatively low value, end of the market. The
fibres sector is characterized by a relatively high degree of intra-EU trade which preceded the
single market and it is therefore possible that the responses reflect the relatively higher degree
of integration of the European market.
Inorganic chemicals seem to have been affected more positively than other sectors, reflecting
the significance of trade barriers for the non-bulk segment of the sector. The plastics sector
seems to have been affected also more positively than other sectors.
Figure 4.17 presents the results by country of respondent. Portugal and Greece seem to have
been much more positively affected than the other countries. Denmark and France, on the
other hand, seem to have been assisted by the SMP less than other countries in their efforts to
sell/export to other EC countries. For Denmark, this is consistent with the views overall about
the success of the SMP to dismantle barriers to trade. The responses should be treated
cautiously, however, because of the relatively low number of survey participants from
Denmark.
Figure 4.17. Impact of the SMP on ability to sell/export to other EC countries, by
country
Postal questionnaire country responses Overall, to what extent has the functioning of the single market facilitated your ability to sell/export to
other EC countries?
50%
40%
30%
20%
10%
0%
Θ No extent
I
■ Limited extent
D Some extent
D Significant extent :
Aserage Germany Italy Spain Portugal Greece Denmark The France UK Ireland Belgium Netherlands
In a broadly similar vein. 43% of the EC Business Survey respondents felt that the single market has had a positive
effect on their ability to sell to other EU countries compared to just over 50% of KPMG respondents who answered
positively to the same question.

66 Chemicals
Table 4.4 presents the postal survey responses on the percentage of companies exporting to other EC countries since 1988. As can be seen, the percentage of companies involved in intra-EC trade has increased by 10 percentage points, in those seven years or in proportional terms by 15%. This is consistent with the aggregate evidence presented in Section 4.1 and suggests that the export expansion recorded in the aggregate involved not only expansion of exports of companies that already sold to other EC members, but also an increase in the number of companies involved in intra-EC trade. Further confirmation is provided in the section on competition.
Table 4.4. Percentage of companies with sales in other EC countries - excluding non-replies
1988
64
1992
71
1995
74 Source: Postal survey.
Although not reflected in the official statistics, companies referred to the single market as being one of several factors stimulating them to refocus their European operations at the transnational rather than the national level. For example, BP established a new regional office in Brussels in 1990 and then in 1992 indicated that the EC single market stimulated them to develop operational structures that span the entire region, including the non-EC countries in Europe. Other companies such as Bayer and Shell reported significant expansion of activity in various European countries since 1990.
4.2.3. Conclusions
The aggregate trade data support the hypothesis that the SMP has facilitated cross-border sales and marketing. The survey responses also confirm the aggregate data result with a significant majority of companies considering that the SMP assisted them, at least to a limited extent, with their sales and export efforts to other EC countries. There seems to be little sectoral or geographical variation although the inorganics sector and Greece/Portugal seem to have been affected more positively than the overall average.
4.3. Scale and scope effects and foreign direct investment
This section investigates the extent to which companies in the chemical sector have taken advantage of economies of scale and scope over the last decade and aims to assess how the SMP may have influenced the process. One of the key benefits from enhanced economic integration in Europe is that lower costs resulting from economies of scale and learning are made possible by the larger volume of output and by restructuring processes.
Economies of scale in the chemical industry arise largely in the production of bulk chemicals at the plant level, where there are considerable advantages in large plant, continuous operations production. Economies of scale at the company level arise also where there are significant pre-productivity R&D costs, and companies would benefit by spreading these fixed costs across a large volume of output. This will affect specific sub-sectors of the chemical industry, in particular downstream inorganic segments, dyes and pigments and some agrochemicals.

Impact of the single market on sectoral performance 67
Research by Pratten [1988], on the average cost curve gradient at V2 minimum efficient technical scale (METS) for some sectors, estimated the values for three of the sectors included in this study (Table 4.5). The values for two out of the three sectors were estimated to be quite high. The METS represents the quantity of output at which maximum economies of scale are possible. The values in the third column of the table indicate that the average cost for a company half the efficient size is 12% higher in petrochemicals, and 17-22% higher in dyes. The implication is that potential for significant economies of scale exists especially in dyes and petrochemicals.
Table 4.5. Potential for economies of scale in some chemical sectors
NACE code
26 251 251 256
Product
Cellulose fibres Dyes Petrochemicals Fertilizers
Cost gradient at 'A METS
3% 17-22% 12% n/a
Source: Pratten. 1988.
Following on from this, the hypothesis in this section is that the SMP has contributed to increased average scale of production through the expansion of output in other EU countries with a consequent reduction in unit production costs.
4.3.1. Aggregate data
The variables that are used as indicators to test this hypothesis are average plant size, mergers and acquisitions (M&As) and data on foreign direct investment (FDI). We first provide, however, aggregate official statistics on turnover and number of companies to establish the framework in which the M&A activity took place.
4.3.2. Turnover
Turnover alone gives only a very indirect indication of possible scale effects, because other factors, such as the economic cycle, are likely to have a larger influence on turnover trends.

68 Chemicals
Figure 4.18. Real turnover, 1980-92
40
20
0
'France ~*~Germany '* Italy ^ J J K
Source: Eurostat, DEBA.
At the aggregate level, Figure 4.18 on the four largest producing countries shows that, apart from Germany, real turnover in France, the UK, and Italy in particular has declined from 1980 to 1992. The extent to which turnover is driven by GDP may be indicated by the downturn in turnover of all four countries from the late 1980s through to 1992 which coincided with the global recession. The effect of exchange rates against the dollar may also explain the downturn in turnover in 1985, which coincided with significant dollar weakness.
4.3.3. Number of companies
Scale effects could be assumed to have an indirect effect in terms of reducing the number of plants and companies. Figure 4.19 shows that in some countries, such as Spain and to a lesser extent the UK and France, the number of chemical companies fell over the period 1980-92 which supports the hypothesis. Detailed information on the number of mergers and acquisitions in the chemical sector in Europe is provided below.

Impact of the single market on sectoral performance 69
Figure 4.19. Number of companies in the UK, France and Spain
700 2000
1900
1800
1700
1600
1500
1400
c
ε
■ France ■UK Spain
Source: Eurostat. DEBA.
4.3.4. Plant size
Information on the number of plants and their size is available for some key upstream
chemicals like ethylene and propylene. Figure 4.20 presents the results on average ethylene
plant size in the EC over the last ten years. Appendix G provides the detailed numbers on
which these results are based and the information sources used. There is a clear trend towards
an increase in the average ethylene plant size across the whole of the EC and Figures 4.21 to
4.23 confirm that the trend is common across the major producing countries.
Figure 4.20. Average ethylene plant size, EC, 1985-95
Capacity 000's
500
450
400
.150
300
1985 1986 1987 19 1989 1990
Year
1991 1992 1993 1994 1995
Source: Chemintell d-base.

70 Chemicals
Figure 4.21. Average ethylene plant size, France, 1985-95
Capacity 000's tpa
500
450
400
350
300
250
200
409 409 409 410 412
295 295 295
-t—^™—μ-1985 1986 1987
Source: Chemintell d-base.
Figure 4.22. Average ethylene plant size, UK, 1985-95
Capacity 000's tpa
500-
426 436 433
348 348
428
1985 1986 1987 1988 1989 1990 1991 1992 1993 1994 1995 Year
Source: Chemintell d-base.

Impact of the single market on sectoral performance 71
Figure 4.23. Average ethylene plant size, Germany, 1985-95
Capacity
000's tpa
500
450
400
350
300
250
200
372
329 329 329 329 338
445 445
, ·-■>'■
445
M
m
1985 1986 1987 1988 1989 1990 1991 1992 1993
Year
1994 1995
Source: Chemintell d-base.
Figure 4.24 presents similar data on the average propylene plant size across the EC. The data
are more variable, reflecting the timing of opening and closing of plants across the EU, but
there is again a longrun trend for an increase in the average plant size.
Figure 4.24. Average propylene plant size, EC, 1985-95
Capacity
000's tonnes
230
' IS 22[
205 204 ,01 2°
7 !■">
2°
9 " " '
SB
m
m m
m
-
M-.l
fé, V¿r:.
i ■■■■•x'¿
','tÍV
' :.-S
*SS¡j
•
w ·~ι:
Χ'κκ
}>:
%
3 ■•■■-li·
■
I f im
¡Ä . · * ■ > ■
Ü ite
' . f i . '
f'!, . - ■
■, ' ' Λ :
li©
SI
. ■
r-
i. · ;
¡PS
f l 1990
Year
Source: Chemintell dbase.
4.3.5. Mergers and acquisitions
The nature of the chemical sector, with a continuous trend towards improved processes and
technologies and the existence of a number of very large world players implies a relatively
large number of mergers and acquisitions (M&As) in the sector. The available data for the last
ten years reveal that the number of total M&As globally has varied between 270 in 1985 and
489 in 1990, as shown in Table 4.6.

72 Chemicals
Table 4.6. Mergers and acquisitions in the chemicals industry
Acquisition type (No) Domestic Intra-EC EC company outside EC Foreign company into EC Foreign company outside EC Total Acquisition type (%) Domestic Intra-EC EC company outside EC Foreign company into EC Foreign company outside EC Total'
1985
67 44 83 33 43 270
24.8 16.3 30.7 12.2 15.9
100.0
1986
90 40 82 43 50 305
29.5 13.1 26.9 14.1 16.4
100.0
1987
89 51 109 76 43 368
24.2 13.9 29.6 20.7 11.7
100.0
1988
97 48 89 43 30 307
31.6 15.6 29.0 14.0 9.8
100.0
1989
121 72 118 50 55
416
29.1 17.3 28.4 12.0 13.2
100.0
1990
122 94 141 60 72
489
24.9 19.2 28.8 12.3 14.7 100.0
1991
113 57 95 60 72
397
29.9 15.1 25.1 15.9 14.0
100.0
1992
79 67 77 61 35 319
24.8 21.0 24.1 19.1 11.0
100.0
1993
58 49 78 61 43 289
20.1 17.0 27.0 21.1 14.9
100.0
1994
57 58 99 37 23
274
20.8 21.2 36.1 13.5 8.4
100.0 ' The total may not exactly equal 100 due to the rounding of the numbers. Source: ECN, annual edition.
The share of intra-EC M&As and into-EC M&As has also varied with the economic cycle (see Figures 4.25 and 4.26) but when the EC GDP growth rate fell from 1.5% in 1991 to -0.5% in 1993, the share of intra-EC M&As and into-EC M&As remained significantly above their earlier levels. Note that this is during a period of positive and strengthening world economic growth.27 The data provide evidence therefore of a relatively higher than expected intra-EC share of M&As during the period following the implementation of the SMP.
Figure 4.25. Intra-EC M&As
Intra-EC M&As relative to total M&As vs EC GDP growth
5 EC GDP growth (%)
I % of intra-EC M&As
- · — EC GDP growth (%)
Source: ECN.
According to the IMF World Economic Outlook, world output growth increased from 2.5% in 1993 and 3.6% in 1994 [IMF Publication Services. May 1995].
.3% in 1991. to 2.0% in 1992.

Impact of the single market on sectoral performance 73
Figure 4.26. Into-EC M&As
Foreign company into EC M & A s relative to total M & A s vs EC G D P growth
Foreign 25 company into EC 20
M&As (% of 15
total M&As) ι»
!*f U
21
14 12 12
16
19 21
EC GDP growth (%)
I 0/o of foreign company into EC M&As
-EC GDP growth <%)
1985 1986 1987 1988 1989 1990 1991 1992 1993 1994
Year Source: ECN.
We also performed regression analysis to identify whether there was a statistically significant structural break in the share of intra-EC M&As, over and above what would be expected as a result of the relative economic growth in the EC and the rest of the world. The analysis confirmed the evidence presented in Figure 4.25 and a break was identified for the period 1992-94 (see Appendix E.3.4 for detailed results); the regression estimated that this structural break dummy accounted for an additional 5.4 percentage points in the share of intra-EC M&As over that period.
Given the nature of the regression analysis (small sample of ten observations and therefore limited degrees of freedom), the attribution of this break to any one particular cause should be done very cautiously. The available evidence from the survey results (see below and Chapter 5) suggests that this increase in share was caused by companies trying to consolidate and optimize their assets during a period of slow growth in Europe compared with the rest of the world. The survey clearly reveals that this process was facilitated by the SMP. Some of the increased activity may also be a 'follow-up' result of the SMP, whereby companies engaged in increased M&A activity following the export opportunities provided by the SMP (see, for example, the strategy of the German chemical distributor in Section 5.2.1).
4.3.6. Survey results
The face-to-face survey enquired about changes in the overall structure of the industry, and assessed the extent to which the SMP had helped companies' M&A activity. The vast majority of respondents (71%) said that the larger companies in their sector did not increase the number of plants they operated but that the average plant size had increased over the last 5-10 years. Just under one-third of the respondents considered that the SMP had facilitated to some extent this trend. Around one-third of the companies surveyed actually considered the single market to have led them into joint ventures with companies in other EC countries (see Figure 4.27).

74 Chemicals
Figure 4.27. Impact of the SMP on cross-border M&As and joint ventures
Face-to-face interview responses Has the single market resulted in joint ventures
with other EC countries?
No 70%
The vast majority of the companies surveyed considered the SMP to have facilitated cross-border M&As and joint ventures (see Figure 4.28).
Figure 4.28. Impact of the SMP on cross-border M&As and joint ventures
Face-to-face interview responses To what extent has the single market programme facilitated cross-border M&As and joint
ventures?
Very significant
Significant effect
Some effect
Not at all
10% 15% 0% 25%
4.3.7. Foreign direct investment
The aggregate data on plant ownership enables us to assess whether there has been a trend towards increased non-domestic/EC ownership of capacity. The data are available and show some variation only for the major EC chemical-producing countries and for the two key

Impact of the single market on sectoral performance 75
chemicals, ethylene and propylene. Figures 4.29a and 4.29b illustrate the change in ownership of capacity in the UK in the 1985-95 period.
Figure 4.29a. Ownership of capacity, UK, ethylene, 1985-95
Ethylene : Ownership of total capacity (domestic vs foreign) UK 1985-95
Ownership (% of total capacity)
100
90
80
70
60
50
40
30
20
10
0
I Foreign 3 Domestic
1985 1986 1987 1988 1989 1990 1991 1992 1993 1994 1995 Year
Source: Chemintell d-base.
Figure 4.29b. Ownership of capacity, UK, propylene, 1985-95
Propylene : Ownership of total capacity (domestic vs foreign) UK 1985-95
Ownership (% of total capacity)
100 90 80 70 60 50 40 30 20 10 0
I Foreign 1 Domestic :
1985 1986 1987 1988 1989 1990 1991 1992 1993 1994 1995 Year
Source: Chemintell d-base.
As can be seen in the figure there has been a switch of capacity ownership towards non-domestic companies especially in propylene. The graph does not distinguish between non-domestic EC and non-domestic non-EC, but, as already indicated, the integration of the European market in a global industry like chemicals created opportunities for both EC and non-EC companies.
Data for the other major countries - Germany and France - is mixed, however, with some movement in ownership towards non-domestic companies. This is much less pronounced than

76 Chemicals
for the UK. Appendix G contains the detailed information on number of plants by country and capacity by plant which were used to derive the figures used in the charts.
Additional information on foreign direct investment (FDI) is available at the aggregate level, from Eurostat. Figures 4.30a, 4.30b, 4.30c, and 4.30d present the available evidence on net FDI from the major EC chemical producers, Germany, the UK, France, and the EC as a whole. The FDI data are split between FDI to other EC countries and FDI to the rest of the world.28
The actual FDI data can be found in the second part of Appendix D.
Figure 4.30a. Net FDI from Germany to destination of investment
1987 198S 19R9 199Π 199
Source Eurostat.
Figure 4.30b. Net FDI from UK to destination of investment
1985 1986 1987 19H8 Nl98Q/ 1 990 1991
In ΐ. χ Τι
EC 1 ■ EC-
tal i
Source Eurostat.
Please note that the data are not collected on a consistent basis from all countries and therefore comparisons between
countries should be avoided and EC 12 data should be treated cautiously.

Impact of the single market on sectoral performance 77
Figure 4.30c. Net FDI from France to destination of investment
ïlltlf)
3 15on t E
f ,„09
Ï 5Í10
0
19
^ _,·' R4 1985
y , ~ - ■
1986 1 ' 87 1988
ï e
■" ' . -
1989
a r
, - '■■,
\
1991 1991 1992
I»-F.C J 1 Ε ι - E C
T o t a l
I Í 13
Source Eurostat.
Figure 4.30d. Net FDI from EC12 to destination of investment
f | i í
τ η η «
6tK)n
inno
anon
jnnn
innn
ι nnn
tl
19
■ mon
t~i~-
14
; ¡ ; ¡ ' ¡
I 9 8 <
. . - - . '■
N
1986
χ ' :
V""' «.. -
1987
_-.
1988
ΐ
/ /
1989
"'
' Λ ' ι' '
\
1990
', \ / \ V ' '
1991
/\
199 2 It »J
l e - F . f Ì K i - E C T o t a l !
Source Eurostat.
In terms of the link between imports and FDI, there are two possible routes:
(a) first, where EC companies found it necessary to invest in another EC country to by-pass barriers to trade, intra-EC FDI could be expected to fall as intra-EC import penetration grows; but
(b) second, there is the more traditional sequence, whereby exports to a country precede actual investment; intra-EC FDI should therefore follow the increase in intra-EC import penetration, reported in Section 4.1.1.
As can be seen from Figure 4.30d, there seems to be a long-term positive trend in FDI undertaken by EC 12 countries within the EC and this trend steepens after 1989. This is driven mainly by increases in FDI in the EC by Germany and the UK. This supports the second route linking import penetration and FDI, but the FDI data are quite erratic and should therefore be treated cautiously. Note also that the total FDI trend from EC 12 is downwards, reflecting the slow-down in economic activity in the EC after 1989-90.
In terms of investment inflows to the EC, Figure 4.30e illustrates the net FDI in EC 12 by origin source. As can be seen from the chart, the data are very variable and no clear trend emerges. The data indicate a net divestment within the EC with the exception of a peak in FDI in the EC from outside the EC in 1990. The variability of the data and the difference in the

78 Chemicals
collection procedures would suggest that it is not possible to derive any robust conclusions based on net FDI trends in the EC.
Figure 4.30e. Net FDI in EC12 by origin of source
3000
2000
1000
1984 -1000
Í -2000
-3000
-4000
-5000
1993 -In-EC Ex-EC Total
Year
Source: Eurostat.
A synthesis of the trade, M&A and FDI evidence is provided in Chapter 5 of this study on corporate strategy.
4.3.8. Conclusions
The available data suggest that the chemical sector has exploited over the last five to ten years the economies of scale that exist in the sector. The survey evidence suggests that the SMP has played some role in this process. The survey responses suggest also that the SMP facilitated cross-border M&As and joint ventures with one-third of the companies considering the single market as the main reason for seeking joint ventures with companies in other EC countries. The FDI data on investment originating from the EC suggests that there has been a mild upwards trend in the FDI destined to other EC countries after 1989-90, consistent with the hypothesis that FDI followed the increased trade activity within the EC after 1987-88.

Impact of the single market on sectoral performance 79
4.4. Sourcing patterns and upstream/downstream linkages
The hypothesis that sourcing patterns from within the EC have increased as a result of the SMP is based on the assumption that reduction in cross-border transaction costs increases incentives to trade at the intra-EC level. Another feature of the sector is the high degree of vertical integration which should increase any possible benefits resulting from the SMP in terms of reduced costs of intra-EC sourcing. Upstream and downstream linkages should also be facilitated by the SMP.
4.4.1. Aggregate data
A significant proportion of the chemical sector's turnover is sold within the sector. For example, within the heavy industrial chemicals sector about 65% of production is used as inputs into other chemical processes. Given this high degree of vertical dependence, the trade data presented already on intra-EC export shares and import penetration would also support the hypothesis that the single market programme has facilitated sourcing from other EU countries.
4.4.2. Survey results
The face-to-face and postal surveys enquired whether the sourcing patterns of companies had changed in favour of EC countries. Nearly two-thirds of companies in both the postal survey and the face-to-face survey said that there was no change in their sourcing patterns. There was little variation either by sector or by type of production input sourced (equipment, transport, packaging, raw materials, capital and finance - see Figures Fl, F2, F3 in Appendix F). This is not surprising, since the European industry faces global competition and would therefore aim to obtain the best value for money for its sourced production inputs, irrespective of geographical origins. This was in fact confirmed in our face-to-face interviews, where price was mentioned as the key variable driving sourcing decisions, especially for bulk chemicals. Around 15% of companies mentioned, however, that their sourcing patterns from the EC had increased.
In terms of vertical integration, the face-to-face survey which covered relatively larger companies enquired about the extent to which the SMP had resulted in upstream or downstream integration within the EC. Just over one in five companies considered that the SMP had led them towards further vertical integration (see Figure F4 in Appendix F).
4.4.3. Conclusions
The SMP seems to have facilitated sourcing from the EC but has not had any significant impact on the amount of inputs bought from the EC, over and above the other factors determining sourcing (price and value for money). This is not unexpected, given the global nature of the industry and the competitive pressures felt by European manufacturers at a world level.

80 Chemicals
4.5. Changes in competition, price differentials and market concentration
Associated with potential scale effects estimated in the Cecchini Report [1988] is an increase in competition resulting from the removal of trade barriers. The hypothesis is that the SMP has resulted in a more competitive market. Concentration may have increased but with no detrimental competition effects.
The SMP should increase competition by lowering the barriers to entry to other EC markets, thereby imposing downward price pressure. This pressure of competition on prices should lead to a reduction in price cost margins and to incentives for firms to increase their technical efficiency by minimizing their costs so as to maintain margins.
Analysis of available data focuses on proxy information such as number of companies and concentration measures. This should provide some weight as to the validity of the hypothesis. The impact of the SMP on competition is more difficult to disentangle from aggregate data since the economic cycle and exchange rates had a significant impact on the pricing options of European producers. We do provide, however, some indirect evidence by examining the development of profit margins for EC and US companies as well as the changes in gross operating surplus and gross profit per unit of output for EC producers. The survey and company interviews address the question directly by enquiring about the real price trends over the last five to ten years, and also extend the perspective to assess the contributions of the SMP to observed changes in the extent of competition and real prices. The survey also enquired about the extent to which price differentials within the EC have narrowed and the role of the SMP in influencing any changes.
4.5.1. Aggregate data
A proxy to concentration is given by number of companies, which was seen in Section 4.3 to fall slightly in the UK and France, and to decline more rapidly in Spain. At a disaggregated sectoral level the data do not provide a consistent picture (see Appendix H). There are a number of main points to note.
(a) Germany has experienced a slight increase in basic industrial chemical and petroleum companies, but a slight decrease in companies manufacturing other chemical products. The trend appears to correlate to GDP and it is not really possible to identify the impact on concentration from this data set.
(b) Portugal has experienced a significant reduction in number of companies in all the sectors for which data are available. The data in all sectors, however, consistently show a significant reduction from 1988 to 1990 which may be linked with the opening up of the Portuguese markets following the country's entry in the EC. The data must be interpreted with caution, however, because Portuguese data on the other variables (e.g. costs, turnover) also seem to show significant variability.
(c) No such data anomaly is apparent with Spanish data, and it does appear that a significant reduction in number of companies has occurred since 1980. The time series indicates that the number fell to a trough in 1987 and has since risen consistently. In this context the SMP impact on concentration is not clear.

Impact of the single market on sectoral performance
(d) Italy has experienced an increase in number of companies in most sectors for which data are available, with the exception of agricultural chemical companies. Again, the time series is more revealing because, unlike Spain and Portugal, the number of companies rose up to 1989 and has since declined. The reduction in the number of companies is consistent with what one would expect as the concentration impact of the SMP, although the trend is not observed in paints, varnishes and printing inks where Italy is the only country that has experienced an increase in number of companies.
(e) In the UK, as with Spain and Portugal, the number of companies in 1992 was below the 1978 level, but the lowest numbers were seen in 1987 and the number has been steadily increasing since then which seems to counter the expected effect of the SMP. The UK is also noticeable as being the only country from those for which data are available that shows an increased number of agrochemicals sector companies since 1980.
More detailed information at a sectoral level is available through the analysis of mergers and acquisition activity in Europe and the rest of the world. There are some noticeable variations by sector. The paints, varnishes and printing inks sector has been characterized by increasing consolidation, reflecting the need for an adequate size with which to confront the concentration of the distribution networks. Important events in 1991 were Akzo's acquisition of MacPherson's (UK) decorative business and Herbert's acquisition of Becker Powders (UK). Paints and coatings companies frequently also use joint ventures to gain access to new markets. In 1991, Courtaulds and PPG set up a joint venture for aerospace and defence coating businesses in the UK and Italy. BASF and Nippon (Japan) did the same in automotive coatings, as did ICI and Ferro (USA) in powder coatings.
In printing inks a major reduction has occurred in the number of printing ink producers and plants. The number of individual ink manufacturers in Western Europe has been reduced from around 300 in 1989 to just over 200 in 1993. Similarly, the number of printing ink plants is estimated to have fallen from 400 in 1989 to some 300 in 1993. The reasons for this decline can be directly attributed to the commercial pressures on companies associated with overcapacity, the severe recession across Europe, better educated buyers, increases in raw materials prices and the increasing technical complexity of ink in order to meet the growing environmental demands. In this context, companies have either closed or have been taken over. In 1993, six companies accounted for 72% of total production, in contrast with six companies having only 62% of the Western European market in 1989 and 59% in 1986.
In the petroleum industry, efforts at concentration appear to have been predominantly driven by the economic cycle. Prices were so low due to the downturn in demand that all but the largest and most efficient plants were losing money.
In the heavy industrial chemicals sector in Europe, concentration is high. The sector tends to be dominated by larger companies, compared to refined chemicals. For example, six producers in Germany share 80% of inorganic chemical production. Despite this, competition is significant since the EU sector faces strong competitive threats from new competitors in oil-producing countries and South-East Asia.
In the agrochemical sector between 1980 and 1991, mergers and acquisitions have concentrated more than 80% of EC production into the hands of seven companies: Norsk

82 Chemicals
Hydro (Norway), Kemira Oy (Finland), BASF (Germany), Grande Paroisse (France), EnSMont (Italy), DSM (Netherlands) and FESA (Spain).
Competition, as measured by proxies that reflect a reduction in operating margin for companies, appears to have increased since 1989 as shown in Figures 4.31 and 4.32 despite increased consolidation in the sector.
Figure 4.31. Gross operating surplus and producer price minus unit labour costs
Source: CEFIC.
Within the sector, gross operating surplus and the difference between producer prices and unit labour costs increased from 1985 to 1988 and subsequently declined. The trend confirms increased competition in the sector but there is also a clear link with the economic cycle.
Figure 4.32 highlights the difference between gross operating surplus as a percentage of turnover for both the USA and the EC - note that the data refer to the whole of the EC. The percentage in the USA rose to a plateau in 1987 and remained unchanged through to 1992 whereas the ratio in EC decreased from 1988 to 1992. Both trading blocks experienced similar economic cycles and the US could be considered a reasonable antimonde. In this context, it does appear that non-business cycle effects caused an intensification of competition in the EC, of which one may be the SMP.

Impact of the single market on sectoral performance 83
Figure 4.32. Gross operating surplus as a percentage of turnover in the USA and
the EU
20 Gross
operating
surplus '
(% of 17
turnover).,
1985
Source: CEFIC.
1986 1987 1988 1989
-•—EU — ■ — USA ;
1990 1991 1992
A significant factor which will also had a negative effect on profitability is the relative
weakness of the USD against the major EC currencies (see Figure 2.6).
4.5.2. Survey results
The postal survey enquired about the extent of entry as a result of the SMP, and the impact
that entry had on competition, prices and costs for the companies affected. Nearly half of the
respondents (44%) said that the SMP had resulted in new competitors entering their markets,
with a relatively higher entry in inorganic chemicals, plastics and paints and varnishes. There
is also a clear difference in geographical terms, with southern European countries witnessing a
much greater increase in entry with the exception of Italy. There was no noticeable variation
by company size. Figures 4.33 and 4.34 present the results by sector and country.

84 Chemicals
Figure 4.33. Impact of the SMP on entry, by sector
Postal questionnaire sector responses Has the SMP resulted in new competitors entering your market?
Average Petrochems Inorganic Dyes and Plastics chemicals pigments
Fibres Agrochems Paints & varnishes
Other
3 Yes
I No
D No! stated
Figure 4.34. Impact of the SMP on entry, by country
Postal questionnaire country responses Has the IMP resulted in new competitors entering your market?
Average Germany Italy Spain Portugal Greece Denmark The France UK Netherlands
Ireland Belgium
When respondents that witnessed increased entry as a result of the SMP were asked about the origin of the new entrants the vast majority responded that new competition came from the EC (see Figure 4.35).

Impact of the single market on sectoral performance 85
Figure 4.35. Impact of the SMP on entry, origin of entrants
Postal questionnaire overall responses Where have new market entrants mostly come from?
Other Β Australia Ξ
Middle East k South America f̂
Korea r'-m^ India
SE Asia PS^S Japan china \m>*m
Other Europe ^ ^ ^ Former Eastern' m*wm««*<>\ North America p«aW»P«*»SB3
Within EC H U B J l l g J B S I I E g M l E a i g ^ g i S i i i g g i i
Refers to Former Eastern Europe.
This seems to indicate that the lowering of barriers to trade and increased access to other EC markets has led to an increase in competition through actual entry in other markets. The significance of the response would suggest also that the SMP created a momentum beyond a core of companies that were trading with other EC countries anyway, leading a significant number of other companies to consider and eventually try to expand across the EC.
This is also reflected in the responses given to our question about the extent to which entry actually translated into increased competition. More than one third of respondents considered the SMP to have led to 'a more competitive' market, with another 20% considering the SMP to have created 'a much more competitive market' (see Figures 4.36 and 4.37).
The sub-sectors that are the most affected in competition terms are dyes and pigments, plastics and inorganic chemicals. Recall that inorganics and plastics companies felt also that the SMP was more successful in dismantling barriers to cross-border trade than the average for the sector as a whole - see Figure 4.13.

86 Chemicals
Figure 4.36. The impact of the SMP on competition, by sector
60%
Postal questionnaire sector responses
Has intra-EC competition been made more or less competitive by the SMP ?
Average Petro Inorganic Dyes and Plastics Fibres Agrochemicals chemicals pigments chemicals varnishes
Paints and Other
H Much more competitive
■ More competitive
□ No difference
Π Less competitive
Figure 4.37. The impact of the SMP on competition, by country
Postal questionnaire country responses
Has intra-EC competition been made more or less competitive by the SMP ?
ï Much more
competitive
I More
competitive
D No difference
D Less
competitive
Average Germany Italy Spain Portugal Greece Denmark The France UK Ireland Belgium Netherlands
The countries that seem to have been mostly affected are Greece, Portugal, Ireland and,
somewhat surprisingly, the Netherlands: nearly 80% of companies in these countries
considered the market to have become more or much more competitive as a result of the SMP,
compared with an average of 57% for the Community as a whole (see Figure 4.37).
Four out of every ten companies from the postal survey said that real prices fell over the past
five years and nearly twothirds of respondents felt that price trends had been affected by the
SMP, to some, a significant or a very significant effect (see Table 4.7).

Impact of the single market on sectoral performance 87
Table 4.7. Real price
Postal questionnaire responses
trends and impact of the SMP
What has been the overall trend in the price of your products over Higher 28%
To what extent have the price trends been No extent
22% Lim
The same 23%
affected by the SMP? ited extent
34%
the last five years 1
Some extent 22%
. allowing .ower 40%
for inflation?
Sign
377
ficant extent 9%
Source: KPMG postal survey.
It is interesting to note that a much higher proportion of larger companies said that real prices fell - 64% compared with the average of 40% reported in Table 4.7. This reflects a greater increase in competition amongst larger companies. The reason for that is likely to be the emergence of new global low-cost competitors rather than differences in price trends amongst different sectors, since the survey results suggest there was little variation in real price trends over the last five years across different sectors.
Competitive pressures from a lowering of barriers to trade would support the hypothesis that price differentials across the Community have declined. Price differentials are relevant for chemical substances and preparations that are not produced in bulk and are tradable, such as agrochemical products, specialized inorganics, speciality chemicals and paints and varnishes. One-third of the companies surveyed responded, therefore, that the question was not relevant for them or that there were no price differentials for their products.
Of the remaining companies, the vast majority (80%) considered that the price differentials between EC member countries had narrowed over the last five years. Two out of every three companies considered the SMP to have affected the trend in price differentials, and nearly half of those considered the SMP influence to have been significant or very significant.
Local market conditions were considered the key factor preventing prices from converging to a uniform price across the EC, followed by different market specifications and requirements and distribution costs. Nearly 30% of companies considered, however, that local or different taxes were also preventing, at least to some extent, full convergence to a uniform price across the EC (see Figure F.10 in Appendix F).
Our case study of a German agrochemical company also confirmed the difficulties of convergence of prices in this sector. The company thought that it is difficult to harmonize pricing or set policy within the EC because of:
(a) different national distribution structures, for example: (i) some distributors include service whilst others do not, (ii) countries may have a one- or two-tier distribution structure;
(b) different VAT rates in different countries; (c) additional costs in some markets due to different national interpretations of EC
packaging and labelling requirements; for example, in Denmark the end-user price must be printed on each package and a tax paid based on this price;

88 Chemicals
(d) distributor strategies; for example, buying in stock this year to lower consumer prices
the following year.
The postal and the face-to-face surveys indicate therefore that the SMP led to an increase in
competition which translated, on average, into lower real prices and a narrowing of price
differentials.
In order to understand the impact that such a development may have on the strategy of
chemical companies we enquired about the reaction of firms to the increased competition.
More than half of the companies in the postal survey responded to increased competition by
trying to achieve efficiency gains and reduce their costs. Companies in the sectors and
countries that faced the strongest increase in competition seem to have also tried to reduce
costs more vigorously, as expected.29 (See Figures 4.38 and 4.39.)
Figure 4.38. Cost trends resulting from increased competition, by sector
60% Τ
40%
Postal questionnaire sector responses What has been the overall trend in costs as a result of increased competition resulting from the SIMP ?
Β Costs much lower
□ The same
Average Petro- Inorganic Dyes and Plastics chemicals chemicals pigments
Fibres Agro- Paints and Other chemicals varnishes
29 Agrochemical companies and companies in France seem to have also been led to reduce costs by the SMP by more than
the average.

Impact of the s ingle marke t on sectoral pe r fo rmance 89
Figure 4.39. Cost trends resulting from increased competition, by country
Postal questionnaire country responses
What has been the overall trend in costs as a result of increased competition resulting from the SMP ?
70%
60%
50%
40%
30° i
20%
10%
0% 1 J I J lü M
Ξ Costs much lower
Average Germany Italy Spain Portugal Greece Denmark The France UK Ireland Belgium Netherlands
Survey respondents were also asked about the extent to which concentration in their
sector/country increased as a result of the SMP and the extent to which the SMP had an impact
on the exit from the industry of the least efficient players. Figure 4.40 indicates that
respondents overall considered the SMP to have led to an increase in concentration in their
main markets. There is significant variation by country, however, with Greece, the
Netherlands, Portugal and Spain facing a relatively higher increase in concentration.
Figure 4.40. Changes in concentration levels resulting from the SMP
Postal questionnaire country responses
Within your country, what changes have occurred to the level of concentration in your main market as a
result of the S M P ?
60%
50%
40%
30»,
20%
10%
0%
3 Much more concentrated
I More concentrated
D No change
Average Germany Italy Spain Portugal Greece Denmark The France UK
Netherlands
Ireland Belgium
Figure 4.41 presents the postal survey results concerning the exit of companies from the
industry by country. The southern European countries seem to have been most affected, in line
with the earlier aggregate reported results.

90 Chemicals
Figure 4.41. Impact of the SMP on company exit, by country
70%
60%
50%
40%
; 30%
20%
10%
0%
Postal questionnaire country responses Within your country, has the SMP caused the exit of companies from your industry?
i Θ Significant
exit
D N o change
Average Germany Italy Spain Portugal Greece Denmark The France UK Ireland Belgium Netherlands
4.5.3. Conclusions
The aggregate data indicates that there has been a marked reduction in the overall profitability of the chemical sector in Europe. The weakness of the USD and the slowdown in European activity have clearly affected the profitability of the sector, in addition to any structural SMP effects. The survey responses revealed, however, that the SMP led to a significant increase in competition, especially in southern European countries. This was translated to lower real prices than would otherwise be the case and has led companies to seek cost reductions in order to avoid a significant erosion of their profit margins. Concentration is also considered to have increased, but the impact of the SMP on competition has outweighed any potentially detrimental competition effects from increased concentration. In this respect, it is also worth noting that the upstream sector is quite integrated vertically and was relatively concentrated prior to the implementation of the SMP.
4.6. Direct short-term impact on costs
In this section the hypothesis to be tested is that the SMP implementation in 1992 had an uncertain effect on short-term production costs depending on the type of cost and nature of legislation. For example, costs of complying with technical standards and regulations, and health and safety and environmental standards may have raised EC chemical company short-term production costs, but transport costs, capital and finance costs and customs clearance costs may have been reduced.
4.6.1. Aggregate data
The available aggregate data on costs are not detailed enough to enable an identification of SMP impacts. We present therefore in this section data on environmental expenditure and concentrate in the next section on the responses of the companies participating in the survey.

Impact of the single market on sectoral performance 91
4.6.2. Environmental expenditure
At the aggregate level, Figure 4.42 shows that chemical industry capital spending on
environmental protection in Western Europe and the USA in 1992 was significantly higher
than in Japan. Note, however, that different sources provide different percentages for US
spending; the US Department of Commerce survey30 has provided an estimate for the USA of
12.9%, very close to the European figure. A oneyear snapshot also fails to capture any
dynamic effects of expenditure on environmental protection; the Japanese industry, for
example, spent capital for environmental protection in the 1970s and early 1980s. The
numbers should therefore be treated very cautiously.
Figure 4.42. Chemical industry capital spending on environmental protection, 1992
-w E ο υ ** α. O —
S «
14%
12%
10% ;
8% f
6% :
4% ·
2% ;
0% ·
! Ε US Dept of Commerce i
■CEFIC
Western Europe USA Japan
Source: CEFIC, US Department of Commerce survey [1993].
At a company level, companies are not obliged to publish expenditure on environmental
control measures, but five companies of the 16 that were reviewed do so, with some others
providing environmental performance monitoring information such as emissions, rather than
actual costs. Of the five companies that publish cost information, the picture is mixed, with
some showing an increase in environmental control costs and others showing a decrease. The
environmental costs as a proportion of cost of sales are shown in Table 4.8. Environmental
expenditure does not consistently seem to rise as a proportion of cost of sales over time. The
big differences in the percentages between different companies may reflect, in addition to
company policy on environmental performance, measurement differences, since there is no
clear common definition of environmental expenditures.
US Department for Office of International Affairs. 1993.

92 Chemicals
Table 4.8. Environmental costs as a proportion of cost of sales
1994
1993
1992
1991
1990
ICI
0.6%
Shell
1.3%
1.1%
0.9%
BP
1.5%
1.6%
Dow
1.3%
1.9%
1.9%
2.2%
Bayer
5.7%
5.7%
6.1%
5.5%
5.6%
Source: Company annual reports.
The picture painted here, although incomplete, is reflected also in the World Bank report in
which it is noted that environmental expenditures are a small share of total expenditure and
therefore unlikely to cause shifts in comparative advantage in most industries on their own.
4.6.3. Survey results
The postal survey enquired about the direct impact on costs of the SMP measures as well as
the chemical legislation and other EC initiatives. Figures 4.43 a, b and c present the results of
the postal survey.
Figure 4.43a. Direct impact of SMP and single market measures on costs
Postal questionnaire sector responses (single market measures)
Did the measures listed in the table below have a DIRECT impact on your costs? Have they reduced
them, increased them or made no difference?
■ Costs lower
■ No impact
O Costs slightly higher
Π Costs higher
■ Not relevant/no opinion
Harmonization Mutual Certification
of technical recognition of procedures
regs. and/or technical regs
standards & standards
The elimination The elimination
of customs of delays at
documentation frontiers
Piritti Sorsa [1994].

Figure 4.43b. Direct impact of sector-specific legislation on costs
70%
60%
50%
40%
30%
20%
10%
0%
Postal questionnaire overall responses (sector-specific legislation)
Did the measures listed in the table below have a DIRECT impact on your costs? Have they reduced them, increased them or made no difference?
Ξ ^ ι ι [ = = J I I I I Packaging, labelling and classification of
dangerous substances, 67/548 Packaging, labelling and classification of
dangerous preparations, 88/379 Packaging, etc of agrochemicals - pesticides,
herbicides, etc., 78/631 Marketing and distribution of dangerous
substances, 76/769
1 Costs lower I No impact D Costs slightly higher Π Costs higher I Not relevant/no opinion

94 Chemicals
Figure 4.43c. Direct impact of other EC measures on costs
60°/
50%
Postal questionnaire overall responses
(other EC measures)
Did the measures listed in the table below have a DIRECT impact on your costs?
Have they reduced them, increased them or made no difference?
Π Jl ¿ Competition
policy and the
control of
state aids
Health and
safety
legislation
Environmental
legislation on
pollution
control
1 Environmental
legislation on
waste
management
□ Costs lower
■ No impact
DCosts slightly higher
□ Costs higher
■ Not relevant/no opinion
Clearly the elimination of customs documentation and delays at frontiers have reduced costs.
Harmonization of regulations and standards as well as certification procedures have, on the
other hand, increased costs. The chemical sector legislation has on the whole increased costs.
The key aim of the sectorspecific legislation was to ensure a level playingfield by
establishing common procedures for packaging, classifying and registering dangerous
substances, so those companies that were affected would have to change their procedures or
introduce new tests, which on the whole has increased costs. This is consistent with the
evidence on the impact of such legislation on trade barriers; more companies felt that the
legislation had a positive effect, but a nonnegligible number did say that the legislation had a
negative effect on barriers to trade. This is also supported by the UK case study (a plastics
company) which mentioned that EC sectorspecific legislation has on the whole increased
costs see Section 6.3.
Environmental legislation had by far the most significant effect on costs. A significantly
higher percentage of mediumsized companies considered costs to be higher rather than
slightly higher. However, the overall percentages of companies saying that costs had increased
are largely the same, independent of company size (see Figure 4.44).
The UK seems to have witnessed cost increases significantly above the average reflecting the
recent introduction of a series of environmental laws and the strong monitoring and
enforcement measures (see again the UK case study, a plastics company, in Section 6.3).
These are not necessarily direct transposition of EC law but are perceived to be related to
overall EC environmental initiatives; for example, the recent announcement of plans for a
landfill tax which is expected to lead to an increase in prices of landfill operators, aims to
encourage recycling to meet targets for 2000. In terms of geographical differentiation,
legislation on waste management seems to have increased costs more significantly in Italy,
Germany and Portugal.
In terms of the overall impact of environmental legislation, the shortrun direct impact should
be assessed in conjunction with all (direct and indirect) effects in the longer run. A full cost

Impact of the single market on sectoral performance 95
benefit analysis would be required in order to evaluate properly the extent to which environmental legislation has had an overall beneficial effect. Such an analysis would require a detailed assessment of the value of the environmental benefits of legislation which is outside the scope of this study. It is worth noting, however, that the Italian case study (a fibres company) emphasized that in the longer term environmental legislation would be beneficial, both because of the higher environmental standards and because of the creation of a level playing-field (see Section 6.2).
Furthermore, there are a number of studies that point out to beneficial (indirect) effects of environmental legislation on sectors of the chemical industry. For example, one international study of environmental regulations in six industries32 (inter alia, paint and coatings and batteries and printing inks) found positive pressures from regulations or from consumers and professional advocacy campaigns. In this respect, a recent (1995) survey-based study piloted by the European Commission's Directorate-General for Industry (DG III), 'Attitude and Strategy of Business regarding Protection of the Environment' found that most large manufacturers (including, although not exclusively, companies in the chemical sector) reported that environmental costs tend to be small, relative to labour and raw material costs, and that access to markets, labour and technology is a more important determinant of competitive advantage.
Comments from the face-to-face interviews are broadly consistent with the results shown in Figures 4.43 a to c. For certification procedures, one company agreed that there are benefits in theory, but in practice it will remain costly due to multiple compliance. For the elimination of delays at frontiers the vast majority of comments indicated that lower costs were incurred by such action. One company pointed out that one key remaining issue in freight deregulation is the continuing difficulty with cabotage, that is filling empty back legs and making maximum use of equipment. Currently, they indicated that national regulations make it very difficult to pick up a load for the return journey once EC borders have been crossed. Transport of empty loads increases costs and the problem applies particularly in the chemicals industry where hazardous substances are involved.
32 Competitive implications of Environmental Regulations: A Study of Six Industries prepared by the Management Institute for Environment and Business. St Gallen University, for the US Environmental Protection Agency, 1994. Cited in Regulation and its Impact on Competitiveness, a study commissioned by the US Competitiveness Policy Council and published in September 1995.

96 Chemicals
Figure 4.44. Direct impact on costs of environmental legislation, by company size
Postal questionnaire specific responses
Did the environmental legislation on pollution control measure have a DIRECT impact on your costs?
Has it reduced them, increased them or made no difference?
Average <50 50-199 200-499 500-1.000
Company size measured by employees
over 1.000
BCosts lower
■ No impact
dCosts slightly higher
□ Costs higher
■ Not relevant/no opinion
The face-to-face survey confirms the overall results of the postal survey which suggest that on
balance the SMP and related measures increased costs directly (see Figure 4.45). Some 53% of
companies replied that the single market legislation increased costs against 26% that thought
the legislation reduced costs.
Figure 4.45. Direct impact of legislation on costs
Face-to-face interview responses
Has the single market legislation had a direct impact on your costs?
Increased costs
53%
The face-to-face survey also enabled the assessment of the areas of company costs that were
most affected by the legislation. Figure 4.46 reports the results by area of costs.

Impact o f the single market on sectoral performance 97
Figure 4.46. Direct impact of legislation on costs, by type of cost
Face-to-face interview responses
With in which areas of your company has the single market legislation affected D IRECTLY your cost base?
Capital and finance
Administrator
Transport
Packaging / eco-labellin£!
Equipment
Production
H B I l l g l i l B l i
Labour
Classification & registration
ofchemical substances
imam f . y . · » · . . » ^ - ι - * - - . - >■-. . . - - . ; ; ί . ί , ^ - ^*?*»r**tW'i'r^.<^^rf^,f«<m*t<%)*$*&t^K^!
4,yìi
mmmmmmmmmψ
^^:v^sw^a^^j{!,^:^:^;:jrv;^»?^^
î ^ ! ^ i ™.. ΐ·-|.·-.· « ¡ f t t i ^ w j s ^ ^ g ^ i i ^ ^
^^MS^PP^PJ^rBjBjjBP^ffl^^ :ü Wi^-.Íft^Jj!^ffig^
ä ä ä s S Ä - ä & ^ ^ ^ B s & a ^ ^
Raw m.t«i1. 1 B B M W — — j |
Sf^P^Sn^ ! ! ^ ^ Γ 7 Τ ; ' · & Τ Ν ^ Τ ^ ; ^ ^ ^
D Increased costs
■ Reduced costs
Ξ No change
The packaging and ecolabelling and classification and registration areas seem to be the areas
most negatively affected. Transport costs and capital and finance costs were areas affected
positively by the legislation (i.e. costs were reduced). Administration costs seem to have
increased for some companies and reduced for others, consistent with the evidence on the
impact of the chemical sector legislation, which increased such costs, and the trade related
legislation, which reduced such costs.
4.6.4. Conclusion
The survey results suggest that on balance the SMP measures and sectorspecific legislation
may have increased costs, though the results differ by type of cost: certification procedures and
harmonization of technical regulations and standards were assessed to have had a significant
negative impact on shortterm costs followed by legislation on classification and registration
of chemicals and labelling. Trade facilitation legislation and transport deregulation had a
positive effect on trade related and transport costs (reduced them) as did the liberalization of
capital movements on capital and finance costs.
In terms of other related EC measures, environmental legislation on pollution control and
waste management were considered to have a significant negative impact on costs. A number
of companies stressed the benefits of such measures for creating a level playingfield and thus
recognized the longterm benefits of such legislation.

98 Chemicals
4.7. Productivity and competitiveness
Associated with scale effects and efficiency gains due to the pressure exerted on profit margins from increased competition is the hypothesis that the SMP is likely to have contributed to increases in labour productivity. Competitiveness here is taken to refer to the EC 12 as a trading block compared with other trading blocks.
4.7.1. Aggregate data
Short-term costs
Cost information is generally considered commercially sensitive and therefore not available in anything other than very aggregate levels in company reports. Nevertheless, CEFIC (the European Chemical Industry Council) points out that in 1980-82, in the context of large increases in oil prices, margins were heavily squeezed. This is illustrated in Figure 4.47 which shows the positive correlation over the period between oil prices and producer prices. Margins from 1988 have been hit, not only by the rise in oil prices from 1988 to 1990, but also by the subsequent weak demand combined with the strength of the ECU relative to the USD. This overview highlights that in this context it is difficult to assess the impact of the single market programme at the aggregate level.
Figure 4.47. EC chemical industry producer price, unit labour cost and crude oil price Index 1980 = 100 Variables in ECU
- Producer price
-Unit labour cost
-Oi l price
1980 1981 1982 1983 1984 1985 1986 1987 1988 1989 1990 1991 1992
Years
Source: CEFIC.
4.7.2. Labour costs
Real total labour costs in most countries within EC 12 have fallen since the early 1980s (Figure 4.48) and this is consistent with the well documented restructuring that has taken place in the

Impaci oí lhe single market on secloral performance 99
industry over the past decade. These charts should be seen in conjunction with Figure 4.18
which illustrates the reduction in real turnover in the sector; employment is seen to have
followed the negative trend in real turnover recorded in France, the UK and Italy over the
same period.
Figure 4.48. Real labour costs in the EC12
ECU ISO
(1990
prices)
Source: Eurostat, DEBA.
At a country level, Figure 4.49 shows that real labour costs in Germany, the UK and Spain
have not shown the decline seen in Italy and France.
Figure 4.49. Real labour costs, by country
ECU mm
(1990
prices) I
* Germany
—■—France
Italy
UK
- * ' · " Spain
1978 (<)79 1980 1481 1982 1981 1984 1985 1986 1987 1988 1989 1990 1991 1992 1991 ]994
Years
Source: Eurostat. DEBA.

100 Chemicals
4.7.3. Survey results
Survey participants have already indicated that as a reaction to increased competitive pressures
from the SMP they increased their efforts to achieve efficiency gains. We did, however, ask
them directly whether the SMP had any impact on the productivity improvements observed.
The vast majority of respondents in the face-to-face survey (more than 90%) said that
productivity had increased over the last ten years, with nearly two-thirds of companies stating
that it had increased significantly (see Figure F.5 in Appendix F). When respondents were
asked about the role of the SMP, slightly more than four out of every ten companies
considered the SMP to have contributed to the improvements observed. It should be noted,
however, that the majority of these companies considered the SMP to have helped only
marginally when compared to other factors affecting change (see Figure F.6 in Appendix F).i}
An additional check on the potential impact of the SMP on competitiveness was provided by
enquiring about the extent to which the SMP had assisted companies in their selling/exporting
efforts to non-EC countries. The majority of companies (nearly 60%) did not consider the
SMP to have helped with sales efforts in non-EC countries. One in five companies did
consider, however, the SMP to have provided help, at least to a limited extent. The sectors that
seem to have been most helped are inorganic chemicals and plastics. Figure 4.50 presents the
survey results on average and by sector.
Figure 4.50. Impact of the SMP on sales efforts to non-EC countries, by sector
Postal questionnaire sector responses To what extent has the SMP assisted vour sales efforts in non-EC countries?
70%
60%
50%
40%
30%
20%
10%
0%
■ Limited extent
G Some extent
O Significant extent
Inorganic Dyes and Plastics chemicals pigments
Fibres Agro- Paints and Other chemicals varnishes
There are some differences by country, with Spain and Greece affected more positively than
other countries (see Figure 4.51). Denmark and the Netherlands on the other hand, seem to
have been affected very marginally in their sales efforts to non-EC countries. It should be
The EC Business Survey found that only 18% of chemical companies thought that the single market had a positive
impact on productivity, with 76% of respondents being neutral on the matter. Our comparable findings reveal that 17%
of companies believe that the SMP has improved productivity 'significantly" and approximately 30% feel that there
have been 'marginal improvements" in productivity.

Impact of the single market on sectoral performance 101
noted, however, that the effect would be indirect, rather than through direct assistance, which
may be the way some respondents interpreted the question.
Figure 4.51. Impact of the SMP on sales efforts in non-EC countries, by country
90%
80%
70%
60%
50%
40%
30%
20%
10%
0%
Postal questionnaire sector responses
To w hat extent has the SMP assisted your sales efforts in non-EC countries?
Average Germany Italy Spain Portugal Greece Denmark The France UK Netherlands
Lib 5
O No extent
■ Limited extent
D Some extent
Ü Significant extent
Ireland Belgium
4.7.4. Conclusion
Productivity and competitiveness should have been affected indirectly by the SMP through the
pressures for efficiency exercised through increased competitive pressures and through the
ability to make cost savings in sourcing and trade related costs. The survey evidence supports
this hypothesis, with more than 40% of the companies surveyed considering the SMP to have
contributed to the significant productivity improvements achieved over the last five to ten
years. There is little evidence, however, that the SMP has helped indirectly sales efforts to
nonEC countries. This may be reflecting the significant increase in competition at a global
level, the indirect way in which the SMP would help and the increase, on average, in short
term production costs, which companies felt the SMP to be responsible for.
4.8. Effects on employment
There are two opposing effects of the SMP on employment:
(a) a positive effect on employment may result from expansion in output due to greater
market access;
(b) on the other hand, a negative impact may result from cost reduction efforts due to
increased competition invoked by the SMP.
The overall net effect may therefore be uncertain. Furthermore, the overall restructuring trends
in the industry make it even more difficult to isolate the SMP effects from the general industry
employment trends. We therefore concentrate in this section on identifying and assessing
possible qualitative impacts of the SMP.

102 Chemicals
4.8.1. Aggregate data
Employment levels in the European chemical sector (including manmade fibres but excluding
pharmaceuticals) have fallen by 30% from 1978 to 1993. When contrasted with turnover over
the same period the fall in employment is obviously a result of productivity gains. All
countries in Figure 4.52 except Ireland experienced a reduction in employee numbers with an
annual reduction compounding between 1.3% and 4.3% per annum over the last ten to 15
years (Figure 4.52). A similar trend is apparent for all sectors (see Appendix I).
Figure 4.52. Employee number changes in European countries
ECI; Germany France Italy Belgium
BCAGRallyrs
UK Ireland
■ CAGR. 1987 and after ¡
Spain Greece Portugal
Source: Eurostat, DEBA.
The two columns for each country aim to identify any trend in terms of reduction in
employment levels after the announcement of the SMP compared to the whole period. There is
no consistent trend between countries, with the UK, Italy, Ireland and Spain showing a smaller
rate of reduction in employment levels from 1987 to 1992, and other countries showing the
opposite.
This observed trend of reduced employment has been more marked in the EC than in the USA
or Japan (Figure 4.53) since 1989 in particular, and reflects the pressure on profit margins and
consequent restructuring and exploitation of scale economies that have taken place in the
industry.
The annual reports reveal that the number of employees is decreasing, as expected. Of the 13
companies with five years of data for 1990 to 1994, nine show a reduction in the number of
employees in the range of 14% to 44%, two remained the same, and two companies reported
an increase in number of employees, although one of these was explained by an acquisition.
Company annual reports point to two main reasons for the reduction in workforce:
(a) business growth has not been fast enough to sustain such high levels of employment and
productivity gains have been required;
(b) there is an increasing supply of qualified contractors and specialists enabling companies
to contract out discrete pieces of work.

Impact of the single market on sectoral performance 103
Figure 4.53. Change in employment in the chemical sector in the EU, the USA and
Japan
% change
year
on
year
4 0%
10%
2 0%
DO";,
l '
1 o%
2 0 %
VH%i
H2 19S.1
^
^ ^ ^ 7 r —*
EU
■ USA
Japan
Years
Source : CEFIC.
The survey results reflect largely the aggregate data with nearly half the companies
interviewed in the facetoface survey saying that employment levels reduced a lot over the
last five to ten years (Figure F.7 in Appendix F). The facetoface survey covered the larger
companies and it is likely that these companies were involved in relatively larger employment
reductions, due to the significant M&A and restructuring activity that took place in the sector.
The facetoface interview programme also enquired about the extent to which the SMP had
influenced internal EC mobility. A number of companies are situated near borders, especially
those in northern Italy and the RhôneAlpes region in France, and EC legislation should have
facilitated crossborder job mobility in such regions. It is not surprising, therefore, that nearly
half the companies participating in the facetoface survey (see Figure F.8 in Appendix F)
considered the SMP to have influenced to some extent internal EC job mobility. Companies
did mention, however, that the absence of harmonization or ease of transferability of pension
schemes has acted so far as an impediment to increased job mobility.
The facetoface survey also enquired about health and safety (H&S) legislation and workers
councils (see Figure F.9 in Appendix F). H&S legislation was considered by the majority of
respondents to have had a positive impact, because it helped create a level playingfield and
was viewed as beneficial for workers' health and productivity. Legislation on workers councils
was considered by the majority of companies to have had no noticeable impact.
4.8.2. Conclusions
Employment is affected by the SMP indirectly through two channels, output expansion and
efficiency gains. Expansion of output due to lower prices resulting from increased competition
has exerted a positive effect on employment. Efforts to maintain profitability through
efficiency gains, on the other hand, have exerted a negative influence on employment. During
a period of significant restructuring in the chemical industry any attribution of observed
employment changes to the SMP would be inaccurate and misleading.

104 Chemicals
Qualitatively, the SMP seems to have facilitated internal EC job mobility, although some
barriers still remain. Health and safety legislation was perceived to have had a beneficial effect
by the face-to-face survey participants but this may reflect their relatively bigger size. Workers
councils legislation had no noticeable impact.
4.9. Contribution to sustainable development
The main aim of this section is to assess the extent to which environmental legislation enacted
by the EC has had a significant impact on the environmental performance of chemical
companies. This is an important and controversial area, where the European chemical sector
has expressed concerns about the competitive implications of environmental legislation.
We have already provided an assessment of the cost implications of the environmental
legislation in the section examining the direct short-term impact of SMP legislation on costs.
We focus here on the available published data and survey results on the environmental
performance of the chemical sector.
4.9.1. Aggregate data
CEFIC data indicate that CO2 emissions have decreased over time since 1980 whilst output
has increased by about 40% in the same time frame (see Figure 4.54a). Fuel and power energy
consumption per unit of chemicals output has declined by 25% between 1980 and 1993 (see
Figure 4.54b).
Figure 4.54a. Output, fuel consumption and CO2 emissions in the EC
■5 100
80
" Output index
"Energy consumption index
"C02 Emissions index
Source : CEFIC.

Impact of the single market on sectoral performance 105
Figure 4.54b. Energy consumption per unit of chemical output
= 0.80
0.75
<-> 0.70
0.65
0.60
Source: KPMG calculations, CEFIC.
Ecostat (a department within CEFIC) also report that after the rapid growth in the number of corporate environmental reports from member companies experienced in 1993, 1994 saw a continuous improvement of environmental reporting both in number and in quality. Besides the corporate reports a large number of site reports have been published in several countries. More and more reports also take into account the recommendations included in the 1993 CEFIC Guidelines on Environmental Reporting.
From our review of annual reports, nearly all companies note their ongoing commitment in improving their environmental performance. Most companies view this as one of the most important challenges confronting them in the face of increased consumer pressure. A number of companies are now using environmental management systems to help them keep ahead of requirements and demonstrate their commitment to environmental improvement to their customers, the public, shareholders and other interested parties.
4.9.2. Survey results
Nearly all the companies interviewed in our face-to-face survey monitored environmental performance. This percentage may, however, be lower amongst smaller companies. When asked whether the SMP had impacted their environmental policies, nearly two-thirds of companies said that the SMP had at least some impact - 26% of companies said the impact was very significant and 35% said it was significant (see Figure F.l 1 in Appendix F).
4.9.3. Conclusions
There has been a positive and significant trend for improved environmental performance amongst EC chemical companies as a response to pressures from customers, the public and interested parties. The SMP has clearly influenced this process with nearly two-thirds of companies in the EC saying that the SMP had some impact on their environmental performance.


Corporate strategy 107
5. Corporate strategy
In terms of corporate strategy, increased competition should also have non-price effects, firms being encouraged to improve their organization, the quality and range of their products and, in particular, to engage in process and product innovation.
The impact of the single market programme on companies' corporate strategy is established by reference to market reports and by inclusion of a set of questions in the face-to-face questionnaire (see Appendix K) which specifically focused on this issue. We also report here the responses of companies on the way in which they decided to respond to the increased competition resulting from the SMP.
We have also incorporated in this section the key results on corporate strategy from our case studies and have concluded with a synthesis of the main conclusions from the evidence presented on trade, M&As, FDI and corporate strategy.
5.1. Implications of the single market programme for corporate strategy and nature of strategic responses
The literature relating to corporate strategy is particularly relevant in the context of scale and scope effects of the SMP. One expected economic effect of the SMP is that increased competition should also encourage the non-price effects mentioned above. The face-to-face survey probed deeper into this area by asking what strategies have been undertaken as a result of the changed set of market circumstances brought about by the SMP. It focused in particular on internationalism, capacity adjustment, location decisions, cost cutting/rationalization, employment and total production.
The responses from the face-to-face questionnaire in Figure 5.1 show that for almost all of these categories at least half the respondents indicate that the SMP has had no influence.
Employment decisions stand out as being the category where the least amount of influence has been felt. Conversely, managerial reorganization, cost cutting/rationalization, and internationalism were felt by almost half of the respondents as having been influenced by the SMP.
The impact of the SMP in this area was substantiated by interview comments where many companies felt, for example, that internationalism, although driven by globalization particularly in upstream activities, was facilitated within Europe by the SMP. Almost a third of face-to-face interviewees responded also that the SMP had resulted in joint ventures with other EC countries and closure of sales offices to merge into groups. This supports the notion that the SMP has facilitated a more 'international' strategic approach of many companies within Europe. Supporting this was the view from almost half of the face-to-face respondents that selling operations across country borders were brought under centralized control as a result of the SMP.

108 Chemicals
Figure 5.1. Strategie responses adopted as a result of the SMP
Face-to-face interview responses
What strategies have been adopted or influenced as a result of the SMP?
P W — l P U F
mmmmmmmmm
Total production
Employment
Managerial reorganization
Innovation EMPJPBWIMMP"
Adaptation of product range |
Cost cutting/rationalization
Local decisions
Capacity adjustment
Internationalism
ppm
o%
WÊÊmmimmmmm!^
10% 20% 30% 40% 50% 60% 70% 80%
Ξ Strong influence I Some influence ONo influence
In addition to the direct impact of the SMP on strategy, companies were also asked to indicate
the way in which they reacted to the increase in competition resulting from the SMP (see
Figure 5.2). In addition to cost reductions, a significant percentage of respondents (more than
one-third) said that they have accepted a lower profit margin to a significant or very significant
extent. Companies tried to improve efficiency also through investment and consolidation in
line with the earlier reported results on the exploitation of economies of scale and M&As.
The results from the postal survey were similar overall but they allowed an assessment of the
extent to which the responses differed by company size. Larger firms tried in general to reduce
costs more aggressively and achieved efficiency gains through M&As to a significantly greater
extent. Interestingly, smaller companies were more prepared to accept a lower profit margin
than larger ones.
Figure 5.2. Response to increased competition resulting from the SMP
Face-to-face interview responses
What has been your response to increased competition resulting from the
single market programme?
Withdrawal Efficiency Workforce Efficiency Price Acceptance
from gains level gains reduction of a lower
unprofitable through reduction through profit
markets investment M&As margin
D Very significant extent

Corporate strategy 109
5.2. Corporate strategy - Case studies
5.2.1. German agrochemicals company
In terms of product strategy the increased competition from generics, partly facilitated by the SMP, has led to the company expanding in this direction by acquiring a generics producer. Note that the current situation in registration, where EC legislation is superimposed on national laws, has also contributed to this trend, since generics involve significantly lower costs in terms of registration (and certification).
In terms of company organization and European sales strategy, the national structure of the business is being transformed into European lines of business, with European sales as the primary performance measure. Ultimately, it is hoped to establish pan-European key account management. These changes are likely to have been facilitated by the SMP as cross-border barriers to trade have been reduced.
Similarly, the company is moving away from national offices to regional centres for Europe, supported by formulation sites (six) and warehousing at each national/regional facility.
Despite all the strategic changes made to date, including a 30% reduction in European staff, manufacturing costs remain too high. The next step must be more concentration of manufacturing to further exploit economies of scale and optimize the production cost. In addition, outsourcing and closure of excess warehouse capacity will be required to eliminate unnecessary facilities, now incurring high costs due to compliance with stringent EC warehousing legislation.
Further, distributors are increasingly crossing borders, assisted by increased market access due to the SMP. A German distributor, which currently controls 50% of the South Bavarian market is expanding into Austria, the Czech Republic and former East Germany. Language, however, presents a significant barrier to intra-EC competition, which leads companies to buy into new markets rather than expand their existing operations.
A further possible indirect effect of improved intra-EC market access through the SMP is the ease with which goods are imported into the EC from outside the EC. Generic producers with operations outside the EC in low-cost regions such as South America will be able to purchase and sell through European distributors with minimal R&D and marketing expenditure.
5.2.2. Italian fibres company
The company is a family-owned firm which was founded in 1946 to produce household textiles - it employs 3,500 staff in 30 factories located in Europe and world-wide. The company has actively pursued a strategy of diversification, adding the production of carpets in the 1950s and fabrics for apparel, moquette and car floor coverings in the 1960s. In the 1970s, the company increased its vertical integration through the manufacture of synthetic fibres, a business which has grown to become the predominant activity of the group. More recently, the company diversified into new products and markets based on the same polymer raw materials used in the core businesses.
Increased competitive pressures in fibres and fabrics are arising largely from the entry of non-traditional suppliers from outside the EC, particularly the Far East. The single market

110 Chemicals
programme may have contributed to this because as barriers have been removed for companies within the EC, they have also been removed for entrants from outside.
There has also been significant downward pressure on prices, which have tended to converge to a uniformly low level. The SMP has played a direct role in enabling price harmonization in countries such as Spain and Portugal, markets which were very protected in the past.
Increased competition has resulted in substantial rationalization and concentration in the fibres and related sectors. There have been a number of significant mergers and acquisitions, for example DuPont's purchase of ICI's nylon business and the SNIA-Rhône-Poulenc joint venture. The trend has been towards development of integrated production, from raw material to polymer to fibre (particularly for polyamide 66), and rationalization of non-integrated producers through closure or acquisition.
Therefore, the large players have in general increased the number of plants operated and this has been coupled with increased plant size. The exit of inefficient companies and investment in the remaining plants to remain competitive have resulted in an increased scale of production for both polymers and fibres, and a high level of automation. This has been largely reflected in the company strategy, which has successfully tried to remain competitive.
The squeeze on margins leading to this increase in productivity, reduction in costs and differentiation was driven mainly by global competition. However, the SMP has indirectly opened up the EC to imports, facilitated intra-EC mergers and acquisitions and had a particular impact in Spain and Portugal, where the SMP has forced fibres producers to face the real market situation.
The SMP has in most cases better enabled the company to meet the challenges of increased competition and capitalize on market opportunities.
5.2.3. UK plastics company
Intra-EU imports have increased as trade barriers have been reduced, particularly from lower margin areas such as Spain and Italy into the higher margin markets of northern Europe. In addition, countries like Spain have reduced the previous barrier of a poor industry infrastructure through modernization programmes.
However, imports from non-EC competitors have also increased due to lower tariffs and the greater ease of access to these markets - if a company imports, for example, into Germany, it can import into all EC countries. This has led to a greater focus on international markets.
As a result of increased trade barriers, intra-EU imports have increased as trade barriers have been reduced. This is particularly the case from lower margin areas such as Spain and Italy into higher margin markets such as northern Europe. Further, countries such as Spain have implemented modernization programmes to reduce the barrier of a poor industry infrastructure.
Due to lower tariffs and the greater ease of access to these markets however, imports from non-EU competitors have increased. For example, a company importing into Germany can also import into all EU countries. To meet this challenge, the company is forming joint ventures with these competitors. This provides some protection in domestic markets by

Corporate strategy 111
working in partnership as opposed to against these companies. Joint ventures also provide access to the partners' markets as well. In addition, since the target areas are mostly dollar regions, due to the strength of the European currency, prices are low.
5.3. Conclusions
Overall, we can conclude that the SMP had an impact on strategy through the intensification of competition and the resulting reactions of companies that tried to reduce costs through reorganization and efficiency gains from M&As and investment. Companies also accepted lower profit margins, although this was particularly true of the smaller companies in the sector. When companies were asked about the direct impact of the SMP on strategy, the response was that the SMP does not appear to be affecting strategic decisions, over and above the effects identified already. Response categories where some influence was noted are managerial reorganization, internationalism and innovation.
5.4. A synthesis of results
We have presented, so far, evidence on the impact of the SMP, by area, looking separately at market access, trade, M&As, FDI and corporate strategy. It is important at this stage to evaluate the extent of consistency across the various areas.
The FDI data are consistent with the evidence on M&A trends presented earlier. The trends in both M&As and FDI, combined with the import penetration trends, support the hypothesis that:
(a) the reduction in trade barriers within the EC led to an increase in trade within the EC, from about 1987-88, which accelerated after 1989-90;
(b) this increase in trade was followed by increased FDI and M&A activity, as companies expanded across EC borders.
These trends were also influenced by the desire to exploit economies of scale as effectively as possible. The evidence provided on corporate strategy and our case studies (see also Chapter 6) also confirm that a number of companies did adopt a 'pan-European' strategy and reorganized their sales and marketing activities at a European level. The SMP was not seen, however, as the main driver of strategic decisions but rather as a facilitating mechanism for the implementation of the strategies chosen.


Casestudies 113
6. Case studies
The aim of the case studies is to examine the single market programme impact on companies by assessing the way in which specific legislation impacted upon the various areas of company activity. Case studies are also important to help identify the nature of the strategic responses that companies may have adopted as a reaction to any competitive pressures exercised by the SMP and any other opportunities or constraints that the SMP has created.
The choice of the case studies was based on the following criteria:
(a) coverage of different company sizes; (b) coverage of different sectors; (c) coverage of different countries; (d) coverage of companies that were affected to a different extent by the SMP; (e) coverage of companies with activities in more than one EC country; (f) coverage of companies with differing views on the overall success of the SMP.
The following three companies were finally chosen as case studies to be examined in detail:
(a) a large global German agrochemicals company; (b) a medium-sized Italian fibres company; (c) a medium-sized UK plastics company.
Some of the case study results have already been incorporated in earlier sections but the full results of the case studies are reported below. These follow in principle a similar structure providing first some company background, assessing the impact of single market measures, pricing, production and costs, followed by conclusions which include the company's views on the key remaining barriers to trade within the EC.
6.1. German agrochemicals company
6.1.1. Company background
The company is a joint venture between three large chemicals players which was formed to take full advantage of economies of scale in highly competitive and price sensitive markets. The company is a leading global player with a 9% share of the world market and a place amongst the industry's top five producers. The company has over 34 operating companies in Europe, North and Latin America, Asia, Africa and Australia and employs some 6,325 staff world-wide.
The top-selling products are herbicides, particularly those based on fenoxaprop, glufosinate, phennediphan and ethofunesate active ingredients. The company also manufactures insecticides (including the top selling pyrethroid, Decis), cereal fungicides (including the very successful Prochloraz range) and a range of environmental health products for domestic, commercial and industrial use.

114 Chemicals
6.1.2. Products and markets
The global agrochemicals market in Europe has suffered a considerable decline in recent years in an increasingly competitive environment. This is partly due to the cap imposed by GATT, the consequential move to world prices and the exit rate from farming of around 5% per annum. Some stabilization occurred in 1994 with world market growth of 4%. However, trading conditions remain difficult and this was the primary driver for the creation of the company.
Margins have been consistently squeezed as it has not proved possible to pass on cost increases at the producer or distributor level to the farmer as end-user. The latter has become increasingly focused on yield optimization at a given cost per hectare unit rather than yield maximization.
This has led to dramatically increased use of generics, which are highly cost-effective, easy to register (requiring only proof that the active ingredient and formulation are the same as an existing product) and therefore easy to introduce onto the market. This has led to many new market entrants and increased competition for the major players.
It is possible that these developments could ultimately lead to agrochemicals becoming a commodity business, with the major players focused on generics and a number of smaller companies specializing in niche markets. In this scenario, the emphasis will be on price, with very limited service and low margins incapable of supporting current levels of R&D. Already the larger players are facing the challenge of selling on total price (product and service) to discounters whilst the end-user wants to split out the product price from that for technical and after-sales service. Not surprisingly, the major companies are moving into generics (for example, the company recently purchased a generics producer).
6.1.3. Production and productivity
The natural concentration occurring in the farming industry has led to increased buying power and the ability for farmers to source outside their local marketplace. This, combined with the move to generics and the increased competitive pressures in a stagnant market, is leading to concentration upstream in agrochemicals. To date, this is occurring at the distributor level although it is also expected to be followed by the manufacturers. Table 6.1 shows that, for four EC countries, most of the market is controlled by very few distribution companies.
Table 6.1. Distribution in the European agrochemicals sector
EU country
Denmark Germany UK France
No of distributors
2 10 7 50
% of total market
80 80 70 70
In fact, the number of distributors within the EU is forecast to fall by about 25% in the next five years. Within a country, concentration has resulted in the presence of distributors having virtual regional monopolies. For example, in Denmark, a recent merger between two

Casestudies 115
distributors has created only one supplier for certain communities. In Germany, it is anticipated that only two distributors, one for the north and south respectively, will control the market in the future.
There is also an increasing trend for distributors to cross country borders, possibly facilitated by the SMP increasing market access. For example, Soufflet in France is now extending distribution into the Benelux countries. A German distributor which currently controls 50% of the south Bavarian market is extending its operations into Austria, the Czech Republic and former East Germany. The major barrier to intra-EC competition is actually language, meaning that distributors tend to buy themselves into a new market rather than just extending their existing operations.
Another indirect effect of the SMP may be that as intra-EC market access is improved so is the ease of importing goods from outside the EC. This will facilitate generic producers, with production bases outside Europe in low-cost regions such as South America, purchasing and then selling through European distributors with minimal R&D and marketing costs.
6.1.4. Impact of single market legislation and initiatives
Certification procedures
European certification is considered to provide only marginal, if any, benefit in the marketplace. For large companies, quality is taken for granted and for distributors, credibility is not enhanced as farmers see little or no benefit from suppliers being certified. However, there is some benefit within a company as certification sets internal standards for employees.
The SMP has had no noticeable impact on certification procedures which were already widely established within the EC prior to the single market.
Patenting procedures
The creation of a European patent centre will bring benefits in terms of reduced patenting costs and harmonization of standards and regulations across the EC. For example, patent life in Ireland is currently 16 years versus the norm of 20. This raises the possibility of companies exporting products with an expired patent in Ireland into the EC before the patent has expired there; nevertheless, these potential effects have not yet been translated into reality.
VAT procedures for intra-EC sales
Figure 6.1 shows that there is currently little or no harmonization of VAT rates within Europe. This has a strongly negative impact as farmers are increasingly crossing EC borders to purchase goods in countries with a lower VAT rate and then transferring them back, thereby saving the difference in VAT. For example, agrochemicals can be purchased in Luxembourg at 3% VAT and then imported into Germany (with 15% VAT) saving at least 12%.

116 Chemicals
Figure 6.1 VAT rates by European country
I 9% I 20% I I 8% |
6.1.5. Product registration
The registration of new agrochemical products, and particularly herbicides, is a lengthy and costly process within the EU. Legislation is becoming increasingly stringent, largely driven by the Scandinavian countries who want to minimize the use of agrochemicals. For example, Denmark has not registered a fungicide in the last ten years.
The result is that companies either:
(a) only register new products, eliminating older products from the range as they are too expensive to register; or
(b) offer older products to more restrictive markets, such as Denmark. This is possible because politically it is acceptable to restrict new registrations but less so for older products, whose unrestricted use has been previously sanctioned by the same legislature; or
(c) move more towards generics production.
The EC Product Registrations in Brussels has proposed recently the following changes, which are supported by the company:
(a) approval of product field trials in one country should be transferable to others, given the same soil conditions, etc. - avoiding the need for repetition of the same trial in each country in which registration is required;
(b) toxicological evaluation should be centralized in one location within the EU;

Case studies 117
(c) formulation evaluation should be carried out locally, unless previously repeated elsewhere in the EU when transfer of results should be possible;
(d) product registration should be centralized within the EU. Currently EU legislation is superimposed on national laws, creating a two-tier system.
To achieve the latter objective will require the current national structures or 'power bases', requiring registration staff in each country, to be broken. Achieving the US model where, although there are both federal and state laws, registration is not decentralized, will substantially reduce costs and speed up the registration process.
6.1.6. Trade barriers
The major remaining barrier to intra-EU trade is the absence of a single currency in Europe. Currently, the low margins in agrochemicals mean that the company's cost structure is not able to absorb major exchange rate changes, for example those occurring after the devaluation of sterling and the Italian Lira. In addition, the additional administrative load created by multiple currencies is a major barrier to the establishment of regional or pan-European order processing centres.
Energy costs are currently high in Germany and the only domestic source of fuel is coal. As this becomes less and less environmentally acceptable, Germany will become increasingly reliant on imports. A common energy policy within the European Union will then be essential to create a level playing-field and ensure a fair basis for energy procurement. Without this policy, rising energy costs will become a significant barrier to trade for German chemical companies.
EC restrictions on genetic engineering also form a barrier to trade. Seeds can be re-engineered to produce new, more valuable varieties or plants genetically modified to produce a higher level of activity of a natural active ingredient. In the USA, genetic engineering is highly developed whereas Europe is perhaps ten years behind due to difficulties in registration and national restrictions/bureaucracy. For example, new oil seed rape varieties registered in the USA are pending and may never obtain registration in Europe. Also, trial sites for new genetic varieties are easily obtained in France, whilst in Germany bureaucracy makes this very protracted and difficult, and in Scandinavia trials are almost impossible to carry out.
6.1.7. Pricing
It is difficult to harmonize pricing or set policy within the EC because of :
(a) different national distribution structures, for example: (i) some distributors include service whilst others do not (ii) countries may have a one- or two-tier distribution structure;
(b) different VAT rates in different countries; (c) additional costs in some markets due to different national interpretations of EC
packaging and labelling requirements, for example in Denmark, end-user price must be printed on each package and a tax paid based on this price;
(d) distributor strategies, for example buying in stock this year to lower consumer prices the following year.

118 Chemicals
6.1.8. Corporate strategy
The increased competition from generics, assisted in part by the SMP, has led to a change in the company's product strategy towards acquiring generics producers. The current situation in registration, where EC legislation is superimposed on national laws, has also contributed to this trend since generics involve significantly lower costs in terms of registration (and certification).
With respect to the organization of the company and European sales strategy, the national structure of the business is being transformed into European lines of business, with the primary performance measure being European sales. The ultimate aim is to have Key Account Management established across Europe. The reduction in cross-border barriers to trade through the SMP is likely to have facilitated these changes. Further the company is moving away from national offices to regional centres for Europe, supported by formulation sites (six) and warehousing at each national/regional facility.
Manufacturing costs however, still remain too high, given the changes made in the company's strategy, including a 30% reduction in European staff. The way forward must be concentration of manufacturing, to exploit opportunities in economies of scale and optimization of production costs. Furthermore, due to compliance with stringent EU warehousing legislation, outsourcing and closure of excess warehouse capacity, currently faced with high costs, will be required to eliminate unnecessary facilities.
6.1.9. Conclusions
The company has felt the direct impact of the single market programme most strongly in product registration:
(a) product registration is lengthy and costly because of lack of harmonization of national requirements;
(b) there is a need to centralize product registration within the EC and dismantle national 'power bases'.
There are still a number of barriers to intra-EC trade which can be summarized as :
(a) VAT rates, which vary widely within the EC leading to distortions and preventing companies from setting a consistent pricing policy;
(b) the absence of a single European currency; (c) the absence of a common energy policy for the EC; (d) some EC members' restrictions on genetic engineering of seeds.
In overall terms, the single market programme impact was less significant than the market dynamics over the last ten years; the SMP facilitated, however, the formation of the joint ventures, the subsequent rationalization and concentration of the combined businesses and the ongoing process of sales and supply within the EC.

Case studies 119
6.2. Italian fibres company
6.2.1. Company background
The company produces household textiles and has remained familyowned since it was
founded in 1946. It employs 3,500 staff in 30 factories in Europe and worldwide. Through a
process of diversification, the company has added to its portfolio of products with, carpets in
the 1950s and fabrics for apparel, moquette and car floor coverings in the 1960s. A
predominant activity of the group has become the manufacture of synthetic fibres in the 1970s,
which has led to increased vertical integration. More recently, the company has diversified
into new products and markets based on the same polymer raw materials used in the core
businesses.
The total turnover of the company was over LIT 2,000 billion in 1994, with consistent growth
over the last ten years. Nearly half of total sales are domestic, a further quarter intraEC and
the balance accounted for by export sales outside the EC. Figure 6.2 demonstrates that in the
period 198794, the share of domestic sales increased up to 1990 but then declined
significantly. From the perspective of the single market programme, it would be expected that
increased access to markets within the EC, as trade barriers have been removed, would be
reflected in increased intraEC share of total sales. This is not reflected in the figure, since the
fibres and fabrics sectors are highly competitive within the EC and to grow turnover
substantially the company has needed to focus on exports. Thus, although in absolute levels
there have been substantial increases in sales to other EC countries (from LIT 320 bn in 1991
to LIT 475 bn in 1994), the major expansion in nonEC exports (from LIT 259 bn in 1991 to
LIT 670 bn in 1994) has led to a reduced share of intraEC sales.
Figure 6.2. Italian fibres company: sales, geographic distribution
1994
1993
1992
u 1991
> 1990
1989
1988
1987
C
*^S2fêSSg^KaS^S^aïs?l 475 !
« n a m .·. «*. ; ι 399
m^SÊÊÊÊÊÊÊHÊa ■■■ 367 I 284 ι
fe^idMsSéaädfJ » β , ι 259 ι
Hü 318 ,. I 210 I
Wä 333 I 1741
M U H H 247 I 142 I
I 224 | 1261
670
ZI
) 500 1000 1500
Turnover (billion Lira)
1
2000 25
D ExtraEC
D IntraEC
m Italy
00

120 Chemicals
Increased competitive pressures in fibres and fabrics are arising largely from the entry of non-traditional suppliers from outside the EC, particularly the Far East. The single market programme may have contributed to this because as barriers have been removed for companies within the EC, they have also been removed for entrants from outside.
6.2.2. Impact of single market legislation and initiatives
Competition policy and the control of state aids
In the 1970s the oil crisis resulted in massive over-capacity in the fibres industry. In 1973 it was decided, through the Davignon agreement, that state aid would not be granted for capital investment in the European fibres industry.
However, there is evidence that this agreement is consistently contravened through the granting of state and EC aid to fibre producers. Aid has forced the market to restructure, segmenting and integrating, with competitors such as DuPont moving up market to higher value-added products. For smaller players such as this case study company, it brings into question their presence in these markets in the long term.
There is a conflict between the Davignon agreement and EC regional development policy. In other words, companies can obtain investment in the fibres industry by claiming technological innovation or by building plant in poor economic areas and citing the benefits for the region -more jobs, etc. - to obtain development grants. For example, in the south of Italy, the government offers tax breaks and low interest rates for investors. In the manufacture of polymers for bottles and film, all of the company's five main competitors are investing in southern Italy. The company, which is building capacity in the north, is at a distinct competitive disadvantage.
6.2.3. Environmental legislation
Environmental legislation is not considered to have in the short run a major competitive impact within the EC, but it is considered to be reducing the competitiveness of EC fibre producers against non-EC companies whose environmental standards and therefore costs are lower, for example in Poland. The additional cost burden is three-fold :
(a) capital cost of investment; (b) ongoing maintenance costs; (c) additional administrative overhead costs.
This is further compounded by longer lead times to market, arising from the extra time required to design and commission environmentally safe plant and equipment. For example, the HS&E department of the company typically takes six months to approve a proposed investment project.
Environmental legislation is a key issue for the group because, although only a small part of the company involves chemical processes, it is subject to stringent chemicals industry standards which do not really apply to most of its other businesses. In addition, the company, like many Italian companies, has plants close to residential areas. This has arisen historically

Casestudies 121
due to a lack of real urban/industrial planning in Italy but now increases the environmental pressures on the company.
In the long term, however, the company feels that environmental legislation will have a positive impact. This is primarily because of the harmonization of standards across Europe but also because of the technological improvements it will enable.
This will be particularly true for the company as it is currently relocating plants away from industrial zones at home to new locations in Italy and abroad. Legislation will allow the company to set up plants to common high standards across Europe and compete on an even playing-field from all locations. Until this is achieved, however, problems are still being faced with lack of environmental harmonization. For example :
(a) the packaging regulation unilaterally implemented by Germany stating that suppliers to their market must collect and return used packaging from customers;
(b) the German directive that fabrics containing certain dyes and pigments cannot be sold in the domestic market. This then affects fibre, polymer and finished product producers. Belgium is also not perceived to have a good compliance record to legislation.
6.2.4. Taxation and company legislation
In terms of the harmonization of procedures for indirect taxation, the company believes that the single market programme has increased the efficiency and ease of credit allocation whilst reducing the lead time required. However, the company feels that the key objective for the EC must be harmonization of direct taxation levels and structures across Europe.
Currently, the legal, legislative and tax structures can vary widely country by country. For example, Italy has high tax levels, very complex taxation laws and high administrative costs, all of which have a negative impact on competitive position. Also it is not possible to lend money to a subsidiary and charge low or no interest in order to minimize tax liability, whereas in other EC countries this is perfectly permissible.
To create a level playing-field, harmonization needs to cover issues such as:
(a) dividend rules; (b) availability of fiscal credits; (c) interest on inter-company loans.
Ultimately, countries ought not to be able to attract investors on the basis of lower levels of taxation, interest rates, etc.
6.2.5. Harmonization of technical standards and procedures
There are still opportunities to improve the harmonization of technical standards and procedures as EC legislation can suffer from different interpretations in national law. This is particularly true for the 'stronger' countries within the EC, such as Germany.
For example, although standards for fire retardant materials have been harmonized, there is still disagreement over those for flammability of fibres, with some countries lobbying to eliminate the potentially flammable polypropylene and others vigorously resisting this.

122 Chemicals
Another example relates to different standards for public procurement, that is, the specifications for public tenders can vary widely country by country. However, it is believed that this is currently being harmonized by the EC.
In overall terms, the SMP has had a substantial impact on the harmonization of technical standards and procedures and this, coupled with the reduction in frontier delays, simplification of customs documentation and deregulation of freight transport has greatly facilitated intra-EC sales. The key issue remaining for the company relates to the physical location of the company's major activities in northern Italy. This means that exports to northern Europe and the east have to pass through either Switzerland or Austria, which results in border delays and a prohibitive level of tolls. Although the situation will probably be improved as Austria has joined the EC, Switzerland is currently discussing limiting the number of trucks passing through its borders and the laden weight of each vehicle.
6.2.6. Pricing
Prices in the fibres and related industries have generally decreased over the last five to ten years and, more significantly, intra-EC price differentials have narrowed considerably. This is primarily due to increased competition from non-EC producers resulting in:
(a) reduced market coverage by western European fabric and garment producers; (b) high import penetration from outside the EC forcing European fibre producers to better
match customer requirements when faced with lowest price competitor products; (c) restructuring resulting in concentration in a highly complex and stagnant market
situation, coupled with a very aggressive pricing policy from all major players.
There has been significant downward pressure on prices, which have tended to converge to a uniformly low level. The SMP has played a direct role in enabling price harmonization in countries such as Spain and Portugal, markets which were very protected in the past. The SMP has also had an indirect impact in that the removal of barriers to trade within the EC has also removed barriers to the import of goods from outside the EC. This has been a one-sided process in that import barriers in the other major trading blocs, such as Japan, the USA, etc., have largely remained intact.
The key remaining barrier to uniform prices within the EC are exchange rate fluctuations, creating intra-EC differences in both raw material and finished product pricing. However, price changes due to currency changes are implemented much more rapidly than in the past. In addition, differences in logistics/transportation costs due to physical location and degree of business risk involved also still contribute to price differentials.
6.2.7. Production and productivity
As discussed earlier, increased competition has resulted in substantial rationalization and concentration in the fibres and related sectors. There have been a number of significant mergers and acquisitions, for example DuPont's purchase of ICI's nylon business and the SNI A-Rhône-Poulenc joint venture. The trend has been towards development of integrated production, from raw material to polymer to fibre (particularly for polyamide 66), and rationalization of non-integrated producers through closure or acquisition.

Case studies 123
Therefore, the large players have in general increased the number of plants operated and this has been coupled with increased plant size. The exit of inefficient companies and investment in the remaining plants to remain competitive have resulted in an increased scale of production for both polymers and fibres, and a high level of automation.
Productivity has also increased substantially through investment in new technology, coupled with plant de-bottlenecking to increase efficiency, exploit economies of scale and reduce unit labour and energy costs. This has been the driver for the loss of small and/or inefficient producers who could not afford to expand to exploit economies or to update their technology to remain competitive.
The squeeze on margins leading to this increase in productivity, reduction in costs and differentiation was driven mainly by global competition. However, the SMP has indirectly opened up the EC to imports, facilitated intra-EC mergers and acquisitions and had a particular impact in Spain and Portugal, where the SMP has forced fibres producers to face the real market situation.
6.2.8. Impact of internal legislation on the cost base
Legislation from the SMP has impacted directly on the company's cost base in three key areas:
(a) environmental costs, both capital investment and ongoing; (b) ongoing product liability costs; (c) group accounting costs, largely as a one-off.
The increased environmental cost has been discussed under environmental legislation. Ongoing product liability costs have increased largely due to the harmonization of product requirements and technical standards within the EC and the concurrent raising of those standards. In addition, compliance from companies is more rigorously assessed and noncompliance actively pursued and penalized.
Accounting costs were increased significantly when the group consolidated its balance sheet to cover all subsidiary activities. This was largely a one-off expense driven by the high level of past acquisition and facilitated by the SMP through better harmonization of national accounting procedures and practices.
6.2.9. Conclusion
The company is operating in a difficult and highly competitive market environment, driving significant restructuring and concentration of the industry. The single market programme has in most cases better enabled the company to meet the challenges of increased competition and to capitalize on market opportunities.
There are three key areas where single market legislation has not provided the desired impact:
(a) competition policy and the control of state aids; (b) direct taxation and company law; (c) harmonization of technical standards and procedures.

124 Chemicals
Concern over the lack of control of state aids centres on several state or EC-funded investments in the fibres industry despite severe over-capacity and the Davignon agreement to prevent such actions. This is driven by easy access to regional development grants and other funds which are used by companies and national governments to circumvent previous agreements.
The SMP has largely not included company law and direct taxation, so there are a number of actions required to establish a level playing-field across Europe in this area.
Harmonization of technical standards and procedures has been greatly improved by the SMP, but needs to be taken further to fully eliminate national differences and parochial actions. For example, Germany is currently requiring suppliers to collect and return used packaging delivered to domestic customers.
Finally, another key area for the company is environmental legislation which it is believed will bring benefits, through harmonization, in the longer term, but which adds a considerable cost burden to the company in the short to medium term.
6.3. UK plastics company
6.3.1. Company background
The company was formed in July 1993 as a 50:50 joint venture between a UK and a Dutch concern. This combination established the company as Europe's leading supplier of PVC additives, its second largest provider of radiation cure chemicals (polymer coatings for expensive, glossy paper), and a strong player in the supply of application chemicals.
The company has 12 manufacturing sites, employing some 1,100 staff and located in the UK, Germany, the Netherlands, France and the USA. Currently, most of the company's sales, which amount to over £220m annually, are earned from business in Europe, with the UK and Germany as the major markets. However, with the US production centre and strong sales bases in the Middle and Far East, the company is focused on building its profile and business globally.
The two parents of the company are well established, diversified multinationals who brought complementary businesses together. Depressed economies, together with the increasing costs of servicing a technically sophisticated market, had, over recent years, added considerably to the commercial pressures faced by both companies in what is a highly competitive environment. Recognizing that the situation was unlikely to improve in the short term, the parent companies decided that the best way forward in increasing market share profitably was to combine particular areas of their respective businesses and expertise.

Case studies 125
The cost structure in 1995 is detailed in the figure below.
Figure 6.3 UK plastics company: 1995 cost structure
1995 cost structure
3% 1%
66%
M Raw materials
■ Direct labour
; D Depreciation
D Other manufacturing cost
■ Sales & distribution
Ξ General & administration
■ R & D
D Central overheads
This demonstrates the very high cost dependence on raw materials and explains the substantial
impact on profitability as raw material prices rise and fall. The single market programme has
had little impact on the overall cost base in the company as it has not significantly affected raw
material costs.
Although the programme has made it much easier to source from within the EU, the share of
materials from this source has actually decreased. This is due to the emergence of cheaper,
quality products from the Far East and Eastern Europe.
6.3.2. Impact of single market legislation and initiatives
Overall
The European Union places its primary emphasis on consumer benefits and not necessarily on
the needs of manufacturers. This results in price pressures and industry rationalization. Once
this is achieved internally and companies want to expand globally, EC merger policy often
blocks realization of this by major pan-European mergers/joint ventures. The company felt
that it is unfair for the European Commission to encourage businesses to be global but then
prevent major expansion (and the associated performance improvement) in Europe.
Specific chemical legislation
Directives 67/548, 88/379 and 78/631 relating to the packaging, labelling and classification of
dangerous substances/preparations/agrochemicals have had some positive impact on the

126 Chemicals
company, resulting in harmonization across the European Union and the exit of smaller players who cannot comply.
However, legislation relating to the registration of herbicidal products has had a strongly negative impact because of the prohibitive costs associated with compliance. This cost is difficult to quantify but has resulted in companies leaving the sector as they can no longer remain competitive. This is in contrast with the intended result of this legislation in raising and harmonizing standards across Europe.
Environmental legislation
In terms of environmental legislation within the European Union some countries do not check compliance although they express full agreement with EU legislation. Others, for example the UK, protest about much of the legislation, but once implemented, religiously check compliance.
The overall impact of environmental legislation on the company has been negative because of the high costs involved in compliance. This is exemplified by a planned investment of £8.4 million in 1996 at the company, comprising 60% of the company's total capital projects budget. These investments typically have little or no direct financial return and to compensate for this and meet profit targets the required pay-off from other projects is continually having to be increased. This results in a reduced number of other investments and, because these projects often create jobs, leads indirectly to less employment in the European chemicals industry. In addition, environmental legislation has resulted in plant rationalization. For example, the company has recently closed its site in France purely to avoid the necessary investment for environmental compliance.
Competition policy and the control of state aids
There is little or no evidence that state subsidies are controlled to meet the needs of the EC rather than solely national interests. For example, despite severe European over-capacity in the salt industry the Dutch recently subsidized a new domestic mine. Similarly, the French government has invested heavily in domestic electricity despite an excess of capacity. This has resulted in the sale of electricity at only incremental cost.
Access to cheaper sources of input
Admittedly, transport costs have reduced due to deregulation, reduction in customs documentation and the elimination of delays at borders within the EU. However, domestic energy costs have significantly increased in recent years and there is little or no access to cheaper sources in other EU countries.
6.3.3. Production and productivity
Ten years ago, the company constituted ten separate companies in the UK, Germany, France and Benelux. Over this period, a high degree of concentration has occurred, largely through mergers and acquisitions.
In highly competitive markets and depressed economies, the increasing costs of servicing ever more demanding customers has consistently squeezed margins and constrained profitable

Casestudies 127
growth. Companies have recognized that combining skills, facilities and expertise significantly strengthens their competitive position and this has been the major driver of concentration. The company is a typical result of such a strategy and considers that the single market programme has not been the driver for these changes but has greatly facilitated/accelerated its realization.
Concentration has also enabled significant rationalization of the production base over the last five to ten years. Local production has been replaced by centres serving regional if not global markets. In increasing competition and (direct) costs, thereby forcing productivity increases, the single market programme has contributed significantly towards the rationalization of the production base within the company.
6.3.4. Employment
The company believes that legislation regarding workers councils is counter-productive, diverting management time and achieving very little.
6.3.5. Corporate strategy
Internationalism
Intra-EC imports have increased as trade barriers have been reduced, particularly from lower margin areas such as Spain and Italy into the higher margin markets of northern Europe. In addition, countries like Spain have reduced the previous barrier of a poor industry infrastructure through modernization programmes.
However, imports from non-EC competitors have also increased due to lower tariffs and the greater ease of access to these markets - if a company imports, for example, into Germany, it can import into all EC countries. This has led to a greater focus on international markets.
To meet the challenge of increased non-EC imports into Europe, the company is forming joint ventures with these competitors. For example, the company is currently negotiating with potential partners in Turkey. This provides some protection in home markets by working with rather than against these companies and also provides access to the latter's own markets. Because most of these target areas are dollar regions, prices are low due to the strength of the European currency. Joint ventures allow the company to compete effectively by establishing local production centres.
European sales organization
The single market programme has facilitated the closure of national sales operations and the control of sales and marketing across country borders by single offices, through substantial reduction in cross-border controls. The company reduced significantly the number of sales offices over the last ten years.
Currently, the company wants to centralize invoicing, avoiding invoicing by the production site and then reinvoicing by the distribution centre. Invoices will be sent direct to customers, with those for small volumes outsourced to local distributors.

128 Chemicals
6.4. Conclusions
The case studies have provided results largely consistent with the main conclusions of the report. The SMP was found to have affected competition, in some cases by facilitating entry from non-EC producers, and led to significant convergence of prices to the lowest levels. The SMP has also facilitated cross-border M&As and expansion into other countries, although companies considered market developments and the exploitation of economies of scale the most significant driver for such decisions.
In terms of corporate strategy, there seems to be a shift towards pan-European marketing and sales strategies, although widely divergent VAT rates were considered responsible for preventing, in some cases, a geographically consistent pricing strategy. The increased competition from generics, resulting partly from the EC chemical-specific legislation in agrochemicals, has also led larger producers to seek diversification into this area and away from the more expensive in terms of R&D new substances.
The most recent members (Spain and Portugal) faced the strongest competitive pressures as barriers to trade from the SMP were reduced soon after the accession of the countries to the EC. Environmental legislation was considered again to have increased costs, especially in southern Europe, but interestingly the company thought that in the longer run environmental legislation would be beneficial, through the creation of a level playing-field and the encouragement of technological developments.
In terms of remaining barriers, the key areas are:
(a) exchange rate movements; (b) competition policy and state aids; (c) the harmonization of standards and procedures; (d) the correction of double-control structures (EC super-imposed on national) in
registration and classification procedures for substances and preparations.
Other areas of concern included divergent VAT rates, the absence of a common energy policy and the inconsistent application and monitoring of legislation, especially environmental legislation.

Appendix Λ: Major data source differences 129
APPENDIX A
Major data source differences
Data for the study have been taken from the DEBA and INDE databases. Data for only five of the seven sectors were available. A description of the available data for each sector, within each database, is as follows:
Sector defined by Frost & Sullivan
Heavy industrial chemicals Petrochemicals Synthetic fibres Agrochemicals Soaps, detergents, perfumes, toiletries Paints, varnishes and printing inks Fertilizers Other chemicals
Sector defined by Eurostat, DEBA database
Basic industrial chemicals, petrochemicals Included in the DEBA heavy industrial chemicals sector Man-made fibres Industrial and agricultural chemicals Manufacture of household chemicals (data n/a)
Paint, varnishes and printing inks Maintenance products (data n/a) Speciality and other chemicals
Although selection from the databases tried best to match the sectoral definitions, according to Frost & Sullivan, disparities nevertheless exist. For example, heavy industrial chemicals and petrochemicals are considered within a single sector defined by the database. Further, in two cases, that of the soaps, detergents, perfumes sector and the toiletries and fertilizers sector, data were simply not available.

130 ^ Chemicals
APPENDIX Β
Details of the petrochemicals sector
B.l. Base petrochemicals
B.l.2. Olefins
The olefins are a family of organic chemicals which are amongst the most important 'building blocks' used in the generation of intermediate and end products in the chemical industry. Their importance stems from their ability to participate in further chemical reactions and therefore nearly all synthetic materials will have involved the use of olefins at some point in their creation. Whilst they are reactive, they are also relatively stable and non-toxic under normal conditions and can be stored and transported without undue risk. The most important of the olefins are:
(a) ethylene; (b) propylene; (c) butadiene (actually a diolefin).
To these may be added what are collectively known as the C4+ olefins, higher olefins which are typically produced by the same cracking process that produces the above three commodities.
B.l.2. Aromatics
As with olefins, the aromatics are a unique family of products with similar characteristics and properties. They occur naturally in crude oil and can be extracted from hydrocarbon liquids at various stages in the oil refining or petrochemical chain.
The key base aromatics are:
(a) benzene; (b) toluene; (c) xylene.
Collectively, they are referred to as 'BTX' products and over 9 million tonnes are produced in Europe each year, with benzene production accounting for over two-thirds of the total. Although rarely used directly for any purpose, except in petrol, they form the starting point for a vast range of downstream chemical products. In many cases, intermediate stages involve both aromatic and olefin parents.
B.1.3. Ethylene
Ethylene is the lightest of the olefins and the most basic petrochemical product. It is also the most important, as it is used as a feedstock for the production of a wide range of other petrochemicals.

Appendix Β: Details of the petrochemicals sector 131
Ethylene is commercially produced by a process known as steam cracking, or sometimes just cracking. In this process, hydrocarbons are heated to around 800°C in the presence of steam to give a chemical mixture including ethylene. The percentage yield of ethylene is a function of the type of petroleum feedstock used, and the temperate and pressure of the cracker. In addition to ethylene a number of co-products will also be formed and these must be removed to give pure ethylene.
The lightest possible feedstock is ethane and this gives the highest yield of ethylene. Other commonly used feedstocks are LPG, naphtha (a medium-light oil fraction) and gas oils. These heavier inputs are often used in preference to ethane, as they are cheaper and give more valuable co-products.
Ethylene is the most significant petrochemical as it is used in the production of a vast number of other products, most notably polyethylene. In its various forms, polyethylene accounts for over half of all ethylene consumed. By combination with chlorine, it is used for the production of PVC and styrene, along with other polymers. Non-polymer usage accounts for maybe 15% of total ethylene production.
As it is at the centre of the entire petrochemicals industry, almost all hydrocarbon-derived products will either use it at some stage in their manufacture or use another product, such as propylene, generated as an ethylene co-product. As such, it is difficult to segment the ethylene market 'by usage type'. A given end product may involve ethylene in numerous applications during its production chain. Others, such as polyethylene, effectively require only one major chemical step from ethylene to a semi-finished item.
Key 'first- or second-stage' derivative products of ethylene and some of their applications are:
(a) low density polyethylene, LDPE; (b) linear low density polyethylene, LLDPE; (c) high density polyethylene, HDPE; (d) ethylbenzene (used in part to make styrene); (e) styrene (used to make polystyrene and in resins for use in vehicle manufacture as
acrylonitrile-butadiene-styrene (ABS)); (f) ethylene oxide (used to make monoethylene glycol and glycol ethers); (g) monoethylene glycol (used in anti-freezes, polyester, resins, solvents, detergents and
brake fluid); (h) ethylene dichloride (used in part to make vinyl chloride monomer); (i) vinyl chloride monomer (used to make PVC); (j) ethanol (used in alcoholic drinks and other industrial applications); (k) acetaldehyde.
In terms of supply and demand, there was significant disparity in the early 1980s and the overcapacity created led to large numbers of plant closures. There is still over-capacity today and although the situation is considerably less severe, it has been made worse by the poor cost position of European producers in comparison with international rivals. Thus, although utilization rates are higher than in the 1980s, margins have been hit by the possibility of cheap imports, both of ethylene and its derivatives.

132 Chemicals
Β. 1.4. Propylene
Propylene is the second lightest olefin. It is produced in an olefin cracking plant, usually in a
steam cracker along with ethylene. It is usually the latter that is the facility's main product,
but propylene is generally the most important co-product. Typically, its volume accounts for
perhaps 35-60% of the output of ethylene from the cracker, depending upon the feedstock
type.
Propylene is also produced as a by-product of oil refining, in particular in the catalytic cracker
units at refineries. Therefore it is not always a co-product of ethylene, although chemical
plants still dominate production. It is produced, with ethylene, in 12 countries around western
Europe, with Germany as the largest producer.
Propylene is the raw material for production of polypropylene and this accounts for about 40%
of consumption. Other uses include acrylonitrile, acrylic acid, propylene oxide, isopropanol,
oxo-alcohols and cumene/phenol.
Demand for polypropylene in Europe has remained relatively strong throughout the recent
recession, having grown by about 10% in the five years to 1993. To a large extent this is due
to increasing requirements for polypropylene, which has experienced significant demand
growth as it can be substituted for a range of polymers and non-polymers in many
applications.
Western Europe has generally experienced a trade deficit in propylene. Traditional production
as a co-product of ethylene from steam crackers has meant that, although the mix of ethylene
and propylene can to some extent be altered, propylene output has been largely determined by
demand for ethylene. As a result, depressed demand for ethylene during the recession reduced
ethylene and propylene production, even though propylene demand was more robust.
Perhaps not surprisingly, refinery-produced propylene which in the early 1980s accounted for
12% of western European production had risen to 25% of the total in 1993 and is expected to
account for more than 30% in the late 1990s. This will mean that the current gap between
propylene supply and demand is likely to be narrower in the future.
B.l.5. Butadiene
Butadiene is generally produced as a co-product of ethylene and propylene in steam crackers,
although it is a far less significant petrochemical than the latter two. Typically, the cracker
will produce a 'mixed C4 stream' alongside the main products, with the '4 ' relating to the
minimum number of carbon atoms in each molecule (ethylene and propylene have 2 and 3
respectively, and are consequently lighter products). The presence, and relative importance, of
this stream will depend largely upon the feedstock type used in the unit. In general, the
heavier the input (i.e. naphtha or gas oil as compared with ethane or LPG), the higher the yield
of butadiene and other C4 olefins. Products from this stream will include both straight chain
olefins, such as the butènes, and diolefins such as butadiene.
In the USA, butènes and other related products are derived from oil refineries' catalytic
cracking units, as a result of the high usage of ethane as a feedstock. In Europe, the
prevalence of naphtha as a petrochemical input ensures a strong C4 presence. Consequently,
butadiene is frequently in surplus in Europe and a significant volume is therefore exported.

Appendix Β: Details of the petrochemicals sector 133
Butadiene is produced in nine western European countries, although over a quarter of capacity is located in Germany.
Butadiene is primarily used in the production of synthetic rubbers of various types, the most important being styrene/butadiene rubber (SBR), polybutadiene and nitrile rubbers. Because of the frequent industry surplus, another important application involves its recycling as a cracker feedstock.
B.l.6. Higher olefins
The higher olefins include the C4 stream described above and all further olefin products with a higher number of carbon atoms in each molecule. These products are the least plentiful olefins obtained from cracker feedstock but the large number of products obtained result in a wide variety of uses and applications. The heavier the feedstock the greater the percentage of higher olefins produced and therefore production is higher in western Europe than in the USA.
Excluding the C4 stream, octenes and nonenes, with a minimum of 8 and 9 carbon atoms respectively, are typical higher olefin products. As finished products, they have little or no applications and are used almost exclusively for further processing.
Higher olefins are typically liquids or solids at ambient temperature and are therefore much easier to handle and distribute than the gaseous ethylene, propylene (and butadiene).
B.l.7. Benzene
Benzene is the simplest of the aromatic hydrocarbons and is highly significant as the basic building block for this very large class of compounds with a wide range of uses and applications. Benzene and its many derivatives form a product group wholly distinct from those derived from the acyclic ethylene, propylene and butadiene.
Benzene occurs naturally in crude oil and is often extracted, along with other aromatics, during oil refinery processes from an intermediate oil fraction known as 'reformate'. Another production route, involving petrochemicals rather than petroleum, is from an ethylene cracker, especially one using naphtha as a feedstock. This will produce a substance known as 'pyrolysis gasoline' or 'pygas' in addition to the main olefin products. As with reformate, benzene and other aromatics may be extracted from this intermediate product. Finally, benzene is also produced from toluene (actually methylbenzene), one of the other basic aromatic products, through a process of hydrodealkylation. Benzene is produced in nine western European countries, although half of all capacity is located in Germany and the Netherlands.
A potential threat to aromatics producers is posed by regulations regarding reformulation of petroleum. In the USA, regulatory changes in 1992 have required that the oxygen content of petroleum must be increased to more than 2.7%. This content is provided by the addition of MTBE - methyl t-butyl ether - which in turn reduces the requirement for the large quantity of aromatics currently used in petroleum. Furthermore, in 1995, legislation has been introduced to directly limit aromatics contents in US fuels.

134 Chemicals
Since usage in petrol (to increase octane rating) is several times higher than that for chemical conversion, this will create a large surplus, despite the possibility of modifying some refining processes so as not to make benzene. As export of these products is relatively cheap, European producers are under threat from imports from the USA and there also is the possibility that benzene levels in European petroleum will be reduced, given concern over its carcinogenic properties.
This latter threat has been reduced by the large reduction in hydrocarbon emission through the introduction of catalytic converters in cars, such that the gains to be made through benzene content reduction are now relatively small.
Key derivatives of benzene and their applications include:
(a) ethylbenzene (an intermediate in the production of styrene); (b) chlorobenzene; (c) cyclohexane (used to produce caprolactam, which in turn is used in nylon production); (d) nitrobenzene; (e) eumene, phenol and styrene; (f) maleic anhydride.

Appendix C: Intra-EC imports 135
APPENDIX C
Intra-EC imports as a share of total imports, by country and sector Table C.l. Intra-EC imports as a share of total EC imports by country
Country
Germany France Italy Netherlands Lux. & Belgium UK Ireland Denmark Greece Spain Portugal EC 12
1980
0.69 0.76 0.74 0.72 0.79 0.61 0.83 0.66 0.81 0.64 0.80 0.71
1981
0.68 0.76 0.72 0.70 0.78 0.62 0.81 0.65 0.80 0.65 0.80 0.71
1982
0.67 0.75 0.74 0.71 0.79 0.61 0.77 0.66 0.77 0.67 0.79 0.71
1983
0.68 0.76 0.71 0.72 0.81 0.62 0.79 0.65 0.80 0.68 0.77 0.71
1984
0.68 0.75 0.72 0.66 0.81 0.63 0.75 0.65 0.77 0.69 0.77 0.71
1985
0.68 0.75 0.72 0.65 0.79 0.62 0.73 0.67 0.80 0.69 0.79 0.70
1986
0.68 0.75 0.74 0.65 0.78 0.62 0.76 0.67 0.79 0.70 0.80 0.71
1987
0.69 0.76 0.74 0.66 0.79 0.61 0.77 0.68 0.79 0.72 0.80 0.71
1988
0.68 0.76 0.74 0.66 0.75 0.61 0.78 0.67 0.78 0.71 0.79 0.71
1989
0.67 0.76 0.72 0.64 0.73 0.61 0.74 0.68 0.78 0.72 0.81 0.70
1990
0.68 0.76 0.73 0.63 0.73 0.64 0.73 0.69 0.77 0.72 0.82 0.70
1991
0.66 0.77 0.73 0.63 0.73 0.65 0.70 0.71 0.74 0.71 0.81 0.70
1992
0.66 0.77 0.73 0.65 0.72 0.65 0.70 0.69 0.75 0.72 0.82 0.70
Table C.2. Intra-EC imports as a share of total EC imports by sector
Sector
Heavy industrial chemicals
Paints, varnishes and printing inks
Agrochemicals
Speciality and other chemicals
Synthetic fibres
1980
0.71
0.84
0.72
0.65
0.75
1981
0.71
0.83
0.71
0.62
0.78
1982
0.71
0.83
0.72
0.59
0.76
1983
0.71
0.83
0.73
0.61
0.77
1984
0.71
0.83
0.72
0.61
0.76
1985
0.70
0.83
0.71
0.63
0.75
1986
0.71
0.84
0.71
0.63
0.75
1987
0.71
0.84
0.72
0.63
0.75
1988
0.71
0.84
0.71
0.62
0.73
1989
0.69
0.83
0.72
0.62
0.72
1990
0.70
0.84
0.73
0.62
0.73
1991
0.70
0.82
0.72
0.63
0.73
1992
0.70
0.81
0.73
0.64
0.74

136 Chemicals
Table C.3. Total import penetration
Country
France Lux. & Belgium Netherlands Germany Italy UK Ireland Denmark Greece Portugal Spain EC 12
1980
0.40 N/A N/A 0.37 0.36 0.78 3.96 3.07 0.63 0.50 0.25 0.52
1981
0.38 N/A N/A 0.44 0.35 0.86 4.56 3.24 0.59 0.49 0.26 0.53
1982
0.37 N/A N/A 0.42 0.36 0.94 4.67 0.92 0.59 0.39 0.27 0.56
1983
0.38 N/A N/A 0.43 0.40 0.97 4.55 0.95 0.70 0.39 0.29 0.58
1984
0.39 N/A N/A 0.45 0.37 1.01 5.45 0.92 0.63 0.38 0.32 0.59
1985
0.43 N/A 17.55 0.48 0.42 1.06 5.30 0.93 0.64 0.38 0.28 0.61
1986
0.43 N/A 5.77 0.48 0.47 1.06 4.67 0.91 N/A 0.44 0.35 0.67
1987
0.44 N/A 5.63 0.49 0.44 1.05 4.71 0.91 0.69 0.45 0.37 0.66
1988
0.45 N/A 5.21 0.49 0.47 1.09 5.44 0.93 0.65 0.44 0.37 0.68
1989
0.46 N/A 5.76 0.50 0.46 1.12 5.81 1.07 0.70 0.49 0.39 0.70
1990
0.46 N/A 4.79 0.52 0.47 1.22 7.44 1.13 0.76 0.63 0.40 0.74
1991
0.48 N/A 4.70 0.58 0.48 1.19 5.63 1.09 0.80 0.67 0.41 0.80
1992
0.49 N/A 4.74 0.59 0.50 1.15 6.18 1.19 0.76 0.66 0.43 0.83
Table C.4. Intra-EC import penetration
Country
France Lux. & Belgium Netherlands Germany Italy UK Ireland Denmark Greece Portugal Spain EC 12
1980
0.30 N/A N/A 0.25 0.26 0.48 3.30 2.03 0.51 0.40 0.16 0.37
1981
0.29 N/A N/A 0.29 0.25 0.53 3.68 2.11 0.47 0.39 0.17 0.38
1982
0.28 N/A N/A 0.28 0.27 0.57 3.61 0.61 0.45 0.31 0.18 0.40
1983
0.29 N/A N/A 0.29 0.28 0.60 3.57 0.62 0.56 0.30 0.20 0.41
1984
0.29 N/A N/A 0.31 0.27 0.63 4.08 0.59 0.49 0.29 0.22 0.41
1985
0.32 N/A 11.43 0.32 0.30 0.65 3.90 0.62 0.51 0.30 0.20 0.43
1986
0.32 N/A 3.76 0.33 0.35 0.66 3.56 0.61 N/A 0.35 0.24 0.48
1987
0.33 N/A 3.72 0.33 0.33 0.64 3.62 0.62 0.54 0.36 0.27 0.47
1988
0.34 N/A 3.45 0.34 0.34 0.67 4.23 0.63 0.51 0.35 0.26 0.48
1989
0.35 N/A 3.71 0.33 0.33 0.68 4.28 0.73 0.54 0.40 0.28 0.49
1990
0.35 N/A 3.02 0.35 0.35 0.79 5.45 0.78 0.59 0.52 0.29 0.52
1991
0.37 N/A 2.96 0.38 0.35 0.77 3.95 0.77 0.59 0.54 0.29 0.56
1992
0.38 N/A 3.06 0.39 0.36 0.75 4.35 0.82 0.57 0.54 0.31 0.58

Appendix Dl: Intra-EC exports 137
APPENDIX Dl
Intra-EC exports as a share of total exports, by country and sector
Table D.l.l. Intra-EC exports as a share of total EC exports by country
Country
Germany France Italy Netherlands Lux .& Belgium UK Ireland Denmark Greece Spain Portugal EUR-12
1980
0.46 0.63 0.47 0.66 0.56 0.49 0.74 0.31 0.40 0.46 0.64 0.53
1981
0.46 0.61 0.46 0.66 0.54 0.50 0.73 0.29 0.46 0.44 0.69 0.53
1982
0.49 0.63 0.48 0.69 0.58 0.50 0.71 0.31 0.54 0.46 0.73 0.55
1983
0.48 0.62 0.45 0.66 0.58 0.48 0.67 0.28 0.63 0.40 0.75 0.54
1984
0.48 0.61 0.44 0.66 0.57 0.49 0.63 0.28 0.53 0.46 0.73 0.53
1985
0.48 0.61 0.46 0.66 0.57 0.49 0.66 0.27 0.43 0.49 0.73 0.54
1986
0.49 0.62 0.50 0.68 0.58 0.52 0.67 0.29 0.47 0.46 0.78 0.55
1987
0.50 0.64 0.52 0.68 0.60 0.51 0.68 0.31 0.41 0.51 0.75 0.56
1988
0.49 0.66 0.53 0.69 0.75 0.53 0.64 0.33 0.47 0.55 0.71 0.58
1989
0.49 0.66 0.53 0.70 0.75 0.53 0.65 0.28 0.57 0.59 0.77 0.58
1990
0.50 0.68 0.55 0.72 0.77 0.55 0.70 0.32 0.59 0.61 0.76 0.60
1991
0.49 0.67 0.55 0.71 0.76 0.56 0.67 0.31 0.57 0.60 0.76 0.59
1992
0.48 0.67 0.55 0.74 0.77 0.56 0.71 0.34 0.59 0.60 0.76 0.59
Table D.I.2 Intra-EC exports as a share of total EC exports by sector
Sector
Heavy industrial chemicals
Paints, varnishes and printing inks
Agrochemicals
Speciality and other chemicals
Synthetic fibres
1980
0.53
0.53
0.52
0.60
0.55
1981
0.52
0.51
0.52
0.60
0.54
1982
0.55
0.52
0.53
0.60
0.60
1983
0.54
0.52
0.52
0.59
0.58
1984
0.53
0.51
0.52
0.59
0.57
1985
0.53
0.52
0.52
0.58
0.58
1986
0.54
0.56
0.53
0.58
0.63
1987
0.55
0.57
0.55
0.60
0.63
1988
0.57
0.58
0.55
0.60
0.65
1989
0.58
0.58
0.56
0.60
0.64
1990
0.60
0.59
0.58
0.64
0.67
1991
0.58
0.60
0.57
0.64
0.71
1992
0.59
0.59
0.57
0.64
0.73

138 Chemicals
APPENDIX D2
Foreign direct investment data
Table D.2.1 Net FDI in reporting country (million ECU)
Country and investment
Germany
UK
France
Italy
Spain
EC12
source of
In-EC Ex-EC
Total
In-EC Ex-EC
Total
In-EC Ex-EC
Total
In-EC Ex-EC
Total
In-EC Ex-EC
Total
In-EC Ex-EC
Total
1984
-105 -103 -208
-25 -148 -173
-161 -116 -277
-64 -54
-118
-120 -781 -901
1985
-140 -71
-211
-7 43 36
-89 -38
-127
-376 650 274
-745 428
-317
1986
52 346 398
-46 -63
-109
-43 -13 -56
-176 -150 -326
-371 50
-321
1987
17 53 70
9 -291 -282
-155 -443 -598
-111 -122 -233
-750 -1,649 -2,399
1988
-64 5
-59
-235 -334 -569
-9 92 83
-222 -460 -682
-972 -1.233 -2.205
1989
38 190 228
-1,521 -633
-2,154
-6 -96
-102
-548 -134 -682
-330 -295
-3,959 -988
-4.947
1990
1,059 179
1.238
-21 -146 -167
-223 -196 -419
494 -493
1
-348 -205 -553
-668 2,515 1.847
1991
-136 422 286
-100 -632 -732
-204 -126 -330
-59 -691 -750
-187 -266 -453
-1159 -1.780 -2,939
1992
647 -274 373
-12 -84 -96
-415 -84
-499
-29 -11 -40
-392 -274 -666
-857 -1.245 -2.102
1993
-297 56
-241
-67 -224 -291
-231 -206 -437
-90 -261 -351
-339 -154 -493
-2.479 -580
-3.059
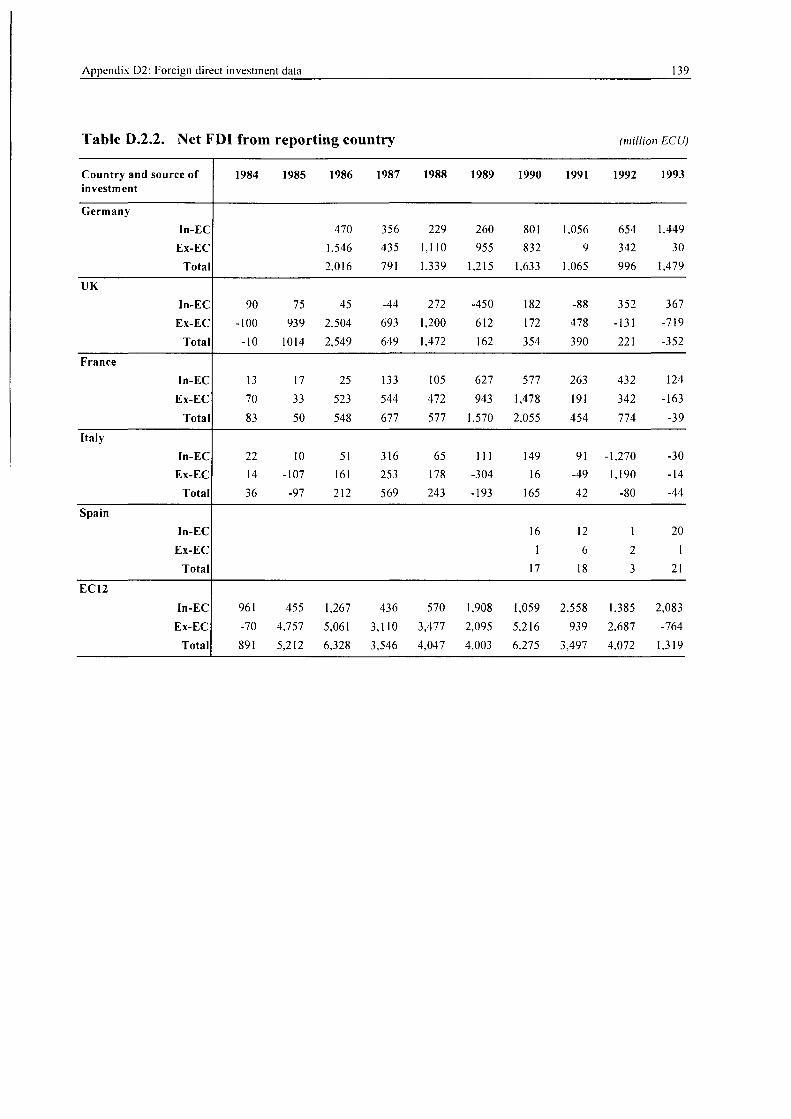
Appendix D2: Foreign direct investment data 139
Table D.2.2. Net FDI from reporting country (million ECU)
Country and investment
Germany
UK
France
Italy
Spain
EC12
source of
In-EC Ex-EC
Total
In-EC Ex-EC
Total
In-EC Ex-EC
Total
In-EC Ex-EC
Total
In-EC Ex-EC
Total
In-EC Ex-EC
Total
1984
90 -100 -10
13 70 83
22 14 36
961 -70 891
1985
75 939
1014
17 33 50
10 -107 -97
455 4,757 5,212
1986
470 1.546 2.016
45 2.504 2,549
25 523 548
51 161 212
1,267 5,061 6,328
1987
356 435 791
-44 693 649
133 544 677
316 253 569
436 3,110 3,546
1988
229 1,110 1,339
272 1,200 1,472
105 472 577
65 178 243
570 3,477 4,047
1989
260 955
1,215
-450 612 162
627 943
1,570
111 -304 -193
1,908 2,095 4,003
1990
801 832
1.633
182 172 354
577 1,478 2.055
149 16
165
16 1
17
1,059 5,216 6,275
1991
1,056 9
1.065
-88 478 390
263 191 454
91 -49 42
12 6
18
2.558 939
3,497
1992
654 342 996
352 -131 221
432 342 774
-1.270 1,190
-80
1 2 3
1,385 2,687 4,072
1993
1.449 30
1,479
367 -719 -352
124 -163
-39
-30 -14 -44
20 1
21
2,083 -764
1,319

140 Chemicals
APPENDIX E
Regression results, analysis and data
E.l. Background to the regression analysis
Regression is a statistical tool for examining how one variable is related to other variables. Regression analysis has been applied to discover if the single market programme (SMP) has had a significant effect on: (i) intra-EC exports as a share of total EC exports for the EC as a whole and by sector; (ii) the intra-EC imports to consumption ratio and total EC imports to consumption ratio for the EC as a whole and by sector (the ratio is referred to as import penetration); and (iii) the share of intra-EC mergers and acquisitions (M&As).
The data used for the regressions are shown in Tables E.5 and E.6 in the case of export shares and M&As (at the end of this Appendix) and Appendix C in the case of import penetration. Section E.4 of this Appendix provides an explanation of the regression nomenclature used in the analysis and to be found in the regression output. Finally, Section E.5 of this Appendix provides the regression output for the equations reported in the Appendix.
E.2. General specification of the explanatory variables used in the export share and import penetration models
(a) Exchange rate variables included on the right-hand side (RHS) of the export regressions are believed to affect the dependent variables due to the potential competitive impact for the exports of a country with a weak/devalued currency. In the case of exports, a weak dollar (or Yen) would make it more difficult for EC exporters to sell in international markets. Therefore, in theory, the share of intra-EC to total EC exports should rise. The expected effect of a weak dollar (or Yen) would be reversed in the case of intra-EC import penetration. The exchange rates have been reported in the regression results as ECU/Dollar in the case of the number of ECU per one dollar and ECU/Yen in the case of the number of ECU per one Yen.
(b) Gross domestic product (GDP) for the EC, the USA, South-East Asia and Japan has been included on the RHS of the regressions. In the case of exports, positive EC GDP growth is believed to lead to a rise in intra-EC exports (and imports), whereas the inverse relationship holds for a positive growth in non-EC GDP growth (for exports). The GDPs used in the regressions have been abbreviated to EC GDP in the case of total EC GDP, VS GDP in the case of GDP for the USA, Japan GDP in the case of Japanese GDP and SE Asia GDP in the case of GDP for South-East Asia.
(c) Dummy variables have been used in order to examine the impact of the single market programme. Dummy variables are used for handling data in different categories. For example, the periods 1980 to 1989 and 1990 to 1992 can be associated with the numbers 0 and 1 respectively, where a structural change between the periods, i.e. a unit change in the 0-1 dummy, is assumed to cause a change in the dependent variable equal on average to the value of the dummy coefficient. Since implementation of the SMP began before 1992, we used a constant shift dummy for the 1990 to 1992 period. The dummy variables have been denoted as SMP impact.

Appendix E: Regression results, analysis and data 141
(d) Use of natural logarithms for the explanatory variables. From a statistical point of view use of natural logarithms is more plausible where the dependent variables are percentages.
E.3. Specification for the share of intra-EC exports to total EC exports
The coefficients and associated t-statistics for the best performing intra-EC export share regression is provided in Table E. 1,34 The results also include a series of statistics which are reported, for the best equation, in the regression output in Section E.5 of this Appendix.
Table E.l. Model specification for intra-EC exports/equations and regression results, 1980-92
Variable
Constant
ECU/Dollar
EC GDP
SMP impact (Dummy = 1, 1990-92) R-squared adjusted Durbin-Watson S.E of regression Mean of dependent variable
Equation (t-statistics in parentheses)
-0.4100 (-2.3761) -0.0233
(-1.6834) 0.2092
(5.7868) 0.0048
(0.5816) 0.9298 1.7536 0.0078
0.5593
From the above results, the exchange rate only seems to have a marginally significant impact on the intra-EC export share.
The coefficient of EC GDP suggests that an increase in this variable (whilst holding the remaining variables constant) would be accompanied by an increase in the intra-EC to total export share. The statistical significance of the dummy SMP impact does not allow any reliable quantitative assessment of the impact of the SMP on the intra-EC export share.
E.3.1. Specification for the share of intra-EC exports to total EC exports by sector
The share of intra-EC exports to total EC exports were also analysed for five sectors of the chemicals industry: (i) basic industrial chemicals; (ii) agrochemicals; (iii) synthetic fibres; (iv) paints, varnishes and printing inks; and (v) speciality and other chemicals. The intra-EC export share in these sectors was regressed against the same series of variables used in the aggregate EC regression. The results are reported in Table E.2.
34 We experimented with a range of possible functional forms and RHS variables as indicated in Section E.2 of this appendix: the overall performance of these equations in terms of stability of coefficients and statistical robustness was rather poor and we therefore do not report them here.

142 Chemicals
Table E.2. Model specification/equations and regression results, 1980-92
Variable
Constant
ECU/Dollar
EC GDP
US GDP
IMP Impact (Dummy = 1, 1990-92) R-squared adjusted Durbin-Watson S.E of regression Mean of dep. var.
Sectoral equations (t-statistics in parentheses)
Basic industrial chemicals
-0.4200 (-1.8544) -0.0246
(-1.3541) 0.2107
(4.4399)
0.0017 (0.1559) 0.8782 1.7274 0.0103 0.5543
Agrochemicals
-0.3530 (-2.5389) -0.0248
(-2.2220) 0.1934
(6.6380)
0.0028 (0.4244) 0.9449 1.5947 0.0063 0.5395
Speciality & other
chemicals
0.4434 (3.7300) -0.0187
(-2.6720) 0.2214
(2.4548) -0.1848
(-2.6445) 0.0328
(6.1900) 0.9819 2.4913 0.0035 0.6048
Paints, varnishes & printing inks
-1.0399 (-7.2036) -0.0499
Ht.3134) 0.3473
(11.4819)
-0.0182 (-2.6232)
0.9725 2.0547 0.0065 0.5524
Synthetic fibres
-1.6528 (-4.0217)
0.4792 (5.4747)
0.0229 (1.1563) 0.9085 1.8126 0.0193 0.6211
For each of the sectoral models we find that EC GDP is a significant variable amongst the series of variables originally specified. Further, the dummy variables are positive and statistically significant only in the speciality and other chemicals (SOC) sector. The coefficient is also positive for basic industrial chemicals, agrochemicals and synthetic fibres but in all these sectors it is statistically insignificant. With the exception of the SOC sector therefore, where the SMP is estimated to have led to a 3.2% increase in the intra-EC export share, it is not possible to make any quantitative assessment of the impact of the SMP based on the regression results.
E.3.2. Specification for intra-EC import penetration and total EC import penetration
Intra-EC import penetration and total EC import penetration were regressed against the same series of variables used in the export share regressions. The rationale underlying the regressions is provided in the main text. The coefficients and associated t-statistics for the best regression equations are provided in Table E.3.

Appendix E: Regression results, analysis and data 143
Table E.3. Model specification/equations for intra-EC and total EC import penetration and regression results, 1980-92
Variable
ECU/Yen
EC GDP
US GDP
SMP impact (1990 to 1992) R-squared adjusted Durbin-Watson S.E of regression Mean of dependent variable
Equation (t-statistics in parentheses)
Intra-EC penetration
-0.0004 (-1.8505) 0.5875
(1.6102) -0.1853
(-0.5631) 0.0379
(1.6076) 0.9461 1.4390 0.0156 0.4600
Total EC penetration
-0.0006 (-2.1588)
0.8918 (1.8636) -0.3002
(-0.6954) 0.0519
(1.6767) 0.9563 1.4427 0.0205 0.6524
The above equations suggest that EC GDP and the ECU/Yen exchange rate have a significant impact on both intra-EC import penetration and total EC penetration. Note that the ECU/Yen negative coefficient in the intra-EC import penetration regression is rather implausible although only marginally significant. Further, the impact of the SMP was found to be consistent for the 1990 to 1992 period in both equations, having tested the models with dummy variables for alternative time periods (as in Section E.3). Japan GDP, South-East Asia GDP and the ECU/$ exchange rates do not have seem to have a significant impact in the models.
The marginal statistical significance of the dummy SMP impact variable in both models suggests that the results must be interpreted cautiously. The positive coefficient, however, supports the hypothesis that the single market programme has encouraged a growth in intra-EC import penetration and total EC import penetration. The quantitative estimate is that the SMP has added an extra 3.8 percentage points in intra-EC import penetration and 5.2 points in total import penetration. Intra-EC penetration has grown from around 47% in 1987 to 58% in 1992, so the SMP is estimated to have accounted for more than one-third of the increase. Total import penetration has grown from 66% to 83%, so the SMP is estimated to be responsible for 30% of the increase.
E.3.3. Specification for the share of intra-EC penetration and total EC penetration by sector
Penetration for the whole EC and intra-EC was considered by sector within the chemicals industry. The non-availability of consumption data meant that three of the sectors -agrochemicals, synthetic fibres, speciality and other chemicals - could not be examined. Thus, intra-EC import penetration and total EC import penetration for the basic industrial chemicals sector and the paints, varnishes and printing inks sector were regressed against the same series of variables used in the aggregate EC penetration regressions, i.e. GDP for the EC, the USA, Japan and South-East Asia, the ECU/$ and ECU/Yen exchange rates for the period 1982 to 1992 and a dummy variable which isolates the effects of various periods.
A number of models were specified for each of the sectors; the coefficients and associated t-statistics for the best equations are provided in Table E.4.

144 Chemicals
Table E.4. Model specification/equations for intra-EC and total imports penetration by sector and regression results, 1980-92
Variable
ECU/Yen
EC GDP
US GDP
SMP impact (1990 to 1992) R-squared adjusted Durbin-Watson S.E of regression Mean of dependent variable
Sectoral equations (t-statistics in parenthesis)
Basic industrial chemicals
Intra-EC penetration -0.0002
(-1.5788) 0.4657
(1.9346) -0.1084
(-0.4992) 0.0197
(1.2691) 0.9578 1.7019 0.0103 0.3532
Total EC penetration -0.0003
(-1.7325) 0.6924
(2.1517) -0.1580
(-0.5445) 0.0294
(1.4136) 09659 1.6766 0.0138 0.5016
Paints, varnishes & printing inks
Intra-EC penetration -0.0007
(-2.8499) 0.1129
(0.2663) -0.0756
(-0.1977) 0.02809 (1.0257) 0.8267 3.1426 0.0182 0.4786
Total EC penetration -0.0017
(-4.1859) 0.5809
(0.8413) -0.7602
(-1.2206) 0.0443
(0.9924) 0.8140 3.0320 0.0296 0.7670
For each of the sectoral models, we obtain the same specification. The overall diagnostics for basic industrial chemicals (t-Stats, R-square, DW) suggest that these are significantly better specifications than the equations for paints, varnishes and inks.
The SMP impact variable is statistically insignificant in all these models. The positive coefficient in the models supports, however, the hypothesis that the SMP has encouraged a growth in the ratio of intra-EC imports to consumption and total EC imports to consumption. It is not possible, however, again to make a reliable quantitative assessment based on these regression results.
E.3.4. Specification for mergers and acquisitions
The number of intra-EC mergers and acquisitions (M&As) as a percentage of the total number of M&As within the chemicals industry was regressed against a series of variables for the period 1985 to 1994 to discover which ones have a (statistically) significant impact on the dependent variable. As well as using GDP for the EC, the USA, Japan and South-East Asia as explanatory variables, a series of dummy structural break variables were tested.
The structural break variable was introduced as a two- and three-year rolling dummy variable. For example, in the case of the two-year rolling dummy, the structural break was considered for the periods 1987-88, 1988-89, 1989-90 ... 1994-95. A similar framework was used in the case of the three-year rolling dummy. Having analysed the regression output, the output below indicates the best model found in terms of significance of the coefficient t-statistics and the R-squared adjusted measure for goodness of fit.

Appendix E: Regression results, analysis and data 145
Best fitting M&As model (structural break dummy from 1992-94)
LS // Dependent variable is Sample: 1985 1994 Included observations: 10
Variable
C LIECGDP LIASGDP Break dummy
R-squared Adjusted R-squared S.E. of regression Sum squared resid Log likelihood Durbin-Watson stat
Note: Variables prefixed w
MAS_PERC
Coefficient
-422.4195 141.1361 -46.35787
5.369434
0.764041 0.646062 1.655637
16.44681 -16.67712
2.257682
Std. error
171.8163 58.10783 21.32765
2.100772
Mean dependent var S.D. dependent var Akaike info criterion Schwartz criterion F-statistic Prob(F-statistic)
t-statistic
-2.458554 2.428865
-2.173604 2.555934
16.96730 2.782926 1.297546 1.418580 6.476064 0.026062
Prob.
0.0492 0.0512 0.0727 0.0431
ith 'L' indicates that the natural log of the data has been used. Variables prefixed with Τ indicates that real indexed values for the data has been used in the regression.
The coefficients of EC GDP, and South-East Asian GDP in the above model suggest, as expected, that an increase in any one of these variables (whilst holding the remaining variables constant) would be accompanied by an increase in the intra-EC to total M&A share in the case of EC GDP and a decrease in the case of SE Asian GDP. Quantitatively, the structural break dummy is significant and is estimated to have led to a 5.4% increase of the intra-EC M&A share.
E.4. Description of the regression terminology
Regression coefficients - Each regression coefficient multiplies the corresponding variable in forming the best prediction of the dependent variable. The coefficient measures the impact of the independent variable on the dependent variable. The coefficient of the series, called C, is the constant or intercept in the regression. It is the base level of the prediction when all of the other independent variables are zero. The other coefficients are interpreted as the slope of the relation between the corresponding independent variable and the dependent variable.
Standard errors - The standard errors measure the statistical reliability of the regression coefficients. The larger the standard error, the more statistical noise affects the coefficient. According to regression theory, there are about 2 chances in 3 that the true regression coefficient lies within one standard error of the reported coefficient, and 95 chances out of 100 that it lies within two standard errors.
t-statistic - is a test statistic for the hypothesis that a coefficient has a particular value. The t-statistic to test if a coefficient is zero (that is, if the variable does not belong in the regression) is the ratio of the coefficient to its standard error. If the t-statistic exceeds one in magnitude it is at least two-thirds likely that the true value of the coefficient is not zero, and if the t-statistic exceeds two in magnitude it is at least 95% likely that the coefficient is not zero.
Probability - The probability associated with a t-statistic is the probability of drawing a t-statistic ofthat magnitude from a t-distribution. With this information, you can tell at a glance

146 Chemicals
if you reject or accept the hypothesis that the true coefficient is zero. Normally, a probability lower than 0.05 is taken as strong evidence of rejection ofthat hypothesis.
R-squared - This measures the success of the regression in predicting the variability of the dependent variable within the sample. R-squared is one if the regression fits perfectly, and zero if the independent variables do not explain any of the variability of the dependent variable. R-squared is the fraction of the variance of the dependent variable explained by the independent variables.
R-squared adjusted for degrees of freedom - is to take into account the fact that the simple R-squared will increase with the number of independent variables included. It is less than R-squared (provided there is more than one independent variable) and can be negative.
Standard error of the regression - This is a summary measure of the size of the prediction errors where the smaller the value, the better. It has the same units as the dependent variable. About two-thirds of the actual values of the dependent variable will lie in a range from minus one standard error to plus one standard error from the predicted values of the standard error, and 95% of the actual values will lie in a range from minus two to plus two standard errors.
Sum of squared residuals to certain types of tests.
is just what it says. You may want to use this number as an input
E.5. Regression output for the best specifications
The regression output for each of the specifications reported within the general categories of export share and import penetration is provided below. The regression output is supported with variable definitions.
E.5.1. Intra-EC exports to total EC exports
Intra-EC export s to total EC export
LS // Dependent variable is INT TOT X Sample: 1980 1992 Included observations: 13
Variable coefficient
C LIECGDP ECU $ DUM4
R-squared Adjusted R-squared S.E. of regression Sum squared resid Log likelihood Durbin-Watson stat
-0.409971 0.209181
-0.023272 0.004814
0.929892 0.906523 0.007873 0.000558
46.92023 1.753616
s for the EC as a whole
Std. error
0.172542 0.036148 0.013824 0.008278
t-statistic
-2.376060 5.786782
-1.683423 0.581627
Mean dependent var S.D. dependent var Akaike info criterion Schwartz criterion F-statistic Prob(F-statistic)
Prob.
0.0415 0.0003 0.1266 0.5751
0.559289 0.025750
-9.440989 -9.267158 39.79110
0.000016
Variable definitions: INT_TOT_X: Dependent variable; C: Constant; LIECGDP: Natural logarithm of an index of EC GDP/capita, 1980=100; ECU_$: Exchange rate giving the number of ECU per unit of US dollar; DUM4: Dummy variable, active for the 1990-92 period.

Appendix E: Regression results, analysis and data 147
Basic industrial chemicals sector LS // Dependent variable is BASIC Sample: 1980 1992 Included observations: 13
X
Variable coefficient
C LIECGDP ECU $ DUM4
R-squared Adjusted R-squared S.E. of regression Sum squared resid Log likelihood Durbin-Waïson stat
-0.419979 0.210662
-0.024572 0.001694
0.878191 0.837589 0.010334 0.000961
43.38430 1.727361
Std. error
0.226476 0.047447 0.018146 0.010865
t-statistic
-1.854411 4.439915
-1.354136 0.155939
Mean dependent var S.D. dependent var Akaike info criterion Schwartz criterion F-statistic Prob(F-statistic)
Prob.
0.0967 0.0016 0.2087 0.8795
0.554334 0.025642
-8.897000 -8.723170 21.62880
0.000189
Variable definitions: BASIC_X: Dependent variable; C: Constant; LIECGDP: Natural logarithm of an index of EC GDP/capita, 1980=100; ECU_$: Exchange rate giving the number of ECU per unit of US dollar; DUM4: Dummy variable, active for the 1990-92 period.
Agrochemicals sector
LS // Dependent variable is AGRO Sample: 1980 1992 Included observations: 13
X
Variable coefficient
C LIECGDP ECU $ DUM4
R-squared Adjusted R-squared S.E. of regression Sum squared resid Log likelihood Durbin-Watson stat
-0.352994 0.193355
-0.024753 0.002831
0.944940 0.926586 0.006344 0.000362
49.72700 1.594709
Std. error
0.139037 0.029129 0.011140 0.006670
t-statistic
-2.538853 6.637987
-2.222005 0.424416
Mean dependent var S.D. dependent var Akaike info criterion Schwartz criterion F-statistic Prob(F-statistic)
Prob.
0.0318 0.0001 0.0534 0.6812
0.539476 0.023414
-9.872800 -9.698969 51.48555 0.000005
Variable definitions: AGRO_X: Dependent variable; C: Constant; LIECGDP: Natural logarithm of an index of EC GDP/capita, 1980=100; ECU_$: Exchange rate giving the number of ECU per unit of US dollar; DUM4: Dummy variable, active for the 1990-92 period.

148 Chemicals
Speciality and other chemicals sector
LS // Dependent variable is SPECIAL Χ Sample: 1980 1992 Included observations: 13
Variable coefficient
C LIECGDP LIUSGDP ECU $ DUM4
R-squared Adjusted R-squared S.E. of regression Sum squared resid Log likelihood Durbin-Watson stat
0.443447 0.221431
-0.184821 -0.018665 0.032783
0.981926 0.972890 0.003489 9.74E-05
58.26498 2.491284
Std. error
0.118887 0.090204 0.069889 0.006986 0.005296
t-statistic
3.729991 2.454798
-2.644484 -2.671903 6.189885
Mean dependent var S.D. dependent var Akaike info criterion Schwartz criterion F-statistic Prob(F-statistic)
Prob.
0.0058 0.0396 0.0295 0.0283 0.0003
0.604819 0.021191
-11.03249 -10.81520 108.6587
0.000001
Variable definitions: SPECIAL_X: Dependent variable; C: Constant; LIECGDP: Natural logarithm of an index of EC GDP/capita, 1980=100; LIUSGDP: Natural logarithm of an index of US GDP/capita, 1980=100; ECU_$: Exchange rate giving the number of ECU per unit of US dollar; DUM4: Dummy variable, active for the 1990-92 period.
Paints, varnishes and printing inks sector
LS // Dependent variable is PAINT Sample: 1980 1992 Included observations: 13
Χ
Variable coefficient
C LIECGDP ECU $ DUM4
R-squared Adjusted R-squared S.E. of regression Sum squared resid Log likelihood Durbin-Watson stat
-1.039970 0.347274
-0.049893 -0.018168
0.972510 0.963347 0.006587 0.000391
49.23790 2.054744
Std. error
0.144367 0.030245 0.011567 0.006926
t-statistic
-7.203640 11.48191 -4.313400 -2.623228
Mean dependent var S.D. dependent var Akaike info criterion Schwartz criterion F-statistic Prob(F-statistic)
Prob.
0.0001 0.0000 0.0020 0.0277
0.552408 0.034408
-9.797553 -9.623723
106.1314 0.000000
Variable definitions: PAINT_X: Dependent variable; C: Constant; LIECGDP: Natural logarithm of an index of EC GDP/capita, 1980=100; ECU_$: Exchange rate giving the number of ECU per unit of US dollar; DUM4: Dummy variable, active for the 1990-92 period.

Appendix E: Regression results, analysis and data 149
Synthetic fibres sector
LS // Dependent variable is SYNTH Χ Sample: 1980 1992 Included observations.' 13
Variable coefficient
C -1.652795 LIECGDP 0.479207 DUM4 0.022904
R-squared 0.908515 Adjusted R-squared 0.890218 S.E. of regression 0.019335 Sum squared resid 0.003739 Log likelihood 34.55476 Durbin-Watson stat 1.812622
Std. error
0.410970 0.087540 0.019808
t-statistic
-4.021689 5.474157 1.156290
Mean dependent var S.D. dependent var Akaike info criterion Schwartz criterion F-statistic Prob(F-statistic)
Prob.
0.0024 0.0003 0.2744
0.621131 0.058356
-7.692456 -7.562083 49.65370
0.000006
Variable definitions: SYNTH_X: Dependent variable; C: Constant; LIECGDP: Natural logarithm of an index of EC GDP/capita, 1980=100; DUM4: Dummy variable, active for the 1990—92 period.
E.5.2 Import penetration
Since the specification for each import penetration regression is the same, the variable definitions are presented first, as follows:
Variable definitions: IMP_CONS, IMPE_CONS, BAS_PENT, BAS_TPENT, PTS_PENT, PTSJTPENT: Dependent variables; C: Constant; LIECGDP: Natural logarithm of an index of EC GDP/capita, 1980=100; LIUSGDP: Natural logarithm of an index of US GDP/capita, 1980=100; ECU_YEN: Exchange rate giving the number of ECU per unit of Japanese Yen; DUM4: Dummy variable, active for the 1990-92 period.

150 Chemicals
Intra-EC import penetration
LS // Dependent variable is IMP CONS Date: 04/07/94 Time: Sample: 1980 1992 Included observations:
14:00
13
Variable coefficient
C LIECGDP LIUSGDP ECU YEN DUM4
R-squared Adjusted R-squared S.E. of regression Sum squared resid Log likelihood Durbin-Watson stat
-1.374831 0.587450
-0.185307 -0.000390 0.037900
0.964096 0.946144 0.015638 0.001956
38.76415 1.438976
Std. error
0.622055 0.364826 0.329062 0.000211 0.023576
t-statistic
-2.210143 1.610216
-0.563138 -1.850551 1.607595
Mean dependent var S.D. dependent var Akaike info criterion Schwartz criterion F-statistic Prob(F-statistic)
Prob.
0.0581 0.1460 0.5888 0.1014 0.1466
0.459976 0.067386
-8.032362 -7.815074 53.70446 0.000008
Total EC import penetration
LS // Dependent variable is IMPE Date: 04/07/94 Time: Sample: 1980 1992 Included observations:
15:01
13
CONS
Variable coefficient
C LIECGDP LIUSGDP ECU YEN DUM4
R-squared Adjusted R-squared S.E. of regression Sum squared resid Log likelihood Durbin-Watson stat
-2.041532 0.891833
-0.300162 -0.000597 0.051852
0.970867 0.956301 0.020513 0.003366
35.23677 1.442740
Std. error
0.815960 0.478549 0.431636 0.000277 0.030924
t-statistic
-2.501998 1.863619
-0.695405 -2.158783 1.676733
Mean dependent var S.D. dependent var Akaike info criterion Schwartz criterion F-statistic Prob(F-statistic)
Prob.
0.0368 0.0994 0.5065 0.0629 0.1321
0.652381 0.098127
-7.489688 -7.272400 66.65074
0.000004

Appendix E: Regression results, analysis and data 151
Intra-EC import penetration for the basic industrial chemicals sector
LS // Dependent variable is BAS Date: 04/09/96 Time Sample: 1980 1992 Included observations:
17:01
13
3ENT
Variable coefficient
C LIECGDP LIUSGDP ECU YEN DUM4
R-squared Adjusted R-squared S.E. of regression Sum squared resid Log likelihood Durbin-Watson stat
-1.299158 0.465695
-0.108376 -0.000220 0.019741
0.971895 0.957842 0.010318 0.000852
44.16977 1.701948
Std. error
0.410433 0.240713 0.217116 0.000139 0.015555
t-statistic
-3.165336 1.934649
-0.499164 -1.578838 1.269097
Mean dependent var S.D. dependent var Akaike info criterion Schwartz criterion F-statistic Prob(F-statistic)
Prob.
0.0133 0.0891 0.6311 0.1530 0.2401
0.353199 0.050253
-8.863995 -8.646707 69.16157 0.000003
Total EC import penetration for the basic industrial chemicals sector
LS // Dependent variable is BAS TPENT Date: 04/10/96 Time Sample: 1980 1992 Included observations:
Variable
C LIECGDP LIUSGDP ECU YEN DUM4
R-squared Adjusted R-squared S.E. of regression Sum squared resid Log likelihood Durbin-Watson stat
10:40
13
Coefficient
-1.970720 0.692405
-0.158037 -0.000322 0.029394
0.977264 0.965895 0.013793 0.001522
40.39595 1.676563
Std. error
0.548675 0.321790 0.290245 0.000186 0.020794
t-statistic
-3.591779 2.151730
-0.544495 -1.732519 1.413545
Mean dependent var S.D. dependent var Akaike info criterion Schwartz criterion F-statistic Prob(F-statistic)
Prob.
0.0071 0.0636 0.6009 0.1214 0.1952
0.501602 0.074690
-8.283407 -8.066119 85.96434 0.000001

152 Chemicals
Intra-EC import penetration for the paints, varnishes and printing inks sector
LS // Dependent variable is PTS PENT Date: 04/09/96 Time: Sample: 1980 1992 Included observations:
17:05
13
Variable Coefficient
C LIECGDP LIUSGDP ECU YEN DUM4
R-squared Adjusted R-squared S.E. of regression Sum squared resid Log likelihood Durbin-Watson stat
0.432236 0.112902
-0.075605 -0.000698 0.028096
0.884438 0.826657 0.018170 0.002641
36.81350 3.142636
Std. Error
0.722762 0.423889 0.382335 0.000245 0.027392
t-Statistic
0.598035 0.266348
-0.197745 -2.849879 1.025695
Mean dependent var S.D. dependent var Akaike info criterion Schwartz criterion F-statistic Prob(F-statistic)
Prob.
0.5664 0.7967 0.8482 0.0215 0.3350
0.478614 0.043641
-7.732261 -7.514973 15.30668 0.000809
Total EC import penetration for the paints, varnishes and printing inks sector
LS // Dependent variable is PTS TPENT Date: 04/10/96 Time: Sample: 1980 1992 Included observations:
10:41
13
Variable coefficient
C LIECGDP LIUSGDP ECU YEN DUM4
R-squared Adjusted R-squared S.E. of regression Sum squared resid Log likelihood Durbin-Watson stat
1.937857 0.580932
-0.760178 -0.001670 0.044283
0.876030 0.814045 0.029598 0.007008
30.47027 3.032028
Std. error
1.177348 0.690498 0.622807 0.000399 0.044621
t-statistic
1.645951 0.841323
-1.220567 -4.185850 0.992421
Mean dependent var S.D. dependent var Akaike info criterion Schwartz criterion F-statistic Prob(F-statistic)
Prob.
0.1384 0.4246 0.2570 0.0031 0.3501
0.766993 0.068637
-6.756380 -6.539092 14.13293 0.001064

Table E.5 Export share data
Year
1979
1980
1981
1982
1983 1984
1985
1986 1987 1988 1989
1990 1991
1992
Intra-EC X /
Total X (%)
53.5 52.9
55.1
53.9
53.3 53.6
54.8 55.8
57.6 58.2 59.9 59.1 59.4
Nominal FX rates
ECU/S
0.72
0.898
1.024
1.125
1.272 1.322
1.019 0.867 0.846 0.908
0.788 0.809 0.773
ECU / Yen
0.0032
0.0041
0.0041
0.0047 0.0054
0.0055 0.0060
0.0060 0.0066 0.0066 0.0054
0.0060
0.0061
Real GDP growth rate (%)
EC
1.3
0.1
0.8
1.6
2.3
2.5 2.9
2.9 4.2 3.5 3.0
1.7 1.1
US
-0.5
1.8
-2.2
3.9
6.2 3.2
2.9
3.1 3.9
2.5 1.2
-0.6 2.3
Japan
3.6
3.6
3.2
2.7
4.3
5.0 2.6 4.1 6.2 4.7 4.8
4.3 1.1
Asia
8.4
8.4
8.4
8.4
8.4 4.4
11.0 12.3 9.8 6.2
7.0
7.3 5.4
Real GDP index (1979=100)
EC
100
101.3
101.4
102.2
103.8 106.2 108.9
112.1 115.3
120.1 124.3
128.1 130.3
131.7
US
100
99.5
101.3
99.1
102.9
109.3
112.8 116.1 119.7 124.3 127.5 129.0
128.2 131.2
Japan
100
103.6
107.3
110.8 113.8
118.6 124.6 127.8 133.1
141.3 147.9 155.1 161.7
163.5
Asia
100 108.4
117.5 127.4
138.1
149.7
156.3 173.4
194.8 213.9 227.1 243.0
260.8 274.9
Natural log real GDP index (197«=100)
EC
4.69
4.77
4.85
4.93 5.01
5.05 5.16
5.27 5.37 5.43 5.49
5.56 5.62
US
4.62
4.62
4.63
4.64
4.67 4.69 4.72 4.75 4.79 4.82
4.85 4.87
4.88
Japan
4.64
4.68
4.71
4.73 4.78 4.82
4.85 4.89
4.95 5.00 5.04 5.09
5.10
Asia
4.60
4.62
4.60
4.63 4.69
4.73 4.75 4.78 4.82
4.85 4.86
4.85 4.88
SMP impact dummy
0
0
0
0
0 0
0
Turnover
(million ECU)
96.851.3
108.937.8
114.695.4
126.123.8
148.353.4 157.214.5 138.107.4 141.716.6 155.670.9
169.125.6 162.097.8 155.920.3
150.828.3
> -o -α
c
Table E.6. M&As data Year
1984
1985 1986
1987
1988
1989
1990 1991
1992
1993 1994
Number of intra-EU M&As
44
40
51 48
72
94
57
67 49
58
Share of intra-EU M&As %
16.3 13.1
13.9
15.6
17.3 19.2
15.1
21.0
17.0
21.0
Real GDP growth rate (%)
EC
2.5% 2.9%
2.9% 4.2% 3.5% 3.0%
1.7% 1.1%
-0.3% 2.5%
US
3.2% 2.9% 3.1% 3.9% 2.5% 1.2%
-0.6% 2.3% 3.1% 4.1%
SE Asia
4.4% 11.0% 12.3%
9.8% 6.2% 7.0%
7.3% 5.4% 6.0% 6.2%
Real GDP (1984=100)
EC
100
102.5 105.5
108.5
113.1
117.0
120.6
122.6
124.0
123.6
126.7
US
100 103.2
106.2
109.5
113.8
116.6
118.0
117.3
120.0
123.7
128.8
SE Asia
100 104.4
115.9 130.1
142.9
151.8 162.4
174.2
183.6
194.7
206.7
Natural log rea
EC
4.63 4.66
4.69
4.73 4.76
4.79
4.81 4.82
4.82
4.84
US
4.64
4.67
4.70
4.73
4.76 4.77
4.76 4.79
4.82
4.86
EU
SE Asia
4.65
4.75 4.87
4.96
5.02
5.09
5.16
5.21
5.27
5.33
SMP impact dummy
0
0 0
0
0
0
1 1
1 1

APPENDIX F
Postal questionnaire and face-to-face interview responses (377 postal and 60 f ace-to-face responses)

Figure F.l.
Postal questionnaire sector responses
Has your sourcing from within the EC changed as a result of the SMP?
> -o T3
80%
70%
50%
40%
30%
20%
10%
Average Petrochemicals Inorganic
( Í T ¡ · î
tel
Dyes &
Pigments
m
WÌ
Plastics
m
- <■■ I
Fibres
FI §■■:
Agrochemicals Paints &
varnishes
Other
I Increased I Decreased D No change

Figure F.2.
Postai questionnaire country responses Has your sourcing from within the EC changed as a result of the SMP?
Greece Denmark The France
Netherlands
Ireland Belgium
I Increased I Decreased Q No change

Figure F.3.
Facetoface interview responses
Have any changes occurred in your patterns of sourcing from
EC countries during the last ten years?
Capital and finance
Administration
Transport
Packaging
Equipment
Production
Labour
Raw materials
säjsgsaiääi ̂ ^^^Γ^^^Γ
RæsseaaessiBis«
IMSSiSeimS'MgKSMSEeeäM
¡asmsmimismssä
BmemímM^m^s^ematt-angmmm^
0% 10% 20% 30% 40% 50% 60% 70% 80%
H Increased I Stayed the same D Decreased

Figure F.4.
Face-to-face interview responses Has the internal market programme resulted in integration
either upstream or downstream within the EC?
Yes
n 3" re

Figure F.5.
Face-to-face interview responses What has been the development in productivity (measured as volume of output per employee) over the last ten years?
> "3
Decreased
Stayed the same
Increased
Increased significantly
0%

Figure F.6.
o
Face-to-face interview responses In your opinion, what has been the impact of the SMP on your company's productivity?
45%
40%
35%
30%
25%
20% '
15% ;
10% :
5% !
0% · Improved productivity significantly Improved productivity marginally Had no effect on productivity Had a negative effect on productivity
n

Figure F.7.
Facetoface interview responses
Has your employment level changed during the last five years?
> ■3
Increased a lot
9%
Reduced a lot
47%
Increased little
■ Wm
HliiMUsEfJßi
No change
13%
Reduced a little
18%

Figure F.8.
Face-to-face interview responses To what extent has the SMP influenced internal EC job mobility?
Negative effect!
No effect
Some effect
Significant effect]
0% 5% 10% 15% 20% 25% 30% 35% 40% 45% 50%
n

Figure F.9.
> -3
Face-to-face interview responses How has legislation regarding EU health & safety and
workers councils affected your organization?
60%
50%
40%
30%
20%
10%
0% Health & safety Workers councils
I Unfavourable effect I No effect D Favourable effect

Figure F. 10.
Face-to-face interview responses What constraints stop prices converging to a uniform price across the EC?
σ* *.
Local market conditions
Different market
requirements
Cost of distribution
Local paper work
I Strong effect I Some effect
Local or different
taxes
D No effect
Cultural differences
Language
o

Figure F. l l .
Face-to-face interview responses
Has the single market programme had an impact on
your environmental policies?
"3 O
Significant impact
23%
Some impact
33%
No impact
44%
■o o

166 Chemicals
APPENDIX G
Ethylene and propylene production capacity, by country and plant
Production capacity for ethylene and propylene from 1985 to 1995 by country and by plant is provided in Tables Gl and G2 respectively. For each plant, the tables also provide information on current ownership (including percentage of foreign ownership for each plant) and previous ownership.
The data within the tables was used in the calculation of: (i) ownership of capacity (domestic vs foreign) across time for each country; and (ii) average plant size per country. Before explaining how the ownership and average plant size figures were derived, the assumptions used in the calculations shall be explained. This is best illustrated with a key to the numbers within the table, some of which are marked according to the specific assumptions made.
Key to the assumptions:
Number displayed as:
underlined
italic
italic, bold
italic, bold and underlined
Example
2
2
2
2
Assumption
Planned capacity that has been included in the calculations
Planned capacity that has been omitted from the calculations
Production capacity (planned or actual) that has been modified to maintain consistent production across time
Actual production capacity that has been omitted from the calculations
Calculation of ownership of capacity (domestic vs foreign)
The ownership calculations were considered for the UK, France, Germany and Italy. For each of these countries and for each year, domestic and foreign ownership of capacity was calculated as a percentage share of total capacity. Ownership of a plant can be wholly owned by a domestic or foreign company. However, plants where ownership is shared by both domestic and foreign companies were obviously accounted for in the calculations. The ethylene and propylene tables provide a column - ownership (% of foreign) - which indicates the percentage of foreign ownership for each plant.
Calcination of average plant size
Average plant size was considered for the UK, France, Germany, Italy and the EC as a whole. The calculation for each country and for each year was made by summing the production capacity and dividing the total by the number of plants.

Table G.I. Ethylene production capacity by country and by plant > -a
Country
lid*! ι urn
Netherlands
UK
Spain
i'oillljjill
Halt
Gentium
Greece
France
O p e r a t o r
BASF
F inaBorealis
Esso Chemie
Statoil
Dow
DSM
Shell
Gulf Oil
DSM
ni' HP
ICI
ICI Petrochemicals & Plastics
Exxon
ΕΧΧΟΠ
Shell
Dow
Repsol Petroleo
Repsol Petróleo
Enpctrol
Industrias Químicas Asociadas
Repsol Ouimica
ERT
[lit realis
Brindisi Etilene
Enieliem Ame
Emclicm Ame
Emmont
Enichem Arne
Sisus
Rum lanca
1 linchem
HASE
DEA
DEA
EC Erdoele henne
tiC Erdock tienne
Esso Chemie
[[lieh
LeunaWerke
OM V
Rheinische Olefmwcrkc
Ruhr (iel
Ruhr Oei
Satelisi se he Olelin» erke
PC K AG
EKO
(heek I'c troc hem i ca la
1:.U'Antar
Entmonl
Copenor
C o n n o r GIF
Elf
SNiiA (Production)
Atochem
Atochem
Exxon
Naphtaehiinie
HP Chemicals
Shell
Owner»
P e t r o l i n a n i ) . [ìurcalis135%)
Exxon
State enlerpnse
Dow Chemical
Chevron
I C H 8 0 % ) , UP<20%)
ICI
Exxon ( 5 0 % ) . Shell (50Τβ)
I.a Seda de Barcelona
Neste ( 5 0 % ) . Statoil 150%)
ENI
ENI
ENI
S I R "
ENI
ENI
ENI
RWE AG
RWE: AG
B P ( 5 0 % ) ; Bayer < 50% >
Exxon
Veba
Trcidiandanstalt
O M V Vienna
BASK (50%) 'She l l (50%)
Veba t 50%t, PeL de Ven (5Q%)
Veba (50%). Pet. de Ven. (50%)
Treuhandansialt
Stale enterprise
EU' (57 .5%); Solvay (42 5%)
E N I ( 7 0 % ) . E I f ( 3 0 % )
CdF Chimie 6 0 %
ENI ( 7 0 % ) , Ell"(30%)
Elf
Elf
H P ( 5 0 % ) . E I f ( 5 0 % )
BP associate
Shell Chimie
Ownership
( V . o f r . r e i p n ,
100%
100%
100%
50%
5 0 %
100%
100%
50%
50%
50%
4 3 %
7 0 %
7 0 %
100%
50%
100%
100%
1985
550
60
MMN)
lM0
515
3(H)
450p
250
335
750
105
500
150
4(H)
265
445
375
40
■150p
330
:oo 500p
180
632
110
62
JOOp
460
85
480
500
820
450
50
90
280
120
400
200
373
300
15
644
300
505
320
110
75
140
385
300
120
350
1986
550
60
1001)
<M0
545
300
250
335
7511
105
500
150
400
265
445
375
40
330
200
350
180
632
110
62
460
85
480
500
820
450
50
90
280
120
400
200
373
300
15
644
300
505
320
110
75
140
385
300
120
350
1987
550
«0
1000
545
300
ISO
335
750
105
550
150
400
265
445
375
40
330
201)
350
180
632
110
62
4M)
85
480
500
S2ü
450
50
'XI
280
120
400
20U
373
300
15
644
300
505
320
110
75
140
385
300
120
350
1988
550
60
1000
940
545
300
25(1
.335
750
105
600
150
400
265
445
375
40
330
200
350
180
632
110
62
460
85
480
500
820
450
50
90
280
120
400
200
373
300
15
240p
644
300
505
320
110
75
140
385
300
120
350
Capacity <k tpa)
1989
550
60
UKW
'MO
545
300
270
335
750
105
700
150
400
265
445
375
40
330
200
350
180
720
110
62
460
85
480
500
820
450
50
90
280
120
440
200
373
300
200p
644
300
505
320
110
75
140
385
300
120
420
1991)
130
550
60
1000
'MO
600
300
540
335
775
105
650
150
400
265
445
375
40
330
250
420
240
720
MO
62
460
85
480
500
820
450
50
90
280
120
440
280
373
300
15
644
300
505
320
110
75
140
470
320
520
420
1991
1000
60
1100
600
300
27»
335
775
105
650
150
460
265
445
375
40
330
221 250
350
240
720
110
62
560
85
480
740
820
450
50
90
310
230
440
280
373
3(H)
15
644
300
505
320
HO
75
475
470
420
670
5(H)
420
1992
1000
60
1100
940
6(H)
3(H)
270
335
775
105
650
150
460
265
525p
375
40
330
250
350
240
720
110
62
560
85
480
740
R20
450
65
90
310
8(H)
KHO
280
373
3(H)
15
644
im 505
320
HO
75
475
470
420
670
5(H)
420
1993
10(H)
60
1000P
1100
im 6(H)
300
U»)
335
775
105
650
150
460
265
525
375
40
t>00
330
350
250
400
240
720
110
62
560
85
480
740
820
450
65
90
310
800
88(1
280
373
3(H)
15
644
300
505
320
110
75
475
470
420
670
500
420
1994
oOO
1000
60
1100
1025
6(H)
300
tAM
335
775
90
650
150
460
280
525
375
40
1000
330
360
250
500
240
720
110
62
560
85
480
740
820
450
65
90
310
800
880
280
373
3(H)
15
644
300
505
320
HO
75
475
475
420
670
500
420
1995
<M 1300
60
1100
1025
13.00
3(H)
t>00
830
90
900
150
460
280
525
375
40
330
4(H)
250
500
240
720
110
62
É 2 Í
85
480
740
R20
45Ü
65
90
m 800
880
280
4 9 1
300
15
644
300
505
320
110
75
475
475
420
700
5IH)
420
Previout ownership
Operated hv Petrochim until 1988 when FmaneMe formeel·. Borealis formed m 1994
Closed in 1994
ICI CAI ' ( 1989 > ; expansion to 900k tpa planned in 1997
Petrochemicals booster station
Plans to expand capacity shelved
Exxon Chemical (1989)
Known as EMI' until reorganization in 1987 : closed in 1992 for water storage
Known as EMP until reorganization in 1987
ERT associated w i lhRTZ . I'etromcd with Dow also cited in new 475k tpa plani
Plant leased from Companhia National de Peti oil ui mie a . transferred into Borealisjv in 1994
Molhballed one stream in 1993 due to Brindisi startup . EnimonI (1990) Montedison / Enichem j v
Output to he reduced on Brindisi startup . plant operated bv Montcdipe until 1991, Eninmnl (1990) "
Output lo he reduced on ¡inndisi startup . expansion to 4(M)k tpa cancelled
Plant temporarily closed in 1992 '.'
Formerly operated bv Deutsche Texaco until acquisition by RWE m 1988
Operated by Union Rheinische Braunkohlen Krallst o 11' until RWEDEA formed in 1988
No jv in 1989''
Huels : Vcba subsidiarv
Known as VEH LeunaWerke Waller Ulbricht unti! 1990
DeiiLsche Marathon (with US Steel associate) ( 1992)
URIJKU993)
I h i c b / V c b a i l W 9 i
I 'ctroliosde Venezuela; ownership transfer from Veba Oel to Ruhr Oel in 1986
Poss merger with Buna : BunaPolymer GmbH . Dow to take 8 0 % stake A expand to 498k tpa in 1997
Operated by Esso Pappas Chemicals until 1984
CFP Co Française des Pétroles 150%) , SNiΛ (50%)
Norsolar or Ork em ( 1990)
CdF Chimie EP lo 1988, then Norsulor until transfer of Orkan to Atochem in 1990
CFP Co Française des Pétroles ( 50%) ; SNEA (50%)
Ste Française Exxon Client (1989)
BPCInmie(1989)
Not t i
t i i 550 i2 l45 i ) l"6~'9l
1973
Verv doubtful
147t)
(1)400 (2 > 540 1972/79
1973
1974
New plant cancelled
1963
1972
1979
1981
1962
1985 , expansion delated
1980
1972
1977
1979
1976
New plant expansion delated
New plant cancelled
1981
1993
1970
1972
1970
1973
1<}72
Nrw plant impended
(1) 160(2)400 1966/81)
1973
1970
1979
1977
1968
1966
11)441) (21440 1973/92
1972
111325(2)48 1975/78
1976
New plant cancelled
( 1 ) 3 0 0 ( 2 ) 2 0 0 ( 3 ) 144
1973/76/76
( 1 ) 2 8 0 ( 2 ) 2 2 5 1980
1978
1976
1964
1974
1967
1975
1981
o c c

00
Table G.2. Propylene production capacity by country and by plant
Country
Belgium
Netherlands
UK
Spain
Portugal
Italy
Operator
BASF
Fina Raffinaderij
Antwerpen
FinaBorealis
North Sea Petrochemicals
Dow
DSM Polymers and
Hydrocarbons
Shell
Shell
Nerefco
BP
BP
ICI
Exxon
Exxon
Conoco
Conoco
Lindsey Oil Refinery
Shell
Dow
Repsol
Enpetrol
Enpetrol
Repsol
EMP
CEPSA
Ert oil
Petromed
Petronor
ERT
Borealis
Exxon
Brindisi Etilene
Enichem Anic
Enichem Anic
Enichem Anic
Enichem Anic
Praoil
Raffineria Mediterranea
Nuracfiem
Owners
Petrofi na
Petrofina (65%), Borealis
(35%)
Borealis (50%) ; Montell
(50%)
BP(65%) ; Texaco (35%)
ICI (80%), BP (20%)
Associate : Du Pont
Petrofina (50%) ; Total
(50%)
Repsol
CEPSA
BP (92 77%), Other
(7 23%)
Repsol (86.33%), Other
(13.67%)
Neste (50%). Statoil (50%)
Enichem
Enichem
Enichem
Enichem
Enichem
ENI
ENI
Foreign
ownership Uncliunorr.tcign)
1
1985
160
290
400
470
340 140
130
210
350
100
60
145
198
95
40
170
45
60
2¡0p
130
160
150
120
350
1986
160
290
400
470
340 140
130
210
350
100
60
145
198
95
40
170
60
130
160
150
120
350
1987
160
290
400
470
340 140
130
210
350
100
60
145
198
95
40
170
60
130
160
150
120
350
1988
160
290
400
470
340 140
130
210
350
100
-1200b
pà
60
145
198
95
40
170
60
130
160
150
120
350
100
1989
160
290
400
470
340 140
130
210
350
100
230
60
145
198
95
40
170
60
130
160
150
120
350
100
lapacit;
1990
160
290
400
470
340 140
130
210
350
100
230
60
145
198
95
40
170
100
60
130
200?
160
150
120
350
100
1991
160
485
400
400
470
340 140
130
210
350
100
230
60
145
198
95
40
170
100
60
130
160
150
120
350
100
1992
160
485
400
400
530
340 140
130
210
350
100
230
IM
145
198
95
40
200
100
100
130
160
150
120
350
100
1993
160
350
400
400
530
340 140
220
210
350
100
230
100
145
198
95
40
200
100
60
130
200
160
150
120
350
100
1994
400
160
485
400
550
S30
340 140
100
230
190
380
155
'155
"80 230
100
145
I9S
150
40
200
150
60
■11
2È
60
130
'170
200
180
250
120
360
SO
70
130
1995
400
170
485
400
550
530
340 140
230
-380
155
250d
230
100
145
198
150
40
200
150
60
130
200
180
250
120
360
130
Previous ownership
Known as S1BP until 1988
Petrochim (197088) ; FinaNeste (198894), FinaBorealis (1994 )
Statoil (50%)Himont (50%) (199194), BorealisMontell (1994 )
Known as EMP until reorganization in 1987
Known as EMP until reorganization in 1987
Plant leased from Companhia National de Petroquímica , was Neste owned
Enimont(1995)''
Formerly operated by Montedipe
Formerly Saras Chimica
Notes
Polymer grade ; 1994
Chemical grade, 1978
(1)290,(2)195; 1970
1991
1972
(1)200; (2)270330(1)
1978
1973
1961
Closed March 1994
1979
1962
New plant to 250k tpa
delayed
(1)150(2)80 1989
1972
1985
1980
1990
New plant (1991)
suspended
1990 V 1993
1971
1969
1982
η

Table G.2. (continued)
Country
Germany
Greece
France
Operator
BASF
DEA
DEA
EC Erdoelchemie
LeunaWerke
ElfThyssen
OMV Rheinische Olefinwerke
Ruhr Oel
Ruhr Oel
Saechsische Olefinwerke
Erdoel Raffinerie
Exxon Chemie
Esso Chemie
Mobil
Oberrheinische
Mineral oel werke
Petrolchemie und
Kraftstoffe
RaffinerieGesellschaft
Greek Petrochemicals
Hellenic Aspropyrgos Refinery
Elf Antar France
Copenor Atochem
Elf Atochem
Exxon Chemical Exxon
Exxon
Elf Antar France
BP
Naphtachimie
Shell Chimie
Total (CRD)
Total (CRD)
Total (CRD) Total (CRD)
Total (CRD)
Total (CRD)
Owners
RWE AG
RWE AG
BP (50%), Bayer (50%)
Treuhandanstalt
Elf and Thyssen consortium
OMV AG Vienna BASF (50%). Shell (50%)
Veba (50%) ; Pet. de Ven.
(50%)
Veba (50%) , Pet. de Ven.
(50%)
Treuhandanstalt
Mobil (50%) ; Veba (25%)
. Pet. de Ven (25%) Deutsche Exxon Chemical
DEA (42%) . Conoco
(25%)
PCK AG
BP (62.5%), ENI (37.5%)
Himic
State enterprise
Elf (57 5%), Solvay
(42.5%)
ENI (70%). Elf (30%) Elf
Elf
Elf Aquitaine (associate) /
Elf France (operator)
BP Chimie (50%), Elf
Atochem (50%)
Foreign
ownership
0 5
0 5
05
05
0.5
0 75
1
1
1
0.25
1
0.425
07
1
1
1
1 0.5
1
1985
540
60
270
520
40
100
145 420
265
150
160
50
240
180
42
110
135 235
245
270
480
285
160
1986
540
60
270
520
40
100
145 420
265
150
160
50
240
180
42
110
135 235
245
270
480
285
160
1987
540
60
270
520
40
100
145 420
265
150
160
50
240
180
42
70
110
135 235
245
270
480
285
160
1988
540
60
270
520
40
100
145 420
265
150
160
50
240
180
42
120p
70
110
135 235
245
270
480
285
160
Capacity
1989
540
60
270
520
40
100
145 420
265
150
160
50
240
mo
42
70
110
135 235
245
270
85
480
285
160
1990
540
60
270
520
40
100
145 420
265
150
160
50
240
180
42
70
110
135 235
245
270
85
480
285
160
il
1991
600
60
270
520
40
100
145 420
265
210
160
50
240
180
42
70
110
135
235
245
270
85
480
285
160
1992
600
60
270
520
40
100
145
420
490
210
160
50
240
220
42
70
70
135
235
245
270
85
480
285
70
160
1993
600
60
270
520
40
100
145
420
537
210
160
50
240
220
42
70
70
135 235
245
270
85
480
285
70
160
un 70
1994
600
60
27»
520
38
100
145
420
537
210
160
SI
50
240
11 220
42
70
120
160
235
245
'45
270
'30
85
'30
500
285
■70
70
160
21
1995
600
60
270
520
40
100
145
420
537
210
160
50
240
220
42
70
120
¡60
235
245
270
85
500
70
160
Previous ownership
Plant 3: 60k tpa expansion in 1991
Formerly operated by Deutsche Texaco until acquisition by RWE in 1988
Notes
(1)80(2)220(3)300
1966/8081
Operated by Union Rheinische Braunkohlen Kraftstoff until RWEDEA formed i ι 1973
1988
Known as VEB LeunaWerke Walter Ulbricht
Planned production of refinery grade polypropylene by Elf' Thyssen consortium
(1993)
Acquired by OMV in 1987
Transfer of ownership from Veba Oel to Ruhr Oel ( 1986); 60k tpa expansion in 1991
Known as VEB Otto Grotewohl until 1990 , Poss merger with Buna Buna
Polymer GmbH
Known as VEB Petrolchemisches Kombinat Schwedt until June 1990
Known as Atochem until 1/92 , CFP de Française des Pétroles (50%)SNEA
(50%) (1992)
CdF Chimie (60%) (1992)
Known as Atochem until 1/92 ; CFP de Française des Pétroles (50%)SNEA
(50%) (1994)
Atochem (1989) output goes to Atochem
470+30
Formerly known as Cie Française de Raffinage
Enichem (70%) ; Elf Atochem (30%) (1993)
1970
1965
1965
1966
(1)265(2)272 1973,92
1975
1990
1981
1970
Plant cancelled 1987
(1)40 closed (2) 70, 1976
1980
1970
1972
1967
1990
1975
1981
Polymer grade , 1993
1978
C
c -α o •o ■<

170 Chemicals
APPENDIX H
Number of companies (Eurostat, DEBA)
All chemicals
EC12
Germany France
Italy
Netherlands
Belgium
Luxembourg
UK
Ireland
Denmark
Spain
Greece
Portugal
Dates
and man
nil
78-93 78-92
78-91
78-92
78-90
78 78-92
78-90
78-92
80-92
80-92
80-92
1978 1979 1980 1981 1982 1983
-made fibres (excl. pharmaceuticals]
-324 695
673 91
60
7 551
33
46
-329
678
657 89
54
-520
32
41
-326 664
656
53
-518
38
42
1,971
84
461
-293 642
665
51
-484
36
42
1,920
93
479
-311 642
662
53
-459
34
61
1,766
93
454
-310 634
745
53
-465
35
60
1,684
55
452
1984
-314 628
798
52
-480
36
60
1,633
89
445
1985
-320
625
743 42
52
-455
38
59
1,573
86
418
1986
-314
614
719
86
57
-478
37
61
1,574
6
401
1987
-316 609
743 86
60
-460
37
63
1,488
85
394
1988
-327
633
760
92
56
-484 41
59
1,550
84
373
1989
-343 620
775 92
59
-486
42
56
1,600
84
1990
-335 625
748 92
55
-494
38
49
1,589
84
159
1991
-334
622
731 86
-
-489
-53
1,624
79
161
1992 1993
-337 331 630
-98
-
-493
-53
1,631 -
83
172
Basic industrial chemicals, petrochemicals
EC12 Germany France
Italy
Netherlands
Belgium
Luxembourg
UK
Ireland
Denmark
Spain
Greece
Portugal
78-93 78-92
78-91
78-90
82-92
80-92
80-92
80-92
-177 162
279
--
-
11
-
-
-
-
Paints, varnishes, printing in
EC12
Germany
France
Italy
Netherlands
Luxembourg
UK
Ireland Denmark
Spain Greece
Portugal
78-92
78-91
78-92
78 78-92
78-90 78-92
80-92 80-92
80-92
-
-172
145
56
4 194
12 24
-
-
-
-177 153 267
--
-
11
-
-
-
-
ks
-
-174
145
54 -
165
12
23 -
-
-
-172 143
266
--
-
14
-
308
37
98
-
-169
149
-
-
166
14
23
447 21
63
-170 137
268
--
-
14
-311
36 104
-
-
160
149 -
-
159
13 22
392
21 71
-167 136
264
--
-
14
21
298
35 102
-
-
166
145
-
-
163
12
20 427 21
70
-167 127 321
--
-
13
21
269
25
102
-
-168
163
-
-
153
12
19 422
-72
-171 150
363
--
-
13
20
270
34
97
-
-
156
172
-
-
150
12
23
420 20
69
-168 131
315
--
-
14
20
271
33 88
-
-169
168
42
-
143
13
25 414
20 69
-163 127
304
--
-
14
23
257
-87
-
-167
158
44
-
142
11
25
420 -
70
-163 123
311
-
-
-
14
22
260
35 101
-
-166
163
43
-141
11 24
370
18
68
-176 132
328
--
-
15
23
269
36
97
-
-170
166
46
-
143
13 22
398
17
68
-186 125 332
-
-
-
17
22
295
34
-
-
-162
164
46
-134
11
21
402 17
-
-185 125
325
-
-
-
16
18
290
33 18
-
-163
152
45
-133
11
18 412
17 47
-186 133 319
-
-
-
-
20
295
33 21
-
-159
150
45
-129
-19
422
18 49
-193 192 137
-
-
-
-
-
20
307 30
26
-
-155 -
-54
-127 -
-18
414 -18
50

Appendix II: Number ol'companies (Eurostat, DEBA) 171
Number of companies (Eurostat, DEBA) (continued)
Industrial an
EC 12 German) France Italy Netherlands Belgium Luxembourg UK Ireland Denmark Spain Greece Portugal
Dates d agricu
78-92 78-92
78-90 78 78-92 78-90 78-92 80-92 80-92 80-92
Manuf. of other chem
EC12 Germany France Italy Netherlands Luxembourg UK Ireland Denmark Spain Greece Portugal
78-93 78-92 78-91 78-92
78-92
78-92 80-92 81-92 80-92
Man-made fibres indu
EC12 Germany France Italy Netherlands Luxembourg UK Ireland Denmark Spain Greece Portugal
78-93 78-92 78-91
78-92
80-92 80-92 80-92
1978 1979 1980 turai chemicals
274 198
60 3
198 10 9 ---
269 197
54
270 9 8 ---
cal products
124 72 26 35
121
13 ---
stry
10 7 19
26
---
128 68 25 35
45
10 ---
10 8 17
28
---
276 192
53
269 10 7
813 26
233
129 62 26 -
48
12 225
-56
10 8 16
21
17 -11
1981
269 197
51
251 9 7
806 30
244
123 61 24 -
44
13 232 4
49
-10 21
16
15 2 11
1982
264 194
53
224 8 6
701 31
223
118 61 28 -
43
14 189 4
48
11 10 24
16
19 2 11
1983
263 200
53
240 10 7
686 30
221
118 60 28 -
42
13 167 -
46
10 10 23
16
18 -11
1984
250 199
52
249 11 6
643 29
222
117 58 32 -
48
11 163 4
47
10 8
21
17
17 2 10
1985
247 188
52
233 11 6
615 27
210
123 59 35 -
44
8 149 4 41
11 8
27
20
17 2
10
1986
246 179
57
246 12 6
613 -
192
124 56 34 42
51
7 158 4
42
11 8 35
22
16 2 10
1987
242 193
60
231 12 8
579 24 171
126 59 37 43
49
9 152 5
44
11 7
28
21
16 3 10
1988
250 184
56
249 13 9
593 23 158
125 62 45 46
53
5 163 5
40
11 7
26
21
17 3 10
1989
257 194
59
253 14 8
619 25 -
131 58 45 46
59
5 159 5 -
11 6
29
21
19 3 -
1990
258 191
55
260 11 9
626 28 72
126 60 42 47
59
4 150 5 19
11 8
29
22
20 1 3
1991
254 178
-
264 -8
646 28 68
123 60 45 41
55
6 149 -
20
11 6
28
22
19 -3
1992
262 -
-
273 -8
663 27 70
121 59 -
44
54
7 147 5
23
11 7 -
22
18 3 3
1993
--
-
------
116 ---
-
----
12 --
-
---

APPENDIX II
Employee numbers

Employee numbers
All chemicals
EC12
Germany
France
Italy
Belgium
UK
Ireland
Spain
Greece
Portugal
Denmark
Netherlands
Luxembourg
1978 1979 1980
and man-made fibres (excl. pharm
80-93
78-93
78-93
78-93
78-93
78-93
78-93
80-93
80-93
80-93
78-93
78-93
78
-
385,764
240,703
209,929
16,380
157,471
5,782
-
-
-
4,912
11.176
436
-
398,619
235,779
199,803
15,961
152,748
5,952
-
-
-
4,782
11,368
-
977,289
389,638
230,188
194,717
14,257
139,796
6,073
86,255
9,287
23,085
4,622
-
-
1981 1982
aceuticals)
907,378
345,541
216,105
171.422
15,441
122,606
4,898
82,732
9,141
23,677
4,306
-
-
865,213
376.504
209,798
159,220
16,061
111,107
4,408
78,121
9,392
23,469
10,898
-
-
1983
820,356
366.565
201,707
140,929
16,277
109,154
4,939
73,210
7,310
22,218
10,600
-
-
1984
825.544
363.711
1985
826,076
369,167
200.659 201,648
144.193
16,138
109.907
4,798
72,436
9,211
20,675
10,849
-
-
140,031
16,049
102,604
4,638
71,951
9,130
20,047
11,624
6,090
-
1986
817,629
374,688
197,968
130,778
16,845
102,119
4.424
70,186
8,985
19,831
11,939
13,102
-
1987
815,995
371,933
191,254
135,421
15,979
104,466
4.256
68,896
9,694
20,659
11,936
13,596
-
1988
806,148
304,458
187,610
132,290
16,247
103,530
4,206
69,689
9.294
19,347
9,669
14,107
-
1989
804,151
368.483
183,931
132,478
13,090
103,066
4,198
72,119
9,713
18,584
7,841
13,851
-
1990
787,166
368,915
181,980
126,964
12,030
100,424
4,048
72,218
9,228
18,758
6,848
14,123
-
1991
758.152
355,873
175.034
124.247
11,898
98,179
4.267
70,258
8,574
15,089
7,263
13,948
-
1992
727,929
342.242
171.594
116.232
11,742
93,741
4,239
65.615
7.690
16,338
7,244
14,210
-
1993
685.803
316.011
162.881
108.229
11.224
92.037
4,258
62,198
7.617
14.374
7.005
13,551
-
CAGR,
all yrs
-3%
-1%
-3%
-4%
-2%
-4%
-2%
-2%
-2%
-4%
2%
1%
CAGR,
1987 and
after
-3%
-3%
-3%
-4%
-6%
-2%
0%
-2%
-4%
-6%
-8%
0%
Basic industrial chemicals, petrochemicals
EC12
Germany
France
Italy
Netherlands
Belgium
Luxembourg
UK
Ireland
Denmark
Spain
Greece
Portugal
80-93
78-93
78-93
78-93
nil
nil
nil
nil
78-93
82-93
80-93
80-93
80-93
-
304,355
105,195
119,751
-
-
-
-
3.453
-
-
-
-
-
315,823
102,500
112,467
-
-
-
-
3,645
-
-
-
-
759,617
306,692
99,321
110,973
-
-
-
-
3,717
-
24,008
5,959
6,789
713.192
305,429
89,836
95,887
-
-
-
-
2,547
-
23,597
6,014
6,769
685,434
302,055
84,898
88,474
-
-
-
-
2,215
6,718
23,193
6,018
6,917
650,162
295,639
79,864
77,663
-
-
-
-
2,779
6,500
21.504
5,738
6,737
660,882
296.476
81,335
83,790
-
-
-
-
2,787
6,314
21,699
6,657
6,708
661,253
300,909
79,907
77,877
-
-
-
-
2,609
7,071
22,631
6,659
6,532
655,738
306,032
78,260
74,367
-
-
-
-
2.500
7.328
21,634
6,359
6,095
655,038
304,438
76,278
75,587
-
-
-
-
2,392
7,431
21,827
6,019
7.259
646,472
304,458
76,228
73,121
-
-
-
-
2,212
5,479
21,903
6,040
6.977
645,998
299,862
74,262
73,693
-
-
-
-
2,260
3,707
22,576
5,891
5.072
635,008
301,760
74,068
69,693
-
-
-
-
2,253
2,905
22,798
5,890
2,490
609,557 587,385
288,410
70,573
68,235
-
-
-
-
2,341
2,998
22,747
5,391
2,779
277.599
69,880
63,992
-
-
-
-
2.210
3,035
21,779
4,185
3.496
555,457
257,794
67,407
59.888
-
-
-
-
2165
3082
20,645
4,152
3,057
-2%
-1%
-3%
-5%
-3%
-7%
-1%
-3%
-6%
-3%
-3%
-2%
-4%
-2%
-14%
-1%
-6%
-13%
3 ■a. o v:
3 cr

Employee
Paints, varnis EC12 Germany France Italy Netherlands Luxembourg UK Ireland Denmark Spain Greece Portugal Industrial an EC12 Germany France Italy Netherlands Belgium Luxembourg UK Ireland Denmark Spain Greece Portugal
numbers (co 1978
ntinued) 1979
hes, printing inks nil nil 78-93 78-93 78-93 78 78-93 78-93 78-93 80-93 80-93 80-93
--
21,396 15.110 5,378
161 35,941
888 3,200
---
--
21,899 15,220 5.526
-32.947
894 3.131
---
d agricultural chemicals nil nil 78-93 78-93 nil 78-93 78 78-93 78-93 78-93 80-93 80-93 80-93
--
63,983 24,557
-16,380
275 48,894 1,441 941
---
--
64,078 23,692
-15,961
-60.238 1,413 918
---
1980
--
21.508 15,636
--
31,961 952
3,086 10,271 1,334 3,683
--
64,443 22.391
-14,257
-56,114 1,404 797
32,168 1,994 8.530
1981
--
20,625 14,688
--
30,661 950
2.889 9,703 1,350 4.007
--
63,070 24.862
-15,441
-50,456 1,401 714
30,103 1,777 8.805
1982
--
20,900 14,382
--
30,131 863
2,791 9,531 1,312 3.966
--
62,597 23,494
-16,061
-43.802 1,330 734
28.211 2,062 8,444
1983
--
20.188 14,048
--
28,359 803
2,820 8.969
-3,900
--
62,268 18,549
-16,277
-45,796 1,357 759
26.725 1.572 8.303
1984
--
19,639 15,025
--
27,296 789
3,264 8,979 1,211 3,393
--
60,719 17,539
-16,138
-47,487 1,222 781
25.636 1,343 7,827
1985
--
19,636 13,606 6,090
-26,081
786 3,232 9,242 1,177 3,397
--
63,379 17,430
-16,049
-43.165 1,243 880
25,064 1,294 7,737
1986
--
19,264 12,844 6,177
-25,713
707 3,428 9,332 1,359 3,569
--
62,911 15,982
-16,845
-42.874 1,217 846
24,437 1,267 7,614
1987
--
19,271 12,855 6,244
-28,168
659 3.218 8,894 1,531 3,598
--
59,905 18,046
-15,979
-44,530 1,205 925
23.557 1,232 7.034
1988
--
19,460 12,864 6,584
-27,781
699 2,827 9,636 1,184 3,573
--
56,950 17,466
-16,247
-44,399 1,295 1,146
23.647 1.178 6.181
1989
--
19,525 12,904 6,803
-27,312
688 2,873 10,928 1.259 3.549
--
56,526 18,166
-13.090
-45,264 1,250 1,068
24.174 1,689 7,645
1990
--
19,560 12,626 6,956
-26,942
659 2,833 11,555 1.291 4.376
--
56,255 17,738
-12,030
-44,180 1,136 1,110
23,870 1,862 10,003
1991
--
19.190 12,374 7,086
-25,180
707 2.924 12,247 1,299 4,201
--
55,005 17,211
-11,898
-45,767 1,219 1,041
22,650 1,884 6.249
1992
--
18.781 11,605 7.316
-24,783
745 2,936 11,543 1,408 4,005
--
53,642 16,141
-11,742
-44,787 1,284 927
21.338 1.462 6,817
1993
--
18.255 10,860 6,977
-24,332
768 2.982 10,942 1,397 3,669
--
50.445 15,106
-11.224
-43.973 1.325 941
20.227 1,450 5.812
CAGR, all yrs
-1% -2% 2%
-3% -1% 0% 0% 0% 0%
-2% -3%
-2%
-1% -1% 0% -4% -2% -3%
CAGR, 1987 and
after
-1% -3% 2%
-2% 3% -1% 4% -2% 0%
-3% -3%
-6%
0% 2% 0% -3% 3% -3% O

Employee numbers (continued)
Manuf. of other chem EC12 Germany France Italy Netherlands Luxembourg UK Ireland Denmark Spain Greece Portugal
80-93 78-93 78-93 78-93 78-93 nil 78-93 nil 78-92 80-93 87-93 80-93
1978 1979
ical products -
40.673 20.356 7.738 5.798
-26,482
-771
---
-42.010 19.311 7,508 5.842
-16.605
-733
---
1980
107.770 42.599 19.399 7,392
--
16,346 -
739 6.318
-566
1981
103,060 40.112 19,233 6,836
--
14,678 -
703 6,146
-642
1982
97.576 36.933 18,878 6,913
--
14.088 -
655 5,081
-737
1983
94,511 35.154 18.216 6,877
--
13,823 -
521 4,511
-735
1984
95.552 33.578 18.941 7,290
--
14.705 -
490 4.702
-878
1985
92.817 34.001 18.188 7,406
--
13.735 -
441 4,094
-507
1986
94.554 34.600 17.899 7,223 6,925
-14,214
-337
4,183 -
650
1987
92.874 33.993 17.442 7.022 7.352
-12,940
-362
4,264 246 953
1988
93,152 -
16.942 7.331 7,523
-13,352
-217
4,377 264 903
1989
93.410 35,416 16.519 6,877 7.048
-13,335
-193
4,319 223 717
1990
92,135 34,540 16,340 6,843 7,167
-12,716
--
4,376 185
1,076
1991
91.285 37.009 15.769 6,749 6.862
-11,209
-300
3.541 -
1,037
1992
88.126 35.567 15,316 6.329 6.894
-10.410
-346
3,296 162
1.263
1993
82.186 32.564 13.943 5.923 6.574
-10.221
--
3,123 161
1,135
CAGR, all yrs
-2% -1% -2% -2% 1%
-6%
-6% -5%
5%
CAGR, 1987 and
after
-2% -1% -4% -3% -2%
-4%
-1% -5% -7% 3%
Man-made fibres industry EC12 Germany France Italy Netherlands Luxembourg UK Ireland Denmark Spain Greece Portugal
80-93 78-93 78-93 78-93 nil nil 78-93 nil nil 80-93 87-93 80-93
-25,112 15,020 37,247
--
32.502 -----
-21,168 13,889 35.416
--
32,058 -----
109,902 20,694 11.365 32.866
--
24.084 --
10,187 -
3,517
91,126 -
9,611 24,165
--
16,949 --
10,117 -
3,454
82,203 18.877 8,970
20,988 --
13,926 --
9,524 -
3,405
75,683 18,291 8,257 18,774
--
12.133 --
9,194 -
2.543
69,110 17,982 7,255 15,621
--
11,389 --
9,078 -
1.869
72,006 18,568 7,031 18.791
--
10,876 --
8,979 -
1.874
67.337 18,518 6,404 15,558
--
10,728 --
8,699 -
1,903
68.083 18,432 5,799 17.291
--
10,857 --
8,412 666
1,815
66,524 -
5,714 16.987
--
10,134 --
8,204 628
1.713
64,743 18,091 5,165 16,478
--
9,686 --
8,119 651
1,601
60,023 17,460 4,153 15,607
--
9,363 --
7,758 -
813
57,310 16,391 3,601 15.344
--
8,965 --
7,216 -
823
52,418 15,414 3,420 14,100
--
7,472 --
6,032 473 757
48.160 13,432 3,222 12,648
--
7.336 --
5.718 457 701
-6% -4%
-10% -7%
-9%
-4%
-12%
-6% -5% -9% -5%
-6%
-6% -6%
-15%
m 3

176 Chemicals
APPENDIX 12
Energy consumption and C02 emissions
Output index
Energy consumption index C02 emissions index
Energy consumption per unit of output
1980
100
100
100
1.00
1981
100.6
96.7
95.4
0.96
1982
99.4
93
90.7
0.94
1983
105.7
94.6
91
0.89
1984
111.9
97.6
90.7
0.87
1985
114.9
99.2
90.2
0.86
1986
115.9
96.9
87.2
0.84
1987
120.7
101.7
91.1
0.84
1988
127.6
104.3
92
0.82
1989
132.1
104.6
93
0.79
1990
134.1
105.1
92.8
0.78
1991
136.1
102.7
90.3
0.75
1992
139.2
104.7
91
0.75

Appendix J : Methodology 177
APPENDIX J
Methodology
The two primary data sources were face-to-face interviews and a postal survey, questionnaire for each of these methods is given in Appendix K.
Postal survey
A sample
The postal survey questionnaire was sent to 7,000 companies. The list of companies within the sectoral and geographic scope of our study was selected from the Kompass directory. Sample size in each country was selected on the basis of proportional contribution of chemical sector turnover in each country to total EC 12 chemical sector turnover. In some countries, the number of relevant companies was above the sample size. In such instances selection was made randomly.
The split of respondents by size was 82% small/medium-sized companies and 18% large companies. The sectoral split and geographic split of respondents is given in Figures J.l and J.2.
Figure J.l. Survey results, sectoral split

178 Chemicals
Figure 3.2. Survey results, geographic split
Belgium 6%
Ireland 7% ^ f l
V
Not stated 4%
France 18%
^ ^ ^ Germany 21%
H Italy 6%
I ^ S / N ^ V . / Spain 5%
^ ■ f ô v > y Portugal 2%
^ ^ ^ ^ ^ M v ^ / Greece
^ | ^ r Netherlands 2%
^ ^ r Denmark 5%
Face-to-face interviews
The initial list for companies to interview was obtained from the European trade association,
CEFIC. Other company names were received from some national trade associations and
personal contacts. Of the 60 companies which agreed to be interviewed, 23% were small to
mediumsized and 77% were large companies. The full list of companies and trade
associations, with country in which interviews took place, is given in Appendix L. The
sectoral coverage is shown in Figure J.3. The sum of companies by sectoral split is greater
than the sum of companies interviewed because a number of companies operate in more than
one of the sectors defined.

Appendix J : Methodology 179
Figure J.3. Facetoface interviews, sectoral split
N o .
2 0 ι
18 ■
16 ■
14 ■
12 ■
10 ■
0
1 I ■
J C/Î
"cd
'i
u c LM
Ou
■ ■ ■
1 CJ
d fi
-ο .H
.H ε c «J ca -C OD "
Ο
c
■
1 V)
c 'J
ε .2? Q .
o
Q
■ 1 ■ ■ ■
1 c/i
CU
Sector
■ ■ ι JO
Ι ■
1 (Λ
rt
'ε 1)
j e
o
M)
<
■ ■ I ■
1 ΙΛ ">
u Oí
'Ξ d
Ξ o σι υ
•5 .S α.
I ■ ■ ■ ■
I ,>* o D. 'J)
C
δ

APPENDIX KI
Face-to-face interview questionnaire

Appendix Kl: Face-to-face interview questionnaire 181
EFFECTIVENESS AND IMPACT OF SINGLE MARKET INTEGRATION
SURVEY OF CHEMICAL COMPANIES
1. ABOUT YOU
Your Name: Title:
Contact telephone number: Contact fax:
For which business unit or production facility will you be answering? - e.g. Ethylene business
2. ABOUT YOUR COMPANY AND SITE
Company Name
Address
2.1 What is the approximate annual turnover of your company?
under lm ECU Π l-5m ECU D 5-20m ECU Π over 20m ECU Π
2.2 How many people do you employ? less than 50 Q 50-250 Q over250O
2.3 Which of the following sectors is your company an active market player? (tick all those that apply)
Petrochemicals □ Fibres □ Inorganic basic chemicals Π Agrochemicals Π Dyes & Pigments □ Paints, varnishes, inks & coatings □ Plastics (in primary forms) □ Other chemicals (specify) □
2.4 Does your company have a 'co-ordinator', who is responsible for matters concerning the EC? If so who?
2.5 In which of the following countries within the EC do you or did you have manufacturing capacity? (tick
all those that apply) Country 1985 1990 1995 1985 1990 1995
Belgium
Denmark
France
Germany
Greece
Ireland
D D D D D D
D D D D D D
D D D D D D
Italy
Luxembourg
Netherlands
Portugal
Spain
United Kingdom
D D D D D D
D D D
□ D D
D
α U D D U
2.6 In which of the following countries within the EC do you or did you trade? (including your own country,
tick all those that apply) 1995 D Italy □ Luxembourg Π Netherlands Π Portugal O Spain D United Kingdom
"ountry
Belgium
Denmark
France
Germany
Greece
Ireland
1985
D D D D D D
1990
D D D D D D
)85
D D D D D D
1990
D D D D D D
1995
D D D D D D

182 Chemicals
3. THE SINGLE MARKET PROGRAMME
3.1 Which of the following single market and other European initiatives or legislation are you aware of and what
overall impact (positive or negative) have they had on your company? Please indicate positive/negative effect.
Single Market Measures
Harmonization of technical
regulations and/or standards
Mutual recognition of technical
regulations and standards
Certification procedures
Simplified patenting procedures
The opening up of public
procurement
The elimination of customs
documentation
Deregulation of freight transport
The elimination of delays at frontiers
The change in VAT procedures for
intraEU sales
The liberalization of capital
movements
Doubletaxation agreements
Specific Chemical Legislation
'packaging, labelling and
classification of dangerous
substances
Directive 67/548 1.
'packaging, labelling and
classification of dangerous
preparations 88/379
'packaging, etc. of agrochemicals
pesticides, herbicides, etc. 78/631
'marketing and distribution of
dangerous substances 76/769
Other European Initiatives
Access to cheaper sources of input
(energy, transport, etc.)
Competition policy and the control
of state aids
Environmental legis!. 2.
Free movement of labour
Health and safety legislation
Overall positive or negative impact ?
Positive
G 1
Π 1
D 1
D 1
□ 1
D t
D 1
α 1
α ι
Ü t
π I
D 1
α t
Π 1
D 1
Π Ι
D 1
α ι
D 1
D I
Negative
O 2
D 2
□ 2
D 2
G 2
D 2
D 2
Π 2
D 2
G 2
Π 2
□ 2
Π 2
D 2
□ 2
D 2
D 2
D 2
Π 2
D 2
None
D 3
O 3
D 3
□ 3
Π 3
□ 3
O 3
D 3
G 3
D 3
D 3
D 3
D 3
D 3
Π 3
D 3
G 3
D 3
Π 3
D 3
No opinion
D 4
D 4
D 4
O 4
D 4
D 4
D 4
D 4
D 4
D 4
D 4
O 4
□ 4
□ 4
D 4
D 4
D 4
Π 4
□ 4
Π 4
Degree of impact ?
A little
D 1
D 1
D 1
Π 1
D 1
G 1
D 1
D 1
α ι
D 1
D 1
D 1
D 1
G 1
D 1
Π 1
D 1
D 1
D 1
D 1
Some
□ 2
O 2
D 2
□ 2
O 2
Π 2
D 2
D 2
D 2
G 2
D 2
D 2
D 2
D 2
□ 2
D 2
D 2
G 2
Π 2
α 2
Aiot
D 3
D 3
G 3
D 3
□ 3
G 3
D 3
D 3
G 3
α 3
Q 3
G 3
α 3
α 3
Ο 3
D 3
G 3
G 3
α 3
α 3
No opinion
α 4
α 4
α 4
α 4
α 4
α 4
α 4
α 4
α 4
Ώ 4
α 4
α 4
D 4
α 4
D 4
α 4
α 4
α 4
α 4
α 4

Appendix Kl: Face-to-face interview questionnaire 183
1. PLEASE SEE ATTACHED STUDY EXTRACT 2. Please prompt separately for pollution control and waste legislation
3.2 Where the impact was significant please indicate the way in which the measures affected the company (e.g. new markets R&D costs, cost of notifying new substances, competitor entry, etc.)
3.3 For each of the areas, how effective has the single market been in overcoming barriers/restrictions on trade in your sector within the EU?
Single Market Measures Hannonization of technical regulations and/or standards
Mutual recognition of technical regulations and standards
Certification procedures
Simplified patenting procedures
The opening up of public procurement
The elimination of customs documentation
Deregulation of freight transport
The elimination of delays at frontiers
The change in VAT procedures for intra-EU sales
The liberalization of capital movements
Double-taxation agreements
Specific Chemical Legislation 'packaging, labelling and classification of dangerous substances Directive 67/548
'packaging, labelling and classification of dangerous preparations 88/379
'packaging, etc. of agrochemicals -pesticides, herbicides, etc. 78/631
"marketing and distribution of dangerous substances 76/769
Other European Initiatives Access to cheaper sources of input (energy, transport, etc.)
Competition policy and the control of state aids
Environmental legislation
Free movement of labour
Health and safety legislation
Not at all effective
G 1
G 1
α ι
α t
G 1
α ι
α ι
G t
α ι
G 1
α ι
G ι
α ι
α ι
α ι
α ι
α ι
G 1
α ι
α ι
Not very effective
α 2
α 2
α 2
α 2
α 2
α 2
α 2
α 2
α 2
α 2
α 2
α 2
α 2
α 2
α 2
α 2
α 2
α 2
α 2
α 2
Quite effective
G 3
α 3
α 3
α 3
α 3
α 3
α 3
α 3
α 3
α 3
σ 3
α 3
α 3
α 3
α 3
α 3
α 3
α 3
α 3
α 3
Very effective
G 4
G 4
G 4
α 4
α 4
α 4
D 4
α 4
α 4
α 4
α 4
α 4
α 4
G 4
α 4
α 4
α 4
α 4
α 4
α 4
No opinion
G 5
G 5
α s
α s
α s
α 5
α 5
α s
α s
α s
α s
α s
α s
α s
α s
α s
α s
α s
α s
α s

184 Chemicals
3.4 Has the functioning of single market measures succeeded overall in dismantling barriers to cross-border
trade?
Yes, completely D 1 Mostly □ 2 Partially D 3 Hardly at all D 4 Notatall D 5
3.5 Are you aware of any differences in the success of the single market by:
Country?
Sector (Petrochemicals, Inorganics, Paints & Inks, Dyes ά Pigments, Fibres, Plastics. Agrochemicals)!
Product?
3.6 Please indicate the extent to which the following are still a trade barrier ?
Mutual recognition of standards and procedures
Industry subsidies from the state
Anti-competitive behaviour
Adoption or non-adoption of equal standards (level playing-field effect)
Distribution
Technical or technology differences
Language
Other (please specify)
Insignificant
D 1
D I
D 1
□ 1
D 1
O 1
D 1
D 1
Some
significance
D 2
D 2
D 2
D 2
D 2
D 2
D 2
D 2
Significant
D 3
Π 3
D 3
D 3
D 3
D 3
D 3
D 3
Very
significant
D 4
□ 4
D 4
D 4
α 4
D 4
D 4
D 4
No opinion
D 5
D 5
D 5
D 5
Π 5
D 5
D 5
D 5

Appendix Kl: Face-to-face interview questionnaire 185
3.7 Have any of the single market initiatives been undermined by delays in implementation and/or other national measures ? Please specify if counter-actions were taken prior to implementation of measures (i.e. delays, blocking, etc.) or following implementation of measures.
Yes Π 1 No Π 2
If yes please specify
3.8 What other developments have had a major impact on your business over the last ten years? What is the relative significance of the single market?
Compared with single market programme, development was:
Development (please specify)
Market trends (i.e. developments in the pattern and trends in demand)
much more more less no important important important important opinion
D D2 D3 D4 D5
Technology
EC national government actions, state subsidies
such as
Non-EC national government actions
Dumping from outside EC
Trade barriers outside EC
Quotas or similar
Other (please specify)
D i
D i
D i
D i
G i
D i
D i
D 2
D 2
D 2
D 2
D 2
D 2
D 2
D 3
D3
D3
D3
D 3
D3
D 3
D 4
D 4
D 4
D 4
D 4
D 4
D 4
D 5
D 5
D 5
D 5
D 5
D 5
D 5

186 Chemicals
4. CROSS-BORDER TRADING AND MARKETING
4.1 Has the single market encouraged your European sales presence and strategy? (please tick one box)
Yes, definitely. The single market was a major driving force The single market assisted us, but was not the over-riding factor We already had a strategy, but the single market was a help Our pan-European strategy was not influenced by the single market
D D D D
4.2 What percentage of your sales were exported in ...
1985
o/ /o
1990
%
1995
%
4.3 What approximate percentage of these exports were to other European Community countries in.
1985
%
1990
%
1995
%
4.4 If you have expanded exports to other EC countries over the last ten years, what share of the increase can be attributed to the benefits of the single market programme ?
None D 1 0-10% D 2 10-30% D 3 30-50% D 4 Over 50% Π 5
4.5 To what extent has the single market programme assisted your sales efforts in non-EC countries?
No extent Gl Limited extent D2 Some extent 03 Significant extent Π4 Very significant extent D5 No opinion D6
4.6 Are there any chemical products you are aware ofthat are more widely traded as a result of the single market programme?

Appendix Kl: Face-to-face interview questionnaire 187
5.
5.1
5.2
COMPETITION AND EFFICIENCY
Has the single market programme resulted in new competitors entering your market?
Yes Π 1 Partly Π 2 Not at all Π 3 No opinion Π 4
Where have new market entrants mostly come from? (please tick the main sources of compétition)
Within EC
Former Eastern Bloc, incl. CIS
Other Europe
North America
Japan
China
Korea
SE Asia
India
Middle East
South America
Australia/New Zealand
Specify
D D D U D D D D D D D D D
5.3 To what extent has intra-EC competition been influenced by the single market programme?
Much more competitive □ I More competitive O 2 No difference O 3 Less competitive □ 4 No opinion □ 5
5.4 What has been your response to increased competition resulting from the single market programme?
Overhead cost reduction
Distribution costs reduction
Plant/site closures
Withdrawal from unprofitable markets/segments
Efficiency gains through investment
Workforce level reduction
Efficiency gains though M&As and exploitation of economies of scale
Price reduction
Acceptance of a lower profit margin
Other (please specify)
No extent
G 1
G 1
G 1
□ 1
□ 1
□ 1
□ 1
□ 1
α ι
D 1
Minor extent
D 2
D 2
D 2
D 2
D 2
D 2
D 2
O 2
D 2
D 2
Significant extent
D 3
D 3
D 3
D 3
Π 3
□ 3
D 3
D 3
D 3
D 3
Very significant
extent
Π 4
D 4
D 4
D 4
D 4
Π 4
D 4
D 4
D 4
D 4
5.5 What has been the overall trend in your costs as a result of increased competition resulting from the single
market programme?
Costs Much lower D 1 Lower D 2 Same □ 3 Higher D 4 No opinion □ 5

Chemicals
5.6 To what extent, in your opinion, has the implementatbn of the single market programme affected the unit costs of your company's typical or average product ?
Reduction of : 0-2% D 2-6% Π 6-10% D more than 10% (please estimate) D Increase of : 0-2% Π 2-6% D 6-10% D more than 10% (please estimate) D No impact on costs D No opinion D
6. PRICES
0-2%
D3
D3
D3
2-4%
D
D
D
4-8%
D
D
D
>8%
D
D
D
6.1 What has been the overall trend in prices in your sectors(s), allowing for inflation over the last 5 years?
Higher The same Lower Average annual change, allowing for inflation
Sector Π 1 D 2 D
D i D 2 D
D i D 2 D
10 years? Sector D l D 2 D 3 D D D D
D i D 2 D 3 D D D D
D i D 2 D 3 D D D D
6.2 Are there any differences by country?
6.3 To what extent have the price trends over the last 5-10 years been affected by the single market programme ?
No extent D1 Limited extent D2 Some extent Π3 Significant extent D4 Very significant extent D5 No opinion D6

Appendix Kl: Face-to-face interview questionnaire 189
6.4 What has happened to price differentials across the EC in the last 5 years? (please tick only one box)
Not relevant in our sector D Price differentials between EC member countries have not changed D Price differentials between EC member countries have narrowed D Price differentials between EC member countries have broadened D There are no significant price differentials between EC member countries D Other (please specify) D
6.5 To what extent have the trends in price differentials over the last 5-10 years been affected by the single market programme ?
No extent DI Limited extent D2 Some extent D3 Significant extent D4 Very significant extent D5 No opinion D6
6.6 Estimate the percentage difference between lowest and highest price for the same product across the EC?
Product/sub-sector Difference
0-10% 10-20% 20-50% 50-100% over 100%
6.7 What has been the main driving force for change?
6.8 What constraints stop prices converging to a uniform price across the EC? (tick appropriate box)
Constraint
Local market conditions - competition, size, etc.
Different market requirements, e.g. different specifications
Cost of distribution, e.g. length of distribution chain
Local paper work
Local or different taxes, e.g. VAT rates
Cultural differences
Language
Other (specify)
Strong effect G i D i
D i
D i
D i
D i
D i
D i
Some effect D2
D 2
D 2
D 2
D 2
D 2
D 2
D 2
No effect
D3
D 3
D 3
D 3
D 3
D 3
D 3
D 3
No opinion D4
D 4
D 4
D 4
D 4
D 4
D 4
D 4
6.9 Are there any differences by sector?

190 Chemicals
PRODUCTION AND PRODUCTIVITY
Company level
7.1 Have the larger companies in your sector increased the number of plants they operate over the last 5-10
years?
yes D 1 no D 2 no opinion D 3
7.2 To what extent has this been facilitated by the new opportunities created by the single market
programme? No extent G 1 Limited extent D 2 Some extent D 3 Significant extent D 4 Very significant extent D 5
7.3 Has the average plant size increased over the last 5-10 years?
yes D 1 no D 2 no opinion D 3
7.4 To what extent has this been facilitated by the new opportunities created by the single market
programme?
No extent D 1 Limited extent D 2 Some extent D 3 Significant extent D 4 Very significant extent G 5
7.5 Are there any differences by sector?
Sector level
7.6 To what extent has the single market programme facilitated cross border M&As and joint ventures?
Not at all Π 1 Some effect Π 2 Significant effect Π 3 Very significant Π 4 No opinion Π 5
7.7 In your opinion, what has been the effect of the single market programme (SMP) on the structure of
your industry ?
The SMP played an important role in leading to exit from the industry of inefficient companies D 1
The SMP played some role in leading to exit from the industry of hefficient companies D 2
The SMP had no impact on industry structure Π 3
The SMP helped the continuation of the operation of inefficient companies D 4
No opinion Π 5
7.8 Within your industry has the production base rationalized during the last 5 years?
Significant rationalization □ 1 Some rationalization □ 2 No rationalization O 3 No opinion □ 4
7.9 Within your industry has concentration increased within the last 5 years?
Significant increase □ 1 Some increase □ 2 No increase □ 3 No opinion □ 4

Appendix Kl: Face-to-face interview questionnaire 191
7.10 In your opinion, what has been the effect of the single market programme (SMP) on the concentration of
your industry?
The SMP played an important role in leading to an increased concentration in the industry D 1
The SMP played some role in leading to an increased concentration in the industry D 2
The SMP had no impact on the concentration of the industry D 3
The SMP has helped the decrease in concentration of the industry D 4
No opinion D 5
7.11 Are there any differences by:
Country?
Sector (Petrochemicals, Inorganics, Paints & Inks, Dyes & Pigments, Fibres, Plastics, Agrochemicals)?
Productivity
7.12 What has been the development in productivity (measured as volume of output per employee) over the
last 10 years?
Increased Q 1 Increased O 2 Stayed the same Q 3 Decreased Q 4 No opinion □ 5 significantly
7.13 Approximately what has been the overall change?
0-10% D 10-20% D 20-50% D more than 50% please specify Π
7.14 In your opinion, what has been the impact of the single market programme (SMP) on your company's
productivity ?
The SMP helped to improve productivity significantly D 1
The SMP helped to improve productivity marginally D 2
The SMP had no effect on productivity D 3
The SMP had a negative effect on productivity D 4
No opinion D 5

192 Chemicals
8. THE DIRECT IMPACT OF SINGLE MARKET LEGISLATION ON YOUR COST BASE
(PLEASE IGNORE INDIRECT IMPACT ON COSTS THROUGH INCREASED COMPETITION WHICH WAS ADDRESSED IN SECTION 5)
8.1 Has the single market legislation had a direct impact on your costs?
Reduced costs Π 1 No change Π 2 Increased costs Π 3 No opinion Π 4
8.2 Within which areas of your company has the single market legislation affected DIRECTLYyour cost base? For each category below please state by what approximate percentage it has reduced or increased them.
Classification and registration of chemical substances
Raw materials
Labour
Production
Equipment
Packaging/ eco-labelling
Transport
Administration
Capital and finance
R&D
Purchasing
Impact on costs
No change
D 1
D 1
D 1
α ι D 1
D 1
D 1
D 1
D 1
D 1
D 1
Reduced costs
D 2
D 2
D 2
D 2
D 2
D 2
D 2
D 2
D 2
D 2
D 2
Increased costs
D 3
D 3
D 3
D 3
D 3
D 3
D 3
D 3
D 3
D 3
D 3
Approx. percentage increase or decrease
Under 1 %
D 1
D 1
D 1
D 1
D 1
D 1
D 1
D 1
D 1
D 1
D 1
t-%
D 2
D 2
D 2
D 2
D 2
D 2
D 2
D 2
D 2
D 2
D 2
2-5%
D 3
D 3
D 3
D 3
D 3
D 3
D 3
D 3
D 3
D 3
D 3
5-10%
D 4
D 4
D 4
D 4
D 4
D 4
D 4
D 4
D 4
D 4
D 4
Greater than 10%
D 5
D 5
D 5
D 5
D 5
D 5
D 5
D 5
D 5
D 5
D 5

Appendix Kl: Face-to-face interview questionnaire 193
8.3 For the three areas that represent the most significant cost elements for your company please describe briefly the cost implication on your company.
A What were the most significant legislative measures that affected this cost element (please refer back
to section 3)
Was the effect a one-off or ongoing cost change? one-off Π ongoing Q
What is the impact?
One-offvalue £
Annual impact on cost element %
Total costs %
How it has affected your company? (brief description)
B What were the most significant legislative measures that affected this cost element (please refer back
to section 3)
Was the effect a one-off or ongoing cost change? one-off Π ongoing Π
What is the impact?
One-offvalue £
Annual impact on cost element %
Total costs % How it has affected your company? (brief description)
C What were the most significant legislative measures that affected this cost clement (please refer back
to section 3)
Was the effect a one-off or ongoing cost change? one-off O ongoing O
What is the impact?
One-offvalue £
Annual impact on cost element %
Total costs % How it has affected your company? (brief description)
Are there any differences that exist by:
Country? Sector (Petrochemicals, Inorganics, Paints & Inks, Dyes & Pigments, Fibres, Plastics, Agrochemicals)? Product?

194 Chemicals
9. SOURCING
9.1 Have any changes occurred in your patterns of sourcing from EC countries during the last 10 years?
Raw materials
Labour
Production
Equipment
Packaging
Transport
Administration
Capital and finance
Share from EC increased
D 1
D 1
D 1
D 1
D 1
D 1
D 1
D 1
Share from EC stayed the
same
D 2
D 2
D 2
D 2
D 2
Π 2
D 2
D 2
Share from EC decreased
D 3
D 3
D 3
D 3
α 3
D 3
G 3
D 3
No opin
D 4
D 4
D 4
D 4
D 4
Π 4
D 4
D 4
9.2 In your opinion, has the single market programme (SMP) facilitated sourcing from the EC ?
The SMP helped : Significantly D 1 Somewhat D2 Had a marginal effect D3 Had no effect D4 No opinion D 5
9.3 Do you give preference towards EC supplying companies? Yes O 1 No D 2
9.4 Are there any differences that exist by:
Country?
Sector (Petrochemicals, Inorganics, Paints & Inks, Dyes & Pigments, Fibres, Plastics, Agrochemicals)?
Products?
9.5 Are there any remaining obstacles to improving sourcing within the EC?

Appendix Kl: Face-to-face interview questionnaire 195
10. EMPLOYMENT
10.1 Has your employment level changed during the last five years?
Increased a lot Π I Increased a little G2 No change D3 Reduced a little D4 Reduced a lot D 5 No opinion D6
10.2 What % up or down? %
10.3 How has legislation regarding European Union H&S and workers councils affected your organization?
Health and safety Unfavourable effect Ol No effect D2 Favourable effect O 3 No opinion 04
Workers councils Unfavourable effect D 1 No effect Π2 Favourable effect D 3 No opinion Π 4
10.4 To what extent has the single market programme influenced internal EC job mobility?
Significant effect □ 1 Some effect D 2 No effect □ 3 Negative effect □ 4 No opinion G 5
10.5 Has the single market resulted in different requirements in ternis of skills needed by employers?
Yes Π 1 No D 2 No opinion Π 3
10.6 Which skills are currently in short supply and which skills are in low demand?
11. ENVIRONMENT
11.1 Do you monitor environmental performance? Yes CM No Q 2 No opinion Q 3
11.2 What indicators are used?
11.3 Has the single market programme had an impact on your environmental policies?
No impact D 1 Some impact Π2 Significant impact D3 No opinion D4
.4 What have been the effects of environmental measures on the free circulation of products and services?
(please comment)

196 Chemicals
12. CORPORATE STRATEGY
12.1 What strategies have been adopted or influenced as a result of the single market programme? i.e. what
strategic responses have been undertaken as a result of the changed set of market circumstances brought
about by the single market programme? (tick appropriate boxes)
Strategy
Internationalism
Capacity adjustment
Local decisions
Cost cutting/rationalization
Adaptation of product range
Innovation
Managerial reorganization
Competition avoidance
Employment
Total production
Other (please specify)
Strong
influence
Di
G i
D i
D i
D i
D i
D i
D i
D i
D i
Some
influence
D2
D 2
D 2
D 2
D 2
D 2
D 2
D 2
D2
D 2
Not influenced
Not applicable
D3
D 3
D 3
D 3
D 3
D 3
D 3
D 3
D 3
D 3
D i D2 D3
12.2 Has the single market influenced strategies within:
Countries?
Sectors (Petrochemicals, Inorganics, Dyes & Pigments, Fibres, Plastics, Agrochemicals)?
Products?
12.3 Has the single market programme resulted in any of the following? (please tick all those that apply)
Integration either upstream or downstream within the EC Yes Π 1 No O 2 No opinion O 3
Joint ventures with other EC companies Yes Π 1 No O 2 No opinion O 3
12.4 Has the single market resulted in any of the following actions? (please tick all those that apply)
Closure of sales office to merge into groups Control of selling operations across country borders by single sales offices Pan-European pricing and marketing agreements with major customers Movement of production facilities to other lower cost locations Swaps or joint ventures with companies outside the EC
12.5 What remaining obstacles are there (in the context of the single market) to you adopting your ideal
strategy?
Yes D 1
Yes D 1
Yes D 1
Yes D 1
Yes D I
No D 2
No D 2
No D 2
No D 2
No D 2
No opinion □ 3
No opinion Q 3
No opinion □ 3
No opinion □ 3
No opinion □ 3

APPENDIX K2
Postal survey questionnaire

198 Chemicals
Private & Confidential
EFFECTIVENESS AND IMPACT OF INTERNAL MARKET INTEGRATION
POSTAL SURVEY OF CHEMICAL COMPANIES
The completion of this questionnaire should take around 10 minutes. Please contact Ian Walker or George Houpis on +44 (0) 171 - 311 - 8459 if you need any clarification. Please post the questionnaire back no later than the 5th of October. NO STAMP IS REQUIRED.
Please tick the box if you would like to receive a summary of the survey findings. D
Please note that we would like you to answer the following in relation to your specific company or division for which you are responsible rather than any larger group to which it may belong. This questionnaire covers the 12 Member States of the European Community.
ABOUT YOUR COMPANY AND SITE
Name Company_ Position Address
Country Telephone Number_
Q. l Does your company form part of a larger group of companies? Yes D 1 No D 2
Q.2 What is the approximate annual turnover of your company ? Under lm ECU D l l-5mECU D 2 5-20m ECU D 3 Over20mECUO4
Q.3 How many people are employed by your company ? Less than 50 D 1 50-99 D 2 100-250 D 3 Over 250 D 4
Q.4 In which of the following sectors does your company operate ? Petrochemicals D 1 Inorganic basic chemicals D 2 Dyes & pigments D 3 Plastics (in primary forms) D 4 Fibres Ü 5 Agrochemicals D 6 Paints, varnishes, inks & coatings G 7 Other chemicals (please specify) D 8
Please provide answers to questions 5a and 5b in the table below.
Q.5a In which of the countries within the EC do you or did you have manufacturing capacity in 1985, 1990 & 1995?
Q.5b To which of the following countries within the EC do you or did you export in 1985, 1990 & 1995?

Appendix K.2: Postal survey questionnaire 199
Country
Belgium
Denmark
Ireland
France
Germany
Greece
Italy
Luxembourg
Netherlands
Portugal
Spain
United Kingdom
Q.5a
Manufacturing capacity
1985
Π 1
D 2
D 3
O 4
D 5
D 6
α 7
Π 8
D 9
D 0
D X
D Y
1990
D 1
D 2
D 3
Π 4
D 5
□ 6
D 7
G 8
D 9
D 0
D X
D Y
1995
D 1
D 2
D 3
D 4
D 5
D 6
D 7
D 8
Π 9
D 0
Π X
D Y
Q.5b
Export
1985
□ 1
D 2
□ 3
D 4
D 5
D 6
□ 7
D 8
D 9
G 0
D X
D Y
1990
D 1
D 2
D 3
D 4
Π 5
D 6
D 7
D 8
D 9
D 0
D X
D Y
1995
G I
G 2
D 3
D 4
D 5
D 6
D 7
D 8
D 9
D 0
D X
D Y

200 Chemicals
Β. THE SINGLE MARKET PROGRAMME
Q. 1 For each of the following single market measures please indicate how effective the single market programme has been in overcoming barriers and restrictions on trade.
Single market measures Harmonization of technical regulations and/or standards
Mutual recognition of technical regulations and standards
Certification procedures
Simplified patenting procedures
The opening up of public procurement
The elimination of customs documentation
Deregulation of freight transport
The elimination of delays at frontiers
The change in VAT procedures for intra-EC sales
The liberalization of capital movements
Double-taxation agreements
Specific chemical legislation Packaging, labelling and classification of dangerous substances, Directive 67/548
Packaging, labelling and classification of dangerous preparations. 88/379
Packaging, etc. of agrochemicals -pesticides, herbicides etc., 78/631
Marketing and distribution of dangerous substances, 76/769
Not at all effective
D 1
D 1
D 1
D 1
D 1
α 1
D 1
D 1
α ι
α ι
D 1
D 1
D 1
D 1
Π I
Not very effective
D 2
D 2
D 2
D 2
D 2
D 2
D 2
O 2
G 2
D 2
D 2
D 2
D 2
D 2
G 2
Quite effective
Π 3
D 3
D 3
D 3
D 3
D 3
O 3
D 3
D 3
D 3
D 3
D 3
D 3
D 3
D 3
Very effective
α 4
D 4
D 4
D 4
D 4
D 4
D 4
D 4
D 4
D 4
D 4
D 4
D 4
D 4
D 4
No opinion
D 5
D 5
D 5
D 5
α 5
D 5
D 5
D 5
D 5
α 5
D 5
G 5
D 5
D 5
D 5

Appendix K2: Postal survey questionnaire 201
Other European initiatives
Access to cheaper sources of input
(energy, transport etc )
Competition policy and the control of
state aids
Environmental legislation
Free movement of labour
Health and safety legislation
Not at all
effective
D 1
D 1
D 1
D 1
D 1
Not very
effective
D 2
D 2
D 2
G 2
D 2
Quite
effective
G 3
D 3
Π 3
D 3
D 3
Very
effective
D 4
D 4
Π 4
D 4
D 4
No opinion
D 5
D 5
D 5
D 5
D 5
Q.2 Has the functioning of single market measures succeeded overall in dismantling barriers
to cross-border trade? Yes. completely D 1 Mostly D 2 Partially D 3 Hardly at all D 4 Not at all D 5
Q.3 Please indicate the extent to which the following are still a trade barrier.
Mutual recognition of standards and
procedures
Industry subsidies from the state
Anti-competitive behaviour
Non-adoption of equal standards
Distribution
Technical or technology differences
Language
Other
(please specify')
Insignificant
D 1
D 1
D 1
D 1
D 1
D 1
D 1
D 1
Some
significance
□ 2
D 2
D 2
D 2
G 2
D 2
□ 2
D 2
Significant
D 3
D 3
D 3
D 3
D 3
D 3
D 3
D 3
Very
significant
D 4
D 4
□ 4
D 4
D 4
D 4
D 4
Π 4
No Opinion
□ 5
G 5
D 5
D 5
D 5
D 5
D 5
D 5
CROSS-BORDER TRADING AND MARKETING
Q. 1 Roughly what percentage of your sales were to other European Community countries in
Q.2
1985
%
1990
%
1995
0 / /O
If you have expanded exports/sales to EC countries over the last 10 years, what share of the
increase can be attributed to the benefits of the single market programme? None Π 1 0-10% G 2 10-30% G 3 30-50% G 4 Over 50% G 5 No opinion G 6

202 Chemicals
Q.3 To what extent has the single market programme assisted your sales efforts in non-EC
countries? No extent Gl Limited extent G2 Some extent G3 Significant extent G4 No opinion Q5
D. COMPETITION AND EFFICIENCY
Q. 1 Has the single market programme resulted in new competitors entering your market? Yes G 1 No G 2 Ifno.gotoQJ
Q.2 Where have new market entrants mostly come from? (please tick the main sources of
competition) Within EC Q 1 Former Eastern Bloc, incl. Former Soviet Union Q 2 Other Europe Q 3
North America Q 4 Japan Q 5 China Q 6
Korea G 7 SE Asia G 8 India G 9
Middle East G 10 South America G 11 Australia/NZ G 12
Other (please specify) Q 13
Q.3 Has intra-EC competition been made more or less competitive by the single market
programme? Much more Q1 More Q2 No difference G 3 Other (please specify)
competitive competitive
G4
If your answer to Q.3 was no difference or other, please go to section E.
Q.4 If as a result of the single market programme competition in your market has increased,
to what extent have you adopted the following responses listed in the table below?
Overhead cost reduction
Distribution costs reduction
Plant/site closures
Withdrawal from unprofitable markets/segments
Efficiency gains through investment
Reduction in workforce
Efficiency gains through M&As
Efficiency gains through the exploitation of economies of
scale
Price reduction
Acceptance of a lower profit margin
Other (please specify)
No extent
G 1
G 1
α ι
α ι
α ι
α ι
α ι
α ι
α ι
α ι
α ι
Minor
extent
G 2
α 2
α 2
α 2
α 2
α 2
α 2
α 2
α 2
α 2
α 2
Significant
extent
G 3
G 3
α 3
D 3
D 3
D 3
D 3
□ 3
D 3
D 3
D 3
Very significant
extent
D 4
D 4
D 4
D 4
D 4
D 4
□ 4
Π 4
D 4
D 4
D 4
Q.5a What has been the overall trend in costs as a result of increased competition resulting
from the single market programme? Costs Much lower □ 1 Lower D 2 The same D 3 Higher D 4 No opinion D 5

Appendix K2: Postal survey questionnaire 203
Q. 5b Please provide an APPROXIMATE estimate of the change in the unit costs of your
company's typical or average product as a result of increased competition resulting from
the single market programme? Reduction of:
Increase of:
No change
0 to 2% D 1
0 to 2% D 5
□ 9
2 to 6% D 2
2 to 6% D 6
No opinion D 10
6 to 10% D 3 more than 10% (please estimale) D 4 6 to 10% D 7 more than 10% (please estimate) D 8
E. PRICES
Q. 1 What has been the overall trend in the price of your products over the last 5 and 10
years, allowing for inflation (i.e. the overall trend in real prices)?
a) 5 years
b) 10 years
Higher
D 1
D 1
The same
D 2
D 2
Lower
D 3
D 3
Q.2 To what extent have the price trends over the last 5-10 years been affected by the
single market programme? No extent Dl Limited extent D2 Some extent D3 Significant extent D4
No opinion D5
Q.3 What has happened to the price differentials for your products across the EC in the last
5 years? (please tick only one box)
Price differentials between EC member countries have: Not changed D 1 Narrowed D 2 Broadened D 3
There are no significant price differentials D 4 Other (please specify) _ □ 5
Q.4 To what extent have the trends in price differentials over the last 5-10 years been
affected by the single market programme? No extent D1 Limited extent G2 Some extent D3 Significant extent D4 No opinion D5
PRODUCTION AND INDUSTRY STRUCTURE
Q. 1 In your opinion, what has been the effect of the single market programme (SMP) on the
structure of your industrial sector in your country? The SMP played an important role in leading to exit from the industry of inefficient companies D 1
The SMP played some role in leading to exit from the industry of inefficient companies D 2
The SMP had no impact on industry structure Π 3
The SMP helped the contiruation of the operation of inefficient companies D 4
No opinion □ 5
Q.2 In you opinion, what has been the effect of the single market programme
(SMP) on the concentration of your industrial sector in your country ? The SMP played an important role in leading to an increased concentration in our industrial sector D 1
The SMP played some role in leading to an increased concentration in our industrial sector D 2
The SMP had no impact on the concentration of our industrial secta □ 3
The SMP has helped the decrease in concentration of our industrial sector □ 4
No opinion □ 5

204 Chemicals
G. THE DIRECT IMPACT OF SINGLE MARKET LEGISLATION ON YOUR COST BASE
Q. 1 a Has the single market legislation had a DIRECT impact on your costs. Has it reduced them, increased them or made no difference ? Costs lower D 1 Same D 2 Higher D 3 Much higher D 4 NoopinionD 5
Q. lb If your costs have been affected DIRECTLY by the single market legislation, please State b y w h a t a p p r o x i m a t e percentage your costs increased or decreased. 0-0.5% Gl 0.5-1% D 2 1-2% D 3 2-3% D 4 3-5% D5 more than 5% (please specify ) D 6
Thank you for taking the time to participate in our survey. Please add any other comments below:

Appendix L: List of companies and trade associations interviewed 205
APPENDIX L
List of companies and trade associations interviewed
Table L.l. Companies interviewed
Company name
DOW EUROPE EVC (EUROPEAN VINYLS CORPORATION) EXXON FABELTA INDUSTRIES ICI BELGIUM NV BOSSUYT OXYCHEM/OCCIDENTAL CHEMICAL EUROPE NV PROCTER AND GAMBLE RHÔNE-POULENC BENELUX COATES LOR1LLEUX A/S ICI NORDALIM AS - NOVOPAN TRAEINDUSTRI-AJ CFPI ELF ATOCHEM L'AIR LIQUIDE PITTSBURGH PLATE GLASS INDUSTRIES INTERNATIONAL INC RHÔNE-POULENC ABR HANDEL GMBH AGRO-EVO (HOECHST SHERING AGREVO GMBH) BASF AG BAYER AG DEGUSSA AG DU PONT DE NEMOURS INTERNATIONAL/DU PONT DEUTSCHLAND HALTERMANN GMBH HENKEL KGAA HOECHST AG RUFAS (RUTGERS FAHRZEUG-SYSTEME) WACKER CHEMIE CARBONICA CHROTEX ERMICHROM HADJILUCAS MICRO BIO UNIFI TEXTURED YARNS EUROPE LTD WELLMAN INTERNATIONAL LTD AQUAFIL CAGLIFICIO CLENICI AND SACCO ENICHEM SPA IMPER ITALIA SPA SALCHI SPA TEXTILE PROD.
Country
Belgium Belgium Belgium Belgium Belgium Belgium Belgium Belgium Belgium Denmark Denmark Denmark France France France France France
Germany Germany Germany Germany Germany Germany Germany Germany Germany Germany Germany Greece Greece Greece Greece Ireland Ireland Ireland
Italy Italy Italy Italy Italy Italy

206 Chemicals
Table L.l. Companies interviewed (continued)
Company name
DU PONT DE NEMOURS (LUXEMBOURG)
AKZO NOBEL
DSM
EURORESINOS INDUSTRIAS QUÍMICAS S.A
FISIPEFIBRAS SINTETICS DE PORTUGAL S.A
QUIMITECNICA
CATALANA DE POLÍMEROS (LA SEDA DE BARCELONA)
NUREL S.A
AMOCO CHEMICAL (EUROPE) SA
CIBA GEIGY & SGCI
SANDOZ 1NTL
AKCROS CHEMICALS
ALBRIGHT AND WILSON PLC
BRITISH CHROME AND CHEMICALS
CANNINGS
HOLLIDAY CHEMICAL HOLDINGS PLC
ICI LTD
MANDERS PLC
SHELL CHEMICALS EUROPE LTD
Country
Luxembourg
Netherlands
Netherlands
Portugal
Portugal
Portugal
Spain
Spain
Switzerland
Switzerland
Switzerland
UK
UK
UK
UK
UK
UK
UK
UK
Table L.2. Trade associations interviewed (Europe)
Trade association name
VBN (Ver"ing Betonmortelfabrikaten Nederland)
UIC (Union des Industries Chimiques)
FEDERCHIMICA (Italian Chemicals Industry)
VNCI (Ver*ing Ned'e Chemische Ind)
CIA (Chemical Industry Association)
GACM (German Association of Chemical Manufacturers)
CEFIC (European Chemical Industry Council)
ΑΡΜΕ (Association of Plastic Manufacturers in Europe)
APPE (Association of Petrochemicals Producers in Europe)
CEPE (Comité Européen Peintures)
CIRFS (Comité International de la Rayonne et des Fibres Synthétiques)
ECPA (European Petrochemical Association)
EPFP (European Producers of Formulated Preservatives)
ESA (European Sulphuric Acid Association)
ETAD (Ecological and Toxicological Association of Dyes and Organic Paint)
Country / Sector
Germany
France
Italy
Netherlands
UK
Greece
Europe
Plastics (Eur.)
Petrochemicals (Eur.)
Paints (Eur.)
Fibres (Eur.)
Agrochemicals (Eur.)
Other (Eur.)
Inorganics (Eur.)
Dyes & Pigments (Eur.)

Bibliography 207
Bibliography
Publications
ΑΡΜΕ, European Manufacturer's Statistics and miscellaneous publications, 1995.
ΑΡΜΕ, Annual Report 1994-95, 1995.
APPE, Activity Review 1993-94, 1994.
CIRFS, Information on Man-made Fibres, 31st volume, 1994.
CEFIC, The European Chemical Industry - In a worldwide perspective Facts & Figures, 1993.
CEFIC, The European Chemical Industry - In a worldwide perspective Facts & Figures, 1994.
CEFIC, Basic Economic Statistics of the European Chemical Industry 1992-93, 1994.
CEFIC, Energy Consumption 1980-92, 1994.
CEFIC, Focus on Competitiveness II, 1994.
CEFIC, GATT Uruguay Round: issues relevant to the European Chemical Industry, May 1994.
CEFIC, Basic Economic Statistics of the European Chemical Industry 1993-94, 1995.
CEFIC, Economic Data Base for the Chemical Industry - An Introduction, 1995.
CEFIC, Economic Bulletin, 1995.
CEPE, A Multicoloured Europe, 1994.
CIA, US Chemical Industry Statistical Handbook 1994, 1994.
CIA, Single European Market Briefing, 1992.
CIA, The GATT Uruguay Round: First Assessment of Results, 1994.
Cecchini, P., The European Challenge 1992: The Benefits of a Single Market, Aldershot, Wildwood House, 1988.
Cecchini, P., Research on the Cost of Non-Europe: Basic Findings, Office for Official Publications of the European Communities, 1988.

208 Chemicals
Chemical Industry Main Markets 1989-2000, An assessment by area and product group, 1990.
Directory of Community legislation in force and other acts of the Community institutions, 27th edition, Vols. I and II, Luxembourg, Office for Official Publications of the EC, 1996.
ECN, FT, European Petrochemicals/Plastics Prices 1986-90, 1990.
European Commission, Completing the Internal Market: White Paper from the Commission to the Council, COM(85)310 final, Luxembourg, Office for Official Publications of the EC, 1985.
European Commission, Panorama of EU industry 95/96, Luxembourg, Office for Official Publications of the EC, 1995.
European Commission, 'The economics of 1992', European Economy, Vol. 35, Luxembourg, Office for Official Publications of the EC, March 1988.
Imperial College, 'The impact of the 6th and 7th amendments of EC Directive 67/548 on the registration and development of substances and preparations', 1994.
Jalle, A. et a l , 'Environment Regulation and the Competitiveness of US Manufacturing: What Does the Evidence Tell Us?', Journal of Economic Literature, March 1995.
Pratten, C , 'A survey of the economies of scale', in European Commission, Research on the 'cost of non-Europe ', Basic findings, Vol. II, Luxembourg, Office for Official Publications of the EC, 1988.
Sapir, 'Europe's Single Market: the Long March to 1992', CEPR Discussion Paper 1245, September 1995.
UNICE, Releasing Europe's Potential Through Targeted Regulatory Reform, Interim Report, June 1995.
UIC, Evolution de l'Industrie Chimique Française en 1994, 1994.
UK Department of Trade and Industry, 'Survey of barriers to trade in chemicals in the Single Market', 1995.
World Bank, Sorsa P., Competitiveness and Environmental Standards, World Bank Policy Research Working Paper 1249, Washington, 1994.
Selected market reports
Datamonitor, European Petrochemicals: Competitive Analysis and Forecasts, January 1993.
Datamonitor/Financial Times Management Report, European Petrochemicals: Prospects for Future Profitability, 1994.

Bibliography 209
EIU, The Man-made Fibres Industry in Western Europe, April 1993.
Financial Times survey, Chemicals industry, 27 October 1995.
Freedonia Group, World Pesticides to 1988, November 1994.
Freedonia Group, World Titanium Dioxide to 1997, September 1993.
Frost and Sullivan, The European Market for Biopesticides and Related Agricultural Biotechnologies. November 1993.
Frost and Sullivan, A Strategic Assessment of the European Chemical industry. December 1994.
Frost and Sullivan, European Printing Ink Markets, February 1995.
Information Research Ltd, European Chemical News, Paints & Coating Review, November 1994.


The S ¿rig le ÆicLrket Review
SUBSERIES I IMPACT ON MANUFACTURING
V o l u m e S C h e m i c a l s
This report has been written as part of a major review of the
Single Market undertaken by the European Commission.
The 1996 Single Market Review assesses the progress made
in implementing the Single Market Programme since 1992,
through a series of 39 separate reports on specific
business sectors or single market issues. This
research amounts to the first extensive analysis
of what has been happening to the European
economy as a result of the Single Market
Programme. $ 'jr^
Written by leading subject experts under the coordination of the Directorates
General 'Internal Market and Financial Services' (DG XV) and 'Economic and
Financial Affairs' (DG II) of the European Commission, this Review provides
essential information to all those worldwide who are interested or involved in the
development of the Single Market. It also gives invaluable insight into specific
industry sectors for investors, analysts and corporate strategists.
SUBSERIES I
Volume 1
2
3
4
5
6
7
8
IMPACT ON MANUFACTURING
Food, drink and tobacco processing machinery
Pharmaceutical products
Textiles and clothing
Construction site equipment
Chemicals
Motor vehicles
Processed foodstuffs
Telecommunications equipment
For a complete picture of the Single Market Review, see also:
SUBSERIES II IMPACT ON SERVICES (11 Volumes)
III DISMANTLING OF BARRIERS (6 Vo lumes )
IV IMPACT ON TRADE AND INVESTMENT (4 Vo lumes)
V IMPACT ON COMPETITION AND SCALE EFFECTS (4 Vo lumes)
VI AGGREGATE AND REGIONAL IMPACT (5 Vo lumes)
RESULTS OF BUSINESS SURVEY I £ 4 5 ( S t g . ) E C U 5 4 (prices excluding VAT)
• * * Office for Official Publications of the
J^L * European Communities
+ — ι —l if L-2985 Luxembourg
* * * ISBN 92-827-8772-9
Catalogue number: C1-67-96-005-EN-C
Kogan Page.Earthscan
Kogan Page, 120 Pentonville Road, London NI 9JN
9 '780749"423094 >


![Accountable Government: A Guide for Ministers and Ministers ......2011/05/27 · Accountable government: a guide for ministers and ministers of state Annual (irregular) [2003]- Text](https://static.documents.pub/doc/80x56/60dbf72e48bc3559e537dc8c/accountable-government-a-guide-for-ministers-and-ministers-20110527-.jpg)
