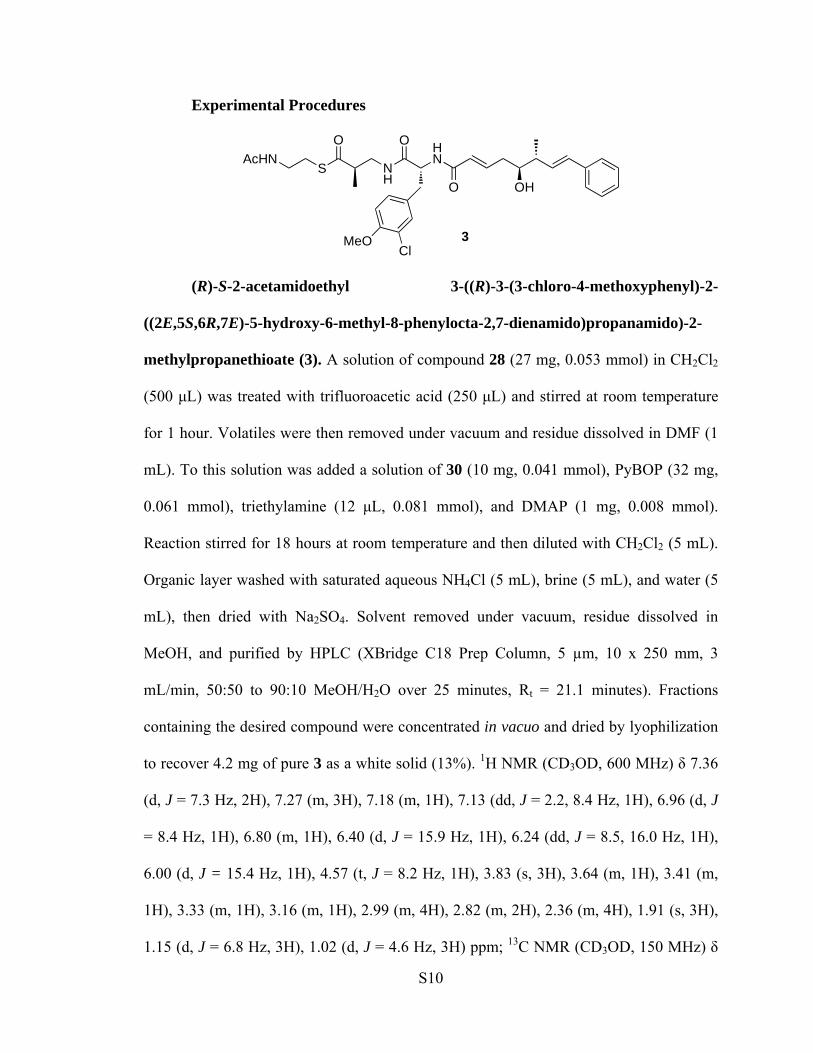
Chemoenzymatic Synthesis of Cryptophycin Anticancer Agents by an Ester Bond Forming NRPS Module Yousong Ding, 1,2,5,# Christopher M. Rath, 1,# Kyle L. Bolduc, 1,2 Kristina Håkansson, 3 and David H. Sherman 1,2,3,4* 1 Life Sciences Institute, and Departments of 2 Medicinal Chemistry, 3 Chemistry, 4 Microbiology & Immunology, University of Michigan, Ann Arbor, MI 48109; 5 Division of Chemistry and Chemical Engineering, California Institute of Technology, Pasadena, CA 91125. Supplemental Materials and Methods 1. Protein expression and purification Proteins were cloned and expressed using standard molecular biology and biochemical techniques. Crp TE was cloned and expressed as previously described. 1,2 CrpD-M2 gene was amplified by PCR with a forward primer with a restriction site of BamHI (CAAGGATCC TTACGTACTACTAATAGCGCA) and a reverse primer with a restriction site of XhoI (ATGCTCGAG TAGTTGTTGAATTGGTACTAATGG). The amplicons were purified and digested for cloning into pET28a. The plasmid encoding N- terminal His 6 -CrpD-M2 was transformed into E. coli BAP1 and grown at 37 °C in TB medium to an OD 600 of ~0.8 in 2 L flasks. The cultures were cooled to 18 °C, and isopropyl β-D-thiogalactopyranoside was added to a final concentration of 0.2 mM and grown for additional 12-16 h with shaking. The cells were harvested by centrifugation and frozen at -20 °C. Cell pellets were thawed to 4 °C and resuspended in 5X volume of S1
Transcript
Chemoenzymatic Synthesis of Cryptophycin Anticancer Agents by an Ester Bond Forming NRPS
Module
Yousong Ding,1,2,5,# Christopher M. Rath,1,# Kyle L. Bolduc,1,2 Kristina Håkansson,3
and David H. Sherman1,2,3,4* 1Life Sciences Institute, and Departments of 2Medicinal Chemistry, 3Chemistry,
4Microbiology & Immunology, University of Michigan, Ann Arbor, MI 48109;
5Division of Chemistry and Chemical Engineering, California Institute of Technology,
Pasadena, CA 91125.
Supplemental Materials and Methods
1. Protein expression and purification
Proteins were cloned and expressed using standard molecular biology and
biochemical techniques. Crp TE was cloned and expressed as previously described.1,2
CrpD-M2 gene was amplified by PCR with a forward primer with a restriction site of
BamHI (CAAGGATCCTTACGTACTACTAATAGCGCA) and a reverse primer with a
restriction site of XhoI (ATGCTCGAGTAGTTGTTGAATTGGTACTAATGG). The
amplicons were purified and digested for cloning into pET28a. The plasmid encoding N-
terminal His6-CrpD-M2 was transformed into E. coli BAP1 and grown at 37 °C in TB
medium to an OD600 of ~0.8 in 2 L flasks. The cultures were cooled to 18 °C, and
isopropyl β-D-thiogalactopyranoside was added to a final concentration of 0.2 mM and
grown for additional 12-16 h with shaking. The cells were harvested by centrifugation
and frozen at -20 °C. Cell pellets were thawed to 4 °C and resuspended in 5X volume of
S1
lysis buffer (20 mM HEPES, pH 7.8, 300 mM NaCl, 20 mM imidazole, 1 mM MgCl2,
0.7 mM Tris(2-carboxyethyl) phosphine (TCEP), ~100 mg CelLytic Express (Thermo,
Rockfield, IL) before lysis via sonication. Centrifugation at 25,000 x g for 60 min
provided clarified lysates. Proteins were purified using Ni-Sepharose affinity
chromatography with a gravity column. Briefly, after filtration of the supernatant through
a 0.45 μm membrane, the solution was loaded onto a 5 mL HisTrap nickel-nitrilotriacetic
acid column. The column was washed with 10 column volumes of buffer A (20 mM
HEPES, pH 7.8, 300 mM NaCl, 20 mM imidazole, 1 mM TCEP, 10% glycerol), 10
column volumes of buffer B (20 mM HEPES, pH 7.8, 300 mM NaCl, 50 mM imidazole,
1 mM TCEP, 10% glycerol), and then eluted with buffer C (20 mM HEPES, pH 7.8, 300
mM NaCl, 400 mM imidazole, 1 mM TCEP, 10% glycerol). Protein containing fractions
were pooled and desalted with pre-equilibrated PD-10 gravity flow columns in storage
buffer (20 mM HEPES, pH 7.4, 150 mM NaCl, 1 mM TCEP, 10% glycerol). Fractions
were combined, concentrated, frozen, and stored at -80 °C. Purity estimate of 80% was
based on SDS-PAGE (Figure S2).
2. Analysis of purified CrpD-M2 by FTICR-MS
CrpD-M2 integrity was determined by peptide map fingerprinting. Briefly, CrpD-
M2 was reduced (10 mM DTT, 50 oC 30 min) and digested with trypsin (TPCK
modified, Thermo, Rockfield, IL). The sample was desalted with Handee Microspin
columns (Thermo, Rockfield, IL) packed with 20 μL of 300 Å polymeric C4 resin
(Grace-Vydac, Deerfield, IL). Samples were loaded onto the columns and washed with
30 column volumes of 0.1% formic acid prior to elution with 10 column volumes of 50%
S2
acetonitrile plus 0.1% formic acid. Peptides were then introduced into the FTICR-MS
(described below) at a rate of 70 µL/hour with direct infusion. Peaks were identified with
the THRASH algorithm as implemented in MIDAS data analysis workstation (National
High Magnetic Field Laboratory, Tallahassee, FL). Peaks were matched against a
theoretical digest of CrpD-M2 (Protein Prospector, UCSF, San Francisco, CA) with a
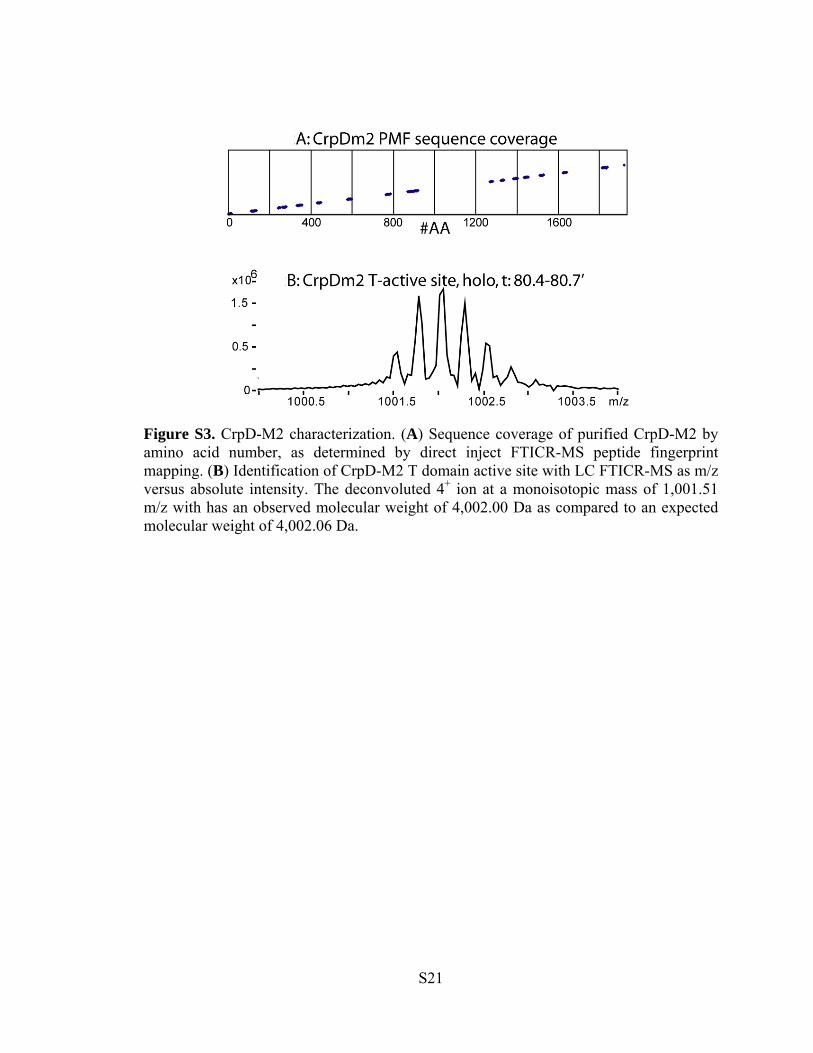
tolerance of ±20 ppm. Note that the low sequence coverage observed is not surprising
due to lack of LC separation, however, sequence coverage is obtained from residue 3-
1,922 out of 1,964 suggesting that the purified protein is full-length (Figure S3).
Identified peptides are presented in Table S1.
3. ATP-[32P] PPi exchange assay
The exchange assay for determining A domain substrate specificity was
conducted using modified protocol.3 All acid substrates used in the assay were purchased
from Sigma (St. Louis, MO). The reaction mixture (100 µL) contained 75 mM Tris-Cl,
pH 7.5, 10 mM Mg Cl2, 5 mM TCEP, 5 mM ATP, 1 mM tetrasodium pyrophosphate
(PPi), 5 mM free acid substrate, and 0.5 µCi tetrasodium [32P] PPi (Perkin Elmer, Boston,
MA). The ATP-PPi exchange was initiated by adding 1 µM of CrpD-M2 and allowed to
proceed for 10 minutes at room temperature. The reaction was then terminated by the
addition of cold charcoal solution (500 µL, 1.6% w/v activated charcoal, 0.1 M
tetrasodium pyrophosphate, and 5% perchloric acid in water). Free [32P]-PPi was
removed by centrifugation of the sample, and washing the charcoal pellet twice with
wash buffer (0.1 M tetrasodium pyrophosphate, and 5% perchloric acid in water). The
charcoal was finally resuspended in water (500 µL) and the bound radioactivity was
S3
determined by scintillation counting on a Beckman LS6500 (Fullerton, CA). All
experiments were carried out in duplicate for each substrate with a negative control
without enzyme.
4. Biochemical reactions and LC FTICR-MS2 analysis
Enzymatic reaction conditions were as follows: 100 mM Tris-Cl, pH 7.5, 10 mM
MgCl2, 5 mM ATP, 1 mM TCEP, 500 µM free-acid extender unit, 100 µM SNAC-ABC
chain elongation intermediate, 1 mM NADH, 1 mM NADPH, 1 µM CrpD-M2, and 1 µM
Crp TE. Reaction components were excluded as appropriate (eg. no enzyme for no
enzyme control reactions, no chain elongation intermediate for PPi adenylation domain
assays).
For T-domain active site loading experiments samples were incubated for 60
minutes at room temperature. Reactions were raised to pH 8 by the addition of
concentrated Tris-base, after 4X dilution in 100 mM ammonium bicarbonate. Trypsin
(TPCK-modified, Thermo, Rockfield, IL) at 1 mg/mL was added to a molar ratio of 10:1
(CrpD-M2:trypsin). Samples were incubated at 37 °C for 15 minutes, prior to addition of
10% formic acid to pH 4. Reactions were stored at -80 °C until analysis. The CrpD-M2
T domain active site (QLVEIFQEVLNLPSIGIHDNFFSLGGHSLLAVR) was first
identified by accurate mass using LC FTICR-MS (Figure S3B). After the tryptic
peptide's retention time (80-81 minutes) and the most abundant charge state (4+, 1001.5
m/z) were identified, online MS2 was performed using external quadruple isolation and
IRMPD1,2 in the FTICR cell for ion activation. The phosphopantetheine ejection ions
specific markers for the post-translational modification were observed at 261.1 m/z (Ppt1)
S4
and 359.1 m/z (Ppt2).1,2 In addition, the apo T-domain, charge-reduced, parent containing
the residual phosphate (+80) or dehydroalanine (-18) was also observed. A short
sequence of b-ions was observed, and added to the confirmation of peptide identity.
Identified parent and product ions are shown in Table S2, and the parent ion mass
spectrum is shown in Figure S3B.
Liquid chromatography of trypsin digested CrpD-M2 was performed on an
Agilent 1100 with a Jupiter C18 300 Å 1 x 150 mm column (Phenomenex, Torrence, CA)
at a rate of 75 µL/min using a column heater at 50 °C. Twenty µL of sample was injected
followed by an LC gradient: 2% solvent B 0-20 min, to 60% solvent B at 90 min, to 98%
solvent B 105'-108', back to 2% B at 110', and equilibrated at 2% B for 10 minutes.
Mobile phase A was water with 0.1% formic acid, and mobile phase B consisted of
acetonitrile with 0.1% formic acid.
FTICR-MS (APEX-Q with Apollo II ion source and actively shielded 7 T magnet;
Bruker Daltonics, Ballerica, MA) was conducted in positive ion mode from m/z 200–
2,000. Electrospray was conducted at 3,000-4,000 V 16-30 scan per spectra utilizing 1 s
external ion accumulation in the hexapole prior to analysis in the FTICR using a loop
value of 4 for direct inject samples. For online LC FTICR-MS external ion accumulation
time was set to 0.33 s with 1 scan per spectra and 128 K signal detected. Collision cell
pressure was kept at 5.8e-6 torr and either CID or IRMPD was utilized for MS2. LC-
FTICR MS data was processed in Data Analysis (Bruker Daltonics, Ballerica, MA) and
using DECON2LS and VIPER (Pacific Northwest National Labs, Richland, WA) for
online THRASH analysis. Protein Prospector (UCSF, San Francisco, CA) was used to
S5
assist with manual assignment of MSn data. All experiments were performed at least
twice to verify the findings.
5. Determination of CrpD-M2 active site loading
The CrpD-M2 T domain active site peptide as identified above, was then loaded
with the substrates: L-2HIC, D-2HIC, AKGB, and 2-KIC. Peaks were initially identified
through LC FITCR-MS using accurate mass. For online confirmation of peak identity the
same LC gradient (described above) was run using a Thermo LTQ linear ion trap (LIT)
MS. Product peaks were subjected to MS2 (phosphopantetheine ejection assay) and MS3
(apo T-domain, charge-reduced, parent containing the residual dehydroalanine (-18) as
precursor) for further confirmation.1,2 Notably, the phosphopantetheine ejection assay
performed well on the low resolution instrument, as previously reported.4 See Table S4
for LC FTICR-MS and Table S5 for LC LIT-MS results. The loading and reaction of
substrates on the CrpD-M2 T domain was monitored by looking for mass shifts to the
loaded T-domain peptide by LC FITCR-MS. Identified peaks were verified by online
MS2 and MS3 experiments using a LIT-MS.
Linear ion trap mass spectrometry was performed using an LTQ (Thermo,
Rockfield, IL). A number of data independent scans were defined for each sample
including: a survey scan, MS2 fragmentation of the target T-domain peptide in the 3+ and
4+ charge state, and MS3 of the charge reduced Apo - 18 products from the MS2 scans.
An isolation window of 4 m/z was utilized, with normalized collision energy of 40%.
Xcaliber (Thermo, Rockfield, IL) was used for initial data processing, followed by
Protein Prospector (UCSF, San Francisco, CA) for fragmentation assignments.
S6
6. Cryptophycin MS and MS2 The cryptophycin products were generated by reacting CrpD-M2, SNAC-ABC
chain elongation intermediates, unit D extender units, ATP, and Crp TE together as
described above. After 60 minutes, the proteins were removed by precipitation with 3
volumes of methanol, pelleted by centrifugation, and the reactions were injected into the
LC FTICR-MS (described above). Online MS2 CID spectra were assigned to
cryptophycin 3 and 51 (Figure S6). Product spectra were interpreted manually using
cryptophycin 3 as a standard based on coelution with an authentic standard (Figure S7).
Cyclic peptide product ion assignment was aided by tools developed in the Dorrestein
and Pevzner laboratories.5,6 Cryptophycin MS2 CID fragmentation spectra were assigned
with the assumption that fragmentation would occur across the most labile bonds in the
gas phase—amide and ester linkages.5,6 This characteristic breaks cryptophycin into the
A, B, C, and D unit constituents with associated water (+/- 18), ammonia (- 17) and CO (-
28) based mass shifts. Two key spectral features are present: the +14 Da shift of the CD +
H2O, ABC - 18, and MH+ ions between cryptophycin 3 (Figure S6A) and 51 (Figure
S6B),—corresponding exactly to the one methyl group difference due to the different unit
C moieties. This diagnostic feature helps to validate both spectral assignments.
7. Cryptophycin 3 authentic standard elution An authentic standard of cryptophycin 3 was used to verify the identity of
chemoenzymatically generated cryptophycin 3 by HPLC co-elution analysis. A
SHIMADZU LCMS-2010EV system (Columbia, MD) was used for HPLC separation
with a detection wavelength of 218 nm. The product separation was carried out with a
S7
Waters XBridge C18 (3.5 µm, 2.1 × 150 mm) column (Milford, MA) at a flow rate of 200
µL/min. Solvent B (acetonitrile with 0.1% formic acid) gradually increased from 50% to
99% and solvent A was water with 0.1% formic acid.
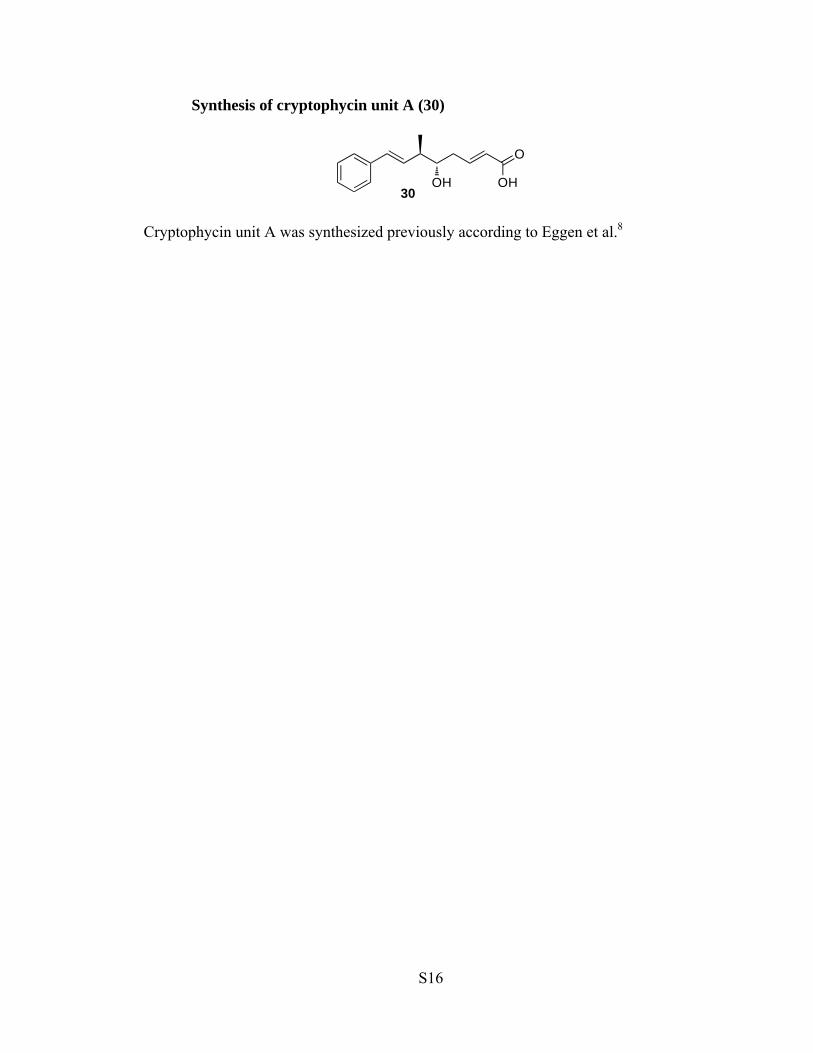
8. Synthesis of SNAC-ABC cryptophycin elongation intermediates (Scheme 1).
Scheme 1. Synthesis of SNAC-ABC cryptophycin elongation intermediates.
Materials and Methods. Unless otherwise stated, all reactions were performed
with no extra precautions taken to exclude moisture or air. Boc-β-Ala-OH was purchased
from Advanced ChemTech (Lousville, KY), (R)-3-(Boc-amino)-2-methylpropionic acid
was purchased from Sigma (St. Louis, MO), and Boc-3-amino-2,2-dimethyl-propionic
acid was purchased from PolyPeptide (San Diego, CA). Solvents were purchased as ACS
S8
Grade (CH2Cl2, DMF, and MeOH) from Sigma (St. Louis, MO) or Thermo (Rockfield,
IL) and used as received. N-acetylcysteamine (SNAC), 1-ethyl-3-(3-
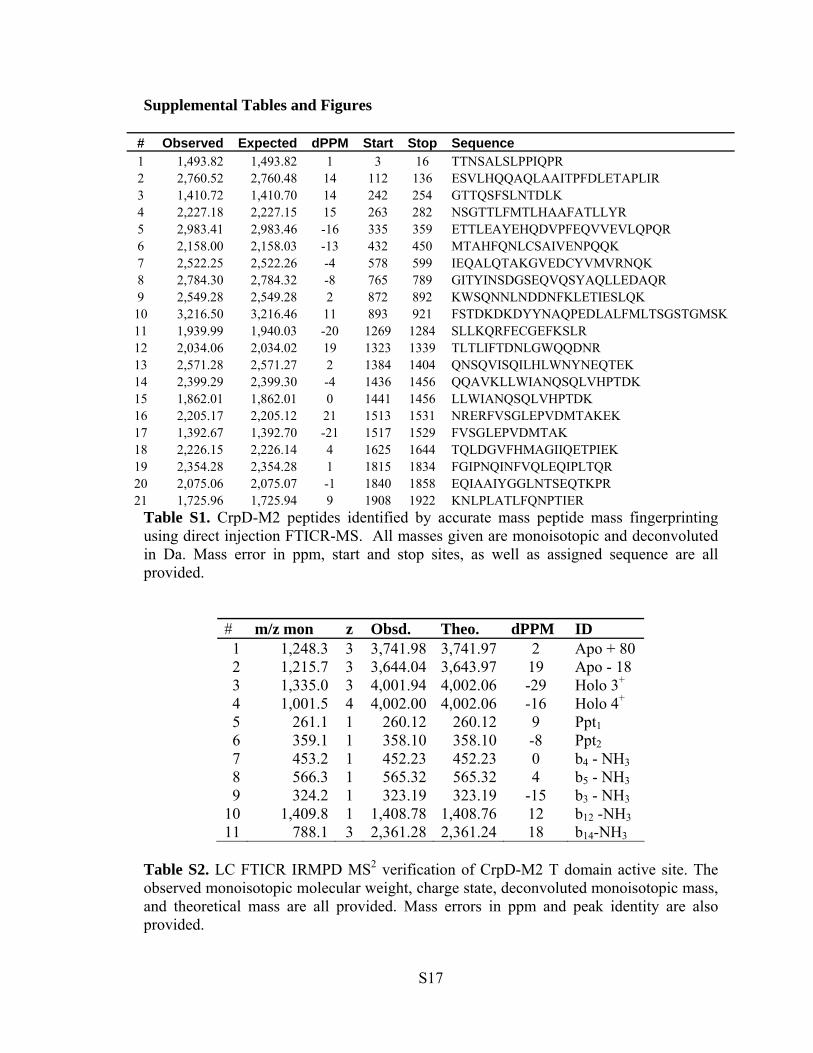
Table S1. CrpD-M2 peptides identified by accurate mass peptide mass fingerprinting using direct injection FTICR-MS. All masses given are monoisotopic and deconvoluted in Da. Mass error in ppm, start and stop sites, as well as assigned sequence are all provided.
Table S2. LC FTICR IRMPD MS2 verification of CrpD-M2 T domain active site. The observed monoisotopic molecular weight, charge state, deconvoluted monoisotopic mass, and theoretical mass are all provided. Mass errors in ppm and peak identity are also provided.
S17
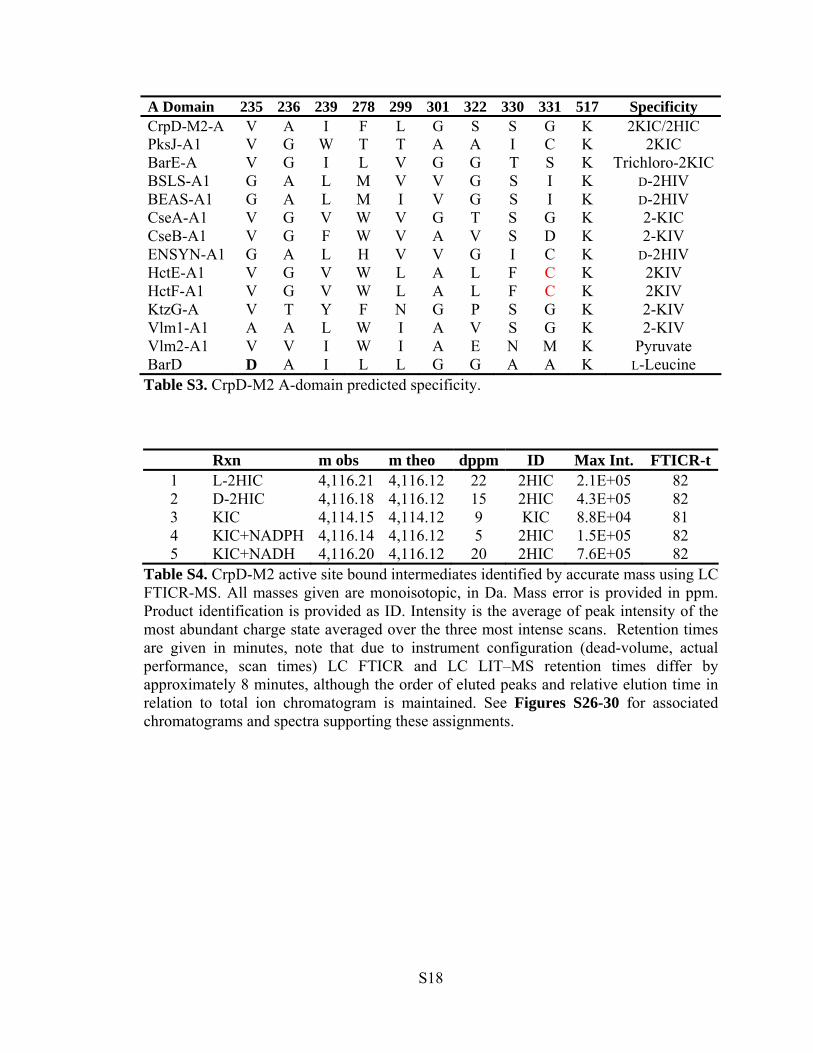
A Domain 235 236 239 278 299 301 322 330 331 517 Specificity CrpD-M2-A V A I F L G S S G K 2KIC/2HIC PksJ-A1 V G W T T A A I C K 2KIC BarE-A V G I L V G G T S K Trichloro-2KICBSLS-A1 G A L M V V G S I K D-2HIV BEAS-A1 G A L M I V G S I K D-2HIV CseA-A1 V G V W V G T S G K 2-KIC CseB-A1 V G F W V A V S D K 2-KIV ENSYN-A1 G A L H V V G I C K D-2HIV HctE-A1 V G V W L A L F C K 2KIV HctF-A1 V G V W L A L F C K 2KIV KtzG-A V T Y F N G P S G K 2-KIV Vlm1-A1 A A L W I A V S G K 2-KIV Vlm2-A1 V V I W I A E N M K Pyruvate BarD D A I L L G G A A K L-Leucine Table S3. CrpD-M2 A-domain predicted specificity. Rxn m obs m theo dppm ID Max Int. FTICR-t
Table S4. CrpD-M2 active site bound intermediates identified by accurate mass using LC FTICR-MS. All masses given are monoisotopic, in Da. Mass error is provided in ppm. Product identification is provided as ID. Intensity is the average of peak intensity of the most abundant charge state averaged over the three most intense scans. Retention times are given in minutes, note that due to instrument configuration (dead-volume, actual performance, scan times) LC FTICR and LC LIT–MS retention times differ by approximately 8 minutes, although the order of eluted peaks and relative elution time in relation to total ion chromatogram is maintained. See Figures S26-30 for associated chromatograms and spectra supporting these assignments.
S18
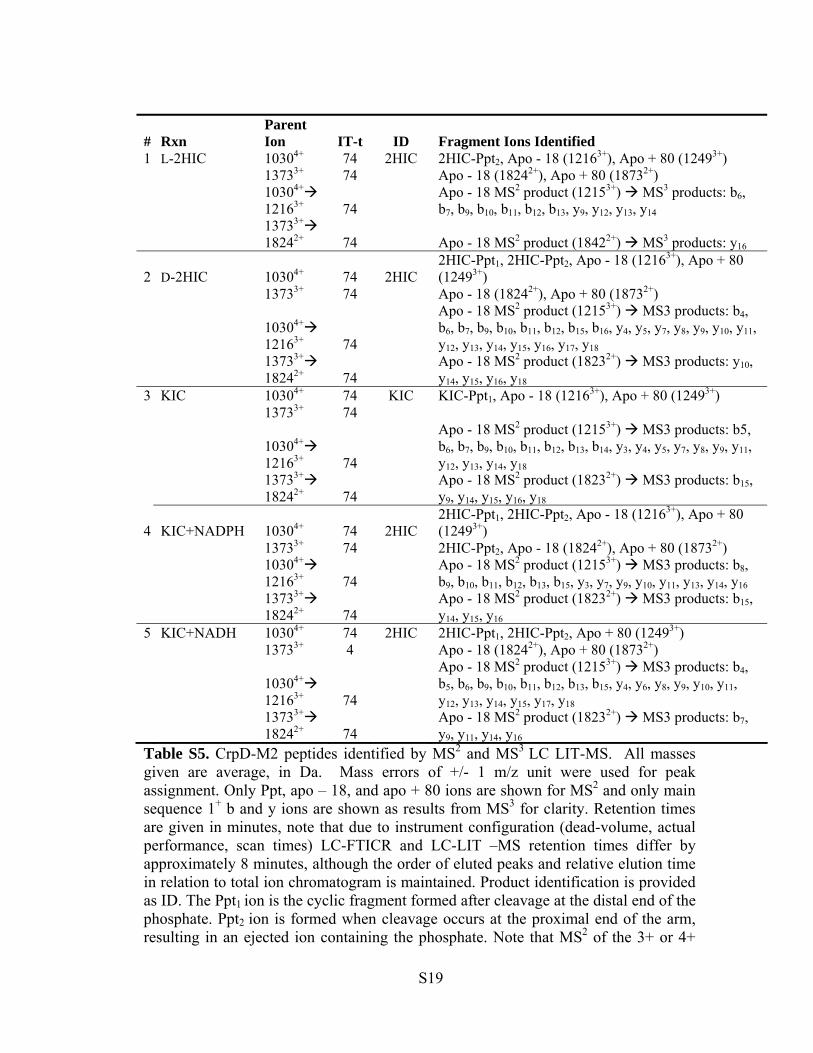
# Rxn Parent Ion IT-t ID Fragment Ions Identified
1 L-2HIC 10304+ 74 2HIC 2HIC-Ppt2, Apo - 18 (12163+), Apo + 80 (12493+) 13733+ 74 Apo - 18 (18242+), Apo + 80 (18732+)
Table S5. CrpD-M2 peptides identified by MS2 and MS3 LC LIT-MS. All masses given are average, in Da. Mass errors of +/- 1 m/z unit were used for peak assignment. Only Ppt, apo – 18, and apo + 80 ions are shown for MS2 and only main sequence 1+ b and y ions are shown as results from MS3 for clarity. Retention times are given in minutes, note that due to instrument configuration (dead-volume, actual performance, scan times) LC-FTICR and LC-LIT –MS retention times differ by approximately 8 minutes, although the order of eluted peaks and relative elution time in relation to total ion chromatogram is maintained. Product identification is provided as ID. The Ppt1 ion is the cyclic fragment formed after cleavage at the distal end of the phosphate. Ppt2 ion is formed when cleavage occurs at the proximal end of the arm, resulting in an ejected ion containing the phosphate. Note that MS2 of the 3+ or 4+
S19
parent predominantly give phosphopantetheine ejection ions, apo - 18, and apo + 18 charge reduced species. MS3 fragmentation of the Apo -18 peaks result in a, b and y ion series sufficient for peak identification. See Figures 31-35 for further information.
Figure S1. Chemical structures of natural cryptophycin analogs. Cryptopycin-1 is comprised of four units linked in clockwise order of δ-hydroxyoctenoic acid (unit A), 3-chloro O-methyl-D-tyrosine (unit B), methyl-β-alanine (unit C), and L-leucic acid (unit D). Several cryptophycin analogs carrying variable unit D moieties are also shown.
Figure S2. 4-12 % SDS-PAGE analysis of N-terminally His-tagged CrpD-M2 after Ni-NTA resin.
S20
Figure S3. CrpD-M2 characterization. (A) Sequence coverage of purified CrpD-M2 by amino acid number, as determined by direct inject FTICR-MS peptide fingerprint mapping. (B) Identification of CrpD-M2 T domain active site with LC FTICR-MS as m/z versus absolute intensity. The deconvoluted 4+ ion at a monoisotopic mass of 1,001.51 m/z with has an observed molecular weight of 4,002.00 Da as compared to an expected molecular weight of 4,002.06 Da.
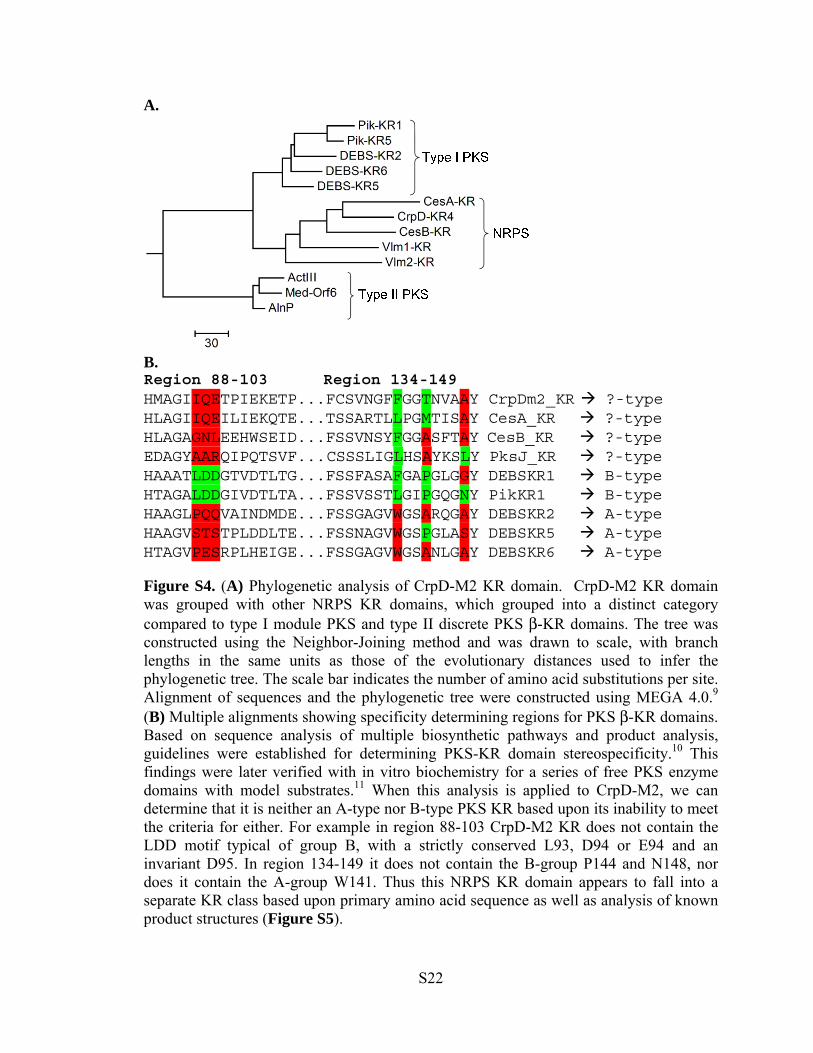
Figure S4. (A) Phylogenetic analysis of CrpD-M2 KR domain. CrpD-M2 KR domain was grouped with other NRPS KR domains, which grouped into a distinct category compared to type I module PKS and type II discrete PKS β-KR domains. The tree was constructed using the Neighbor-Joining method and was drawn to scale, with branch lengths in the same units as those of the evolutionary distances used to infer the phylogenetic tree. The scale bar indicates the number of amino acid substitutions per site. Alignment of sequences and the phylogenetic tree were constructed using MEGA 4.0.9 (B) Multiple alignments showing specificity determining regions for PKS β-KR domains. Based on sequence analysis of multiple biosynthetic pathways and product analysis, guidelines were established for determining PKS-KR domain stereospecificity.10 This findings were later verified with in vitro biochemistry for a series of free PKS enzyme domains with model substrates.11 When this analysis is applied to CrpD-M2, we can determine that it is neither an A-type nor B-type PKS KR based upon its inability to meet the criteria for either. For example in region 88-103 CrpD-M2 KR does not contain the LDD motif typical of group B, with a strictly conserved L93, D94 or E94 and an invariant D95. In region 134-149 it does not contain the B-group P144 and N148, nor does it contain the A-group W141. Thus this NRPS KR domain appears to fall into a separate KR class based upon primary amino acid sequence as well as analysis of known product structures (Figure S5).
S22
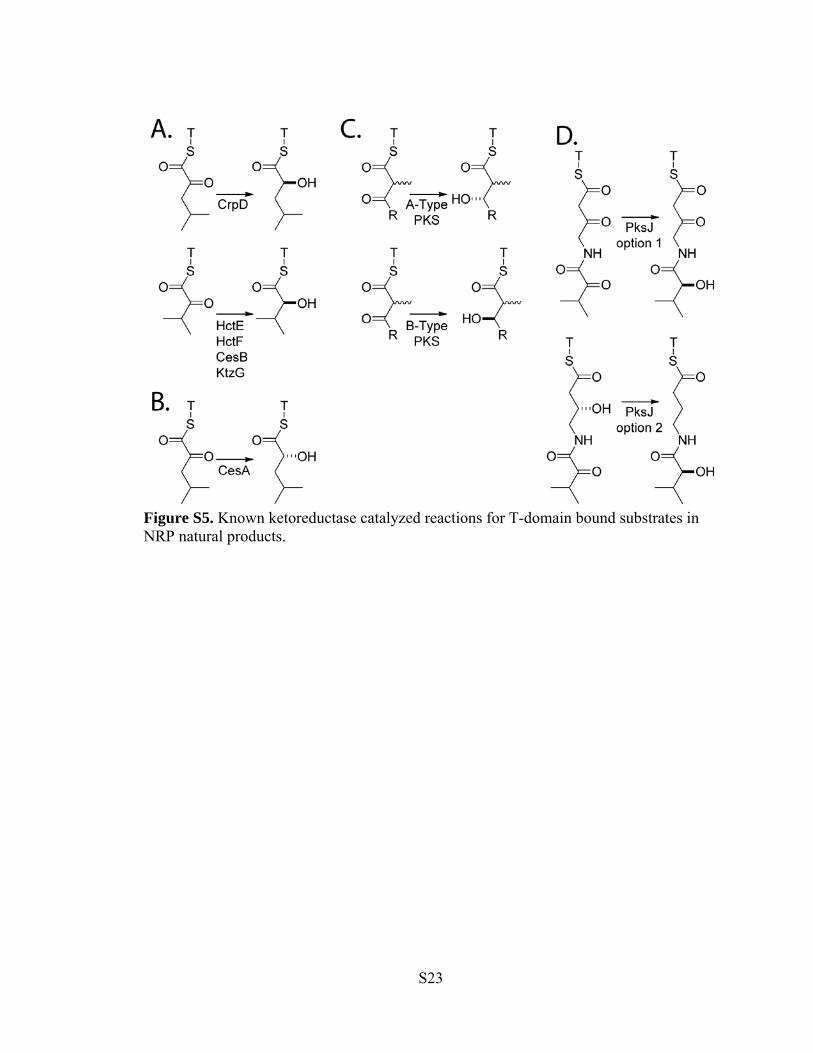
Figure S5. Known ketoreductase catalyzed reactions for T-domain bound substrates in NRP natural products.
S23
Figure S6. LC FTICR-MS2 spectra of cryptophycins. Data are presented as m/z versus absolute signal. (A) cryptophycin 3 CID MS2 fragmentation spectra. (B) cryptophycin 51 CID MS2 fragmentation spectra. Assigned ions are denoted in blue. Key ions are noted in red, with the mass shift in green. Mass errors and observed MH+ values are also provided. All assigned peaks were within 15 ppm of the theoretical value. All unit B containing peaks had the predicted 37Cl +2 isotope profile.
Figure S7. Crp 3 HPLC co-elution analysis with authentic standard. (A) A negative control reaction (ATP, L-2HIC extender unit, SNAC-ABC chain elongation intermediate (3-amino-2(R)-methylpropionyl, 3), and boiled enzymes (CrpD-M2 and Crp TE). (B) A full reaction (ATP, L-2HIC extender unit, SNAC-ABC chain elongation intermediate (3-amino-2(R)-methylpropionyl, 3), CrpD-M2, and Crp TE). (C) Authentic standard of cryptophycin 3.
S24
Figu
re S
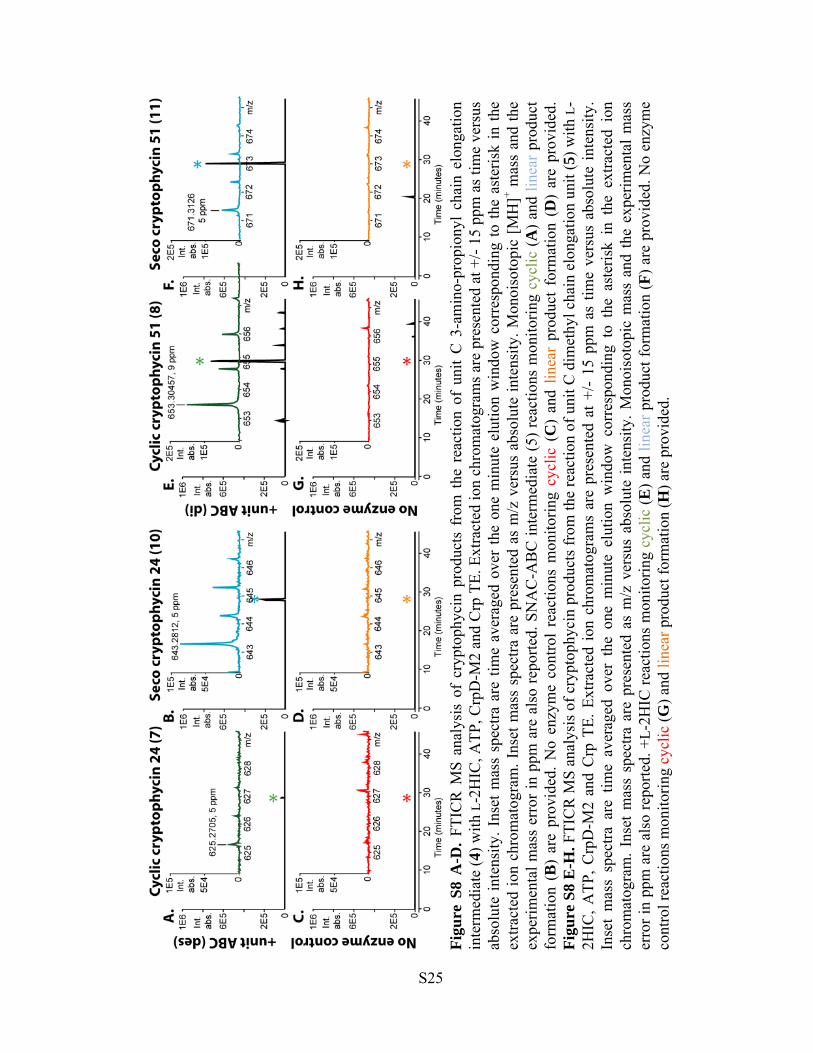
8 A
-D. F
TIC
R M
S an
alys
is o
f cr
ypto
phyc
in p
rodu
cts
from
the
rea
ctio
n of
uni
t C
3-a
min
o-pr
opio
nyl
chai
n el
onga
tion
inte
rmed
iate
(4) w
ith L
-2H
IC, A
TP, C
rpD
-M2
and
Crp
TE.
Ext
ract
ed io
n ch
rom
atog
ram
s are
pre
sent
ed a
t +/-
15 p
pm a
s tim
e ve
rsus
ab
solu
te in
tens
ity. I
nset
mas
s sp
ectra
are
tim
e av
erag
ed o
ver
the
one
min
ute
elut
ion
win
dow
cor
resp
ondi
ng to
the
aste
risk
in th
e ex
tract
ed io
n ch
rom
atog
ram
. Ins
et m
ass
spec
tra a
re p
rese
nted
as
m/z
ver
sus
abso
lute
inte
nsity
. Mon
oiso
topi
c [M
H]+ m
ass
and
the
expe
rimen
tal m
ass
erro
r in
ppm
are
als
o re
porte
d. S
NA
C-A
BC
inte
rmed
iate
(5) r
eact
ions
mon
itorin
g cy
clic
(A) a
nd li
near
pro
duct
fo
rmat
ion
(B)
are
prov
ided
. No
enzy
me
cont
rol
reac
tions
mon
itorin
g cy
clic
(C
) an
d lin
ear
prod
uct
form
atio
n (D
) ar
e pr
ovid
ed.
Figu
re S
8 E
-H. F
TIC
R M
S an
alys
is o
f cry
ptop
hyci
n pr
oduc
ts fr
om th
e re
actio
n of
uni
t C d
imet
hyl c
hain
elo
ngat
ion
unit
(5) w
ith L
-2H
IC, A
TP, C
rpD
-M2
and
Crp
TE.
Ext
ract
ed io
n ch
rom
atog
ram
s ar
e pr
esen
ted
at +
/- 15
ppm
as
time
vers
us a
bsol
ute
inte
nsity
. In
set
mas
s sp
ectra
are
tim
e av
erag
ed o
ver
the
one
min
ute
elut
ion
win
dow
cor
resp
ondi
ng t
o th
e as
teris
k in
the
ext
ract
ed i
on
chro
mat
ogra
m. I
nset
mas
s sp
ectra
are
pre
sent
ed a
s m
/z v
ersu
s ab
solu
te in
tens
ity. M
onoi
soto
pic
mas
s an
d th
e ex
perim
enta
l mas
s er
ror i
n pp
m a
re a
lso
repo
rted.
+L-
2HIC
reac
tions
mon
itorin
g cy
clic
(E) a
nd li
near
pro
duct
form
atio
n (F
) are
pro
vide
d. N
o en
zym
e co
ntro
l rea
ctio
ns m
onito
ring
cycl
ic (G
) and
line
ar p
rodu
ct fo
rmat
ion
(H) a
re p
rovi
ded.
S25
AcH
NS
O
N H
O
MeO
Cl
H N
OO
H
AcH
NS
O
N H
O
MeO
Cl
H N
OO
H
Figu
re S
9. 13
C N
MR
spec
trum
of c
ompo
und
3 (C
D3O
D).
S26
AcH
NS
O
N H
O
MeO
Cl
H N
OO
H
AcH
NS
O
N H
O
MeO
Cl
H N
OO
H
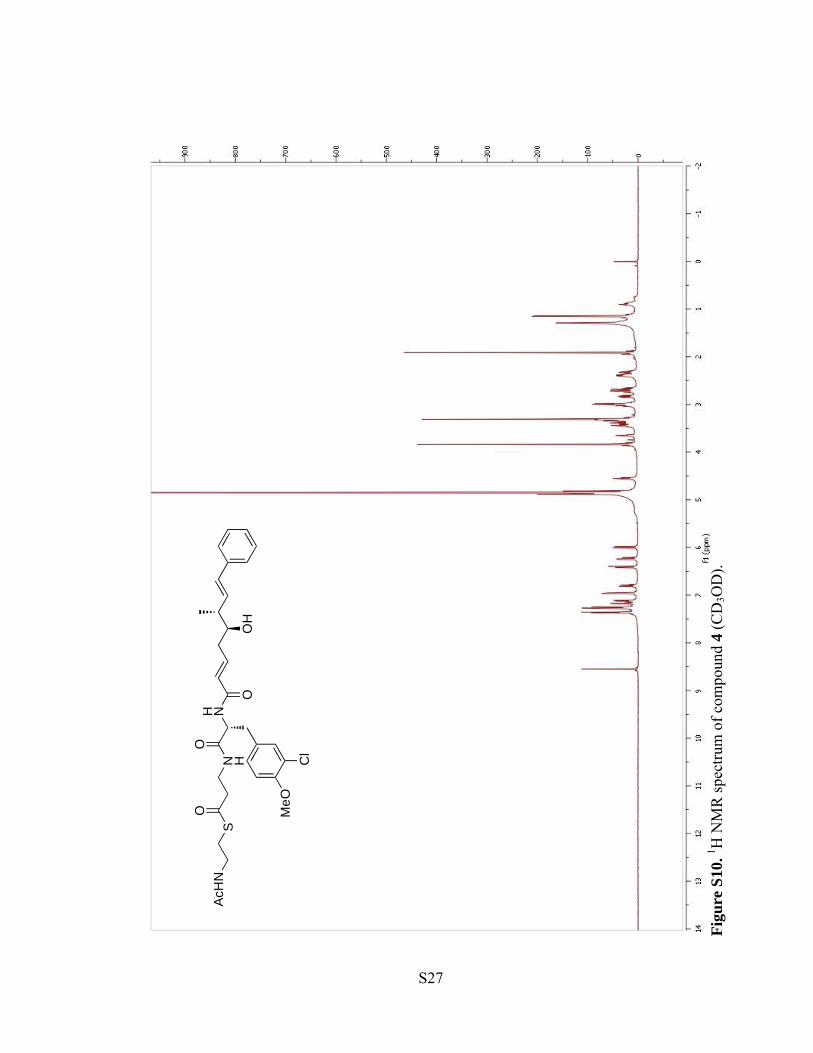
Figu
re S
10. 1 H
NM
R sp
ectru
m o
f com
poun
d 4
(CD
3OD
).
S27
AcH
NS
O
N H
O
MeO
Cl
H N
OO
H
Figu
re S
11. 13
C N
MR
spec
trum
of c
ompo
und
4 (C
D3O
D).
S28
AcH
NS
O
N H
O
MeO
Cl
H N
OO
H
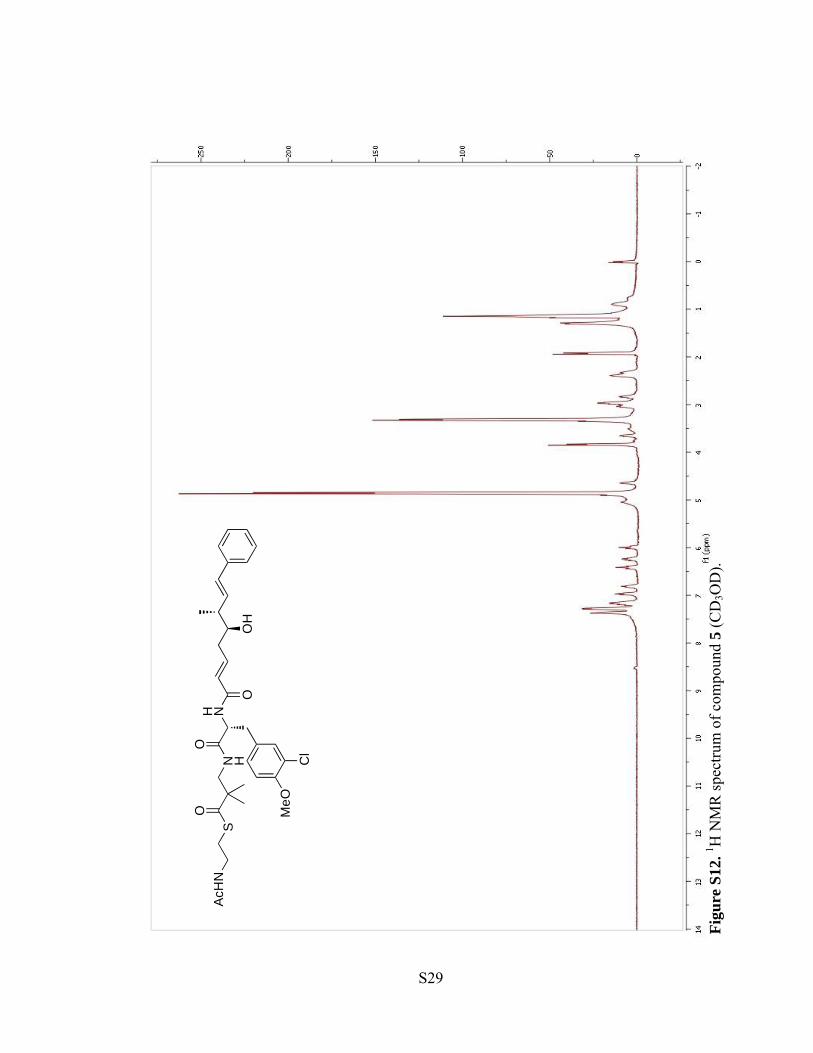
Figu
re S
12. 1 H
NM
R sp
ectru
m o
f com
poun
d 5
(CD
3OD
).
S29
AcH
NS
O
N H
O
MeO
Cl
H N
OO
H
Figu
re S
13. 13
C N
MR
spec
trum
of c
ompo
und
5 (C
D3O
D).
S30
AcH
NS
O
NH
Boc
Figu
re S
14. 1 H
NM
R sp
ectru
m o
f com
poun
d 23
(CD
Cl 3)
.
S31
AcH
NS
O
NH
Boc
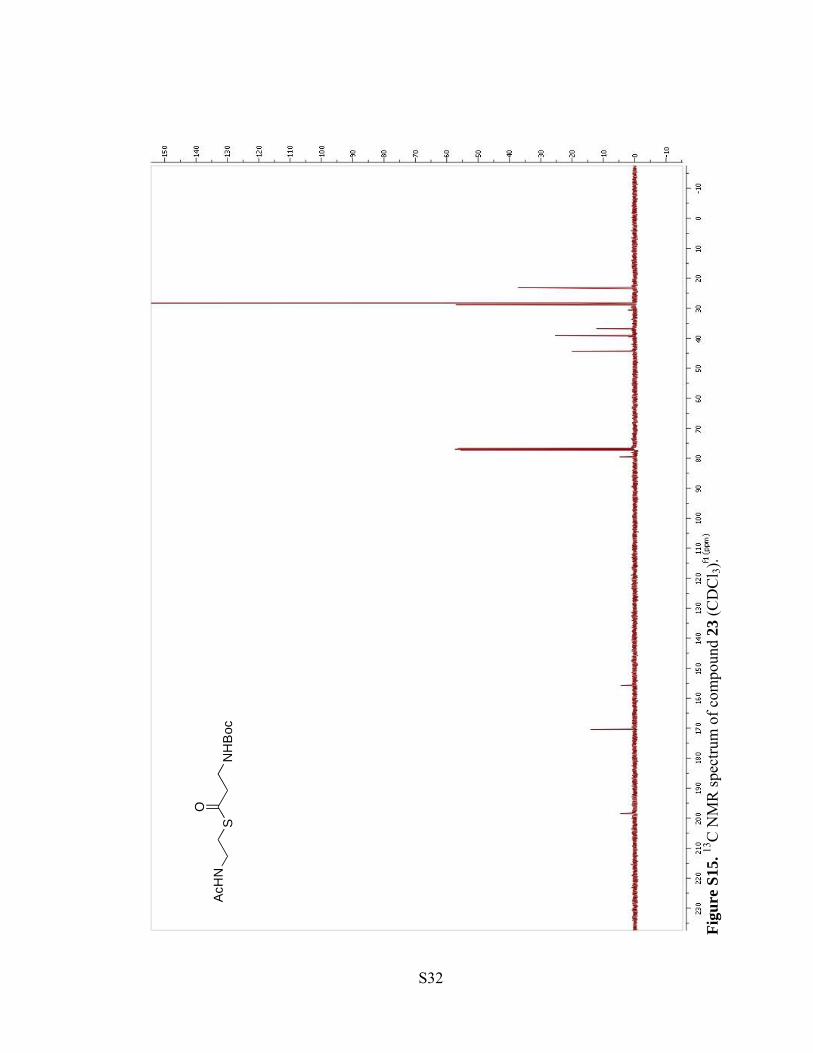
Figu
re S
15. 13
C N
MR
spec
trum
of c
ompo
und
23 (C
DC
l 3).
S32
AcH
NS
O
NH
Boc
Figu
re S
16. 1 H
NM
R sp
ectru
m o
f com
poun
d 24
(CD
Cl 3)
.
S33
AcH
NS
O
NH
Boc
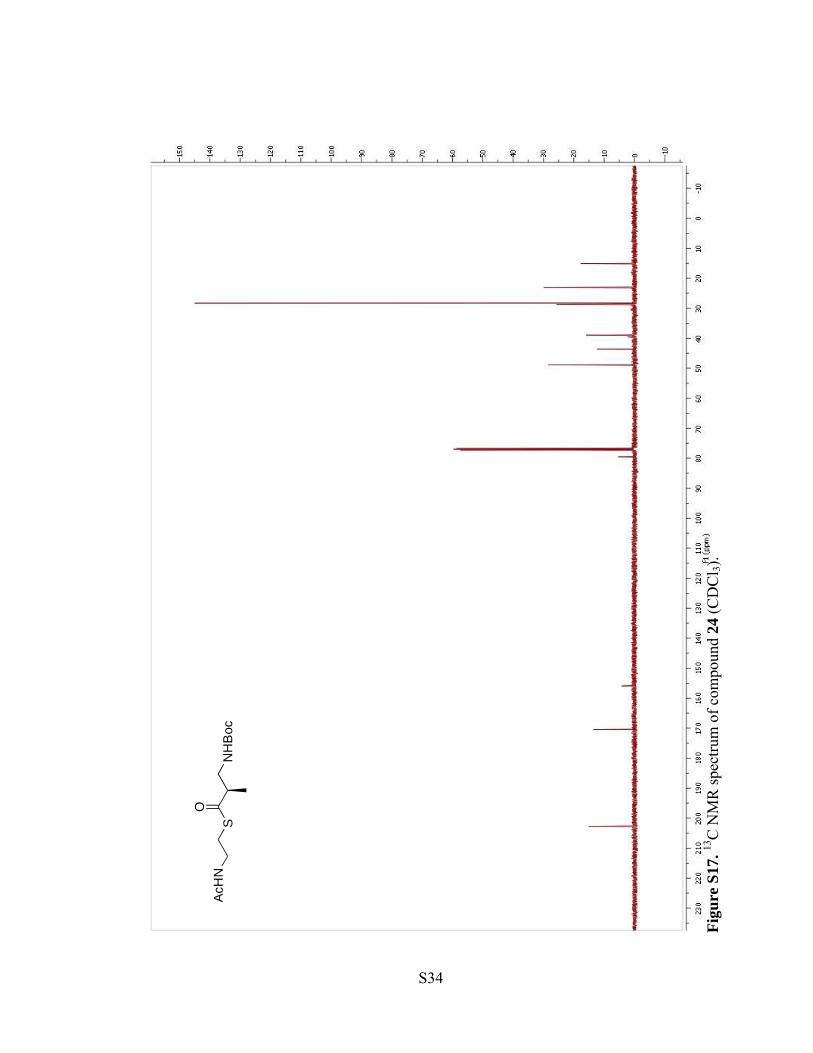
Figu
re S
17. 13
C N
MR
spec
trum
of c
ompo
und
24 (C
DC
l 3).
S34
AcH
NS
O
NH
Boc
Figu
re S
18. 1 H
NM
R o
f com
poun
d 25
(CD
Cl 3)
.
S35
AcH
NS
O
NH
Boc
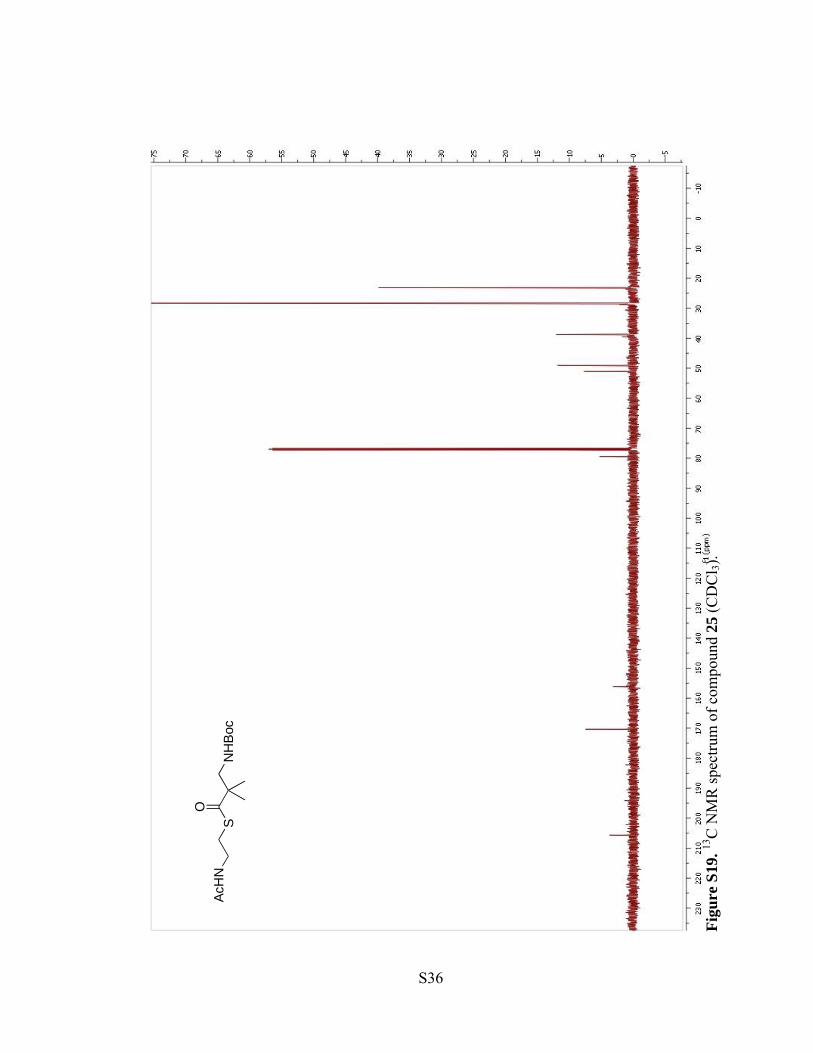
Figu
re S
19. 13
C N
MR
spec
trum
of c
ompo
und
25 (C
DC
l 3).
S36
AcH
NS
O
N H
ON
HB
oc
OM
eC
l
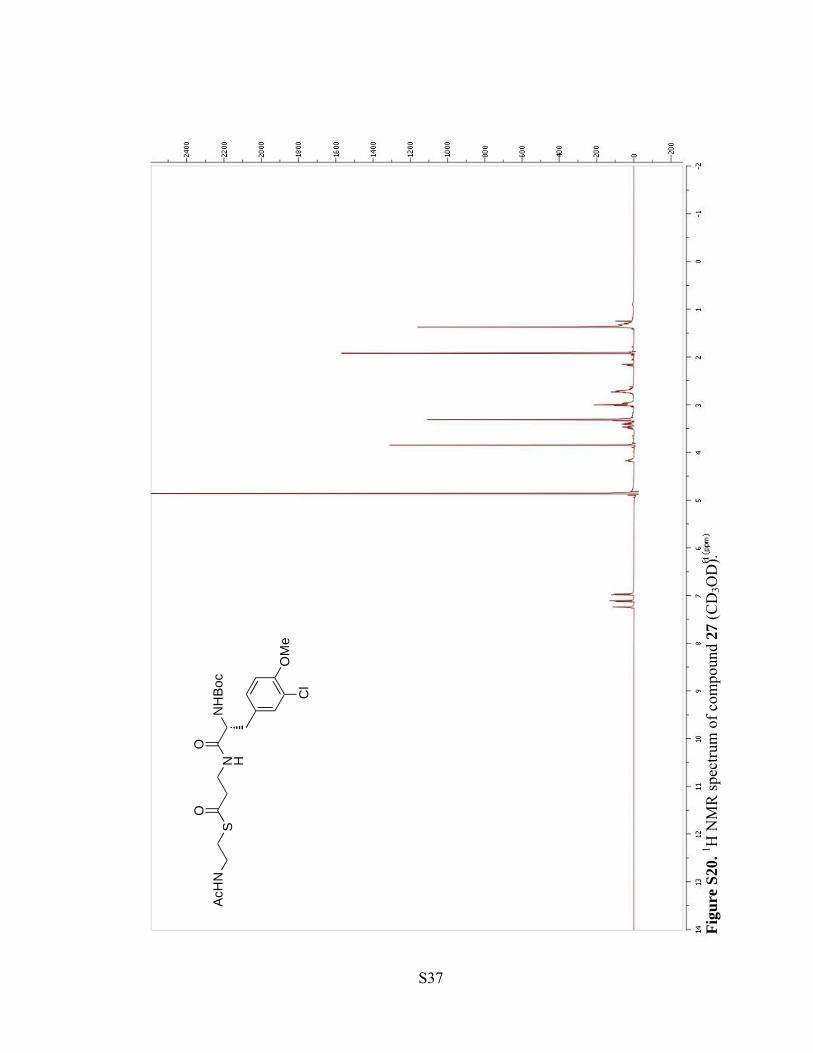
Figu
re S
20. 1 H
NM
R sp
ectru
m o
f com
poun
d 27
(CD
3OD
).
S37
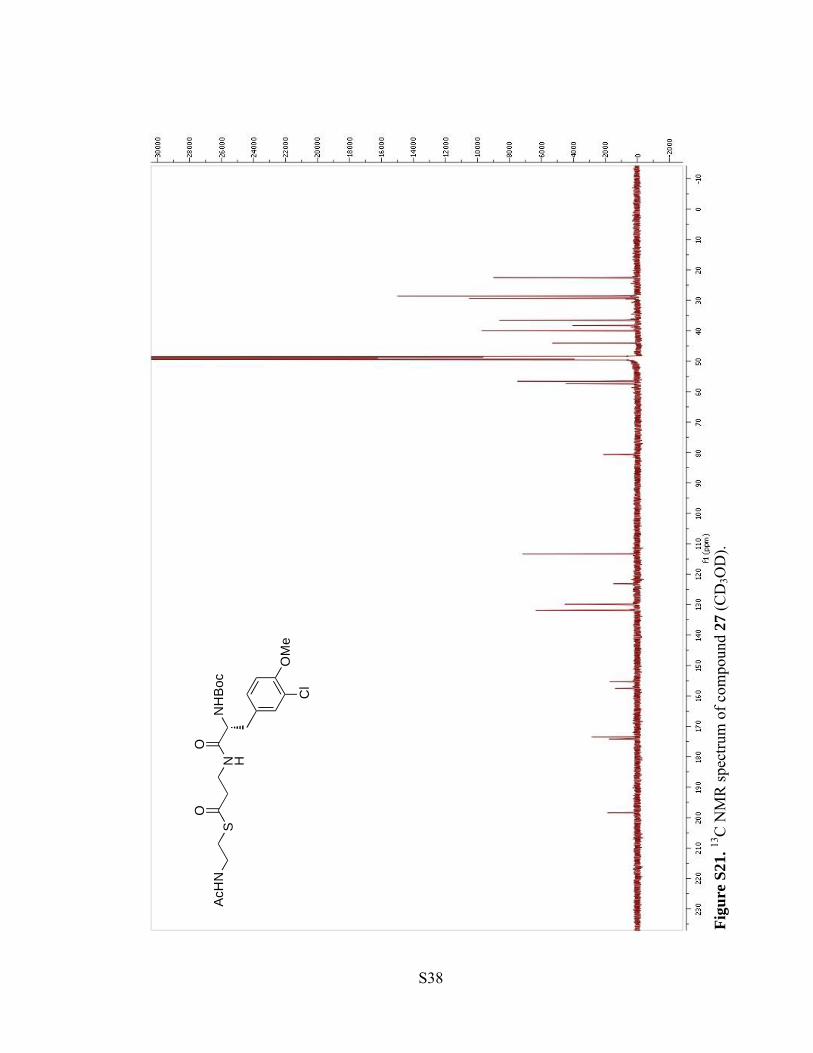
Figu
re S
21. 13
C N
MR
spec
trum
of c
ompo
und
27 (C
D3O
D).
AcH
NS
O
N H
ON
HB
oc
OM
eC
l
S38
AcH
NS
O
N H
ON
HB
oc
OM
eC
l
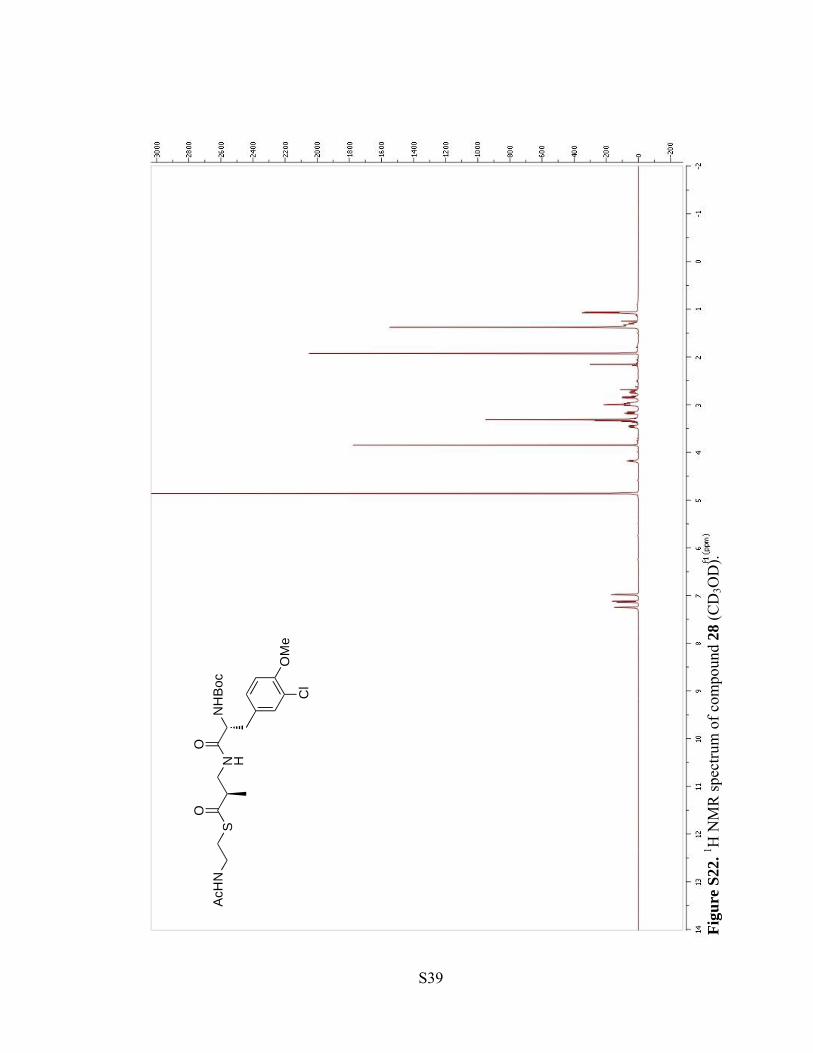
Figu
re S
22. 1 H
NM
R sp
ectru
m o
f com
poun
d 28
(CD
3OD
).
S39
AcH
NS
O
N H
ON
HB
oc
OM
eC
l
Figu
re S
23. 13
C N
MR
spec
trum
of c
ompo
und
28 (C
D3O
D).
S40
AcH
NS
O
N H
ON
HB
oc
OM
eC
l
Figu
re S
24. 1 H
NM
R sp
ectru
m o
f com
poun
d 29
(CD
3OD
).
S41
AcH
NS
O
N H
ON
HB
oc
OM
eC
l
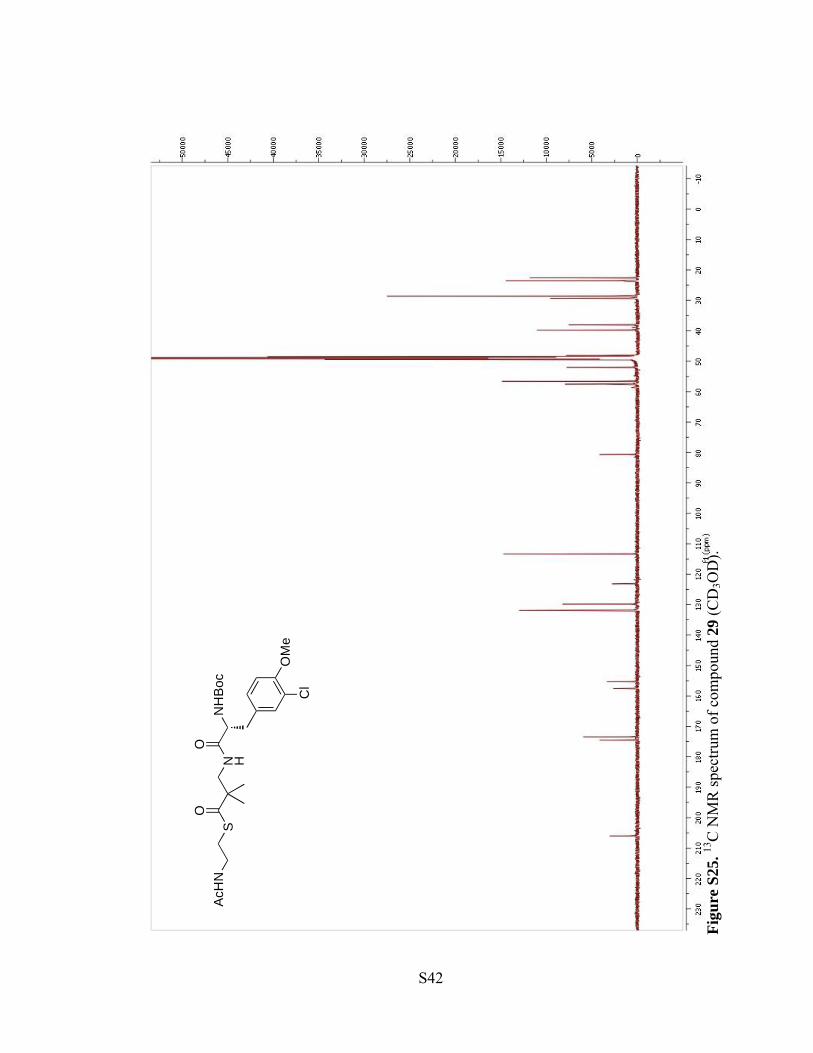
Figu
re S
25. 13
C N
MR
spec
trum
of c
ompo
und
29 (C
D3O
D).
S42
Figure S26. LC-FTICR MS total ion chromatograms for CrpD-M2 samples reacted with ATP and compounds as noted above (A-E). Data are presented as normalized intensity versus time, with the elution window for the identified species noted (*).
S43
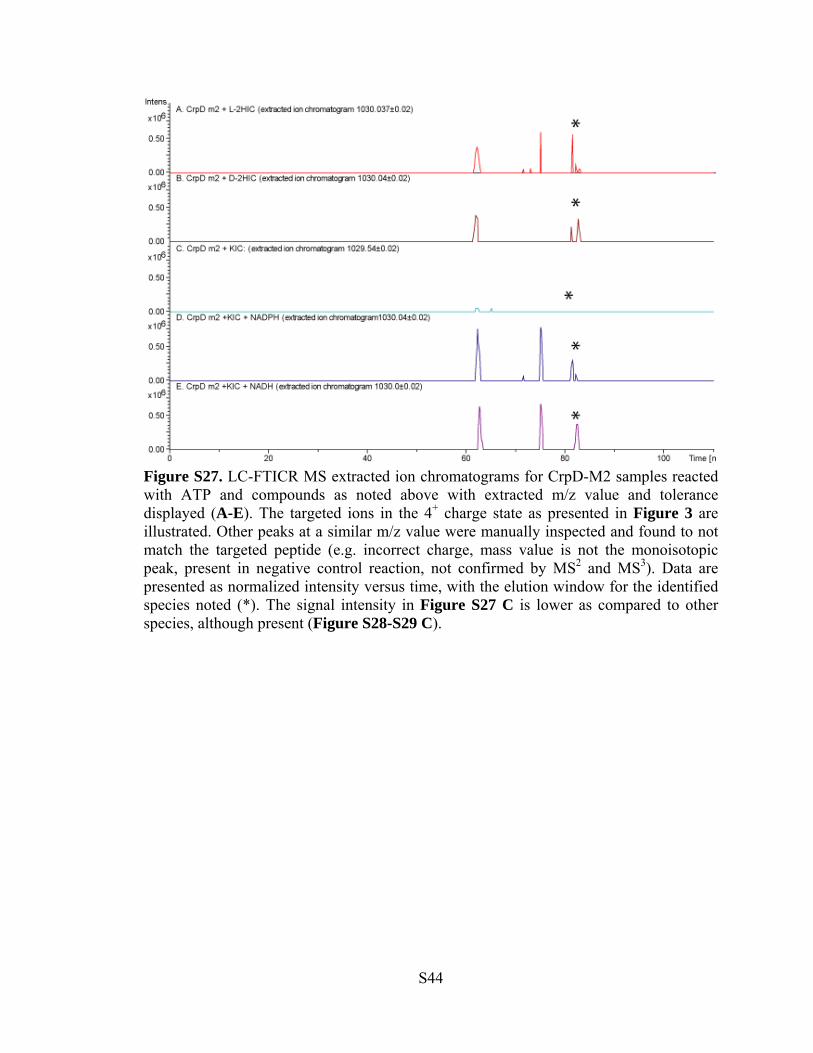
Figure S27. LC-FTICR MS extracted ion chromatograms for CrpD-M2 samples reacted with ATP and compounds as noted above with extracted m/z value and tolerance displayed (A-E). The targeted ions in the 4+ charge state as presented in Figure 3 are illustrated. Other peaks at a similar m/z value were manually inspected and found to not match the targeted peptide (e.g. incorrect charge, mass value is not the monoisotopic peak, present in negative control reaction, not confirmed by MS2 and MS3). Data are presented as normalized intensity versus time, with the elution window for the identified species noted (*). The signal intensity in Figure S27 C is lower as compared to other species, although present (Figure S28-S29 C).
S44
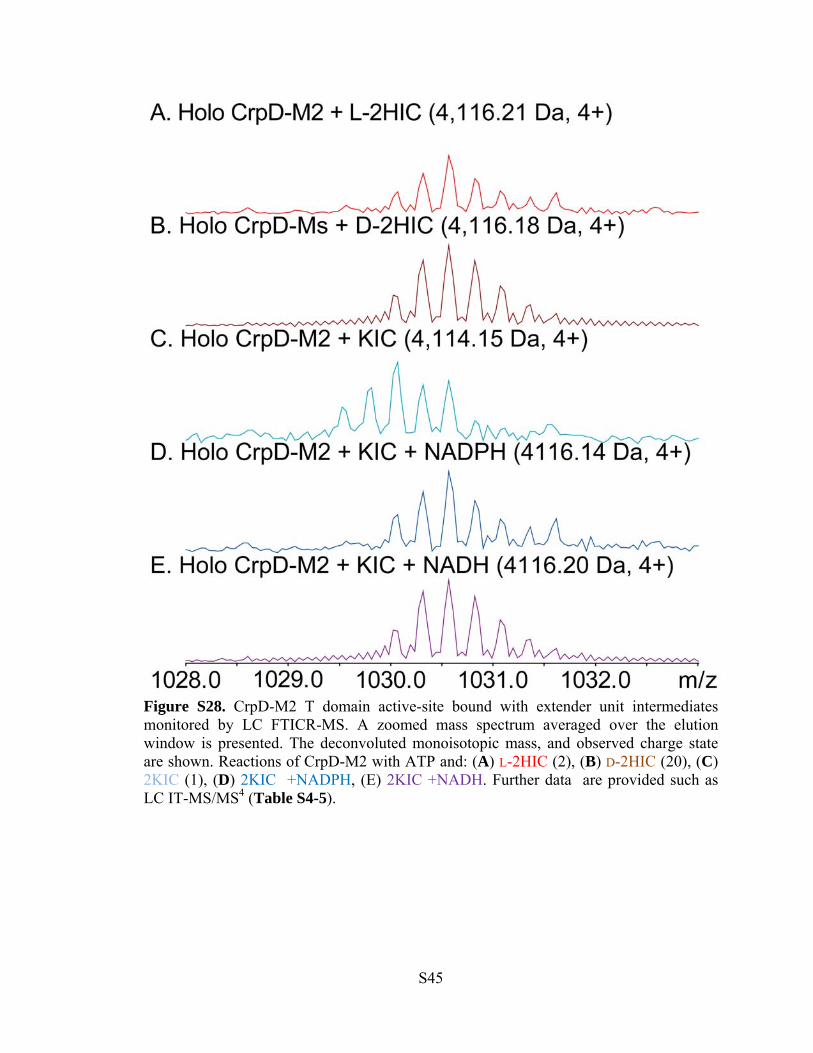
Figure S28. CrpD-M2 T domain active-site bound with extender unit intermediates monitored by LC FTICR-MS. A zoomed mass spectrum averaged over the elution window is presented. The deconvoluted monoisotopic mass, and observed charge state are shown. Reactions of CrpD-M2 with ATP and: (A) L-2HIC (2), (B) D-2HIC (20), (C) 2KIC (1), (D) 2KIC +NADPH, (E) 2KIC +NADH. Further data are provided such as LC IT-MS/MS4 (Table S4-5).
S45
Figure S29. LC-FTICR MS full spectra averaged over the elution window for CrpD-M2 rections (A-E). Data are presented as absolute intensity versus m/z values. The 4+, and 3+ charge states can be observed for all samples, indicating that indicating that the signals are real and greater than the noise.
S46
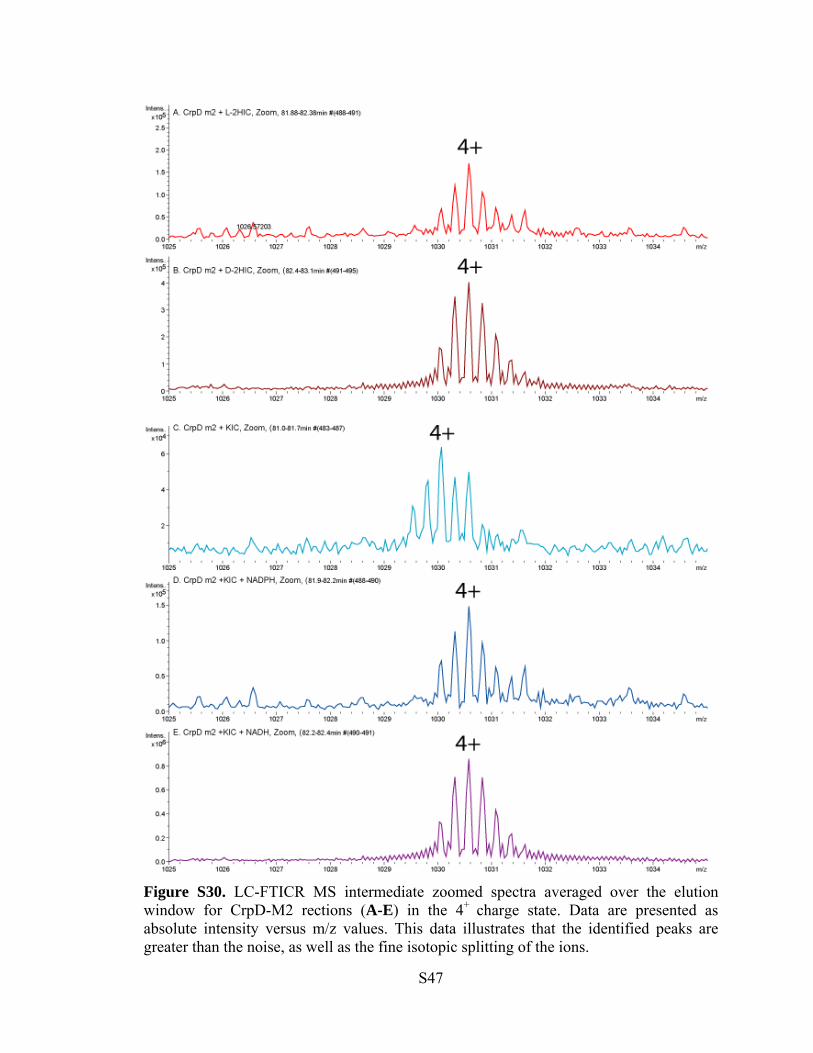
Figure S30. LC-FTICR MS intermediate zoomed spectra averaged over the elution window for CrpD-M2 rections (A-E) in the 4+ charge state. Data are presented as absolute intensity versus m/z values. This data illustrates that the identified peaks are greater than the noise, as well as the fine isotopic splitting of the ions.
S47
Figure S31. LC-IT MS2 and MS3 data for CrpDm2, ATP, and L-2HIC. Extracted ion chromatograms are presented for the 4+ loaded active site peptide (A) and the 3+ loaded active site loaded peptide (C) as well as the 4+ apo – 18 active site peptide (E) and the 3+ apo – 18 active site loaded peptide (G) as time versus normalized intensity. Assigned MS2 (B, D) and MS3 (F, H) spectra are shown as m/z values versus absolute intensity.
Figure S32. LC-IT MS2 and MS3 data for CrpDm2, ATP, and D-2HIC. Extracted ion chromatograms are presented for the 4+ loaded active site peptide (A) and the 3+ loaded active site loaded peptide (C) as well as the 4+ apo – 18 active site peptide (E) and the 3+ apo – 18 active site loaded peptide (G) as time versus normalized intensity. Assigned MS2 (B, D) and MS3 (F, H) spectra are shown as m/z values versus absolute intensity.
S48
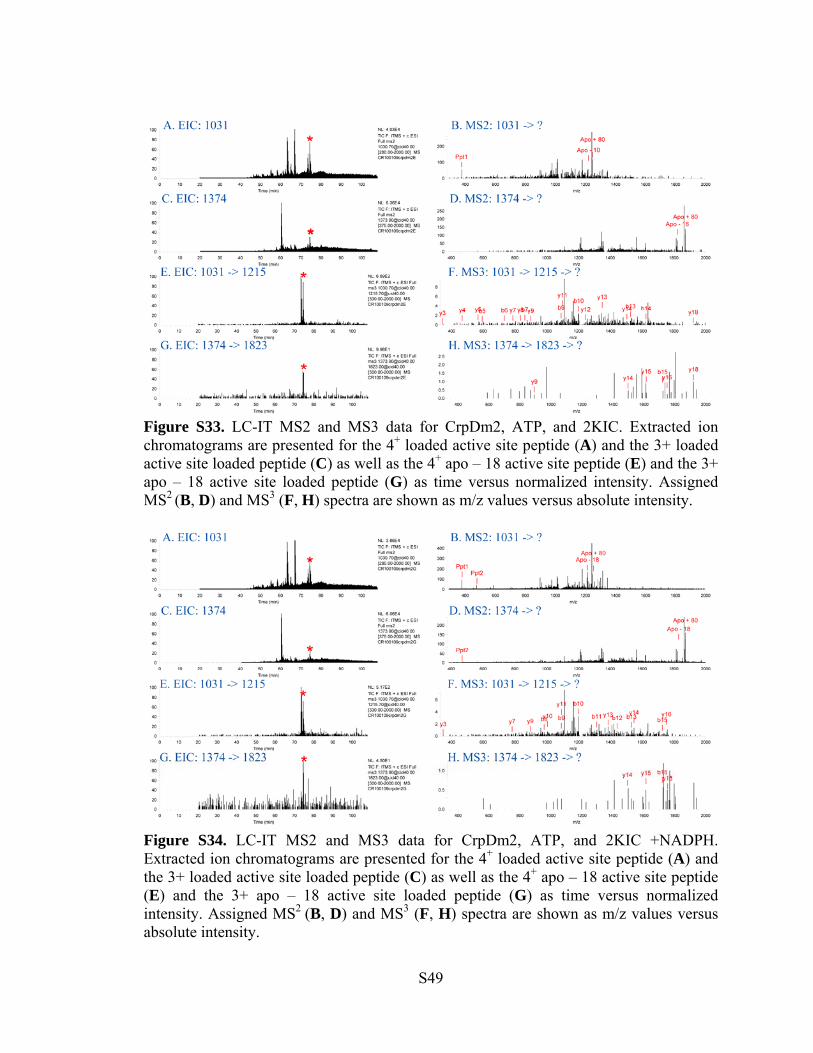
Figure S33. LC-IT MS2 and MS3 data for CrpDm2, ATP, and 2KIC. Extracted ion chromatograms are presented for the 4+ loaded active site peptide (A) and the 3+ loaded active site loaded peptide (C) as well as the 4+ apo – 18 active site peptide (E) and the 3+ apo – 18 active site loaded peptide (G) as time versus normalized intensity. Assigned MS2 (B, D) and MS3 (F, H) spectra are shown as m/z values versus absolute intensity.
Figure S34. LC-IT MS2 and MS3 data for CrpDm2, ATP, and 2KIC +NADPH. Extracted ion chromatograms are presented for the 4+ loaded active site peptide (A) and the 3+ loaded active site loaded peptide (C) as well as the 4+ apo – 18 active site peptide (E) and the 3+ apo – 18 active site loaded peptide (G) as time versus normalized intensity. Assigned MS2 (B, D) and MS3 (F, H) spectra are shown as m/z values versus absolute intensity.
S49
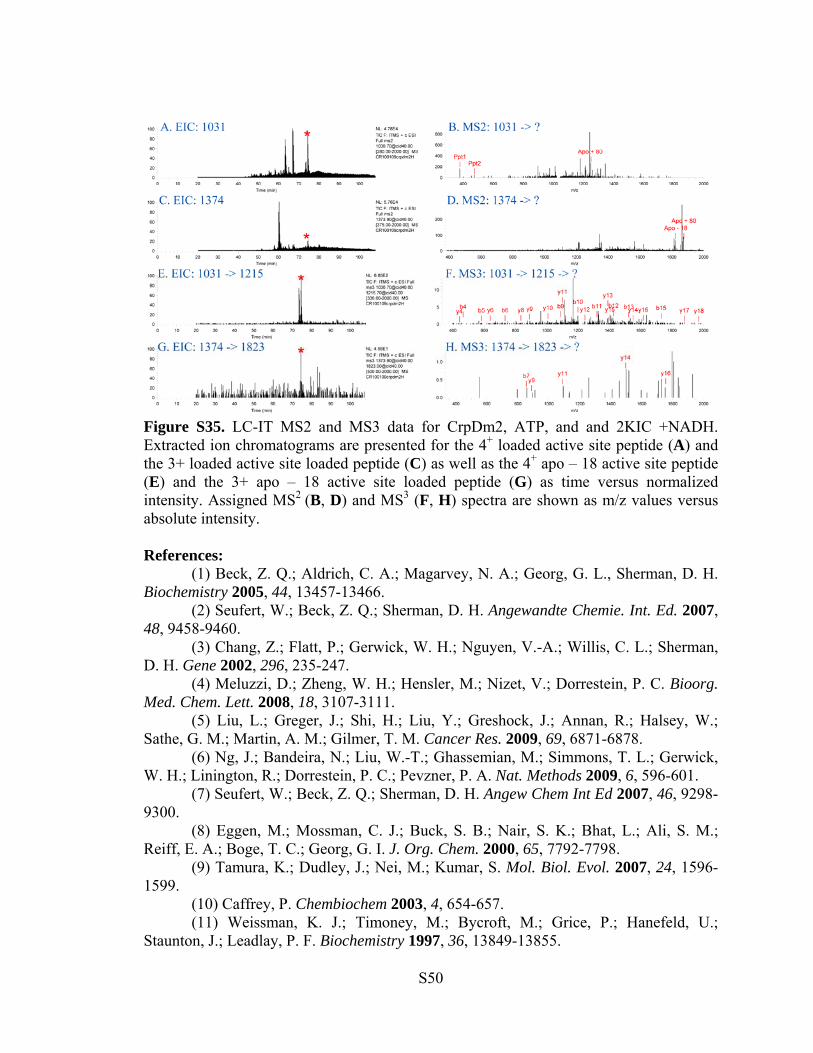
Figure S35. LC-IT MS2 and MS3 data for CrpDm2, ATP, and and 2KIC +NADH. Extracted ion chromatograms are presented for the 4+ loaded active site peptide (A) and the 3+ loaded active site loaded peptide (C) as well as the 4+ apo – 18 active site peptide (E) and the 3+ apo – 18 active site loaded peptide (G) as time versus normalized intensity. Assigned MS2 (B, D) and MS3 (F, H) spectra are shown as m/z values versus absolute intensity. References: (1) Beck, Z. Q.; Aldrich, C. A.; Magarvey, N. A.; Georg, G. L., Sherman, D. H. Biochemistry 2005, 44, 13457-13466. (2) Seufert, W.; Beck, Z. Q.; Sherman, D. H. Angewandte Chemie. Int. Ed. 2007, 48, 9458-9460. (3) Chang, Z.; Flatt, P.; Gerwick, W. H.; Nguyen, V.-A.; Willis, C. L.; Sherman, D. H. Gene 2002, 296, 235-247. (4) Meluzzi, D.; Zheng, W. H.; Hensler, M.; Nizet, V.; Dorrestein, P. C. Bioorg. Med. Chem. Lett. 2008, 18, 3107-3111. (5) Liu, L.; Greger, J.; Shi, H.; Liu, Y.; Greshock, J.; Annan, R.; Halsey, W.; Sathe, G. M.; Martin, A. M.; Gilmer, T. M. Cancer Res. 2009, 69, 6871-6878. (6) Ng, J.; Bandeira, N.; Liu, W.-T.; Ghassemian, M.; Simmons, T. L.; Gerwick, W. H.; Linington, R.; Dorrestein, P. C.; Pevzner, P. A. Nat. Methods 2009, 6, 596-601. (7) Seufert, W.; Beck, Z. Q.; Sherman, D. H. Angew Chem Int Ed 2007, 46, 9298-9300. (8) Eggen, M.; Mossman, C. J.; Buck, S. B.; Nair, S. K.; Bhat, L.; Ali, S. M.; Reiff, E. A.; Boge, T. C.; Georg, G. I. J. Org. Chem. 2000, 65, 7792-7798. (9) Tamura, K.; Dudley, J.; Nei, M.; Kumar, S. Mol. Biol. Evol. 2007, 24, 1596-1599. (10) Caffrey, P. Chembiochem 2003, 4, 654-657. (11) Weissman, K. J.; Timoney, M.; Bycroft, M.; Grice, P.; Hanefeld, U.; Staunton, J.; Leadlay, P. F. Biochemistry 1997, 36, 13849-13855.