30
CHEMOINFORMATICS: THEORY, PRACTICE, & PRODUCTS

CHEMOINFORMATICS: THEORY, PRACTICE, & PRODUCTS
CHEMOINFORMATICS: THEORY, PRACTICE, &
PRODUCTS
B. A. BUNINCollaborative Drug Discovery, San Mateo, CA, U.S.A.
B. SIESELMerrill Lynch & Co., San Francisco, CA, U.S.A.
G. A. MORALESTelik Inc., Palo Alto, CA, U.S.A.
J. BAJORATHRheinische Friedrich-Wilhelms-Universität, Bonn, Germany

A C.I.P. Catalogue record for this book is available from the Library of Congress.
ISBN-10 1-4020-5000-3 (HB)ISBN-13 987-1-4020-5000-8 (HB)ISBN-10 1-4020-5001-1 (e-book)ISBN-13 987-1-4020-5001-5 (e-book)
Published by Springer,P.O. Box 17, 3300 AA Dordrecht, The Netherlands.
www.springer.com
Printed on acid-free paper
All Rights Reserved© 2007 Springer
No part of this work may be reproduced, stored in a retrieval system, or transmittedin any form or by any means, electronic, mechanical, photocopying, microfilming, recording
or otherwise, without written permission from the Publisher, with the exceptionof any material supplied specifically for the purpose of being entered
and executed on a computer system, for exclusive use by the purchaser of the work.

Foreword ix
1. Chemoinformatics Theory 1
1.1 Chemoinformatics – What is it? 11.2 Chemo- versus Bio-informatics 21.3 Scientific Origins 41.4 Fundamental Concepts 4
1.4.1 Molecular descriptors and chemical spaces 41.4.2 Chemical spaces and molecular similarity 71.4.3 Molecular similarity, dissimilarity, and diversity 81.4.4 Modification and simplification of chemical spaces 9
1.5 Compound Classification and Selection 111.5.1 Cluster analysis 121.5.2 Partitioning 131.5.3 Support vector machines 16
1.6 Similarity Searching 171.6.1 Structural queries and graphs 171.6.2 Pharmacophores 181.6.3 Fingerprints 21
1.7 Machine Learning Methods 231.7.1 Genetic algorithms 231.7.2 Neural networks 24
1.8 Library Design 261.8.1 Diverse libraries 271.8.2 Diversity estimation 281.8.3 Multi-objective design 291.8.4 Focused libraries 29
1.9 Quantitative Structure-Activity Relationship Analysis 311.9.1 Model building 311.9.2 Model evaluation 321.9.3 3D-QSAR 331.9.4 4D-QSAR 341.9.5 Probabilistic methods 35
1.10 Virtual Screening and Compound Filtering 351.10.1 Biologically active compounds 35
TABLE OF CONTENTS

vi
1.10.2 Virtual and high-throughput screening 361.10.3 Filter functions 38
1.11 From Theory to Practice 401.11.1 Database design 401.11.2 Compound selection for medicinal chemistry 421.11.3 Computational hit identification 45
References 47
2. Practice and Products 51
2.1 Accelrys 512.2 ACD Labs 592.3 Barnard Chemical Information Ltd 672.4 BioByte 692.5 CambridgeSoft 732.6 CAS/Scifinder 802.7 ChemAxon 872.8 Chemical Computing Group 982.9 ChemInnovation Software 1032.10 ChemNavigator 1092.11 Chimera-Dock-Zinc from UCSF 1122.12 Collaborative Drug Discovery (CDD, Inc.) 1152.13 Daylight 1232.14 Eidogen-Sertanty (previously Libraria) 1272.15 Fujitsu Biosciences Group (previously Cache) 1372.16 Genego 1402.17 GVK-Bio 1442.18 Hypercube 1482.19 IDBS 1522.20 Infochem 1562.21 Jubilant Biosys 1642.22 Leadscope 1692.23 MDL 1712.24 Milano Chemometrics and QSAR Research Group 1802.25 Molecular Discovery 1842.26 Molecular Networks 1872.27 Open Eye Scientific Software 1942.28 Planaria-Software 2022.29 PubChem 2032.30 PyMol 2082.31 RasMol and Protein Explorer 2112.32 Schrödinger, LLC 2152.33 Scinova Technologies 2232.34 Scitegic 226
CONTENTS

2.35 Simulation Plus, Inc. 2292.36 Spotfire 2362.37 Summit PK 2392.38 Symyx 2432.39 TimTec 2542.40 Tripos 259
SUBJECT APPENDICES
Drug Discovery Informatics Registration Systems and Underlying Toolkits (Appendices 1 and 2)
Appendix 1 Drug, Molecular Registration Systems, and Chemistry DataCartridges 271
Appendix 2 Chemoinformatics Toolkits to Develop Applications 272
Content Databases (Appendices 3–7)
Appendix 3 Compound Availability Databases 273Appendix 4 SAR Database 273Appendix 5 Chemical Reaction Databases 274Appendix 6 Patent Databases 275Appendix 7 Other Compound and Drug Databases 275
Drug, Molecule, and Protein Visualization (Appendices 8–10)
Appendix 8 Chemical Drawing, Structure Viewing and Modeling Packages 276Appendix 9 Data Analysis and Mining Tools 276Appendix 10 Small Molecule – Protein Visualization Tools 277
Modeling and Algorithms (Appendices 11–17)
Appendix 11 Molecular Descriptors 278Appendix 12 Clogp, Tpsa, and Lipinski Property Calculation Systems 279Appendix 13 Qsar/Pharmacophore Programs 279Appendix 14 Docking and Crystallographic Software 280Appendix 15 Quantum Mechanics Calculations 280Appendix 16 PK/ADME/Tox Databases and Predictors 280Appendix 17 Multi-parameter Drug Development/Identification Software 281
Index 283
viiCONTENTS

ix
FOREWORD
Chemoinformatics: Theory, Practice & Products covers the theory, commerciallyavailable packages and applications of Chemoinformatics. Chemoinformatics isbroadly defined as the use of information technology to assist in the acquisition,analysis and management of data and information relating to chemical compoundsand their properties. This includes molecular modeling, reactions, spectra and struc-ture-activity relationships associated with chemicals. Computational scientists,chemists, and biologists all rely on the rapidly evolving field of Chemoinformatics.Chemoinformatics: Theory, Practice & Products is an essential handbook for deter-mining the right Chemoinformatics method or technology to use. There has been anexplosion of new Chemoinformatics tools and techniques. Each technique has its ownutility, scope, and limitations, as well as meeting resistance to use by experimentalists.The purpose of Chemoinformatics: Theory, Practice & Products is to provide compu-tational scientists, medicinal chemists and biologists with unique practical informa-tion and the underlying theories relating to modern Chemoinformatics and relateddrug discovery informatics technologies.
The book also provides a summary of currently available, state-of-the-art, commer-cial Chemoinformatics products, with a specific focus on databases, toolkits, andmodeling technologies designed for drug discovery. It will be broadly useful as a ref-erence text for experimentalists wishing to rapidly navigate the expanding field, aswell as the more expert computational scientists wishing to stay up to date.
It is primarily intended for applied researchers from the chemical and pharmaceu-tical industry, academic investigators, and graduate students.
The purpose of “Chemoinformatics: Theory, Practice, & Products” is to providescientists with practical information and a fundamental understanding of the latestchemoinformatics technologies applied to drug discovery and other applications.Given an ever-expanding list of drug discovery informatics tools available to the mod-ern researcher, understanding the underlying theories, organizing and summarizing thetools for best practices should be broadly useful. It is intended to be a regularly used text.
Chemoinformatics is broadly defined as information associated with molecules: boththeoretical and experimental.This ranges from molecular modeling to reactions to spec-tra to structure-activity relationships associated with molecules. Chemoinformatics hasthe potential to revolutionize synthesis, drug discovery, or any science where one wantsto optimize molecular properties. Computational scientists, chemists, and biologists allrely on the rapidly evolving field of chemoinformatics. The terms chemoinformaticsand cheminformatics are often used interchangeably. As of July, 2006, the term“Cheminformatics” is leading “Chemoinformatics” ~306,000 to ~164,000 in a Google
x
search (thanks to Phil McHale for his original suggestion). Despite this difference inGoogle popularity, we use chemoinformatics throughout this book because cheminfor-matics is frequently mis-interpreted as an abbreviation of the expression “Chemicalinformatics”. As we will discuss, “Chemical informatics” has originally been used in adifferent context (and it is also not a very meaningful term).
Chemoinformatics, which can be viewed as either a subset or superset of DrugDiscovery Informatics, has emerged as an interdisciplinary field of science ofimportance to chemists and biologists as well as computational scientists.Computational scientists use chemoinformatics tools to design and refine bettermodels. Medicinal chemists use chemoinformatics tools to design and synthesizebetter compounds. Biologists use chemoinformatics to prioritize compounds forscreening and assays for development. The drug discovery process is often analo-gized to the tale of the three blind men and the elephant where each “sees” a differ-ent beast by grabbing the tail, trunk, or side. The appropriate development of newand use of existing chemoinformatics tools is often directly a function of a specificproblem … and problem solver. Thus having a centrally-compiled resource describ-ing relevant chemoinformatics tools allows researcher to find the appropriatelyshaped “hammer” for their “nail.”
“Chemoinformatics: Theory, Practice, & Products” provides the basic toolkits. It isa handbook that one can consult to determine the chemoinformatics method or tech-nology of choice to use. The book covers the theory behind the methodologies as wellas the practical information on commercially available products. The goal is to providethe perspective of computational chemists in a format accessible to experimentalists,too. Thus, there are sections on the underlying theory as well as sections overviewingthe modern commercially available software and applications to provide the informa-tion of interest to computational scientists as well as to the broader audience of exper-imentalists.
There has been an explosion of new chemoinformatics tools and techniques. Eachtechnique has some utility, scope, and limitations, as well as resistance to use byexperimentalists. There is no compilation describing all the modern tools that areavailable. This guide will allow both experts and non-experts to know how and whento best use these technologies.
“Chemoinformatics: Theory, Practice, & Products” is intended for chemists, biol-ogists, and computational scientists. It is basically for anyone interested in chemoin-formatics for either synthesis or drug discovery. This includes the individuals at thecompanies mentioned in the book who work in the field of chemoinformatics (MDL,Accelrys, Tripos, CambridgeSoft, etc.) as well as the computational chemistry ordrug design departments at biotechnology and pharmaceutical companies engaged insmall molecule drug discovery and those using chemoinformatics for materialsdiscovery too.
The book can be useful as a reference book for the experienced chemoinformaticsexpert or as a text to introduce the new student to the field. The information from theleading commercial suppliers is covered and organized into tables to help a widerrange of scientists benefit from the revolution in informatics technologies in their
FOREWORD

day-to-day work. It is a reference of what is known as well as a guidebook to definewhat is possible with modern chemoinformatics technologies.
A quick disclaimer. Although a range of areas were covered including over a hun-dred product and methods, it is not possible to include everything under the sun. Amore specialized book could be written entirely about any one of the seventeen sub-ject appendices. Obviously tradeoffs had to be made between scope and depth of cov-erage. Furthermore, although it is inevitable that products and technologies willevolve over time, many of the most useful products are now mainstays of the modernchemoinformatics arsenal such as CAS-Scifinder, Beilstein, ChemDraw, Marvin,smiles strings, and Lipinski calculations – just to name a few. In addition to these wellknown products, there are often alternative products available with different specifi-cations which are also described herein. Thus even as new trends emerge, the generalstate of modern chemoinformatics (and drug discovery informatics) is fundamentallyrepresented. It is interesting to see the range of products that have historically beenavailable as well as the evolution of new product areas such as gene-family wide SARdatabases, data-pipelining, and metabolism predictors, just to name a few.
Perhaps most notable of the new initiatives is the publicly funded PubChem effort.A road map of existing products is useful both to differentiate new products and toprioritize the most important areas to focus future innovation. Understanding thelandscape of existing products should be particularly useful to the buyers and sellersof chemoinformatics and drug discovery informatics technologies. Where might thefield go in the future? With the emergence of open source software products in thebroader software marketplace (for products like Linux, Apache, and MySQL), theintegration of community-based tools with commercial tools has been a recentlyincreasing phenomena. Similarly, the increasing number of openly available data-bases and tools emerging from the publicly funded initiatives such as the humangenome project provide a fertile frontier for future innovation that combines the bestof community and commercial chemoinformatics tools in new ways.
xiFOREWORD
The theoretical part of this book is intended to provide a general introduction into thisstill young and rapidly evolving scientific discipline. In addition, it is meant to pro-vide a basis for researchers interested in applying products and tools that are detailedin the later sections. Therefore, it is attempted to outline some of the most relevantscientific concepts on which current chemoinformatics tools are based and providesome guidance as to which methodologies can be applied in a meaningful way totackle specific problems. As such the theoretical sections are first and foremost writ-ten for practitioners with various scientific backgrounds and also students trying to access chemoinformatics tools. Therefore, the description of mathematical for-malisms will be limited to the extent required to achieve a general understanding. Inaddition, rather than trying to provide an extensive bibliography covering this field, itis attempted to limit citations to key publications and contributions that are accessi-ble to a readership with diverse scientific backgrounds.
As a still evolving discipline, chemoinformatics is an equally interesting play-ground for method development, chemical and drug discovery applications, andinterdisciplinary research. This makes this field a rather exciting area to work in andit is hoped that the information provided herein might encourage many scientificminds to actively contribute to its further development.
1.1 CHEMOINFORMATICS – WHAT IS IT?
The term chemoinformatics (which is synonymously used with cheminformatics)was introduced in the literature by Brown in 1998 and defined as the combinationof “all the information resources that a scientist needs to optimize the properties ofa ligand to become a drug” (Brown 1998). Following this definition, both decisionsupport by computer and drug discovery relevance are crucial aspects. On the otherhand, the term chemical informatics was already used much earlier and generallyunderstood as the application of information technology to chemistry, thus lackinga specific drug discovery focus. In addition, the chemometrics field focuses on theapplication of statistical methods to chemical data in order to derive predictivemodels or descriptors. Although these definitions and areas of research still co-exist, it appears to be increasingly difficult to distinguish between them, inparticular, as far as method development is concerned. Therefore, it has recentlybeen suggested to more broadly define chemoinformatics and include the types of
1
1. CHEMOINFORMATICS THEORY

2 CHEMOINFORMATICS
TABLE 1.1. The spectrum of chemoinformatics
Chemical data collection, analysis, and managementData representation and communicationDatabase design and organizationChemical structure and property prediction (including drug-likeness)Molecular similarity and diversity analysisCompound or library design and optimizationDatabase miningCompound classification and selectionQualitative and quantitative structure-activity or – property relationshipsInformation theory applied to chemical problemsStatistical models and descriptors in chemistryPrediction of in vivo compound characteristics
computational methodologies and infrastructures in the chemoinformatics spec-trum that are shown in Table 1.1 (Bajorath, 2004).
This extended definition does no longer imply that chemoinformatics is necessar-ily linked to drug discovery and takes into account that this field is still evolving.Moreover, approaches that are long established as disciplines in their own right arealso part of the chemoinformatics spectrum. This is well in accord with other viewsthat chemoinformatics might largely be a new rationalization of tasks in chemicalresearch that have already existed for considerable time (Hann and Green 1999).In fact, chemoinformatics research and development should be capable of adoptingestablished scientific concepts and putting them into a novel context. Given theabove topics, good examples for this might include, among others, the use of quanti-tative structure-activity relationship (QSAR) models for computational screening oflarge compound databases or the use of fragments of active compounds (so-calledsubstructures) as a starting point for the design of targeted combinatorial libraries. Inits extended definition, chemoinformatics includes all concepts and methodsdesigned to interface theoretical and experimental programs involving small mole-cules. This is a crucial aspect because there is little doubt that the evolution ofchemoinformatics as an independent discipline will much depend on its ability todemonstrate a measurable impact on experimental chemistry programs, regardless ofwhether these are in pharmaceutical research or elsewhere.
1.2 CHEMO- VERSUS BIO-INFORMATICS
There is little doubt that data explosion in chemistry and biology has been the majordriver for the development of chemoinformatics and bioinformatics as disciplines. Inthe 1990s the advent of high-throughput technologies in biology (DNA sequencing)and chemistry (combinatorial synthesis) had caused much of the need for efficientcomputational infrastructures for data processing, management, and mining. In biol-ogy raw DNA sequences were the primary data source, whereas in chemistry rapidly

3CHEMOINFORMATICS THEORY
BIOLOGY
DNA sequence Molecular composition
Connectivity (graph)
Molecular similarity
Chemotype
Structure
Interaction
Specific activity
Drug
Protein sequence
Sequence similarity
Family
Structure
Interaction
Function
Intervention
CHEMISTRYI
N
F
O
R
M
A
T
I
C
S
Figure 1.1. Hierarchy of bio- and chemoinformatics research
growing compound databases produced by combinatorial synthesis techniques pro-vided previously unobserved amounts of primary data (structures) and secondarydata (screening results). Over a relatively short period of time, however, both bio- andchemo-informatics have developed well beyond data processing and managementand have become research-intense disciplines.
How distinct are bio- and chemoinformatics as disciplines? Figure 1.1 summarizesthe topics at different stages of typical bio- or chemoinformatic analysis.
Clearly, proceeding from molecular composition to two- and three-dimensionalstructure and function or activity presents a number of similar challenges, regardlessof whether the starting point is a DNA sequence or the chemical element distributionof a molecule. From an algorithmic point of view, many tasks for this type of analy-sis in biology and chemistry are often much more similar than one might think, con-sidering the diversity of biological and chemical applications. Thus, many algorithmsand computational techniques used in chemoinformatics, as will be described herein,are also used for many applications in bioinformatics. For example, cluster algo-rithms are not only applied to classify compound databases but also to analyzeexpression data sets. Similarly, statistical algorithms are used to correlate compoundstructures with specific activities and also to correlate expression patterns and exper-imental conditions in microarray analysis. Thus, “similar algorithms – diverse appli-cations” is a general theme in applied informatics research. Such insights are alsoconsistent with recent trends in the life science area where bio- and chemoinformat-ics are beginning to merge. This is particular relevant for drug discovery wherechemical and biological information needs to be integrated as much as possible to beultimately successful and where the boundaries between different disciplines havebecome rather fluid. For example, it could hardly be decided whether the develop-ment of relational databases that link compound structure with assay data, biologicaltargets, and pharmacological information would be a bio- or chemoinformatics
4
project. Thus, informatics research and development in the life sciences is expectedto become much more global in the future.
1.3 SCIENTIFIC ORIGINS
Given the above outline of the chemoinformatics field, one should also review the scientific roots that have laid the foundation for the development of chemoinformaticsas a research discipline, beyond data management. In the 1960s, efforts begun to cor-relate compound structures and activities in quantitative terms by modeling linear rela-tionships with the aid of molecular descriptors (Hansch and Fujita 1964; Free andWilson 1964). These studies provided the basis of quantitative structure-activity rela-tionship (QSAR) analysis, which was ultimately extended to multi-dimensional QSARin 1980 (Hopfinger 1980). Also in the 1960s, chemical structures were first stored ascomputer files in searchable form by Chemical Abstract Services, thus providing abasis for structure retrieval and searching (Willett 1987). During the 1970s, methodsfor two-dimensional substructure (Cramer et al. 1974) and three-dimensional pharma-cophore searching (Gund 1977) were developed, which made it possible to search com-pound databases for desired structural motifs or active molecules. In the 1980s,clustering methods were adapted for chemical applications, became very popular forthe classification of molecular data sets, and were applied to explore similarities fromvarious points of view (Willett 1988). The concept of molecular similarity itselfbecame a major research topic in the late 1980s (Johnson and Maggiora 1990).Molecular similarity analysis extended conventional QSAR approaches where theinfluence of small compound modifications on activity is studied. Thus, relationshipsbetween molecular structure (and properties) and biological activity were beginning tobe explored from a more global point of view. During the 1990s, the concepts of molec-ular diversity and dissimilarity complemented similarity analysis and algorithms weredeveloped for the design of chemically diverse compound libraries (Martin et al. 1995)and selection of diverse compounds from databases (Lajiness 1997; for a compendiumof interesting personal accounts of the early days of molecular similarity and diversityresearch, see Martin 2001). Although many other efforts have – without doubt – sig-nificantly contributed to and helped to shape chemoinformatics, as we understand ittoday, it is evident that two major themes have largely dominated the development ofthis discipline: chemical data organization and mining and, in addition, the explorationof structure-activity relationships (from many different points of view).
1.4 FUNDAMENTAL CONCEPTS
1.4.1 Molecular descriptors and chemical spaces. The majority of chemoinfor-matics methods depend on the generation of chemical reference spaces into whichmolecular data sets are projected and where analysis or design is carried out. The def-inition of chemical spaces critically depends on the use of computational descriptorsof molecular structure, physical or chemical properties, or pharmacophores.Essentially, any comparison of molecular characteristics that goes beyond simplestructural comparison requires the calculation of property values and the application
CHEMOINFORMATICS

5CHEMOINFORMATICS THEORY
descriptorn
descriptor1
Mi (descriptor1(i), descriptor2(i),.....,descriptorn(i))
descriptor2
descriptor2(i)
descriptor1(i)
descriptorn(i)
Figure 1.2. N-dimensional chemical space with a molecule M at position i
of mathematical models. In chemical space design, each chosen descriptor adds adimension to the reference space, as illustrated in Figure 1.2.For each molecule, calculation of n descriptor values produces an N-dimensionalcoordinate vector in descriptor space that determines its position:
Hundreds if not thousands of molecular descriptors have been designed for chemicalapplications (for an encyclopedic descriptor compendium, see [Todeschini andConsonni 2000]) that can be divided into different types or classes. Some examplesare given in Table 1.2. Descriptors are frequently divided into 1D, 2D, or 3D descrip-tors, dependent on the dimensionality of the molecular representation from whichthey can be calculated, as illustrated in Figure 1.3.
The design and complexity of different types of descriptors often varies dramatically.Among very simple descriptors are, for example, 2D structural fragments that have,however, high predictive value in many applications because they implicitly account fordiverse molecular properties (such as complexity, polarity, hydrophic character etc.).Topological indices, for example, go beyond simple structural fragment description andintroduce a next level of abstraction. To give an example, for a molecule containing
Molecule i: M(i) � �j1dj(i)

6
n atoms and m bonds, so-called first and second order kappa shape indices (Kier 1997)are calculated as follows:
`
These indices are also 2D descriptors because they require a molecular drawing (or graph) in order to determine the number of bonds.
�2 �(n � 1)(n � 2)2
m2
�1 �n(n � 1)2
m2
CHEMOINFORMATICS
TABLE 1.2. Different types of molecular descriptors
Descriptor category Examples
Physical properties Molecular weightlogP(o/w)
Atom and bond counts Number of nitrogen atomsNumber of aromatic atomsNumber of rotatable bonds
Pharmacophore features Number of hydrogen bond acceptorsSum of van der Waal surface areas of
basic atomsCharge descriptors Total positive partial charge
Dipole moment from partial chargesConnectivity and shape descriptors Kier and Hall molecular shape indicesSurface area and volume Solvent-accessible surface area
1D
2D
O
O
O N
N
F
CI
N
N
3D
Number of carbon atomsC22H24C1FN4O3
Number of rotatable bondslog P(o/W)
Solvent–accessible surface areaVan der Waals volume
Molecular connectivity index
Figure 1.3. Examples of descriptors classified according to dimensionality (adapted from Bajorath 2002)

Other descriptor designs can become increasingly complex. Contributions of differ-ent types of descriptors can also be combined into composite formulations, for exam-ple, descriptors combining molecular surface and charge information such as chargedpartial surface area (CPSA) descriptors (Stanton and Jurs 1990). As an example, two ofthese descriptors, PNSA1 and PPSA1, capture the sum of the solvent-accessible surfacearea (SAA) of all negatively and positively charged atoms in a molecule, respectively:
Thus, calculation of these descriptor values for a molecule involves the separatecalculation of atomic charges and SAAs.
1.4.2 Chemical spaces and molecular similarity. There are no generally preferreddescriptor spaces for chemoinformatics applications and it is usually required togenerate reference spaces for specific applications on a case-by-case basis, eitherintuitively, based on experience, or by applying machine learning techniques toautomate and optimize descriptor selection for a given problem. However, descriptorsare ultimately selected for chemical space design, n descriptors always produce an n-dimensional reference space, as discussed above, into which compound sets can bemapped. In meaningful chemical space representations, similar compounds shouldmap to similar regions, in other words, their intermolecular distance should be small.This represents a basic interpretation of the similarity concept. Table 1.3 listsexamples of conventional distance functions that are used for these calculations.
Here ni and nj are the number of descriptor values for molecules i and j, respec-tively, and nij is the number of common values. Dij is the distance between moleculesi and j, D the average distance, and n the total number of molecules.
It should be noted that the general understanding of molecular similarity goesbeyond simple structural similarity and extends to biological activity, in accord with theso-called Similar Property Principle (Johnson and Maggiora 1990) postulating thatmolecules having similar structures and properties should also exhibit similar activity
PPSA1
� �n�SAA�
PNSA1
� �n�SAA�
7CHEMOINFORMATICS THEORY
TABLE 1.3. Distance functions
Hamming distance
Euclidean distance
Average distance
In the formula of the Hamming distance, � means “exclusive disjunction” anddetects non-identical values. In the formula of the average distance, Dij is thedistance between molecules i, j and n the total number of molecules.
AD ��n
i�1 �n
j�1Dij
n(n � 1)
ED � ��n
i�1(xi � yi)
2
HD � �n
i�1xi � yi,

8 CHEMOINFORMATICS
TABLE 1.4. Similarity coefficients
Tanimoto coefficient
Dice coefficient
Cosine coefficient Cc � nij/(ninj)1/2
Dc � 2nij/(ni � nj)
Tc � nij/(ni � nj � nij)
(which is often – but not always – true). Thus, molecules that are located closelytogether in chemical reference space are often considered to be functionally related,which is one of the hallmarks of molecular similarity analysis.
If descriptor combinations are expressed as bit strings (often called fingerprints, asdescribed in more detail later on), each test molecule is assigned a characteristic bit pat-tern, and pair-wise molecular similarity can be assessed by quantifying the overlap ofbit strings using various similarity metrics (coefficients). Examples are shown inTable 1.4.
In these formulations, ni and nj are the number of bits set on for molecules i and j,respectively, and nij is the number of bits in common to both molecules.
The values of these similarity coefficients range from zero (i.e., no overlap; nosimilarity) to one (i.e., complete overlap; identical or very similar molecules). Inchemoinformatics, the most widely used metric is the Tanimoto coefficient.
1.4.3 Molecular similarity, dissimilarity, and diversity. How are similarity anddiversity related to each other? As discussed, similar molecules can be identified byapplication of distance functions and analysis of nearest neighbors in chemical space.Diversity analysis, on the other hand, attempts to either select different compoundsfrom a given population or, alternatively, evenly populate a given chemical spacewith candidate molecules. This can also be accomplished using distance functions byonly selecting compounds that are at least a pre-defined minimum distance awayfrom others or – in diversity design – by trying to maximize average inter-compounddistances.
An alternative approach to diversity selection and design is to divide the descriptoraxes into evenly spaced value intervals, a process called “binning”, which produces n-dimensional subsections of chemical space (also called “cells”, as discussed in a latersection). Then it can be monitored how these cells are populated with compounds thatare projected into chemical space. In diversity selection, one would attempt, for exam-ple, to select a representative compound from each populated cell; in diversity design,one would try to populate cells as evenly as possible with computed molecules. As willbe discussed in the next section, such segment- or cell-based design strategies can, inpractial terms, only be applied to low-dimensional descriptor spaces; otherwise, thevast majority of cells would remain empty, thereby preventing a meaningful analysis.
Molecular diversity is a global concept, which is applicable to the analysis of largecompound distributions, but not to the study of pair-wise molecular relationships. This

is in contrast to molecular similarity analysis, which explores pair-wise relationships,the exploration of which is more local in nature. For example, one tries to find com-pounds similar to a given reference molecule or study the compound population withina limited region of chemical space. From this point of view, the inverse of molecularsimilarity is not diversity, but rather “dissimilarity”, which is local in nature (address-ing the question which molecule in a collection is most dissimilar from a given com-pound or set of compounds). Like similarity, dissimilarity calculations can focus on theexploration of pair-wise compound relationships (e.g., distances in chemical space).When similarity metrics are applied, the dissimilarity d between two molecules i and jis thus defined as, for example:
Dissimilarity analysis plays a major role in compound selection. Typical tasks includethe selection of a maximally dissimilar subset of compounds from a large set or theidentification of compounds that are dissimilar to an existing collection. Such issueshave played a major role in compound acquisition in the pharmaceutical industry. A typical task would be to select a subset of k maximally dissimilar compounds from adata set containing n molecules. This represents a non-trivial challenge because of thecombinatorial problem involved in exploring all possible subsets. Therefore, other dis-similarity-based selection algorithms have been developed (Lajiness 1997). The basicidea of such approaches is to initially select a seed compound (either randomly or, bet-ter, based on dissimilarity to others), then calculate dissimilarity between the seed com-pound and all others and select the most dissimilar one. In the next step, the databasecompound most dissimilar to these two compounds is selected and added to the subset,and the process is repeated until a subset of desired size is obtained.
1.4.4 Modification and simplification of chemical spaces. High-dimensionalchemistry spaces might often be too complex for carrying out meaningful and inter-pretable analyses. One reason for this is that major areas or subsections of high-dimensional chemical space might not be populated with compounds and thus remain“empty”. Another reason is that correlation effects between selected descriptors dra-matically distort the reference space, which often (but not always) complicates theanalysis of compound distributions. Therefore, it is generally attempted to eitherdesign low-dimensional reference spaces, simplify high-dimensional spaces, orreduce their dimensionality. Descriptor correlation is a very common effect. Forexample, the number of carbon atoms in a molecule (a very simple 1D descriptor) cor-relates with molecular weight, hydrophobicity etc. In fact, it is rather difficult to finda set of completely uncorrelated descriptors. Compound analysis or design in low-dimensional spaces has the added bonus that it is often possible to further reduce thedimensionality to three without too much loss of information so that one can visualizethe results. Visualization of chemical space representations, even if only approximate,is in general of high value, as it permits a more intuitive analysis of molecule distri-butions and makes it possible to complement computations with chemical knowledgeand experience. There are several different ways to simplify chemical spaces or pro-duce low-dimensional representations, as discussed in the following.
dij � 1 � Cc(i, j) or 1 � Tc(i, j)
9CHEMOINFORMATICS THEORY
10
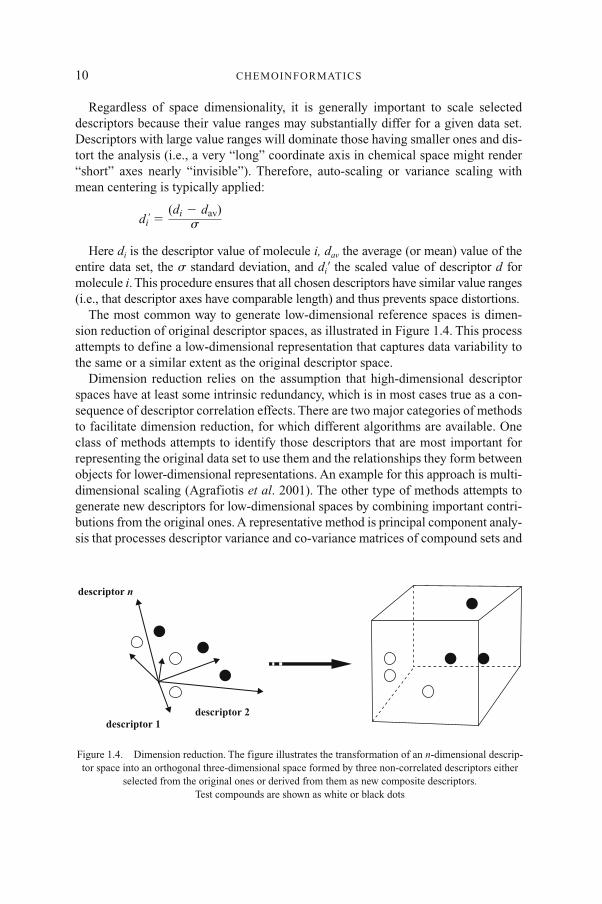
Regardless of space dimensionality, it is generally important to scale selecteddescriptors because their value ranges may substantially differ for a given data set.Descriptors with large value ranges will dominate those having smaller ones and dis-tort the analysis (i.e., a very “long” coordinate axis in chemical space might render“short” axes nearly “invisible”). Therefore, auto-scaling or variance scaling withmean centering is typically applied:
Here di is the descriptor value of molecule i, dav the average (or mean) value of theentire data set, the � standard deviation, and di� the scaled value of descriptor d formolecule i. This procedure ensures that all chosen descriptors have similar value ranges(i.e., that descriptor axes have comparable length) and thus prevents space distortions.
The most common way to generate low-dimensional reference spaces is dimen-sion reduction of original descriptor spaces, as illustrated in Figure 1.4. This processattempts to define a low-dimensional representation that captures data variability tothe same or a similar extent as the original descriptor space.
Dimension reduction relies on the assumption that high-dimensional descriptorspaces have at least some intrinsic redundancy, which is in most cases true as a con-sequence of descriptor correlation effects. There are two major categories of methodsto facilitate dimension reduction, for which different algorithms are available. Oneclass of methods attempts to identify those descriptors that are most important forrepresenting the original data set to use them and the relationships they form betweenobjects for lower-dimensional representations. An example for this approach is multi-dimensional scaling (Agrafiotis et al. 2001). The other type of methods attempts togenerate new descriptors for low-dimensional spaces by combining important contri-butions from the original ones. A representative method is principal component analy-sis that processes descriptor variance and co-variance matrices of compound sets and
d �i �(di � dav)
�
CHEMOINFORMATICS
descriptor n
descriptor 1descriptor 2
Figure 1.4. Dimension reduction. The figure illustrates the transformation of an n-dimensional descrip-tor space into an orthogonal three-dimensional space formed by three non-correlated descriptors either
selected from the original ones or derived from them as new composite descriptors. Test compounds are shown as white or black dots

ultimately calculates novel composite descriptors as linear combinations of the orig-inal ones (Xue and Bajorath 2000):
Here the coefficients c reflect the importance of each descriptor (within each compo-nent) to capture data variance. Principal component analysis removes descriptor corre-lation effects and the resulting components account for data variance in descendingorder (i.e., the first accounts for more than the second, the second more than the third,and so on). A possible result would be that for an original 20-descriptor space, the firstfive or six principal components account for greater than 95% of the variance withinthe molecular data set, thus permitting the generation of an orthogonal reference spacereduced to five or six dimensions.
An alternative to dimension reduction is the use of composite and uncorrelateddescriptors that are suitable for the design of information-rich yet low-dimensionalchemical spaces. An elegant example is presented by the popular BCUT (Burden-CAS-University of Texas) descriptors (Pearlman and Smith 1998). BCUTs are a set ofuncorrelated descriptors that combine information about molecular connectivity,inter-molecular distances, and other molecular properties. BCUT spaces used formany applications are typically only six-dimensional and can frequently be furtherreduced to 3D representations for visualization purposes by identifying those BCUTaxes around which most compounds map.
Simplification of n-dimensional descriptor spaces is another alternative to dimen-sion reduction. This can be accomplished, for example, by analysis of descriptor valuedistributions in large databases. In statistics, the median of a value distribution isdefined as the value that separates it into two equal halves (above and below themedian). Thus, a descriptor with continuous database value range can be trans-formed into a binary scheme where a test compound with a descriptor value aboveor equal to the median is assigned a transformed descriptor value of “1” and a com-pound with a descriptor value below the median a transformed value of “0” (Goddenet al. 2004). Binary descriptor transformation retains the dimensionality of the orig-inal space but greatly simplifies it because the length of each descriptor axis iseither zero or unity. Thus, this simplified descriptor space is also scaled. As furtherdiscussed in the following, both low-dimensional and binary-transformed descriptorspaces have been proven very useful for partitioning analyses and compound classi-fication or design.
1.5 COMPOUND CLASSIFICATION AND SELECTION
The classification of molecular data sets according to pre-defined criteria is one ofthe central themes in chemoinformatics. Methods designed to classify molecules are
PCn � cn.1d1 � cn.2d2 � cn.3d3 � … � cn.ndn � constn
�
PC2 � c2.1d1 � c2.2d2 � c2.3d3 � … � c2.ndn � const2
PC1 � c1.1d1 � c1.2d2 � c1.3d3 � … � c1.ndn � const1
11CHEMOINFORMATICS THEORY

12
applied in database organization and mining and also provide a basis for selection ofcompounds according to diversity, property, or biological activity criteria.
1.5.1 Cluster analysis. As mentioned before, clustering has been one of theroots of the chemoinformatics field and continues to be widely applied. Clusteringmethods are often divided into non-hierarchical and hierarchical techniques andhierarchical methods are further divided into divisive or agglomerative clustering.Hierarchical-divisive methods start from a large cluster containing all compounds(“top-down”), whereas hierarchical-agglomerative techniques begin from single-tons (“bottom-up”). Hierarchical clustering builds relationships between clustersin subsequent steps, which means that the composition of each cluster depends onthe one from which it was derived. Non-hierarchical clustering methods organizecompounds into an initially defined number of independent clusters, which is oftenaccomplished by calculating nearest neighbor distributions in chemical space.Molecules can be expressed as descriptor vectors and for each cluster, a centervector can be calculated (e.g., as an average position) that distinguishes differentclusters from each other. New molecules are assigned to clusters based on theirdistances from different cluster centers in descriptor space. Figure 1.5 illustratesthese different clustering approaches.
CHEMOINFORMATICS
Hierarchical agglomerative Hierarchical divisive
Non-hierarchical clustering Multi-domain clustering
Figure 1.5. Clustering approaches described in the text (adapted from Kitchen et al. 2004)

Fuzzy clustering methods that have recently become popular are distinct from tra-ditional clustering techniques in that molecules are permitted to belong to multipleclusters or have fractional membership in all clusters. A potential advantage of suchclassification schemes is that more than one similarity relationship can be estab-lished by cluster analysis.
Hierarchical clustering also depends on the chosen “linkage scheme” that deter-mines the way inter-cluster distances are calculated. For example, based on “singlelinkage”, inter-cluster distance is defined as the minimum distance between mem-bers of two clusters. By contrast, “complete linkage” calculates the maximum dis-tance between members in two different clusters. Furthermore, for all clusteringmethods, clustering levels and cluster occupancy present additional variables. Forexample, too many clustering steps will result in sparsely populated clusters and toofew in densely populated ones, both of which will distort molecular similarityrelationships derived from clustering (which means that molecules within the samecluster should be “similar”). Therefore, level selection algorithms are typicallyapplied in order to determine calculation parameters that balance clustering levelsand cluster occupancy.
Among non-hierarchical methods, Jarvis-Patrick clustering (Jarvis and Patrick1973) has been popular early on in chemical database analysis. It is a nearestneighbor method: two molecules are included in the same cluster if they share apre-defined minimum number of nearest neighbors. However, the method has beenfound to produce rather unevenly sized clusters, often too large or too small.Another popular non-hierarchical method is k-means clustering where k clustersare randomly seeded, cluster averages or means are calculated in descriptor space,and molecules are re-assigned to other clusters if their position is closer to thosemeans than to the one of their initial cluster. This clustering technique is fast butdepends on the initial random seeding of clusters with test compounds and thechoice of k. Over the years, agglomerative-hierarchical methods, in particular,Ward’s clustering (Ward 1963), have become more popular in chemistry becausethis approach has been shown to produce more balanced cluster levels and distri-butions than non-hierarchical methods, resulting in more reliable classification ofsimilar molecules.
As discussed, clustering algorithms generally involve distance comparisonsbetween compounds or between compounds and cluster centers in chemical space,which renders calculations increasingly demanding as the compound databases growin size. Given currently available computational power, classifications methods thatinvolve exhaustive pair-wise compound or distance comparisons can be applied tothousands of compounds but become prohibitive when databases further increase insize by orders of magnitude.
1.5.2 Partitioning. In contrast to clustering techniques, partitioning algorithms donot rely on pair-wise molecular and distance comparison and can therefore be appliedto very large compound source databases. Rather than comparing molecular positions,
13CHEMOINFORMATICS THEORY

14
partitioning methods establish a coordinate or reference system in chemical space thatultimately defines the position of each compound based on its calculated descriptorcoordinates. Compounds that populate the same partitions or sub-sections of chemicalspace are considered similar. Partitioning in low-dimensional descriptors spaces, gen-erated either by use of BCUT descriptors or dimension reduction techniques, hasbecome a very popular approach. Cells are generated by dividing orthogonal (uncor-related) descriptor axes into regularly spaced intervals or bins, as illustrated inFigure 1.6.
Regardless of whether clustering or partitioning algorithms are applied, com-pound classification calculations are often carried out to provide a basis for com-pound selection from large data sets. Major strategies include diversity- oractivity-oriented selection, as illustrated in Figure 1.7. Diversity-based selection aimsat generating a small representative subset of a compound collection. In this case, it
CHEMOINFORMATICS
Figure 1.6. Axes of a low-dimensional orthogonal chemical space are binned in order to produce cells for partitioning. White dots represent similar compounds
Figure 1.7. Diversity-based (left) and activity-based (right) compound selection from partitions. Whitedots represent database compounds, gray dots selected database compounds, and
black dots known active compounds

is attempted to generate evenly populated partitions or clusters from which repre-sentative compounds are selected in order to mirror the overall diversity distributionin chemical space. By contrast, in activity-based selection, known active com-pounds are added to the source database prior to clustering or partitioning. Databasecompounds mapping close to known actives are then selected as candidates for test-ing to identify new hits.
Cell-based partitioning can not only be used for compound selection but also to aidin combinatorial diversity design. In this case, a chemical descriptor space is definedand “empty” partitions are generated by binning. Test compounds are then enumer-ated on the computer based on reaction schemes and selected to evenly populatethese partitions.
In addition to cell-based partitioning, statistical partitioning methods are widelyused for compound classification. One of the most popular approaches is recursive par-titioning (Rusinko et al. 1999), a decision tree method, as illustrated in Figure 1.8.Recursive partitioning divides data sets along decision trees formed by sequences ofmolecular descriptors. At each node of the tree, a descriptor-based decision is made andthe molecular data set is subdivided. For example, a chosen descriptor could simplydetect the presence or absence of a structural fragment in a molecule. Alternatively, the
15CHEMOINFORMATICS THEORY
D1
D3D2
D4
D6
D5
D8
T8T7
T4
T3
T2
T6T5
T1
Figure 1.8. Decision tree. Shown is a rudimentary tree structure (D, descriptors; T, terminal nodes) for recursive partitioning. Terminal nodes are shaded gray.
16
compounds could be divided according to molecular weight (e.g., equal or greaterthan 400 or less). Very many different descriptors can be utilized and decision treemethods are computationally very efficient and applicable to very large data sets.Typically, a learning set would consist of active and inactive compounds and onewould search for descriptor combinations that enrich active compounds in certainterminal nodes. The so derived descriptor pathways can then be used to search com-pound databases for other active compounds. Therefore, statistical partitioning meth-ods such as recursive partitioning are also very attractive tools for the analysis ofHTS data sets and the extraction of descriptor-activity relationships from them thatcan serve as predictive models of specific biological activities.
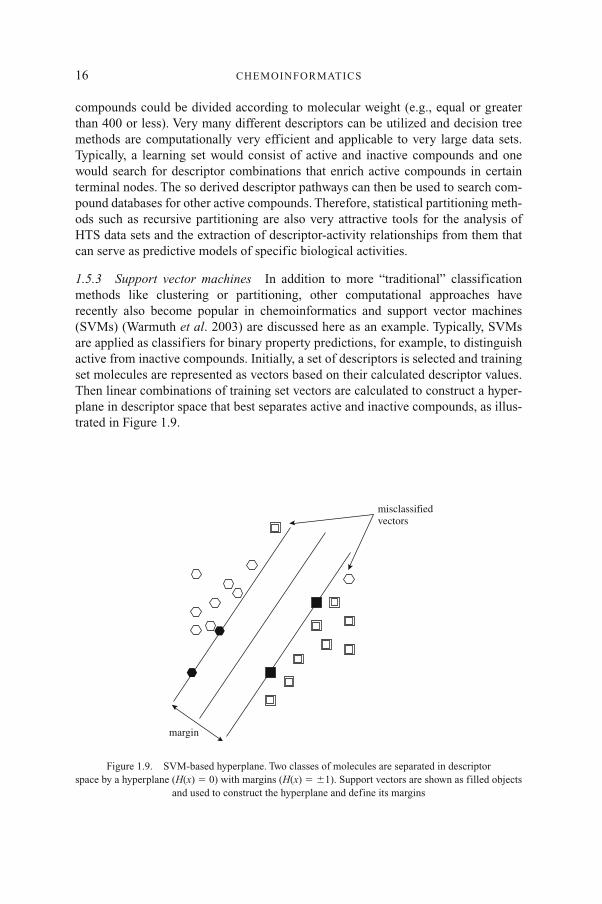
1.5.3 Support vector machines In addition to more “traditional” classificationmethods like clustering or partitioning, other computational approaches haverecently also become popular in chemoinformatics and support vector machines(SVMs) (Warmuth et al. 2003) are discussed here as an example. Typically, SVMsare applied as classifiers for binary property predictions, for example, to distinguishactive from inactive compounds. Initially, a set of descriptors is selected and trainingset molecules are represented as vectors based on their calculated descriptor values.Then linear combinations of training set vectors are calculated to construct a hyper-plane in descriptor space that best separates active and inactive compounds, as illus-trated in Figure 1.9.
CHEMOINFORMATICS
misclassifiedvectors
margin
Figure 1.9. SVM-based hyperplane. Two classes of molecules are separated in descriptor space by a hyperplane (H(x) � 0) with margins (H(x) � �1). Support vectors are shown as filled objects
and used to construct the hyperplane and define its margins
A polynomial function is applied to return the inner products of descriptor vectorsand the separating hyperplane is defined as
Here b is the distance between the hyperplane and the origin and w the distancebetween vector x and the hyperplane. The margin of the hyperplane is defined as itsminimum distance to any training set vector. A small number of vectors constitutingthe margin are called support vectors and are sufficient to construct a hyperplane thatseparates the remaining data points into two subsets. SVM calculations and hyper-plane construction can initially be carried out using small training sets and additionaldata can be added in a step-wise manner to further refine the prediction scheme.
1.6 SIMILARITY SEARCHING
Searching for compounds in databases that are similar to query molecules is one of themost widely applied molecular similarity-based approaches. Commonly used similar-ity search tools have different levels of complexity, as discussed in the following.
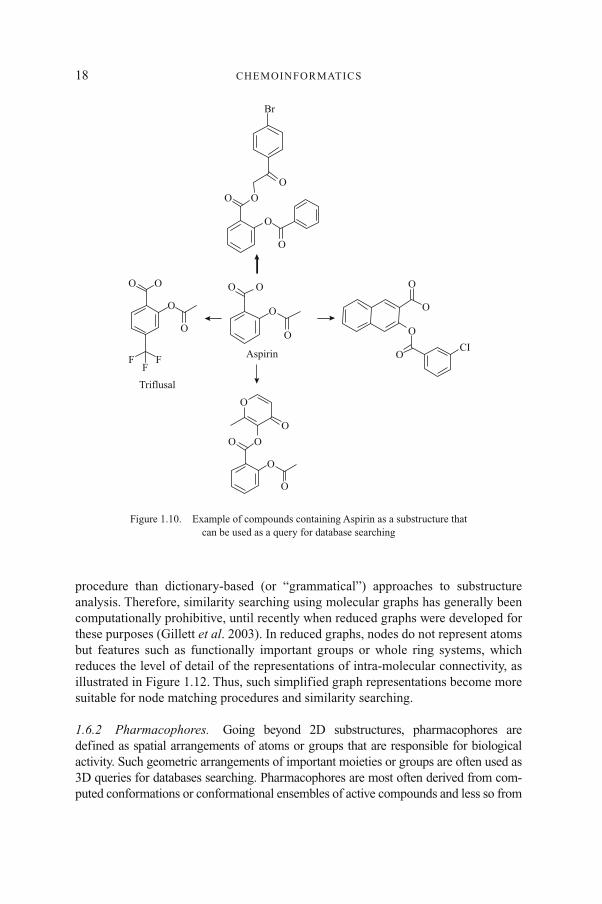
1.6.1 Structural queries and graphs. A simple but very popular form of similar-ity searching is the detection of structural fragments or substructures that are sharedby query and database compounds. Figure 1.10 illustrates the idea of substructuresearching.
In medicinal chemistry, substructure searches are often carried out to find analogsof active compounds in databases. Contemporary substructure search methods aremostly based on dictionaries or look-up tables of molecular fragments or fragment-type descriptors. Substructure search queries based on dictionaries of predefinedmolecular fragments can be transformed into an easily machine-readable format suchas the Simplified Molecular Input Line Entry specification widely known asSMILES code (Weininger 1988). As illustrated in Figure 1.11, SMILES encodes 2Drepresentations of molecules as linear strings of special alpha-numeric characters foratoms, their chemical character, bonding patterns, branch points, stereo centers etc.These query strings can be easily compared to those of database compounds.
Substructure searching has also been coupled with statistical analysis to identifymolecular fragments that are associated with biological activity of test compounds(Roberts et al. 2000). For example, substructures can be taken from series of activecompounds and their frequency of occurrence in compound databases can be deter-mined. Then the statistical significance of this frequency of occurrence in active mol-ecules and database compounds can be compared, which might indicate whether ornot a specific structural motif could be responsible for a given biological activity.
In molecular graphs, atoms are represented as nodes and bonds as edges.Conventional 2D representations of compound structures are typical graphs, butgraph representations of molecular connectivity can also be much simpler than that(as described below). Common substructures can also be determined by systematicmapping of corresponding node positions in graphs, which is called the analysis of“subgraph isomorphism”. However, computationally this is a much more expensive
H(x) � 0 � �w, x� � b
17CHEMOINFORMATICS THEORY
18
procedure than dictionary-based (or “grammatical”) approaches to substructureanalysis. Therefore, similarity searching using molecular graphs has generally beencomputationally prohibitive, until recently when reduced graphs were developed forthese purposes (Gillett et al. 2003). In reduced graphs, nodes do not represent atomsbut features such as functionally important groups or whole ring systems, whichreduces the level of detail of the representations of intra-molecular connectivity, asillustrated in Figure 1.12. Thus, such simplified graph representations become moresuitable for node matching procedures and similarity searching.
1.6.2 Pharmacophores. Going beyond 2D substructures, pharmacophores aredefined as spatial arrangements of atoms or groups that are responsible for biologicalactivity. Such geometric arrangements of important moieties or groups are often used as3D queries for databases searching. Pharmacophores are most often derived from com-puted conformations or conformational ensembles of active compounds and less so from
CHEMOINFORMATICS
Br
O O
O
O
O
OO
O
O
O
OO
O
O
O
OO
F F Aspirin
Triflusal
F
O
O
O
O
O
OCI
Figure 1.10. Example of compounds containing Aspirin as a substructure that can be used as a query for database searching

19CHEMOINFORMATICS THEORY
O
Structures Strings
c1ccccc1
Oc1cc(C)ccc1OC
s1c2[nH0]cc[nH0]c2c(N)c1C(=0)OCC
[S + 2]([O–])([O–])(CCC)C1 = Cc2ccccc2OC1 = O
C1c1ccc(cc1)C = C1Cc2ccccc2C1 = O
Clc1ccc(SCc2[nH0]c(sc2)c2o[nH0]cc2)cc1
Clc1ccc(cc1C1)C(=O)c1oc2ccc(OC)cc2c1
Fc1cc(F)c2[nH0]cc(c(N3CCOCC3)c2c1)C(= O)OCC
O
O
O
O
O
O
O
O
O
O
O
O
O
N
N
F
F
CI
CIO
N S CI
S
N
O
CI
S
N
N
N S
Figure 1.11. Examples of structures and corresponding SMILES strings

20
experimentally determined structures of ligands. Consequently, the majority of pharma-cophore models used to identify similar compounds represent hypotheses of 3D featurescrucial for biological activity.
For database searching, pharmacophores are best defined by all possible dis-tances between chosen groups or features (pharmacophore points). Therefore, asillustrated in Figure 1.13, they are best represented as a molecular graph (similar toreduced graphs). In this case, different from conventional graphs, however, nodescorrespond to points (or centroids) and edges to inter-point distances, rather thanbonds.
Graphs of query and test molecules can be compared by graph matching (subgraphdetection) algorithms or systematic comparison of inter-feature distances. Twomolecules are considered similar if their pharmacophores match for at least onepredicted conformation. In order to explore conformational space and generateconformational ensembles, multiple compound conformations are typically gener-ated by systematic conformational search (in increments) around rotatable bonds.
Three-point pharmacophores have traditionally been used for many applications buthave recently been more and more replaced by four-point pharmacophores (Mason et al.1999), which increases the complexity of the search but also the resolution of the phar-macophore analysis. This is the case because the additional point increases the totalnumber of inter-point distances from three for a three-point pharmacophore to six for afour-point pharmacophore. Pharmacophore searching is further refined by assigningalternative features to each point (e.g., hydrogen bond acceptors, donors, or chargedgroups) and ranges to inter-point distances (rather than an exact distance). For example,five different features (e.g., atom types or groups) may be permitted for each point
CHEMOINFORMATICS
F F
F
Ar ArL
F Ar ArL R
L
Ar
Ar
LF R
O
OO
O
OO O
O
N
NN
O
S
Figure 1.12. Examples of reduced graphs. Nodes corresponding to aromatic rings (Ar), aliphatic rings(R), functional groups (F) and linking groups (L) are shown (adapted from Gillet et al. 2003)

and ten inter-point distance intervals for each range, which makes it possible to capturethousands (if not millions) of similar yet distinct conformation-dependent pharma-cophore arrangements.
1.6.3 Fingerprints. Molecular fingerprints are widely used similarity searchtools. They consist of various descriptors that are encoded as bit strings. As illus-trated in Figure 1.14, bit strings of query and database compounds are calculated andquantitatively compared using similarity metrics such as the Tanimoto coefficient(Table 1.2). Fingerprint overlap between test compounds is regarded as a measure ofmolecular similarity. Thus, if the chosen coefficient reaches a pre-defined thresholdvalue, compared molecules are considered to be similar.
In many fingerprint designs, each bit position accounts for a specific feature (forexample, a structural fragment) and the bit is set on, if this feature is present in themolecule. Furthermore, value ranges of other molecular descriptors (e.g., molecularweight or the number of hydrogen bond acceptors) can also be incrementallyencoded as bit strings. So designed fingerprints may consist of hundreds to thou-sands of bit positions. It is important to note that string representations of molecular
21CHEMOINFORMATICS THEORY
Donor
Hydrophobic
Aromatic Ring/Acceptor
5 – 9 Å
4 – 8 Å
3 – 6.5 Å
Figure 1.13. Example of a possible 3-point pharmacophore representation


