* Author to whom correspondence should be addressed. (E-mail: [email protected]) CROATICA CHEMICA ACTA CCACAA, ISSN 0011-1643, e-ISSN 1334-417X Croat. Chem. Acta 86 (3) (2013) 335–344. http://dx.doi.org/10.5562/cca2377 Original Scientific Article Chemometric Analysis of Croatian Extra Virgin Olive Oils from Central Dalmatia Region Ozren Jović, a Tomislav Smolić, b Zorica Jurišić, c Zlatko Meić, a and Tomica Hrenar a, * a Faculty of Science, Department of Chemistry, University of Zagreb, Horvatovac 102A, HR-10000 Zagreb, Croatia b Agrokor d.d., Research and Development Department, Trg Dražena Petrovića 3, HR-10000 Zagreb, Croatia c Zvijezda d.d., Development Department, Marijana Čavića 1, HR-10000 Zagreb, Croatia RECEIVED OCTOBER 25, 2013; REVISED NOVEMBER 20, 2013; ACCEPTED NOVEMBER 20, 2013 Abstract. Extra virgin olive oil samples were collected from different geographical areas of Central Dal- matia region in Croatia including locations both on the coast and islands. This set included 41 oils of cul- tivar Oblica, 1 per cultivars Coratina and Leccino, and 5 of mixed cultivars Lastovka and Oblica. Attenu- ated total reflectance (ATR) spectra of non-treated samples were recorded and principal component analy- sis (PCA) was carried out on a set of obtained spectra, as well as their first and second derivatives. The quality of PCA models was assessed using leave-one-out cross-validation and optimal number of princi- pal components was determined. In the case of ATR spectra, the first principal component accounted for 42.92 % of the total variance among the samples and the optimal number of components was 6, whereas in the case of second derivatives the first principal component accounted for 95.76 % of the total variance and the optimal number of components was 3. Classification of olive oils on the basis of geographical origin was proposed and underlying spectral differences among the spectra were determined by investigat- ing principal component loadings. These differences arise as a result of variations in fatty acid composi- tion. It was found out that ATR in combination with PCA could easily distinguish between samples col- lected from the coastal area and those from the islands. Classification results were further confirmed by using spherical principal components procedure, projection pursuit and robust PCA, as well as hierar- chical cluster analysis.(doi: 10.5562/cca2377) Keywords: Croatia, extra virgin olive oils, ATR-FTIR spectroscopy, principal component analysis, cluster analysis INTRODUCTION The contribution of olive oil in the world trade of vege- table oils is a negligible 2.0 % in terms of volume, 1 but due to the high price in comparison to other edible oils such as sunflower, soybean or rapeseed oil it has an exceptional economic importance. Mediterranean coun- tries are traditional areas for growing and processing of olives. Due to data from The International Olive Coun- cil, member countries accounts for 98 % of the world’s olive oil production, 75 % of which is produced by EU countries. 2 Research activities in characterization of varietal olive oils in Mediterranean region, particularly Italy, Spain and Greece are quite intensive. In Croatia, due to strengthening of olive oil sector in the last fifteen years, characterization of domestic olive oil varieties recently has become more intense as well. Croatian olive oil sector is characterized with high olive oil quality, long- standing tradition of production, indigenous varieties and great potential for organic production. 3,4 Nowadays, the Croatian olive cultivation area is divided into six sub-regions, which differ in their specif- ic climatic and pedological conditions. These are Istria, Kvarner and its islands, Northern, Central, and Southern Dalmatia and Dalmatian hinterland. Different cultivars tend to be grown in different geographical areas due to differences in climate, soil and agricultural practice. In each of these sub-regions pedo-climatic conditions im- pose the specific cultivation, varieties, etc. The most prevailing and most important cultivar in Croatia is Oblica, 5 grown for olive oil production as well as a table olives cultivar. It is considered as one of the oldest autochthonous Dalmatian varieties 6 cultivated wherever it thrives. Olives growing in Croatia is increasing in the last decade and it could be considered as experiencing a real renaissance due to set of objective circumstances like
Transcript
* Author to whom correspondence should be addressed. (E-mail: [email protected])
aFaculty of Science, Department of Chemistry, University of Zagreb, Horvatovac 102A, HR-10000 Zagreb, Croatia bAgrokor d.d., Research and Development Department, Trg Dražena Petrovića 3, HR-10000 Zagreb, Croatia
cZvijezda d.d., Development Department, Marijana Čavića 1, HR-10000 Zagreb, Croatia
RECEIVED OCTOBER 25, 2013; REVISED NOVEMBER 20, 2013; ACCEPTED NOVEMBER 20, 2013
Abstract. Extra virgin olive oil samples were collected from different geographical areas of Central Dal-matia region in Croatia including locations both on the coast and islands. This set included 41 oils of cul-tivar Oblica, 1 per cultivars Coratina and Leccino, and 5 of mixed cultivars Lastovka and Oblica. Attenu-ated total reflectance (ATR) spectra of non-treated samples were recorded and principal component analy-sis (PCA) was carried out on a set of obtained spectra, as well as their first and second derivatives. The quality of PCA models was assessed using leave-one-out cross-validation and optimal number of princi-pal components was determined. In the case of ATR spectra, the first principal component accounted for 42.92 % of the total variance among the samples and the optimal number of components was 6, whereas in the case of second derivatives the first principal component accounted for 95.76 % of the total variance and the optimal number of components was 3. Classification of olive oils on the basis of geographical origin was proposed and underlying spectral differences among the spectra were determined by investigat-ing principal component loadings. These differences arise as a result of variations in fatty acid composi-tion. It was found out that ATR in combination with PCA could easily distinguish between samples col-lected from the coastal area and those from the islands. Classification results were further confirmed by using spherical principal components procedure, projection pursuit and robust PCA, as well as hierar-chical cluster analysis.(doi: 10.5562/cca2377)
Keywords: Croatia, extra virgin olive oils, ATR-FTIR spectroscopy, principal component analysis, cluster analysis
INTRODUCTION
The contribution of olive oil in the world trade of vege-table oils is a negligible 2.0 % in terms of volume,1 but due to the high price in comparison to other edible oils such as sunflower, soybean or rapeseed oil it has an exceptional economic importance. Mediterranean coun-tries are traditional areas for growing and processing of olives. Due to data from The International Olive Coun-cil, member countries accounts for 98 % of the world’s olive oil production, 75 % of which is produced by EU countries.2
Research activities in characterization of varietal olive oils in Mediterranean region, particularly Italy, Spain and Greece are quite intensive. In Croatia, due to strengthening of olive oil sector in the last fifteen years, characterization of domestic olive oil varieties recently has become more intense as well. Croatian olive oil sector is characterized with high olive oil quality, long-
standing tradition of production, indigenous varieties and great potential for organic production.3,4
Nowadays, the Croatian olive cultivation area is divided into six sub-regions, which differ in their specif-ic climatic and pedological conditions. These are Istria, Kvarner and its islands, Northern, Central, and Southern Dalmatia and Dalmatian hinterland. Different cultivars tend to be grown in different geographical areas due to differences in climate, soil and agricultural practice. In each of these sub-regions pedo-climatic conditions im-pose the specific cultivation, varieties, etc. The most prevailing and most important cultivar in Croatia is Oblica,5 grown for olive oil production as well as a table olives cultivar. It is considered as one of the oldest autochthonous Dalmatian varieties6 cultivated wherever it thrives.
Olives growing in Croatia is increasing in the last decade and it could be considered as experiencing a real renaissance due to set of objective circumstances like
336 O. Jović et al., Chemometric Analysis of Croatian Extra Virgin Olive Oils
Croat. Chem. Acta 86 (2013) 335.
state subsidizes, high olive oil price, new growing tech-nologies implementation, awareness of olive oil positive nutritional effect, etc. Higher popularization and im-proved quality of olive oils in recent time resulted in increased olive oil consumption as well. As a conse-quence, substantial capacities for olive processing were built and old equipment was replaced with the new one.5
Central Dalmatia is potentially the largest olive oil producing region in Croatia with the biggest olives growing areas, total number of olive fertile trees and installed processing capacities.5 Approximately 2 mil-lion olive trees, which represent about 40 % of total fund in Croatia, and about forty olive oil plants exist in this region.7 Most of these plants have installed modern technology and bigger processing capacity. Therefore, characterization of extra virgin olive oils from this re-gion represents important scientific and economic as-pects for Croatia.
Current interest of the scientific community on Croatian extra virgin olive oils has been focused mainly on the cultivars from Istria peninsula, and there are several publications on this topic. Koprivnjak and Conte8 compared the Croatian varieties Bianchera, Carbonazza and Busa with Italian Leccino variety using fatty acids and aliphatic hydrocarbons, whereas Škevin et al.9 studied the influence of variety and harvest time on the bitterness and phenolic compounds of western Istria varieties Bianchera and Busa and one introduced, an Italian variety (Leccino). The most recent research was focused on volatile compounds and sensory profiles of monovarietal virgin olive oils from Buža, Črna and Rosinjola cultivars in Istria.10–13 Regarding virgin olive oils from Dalmatia, the another Croatian extensive olive oil producing region, there are few studies carried out on characterization of chemical composition of extra virgin olive oils derived from the autochthonous olive cultivars in Dalmatia region (Oblica, Lastovka and Levantinka) by determination of selected organic pa-rameters as well as elemental composition.14–16 Re-search on evaluation of the influence of olive oil phe-nols on the stability of extra virgin olive oils was carried out on the representative monovarietal olive oils from the that region (Oblica, Lastovka, Levantinka, Drobnica, Mastrinka).17
There have been numerous studies over the years, attempting to establish a link between composition and geographical origin using a variety of instrumental ana-lytical techniques, generally coupled with multivariate data analysis.18–23 In particular, FTIR spectroscopy was shown to be an effective tool in the characterization, geographical classification24–26 or authentication of vegetable oils.27
Advancement of Fourier transform infrared spec-troscopy with attenuated total reflectance sampling (ATR) enables both qualitative and quantitative analysis
of different edible oils.28 Recorded vibrational spectra of analyzed samples are highly reproducible and ATR coupled with numerical methods can be used as a pow-erful analytical tool for simple and rapid edible oils authentication.29 Olive oils composition is affected by geographical origin due to the factors like soil, agricul-tural practice and regional climatic differences.30,31 Content of major (fatty acids) and minor (hydrocarbons, phenolics and sterols) olive oil components vary de-pending on these factors. Hence, verifying the declared origin is a challenging problem. A number of studies tried to establish a relationship between composition and geographical origin using many different analytical techniques coupled in general with multivariate proce-dures. Chromatographic analytical techniques (gas chromatography, GC; with mass spectroscopy, GC-MS, and high performance liquid chromatography, HPLC) have been utilized to quantify major32,33 and minor component classes.34–41 There has been many studies in the recent years that used nuclear magnetic resonance42–
44 (NMR) with the aim to distinguishing olive oils of different geographical areas. The major advantage of ATR45,46 over chromatographic techniques and NMR is that complex sample preparation is not necessary. Re-cent studies have also employed Fourier transform Ra-man spectroscopy (FT-Raman) for characterization of edible oils.47–50 Some authors assume that for classifica-tion of oils and detecting adulteration, infrared spectros-copy is a better technique than Raman spectroscopy,51 mainly due to the fact that the important bands for clas-sification are of low intensity in Raman spectra. Oppo-site studies also exist.52
Principal component analysis (PCA) is commonly used in vibrational spectroscopy for identifying the most important differences among the set of vibrational spec-tra.53 This statistical procedure has allowed an im-provement in precision and accuracy to levels not achieved before. Enhanced by this chemometric treat-ment, vibrational spectroscopy allows classification of foods to be undertaken without any prior chemical anal-ysis.54 PCA is used for description and classification of extra virgin olive oils based on their geographical origin. It is especially applicable for finding the differ-ences between highly correlated data, e.g. a set of ATR spectra of different olive oils with similar chemical composition. The principal components found during calibration one by one represent the main systematic variation in the data set. Sample classification is based on score difference of certain principal components where the most important are those that describe the maximum variance in a data set. PCA enables the use of complete spectra, not just wavenumbers from the ana-lyzed spectral region.
An additional tool for olive oils classification is hierarchical cluster analysis (CA). The task of clustering
O. Jović et al., Chemometric Analysis of Croatian Extra Virgin Olive Oils 337
Croat. Chem. Acta 86 (2013) 335.
is assigning a set of objects into groups (called clusters) in such a way that objects in the same cluster are more similar to each other than they resemble those in other clusters.31,55
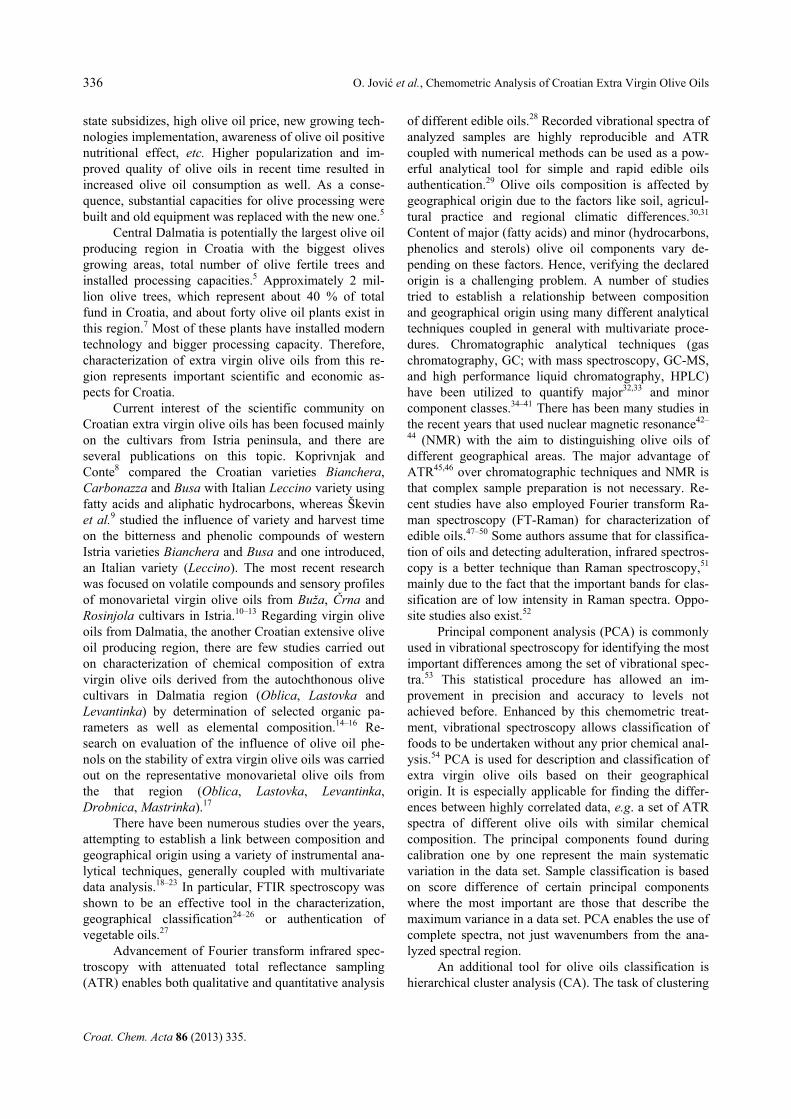
The results of the chemometric analysis (PCA and CA) on the ATR spectral data obtained from the sam-ples of olive oils collected from the five different geo-graphical locations of Central Dalmatia (Figure 1) will be presented and discussed. Particular attention will be paid to detect any possible differences in chemical com-position of olive oils existing due to the different costal or island origin of samples. On the basis of these results, classification regarding geographical origin will be proposed and underlying spectral differences among the spectra will be examined.
EXPERIMENTAL
A total of 48 extra virgin olive oils were sampled from local olive oil producers at five different geographical locations of Central Dalmatia, two coastal (from Makarska to Igrane and from Trogir to Marina) and three island locations (Brač, Hvar and Korčula) (Figure 1). The samples represent extra virgine olive oils from different cultivars with the same ripeness index obtained in a period of two months and processed by the same three phase centrifugal system in five local processing plants in Makarska, Marina, Brač, Hvar and Korčula. The olive ripeness index was calculated as reported by Garcia et al.56 Samples 1–10 were from Makarska to Igrane, 11–20 from Marina to Trogir, 21–34 from the island of Brač, 35–43 from the island of Hvar, and 44–48 were from the island of Korčula. There were 41
samples of variety Oblica, one sample of Coratina (sample 2), one of Leccino (sample 20) and five samples of mixed cultivars Lastovka and Oblica with dominant content of Lastovka (samples 44–48).
ATR-FTIR spectra were recorded in the spectral range 4000−600 cm−1 with a Bruker Equinox 55 spec-trometer applying a 2 cm−1 of nominal resolution and 128 scans. The spectrometer was located in an air-conditioned room and samples were allowed to adjust to the room temperature before measurement. The ATR crystal was zinc selenide mounted into a trough shaped plate. To obtain each absorbance spectrum, a back-ground of the clean and dry ATR crystal was first col-lected. Immediately after the collection of each back-ground, approximately 5 mL of the sample was placed on the ATR crystal using a pipet, ensuring that no air bubbles were trapped on the crystal surface. A single-beam spectrum of the particular sample was collected under the same acquisition conditions and converted to an absorbance spectrum using the background. Between sampling, ZnSe crystal was cleaned with Chemex clean-ing agent, followed by water and ethanol and dried. Dry crystal was also checked for possible remaining resi-dues.
All samples were measured several times to ensure the reproducibility of recorded spectra which is ex-tremely important for further chemometric analysis. Since we expected that the changes in vibrational spec-tra would be very subtle, we had to insure that there were no experimental uncertainties which could lead us to incorrect conclusions. Before and between spectral acquisitions, samples were stored in the dark at ambient temperature. During the overall acquisition, the temper-ature in the room was 22−24 °C. Multivariate Data Analysis
Numerical analysis were performed using the second order tensor analysis tool PCA where data matrix (or two-way array) X of rank r is decomposed as a sum of r matrices i it pt of rank 1
1
r
i iiX = t pt (1)
where it stands for score and ipt for loading vectors.
PCA finds the best linear projections for a high dimen-sional set of data in the least squares sense. Scores rep-resent projections of the original points on the principal component (PC) direction and can be used for classifi-cation, whereas loadings represent eigenvectors of data covariance (or correlation) matrix and can be used for the identification of variability among the data. Devel-opment of PCA goes back to Beltrami57 and Pearson58 while the name was introduced by Hotteling.59 More details can be found in the recent literature.60,61
Figure 1. Map of Croatia with its two geographical areashighlighted: Istria and Dalmatia.
338 O. Jović et al., Chemometric Analysis of Croatian Extra Virgin Olive Oils
Croat. Chem. Acta 86 (2013) 335.
Data obtained by ATR spectral measurements of different extra virgin olive oil samples were exported to the ASCII format and arranged in the matrix (numbers written in a free format). Numerical derivatives were conducted using the five point stencil method for the de-rivatives in one dimension. Subsets of spectral data in the range from 3100 to 2600 cm−1 and from 1900 to 650 cm–1 were selected providing two-way data matrices of dimen-sions 48 samples × 1763 wavenumbers. Data were mean-centered and PCA on the covariance matrix was carried out using our own FORTRAN code62 based on the NIPALS algorithm.63 Most of the calculated eigenvectors converged within a small number of iterations which took only few minutes of computational time on an average workstation. The results of PCA could be extremely sensi-tive to the presence of small number of outliers. These outliers could artificially increase the variance in a random direction and thus have a significant impact on the classi-fication. To test the robustness of our PCA study, we performed three different methods implemented in the program R,64,65 namely projection pursuit PCA, robust PCA (ROBPCA) and spherical principal components procedure.66 Optimal number of principal component was determined using the leave-one-out cross-validation for the 0th and the 2nd derivatized ATR spectra.67
Samples of extra virgin olive oils were also ana-lyzed with Euclidean distance cluster analysis (Ward's method) in the program R.64,65 Euclidean distance is defined as the square root of sum of square differences between two samples (x and y) (for each variable i in multidimensional space). It is computed as:
1/22Euclidean distance( , ) i ii
x y x y (2)
The Ward’s method performs the total within-cluster variance minimization. Firstly, each cluster is denoted as a single point (i.e. all cluster are singletons). The initial distance between these single points is the squared Euclidean distance. When a new cluster is ob-tained, the cluster mean is calculated and the squared Euclidean distance to the cluster mean is calculated for every sample within that cluster. These distances are summed for all cases. The error sum of squares is the overall sum of the squared Euclidean distances (to the cluster means) for all clusters. Subsequently, two clus-ters that contribute minimally to the increase in error sum of squares (i.e. to the minimum increase in the overall sum of the squared Euclidean within-cluster distances) are selected and merged.68
RESULTS AND DISCUSSION
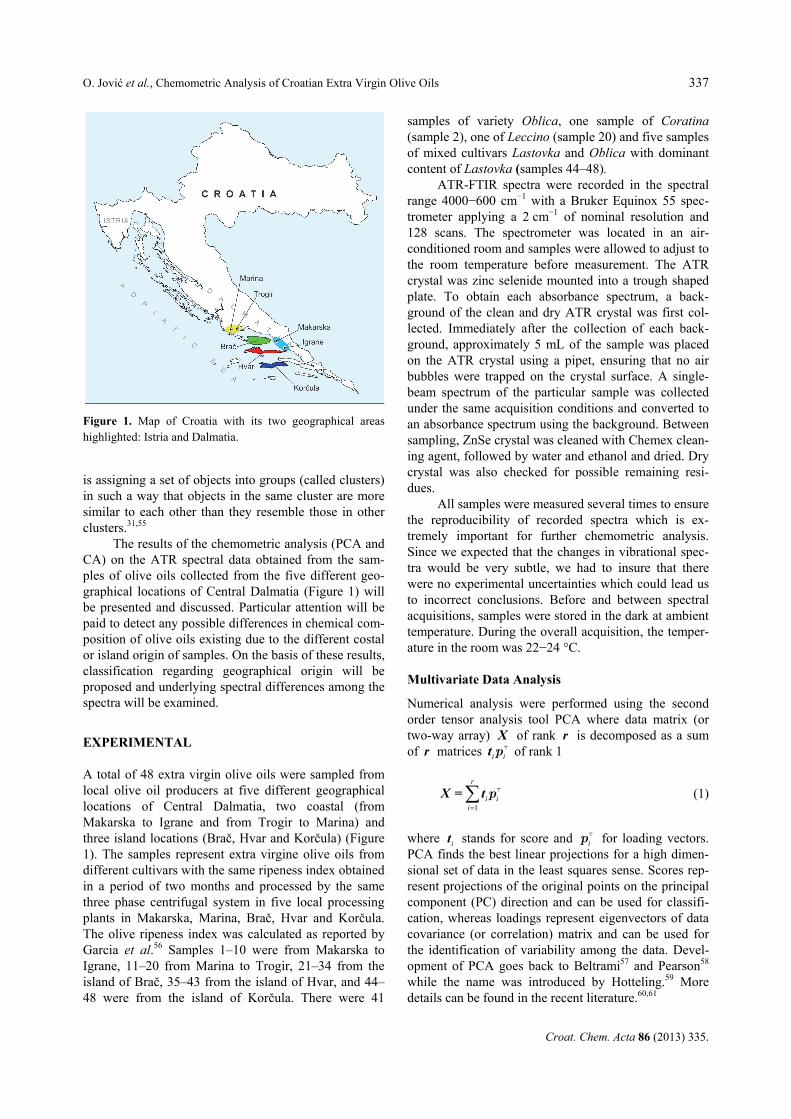
ATR spectra of all 48 different olive oil samples are shown in Figure 2. Regarding differentiation between
samples, it is obvious that little can be gained from examining raw spectral data, which appear virtually indistinguishable. Edible fats and oils are basically con-stituted of triacylglicerols, differing in a degree and a form of unsaturation as well as in length of constituting acyl-groups. Therefore, spectra are dominated by the absorption bands arising from triacylglicerols.69 In the presence of these strong absorptions, it is very difficult to see more subtle spectral contributions arising from e.g. differences in fatty acid composition or from nontriacylglicerol minor components.
There are several common bands for the all fatty acids and their esters. Spectral range 3000−2800 cm−1 contains vibrations corresponding to the C−H stretch-ings. Two very strong separate bands at 2922 and 2853 cm−1 arise as a result of antisymmetric and symmetric stretchings of methylenic groups.50 Shoulder bands at 2953 and 2871 cm−1 are assigned to antisymmetric and symmetric stretchings of −CH3 groups.50,70
A very strong band with peak maximum at 1744 cm−1 belongs to the C=O ester group stretching vibra-tion.17 The medium band at 1711 cm−1 corresponds to the stretching of free fatty acid carbonyl group.71 The absorption band with very weak intensity at 1654 cm−1 is due to the C=C stretching vibration of cis-olefins.53,72 In the range 1500−1300 cm−1, absorbance peaks at 1465 and 1377 cm−1 could be assigned to CH2 and CH3 bend-ing vibrations, at 1418 cm−1 to rocking vibrations of CH bonds of cis-disubstituted olefins and at 1397 cm−1 to in plane bending vibrations of CH cis-olefinic groups.50 The bands at 1237, 1161, 1118, 1096 cm−1 are associat-ed with the C−O stretching vibrations.64 The band at 966 cm−1 corresponds to the out-of-plane bending vibra-tion of trans –HC=CH− group17 and the one with peak at 914 cm−1 is due to out-of-plane bending vibration of cis H−C=C−H group.73,74 The band with peak at 723 cm−1 is due to overlapping of the CH2 rocking vibration and the out-of-plane vibration of cis-disubstituted ole-fins.50
Figure 2. ATR spectra of 48 Croatian extra virgin olive oils samples.
O. Jović et al., Chemometric Analysis of Croatian Extra Virgin Olive Oils 339
Croat. Chem. Acta 86 (2013) 335.
More precise information regarding the differ-ences between olive oil vibrational spectra could be obtained from the mean centered spectra (not presented here), indicating that ATR can reveal certain composi-tional differences between various extra virgin olive oil samples. These compositional differences may be the result of a difference in geographical origins of investi-gated olive oils and will be examined in more details by PCA and CA. PCA on 0th, 1st and 2nd Derivatized ATR Spectra
The results of PCA are shown in Table 1 where the total variances described by principal components of 0th, 1st and 2nd derivatized ATR spectra sets are presented.
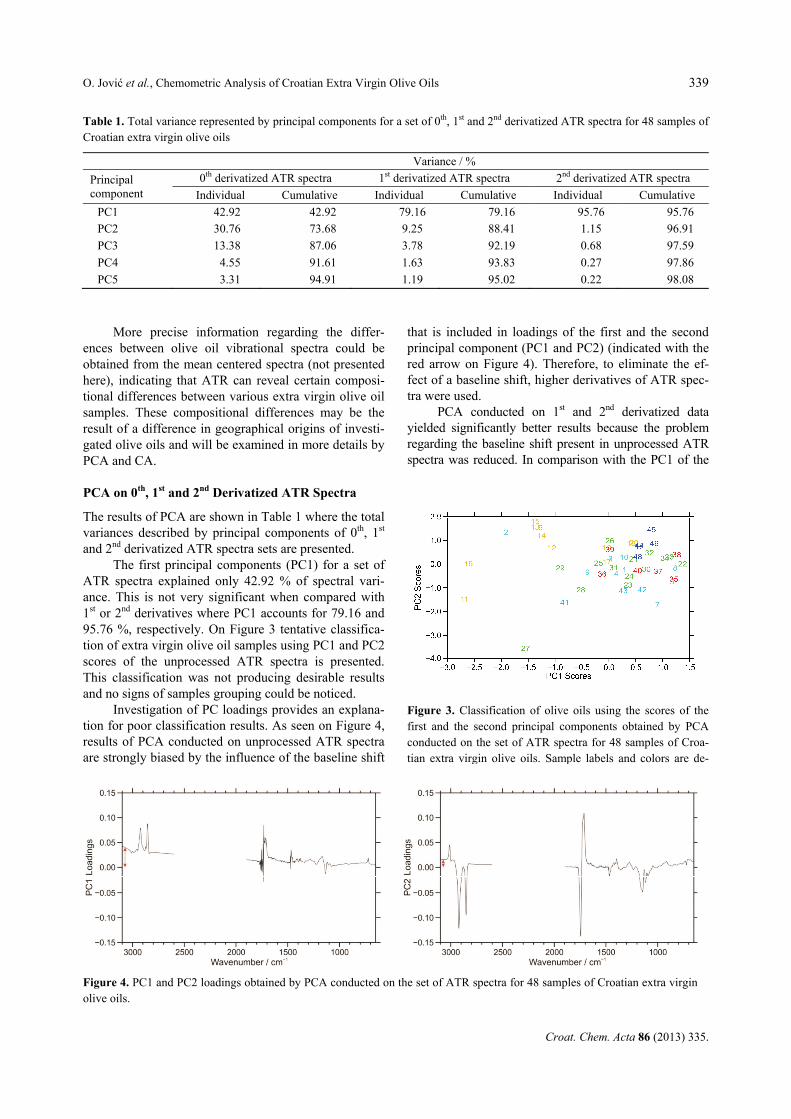
The first principal components (PC1) for a set of ATR spectra explained only 42.92 % of spectral vari-ance. This is not very significant when compared with 1st or 2nd derivatives where PC1 accounts for 79.16 and 95.76 %, respectively. On Figure 3 tentative classifica-tion of extra virgin olive oil samples using PC1 and PC2 scores of the unprocessed ATR spectra is presented. This classification was not producing desirable results and no signs of samples grouping could be noticed.
Investigation of PC loadings provides an explana-tion for poor classification results. As seen on Figure 4, results of PCA conducted on unprocessed ATR spectra are strongly biased by the influence of the baseline shift
that is included in loadings of the first and the second principal component (PC1 and PC2) (indicated with the red arrow on Figure 4). Therefore, to eliminate the ef-fect of a baseline shift, higher derivatives of ATR spec-tra were used.
PCA conducted on 1st and 2nd derivatized data yielded significantly better results because the problem regarding the baseline shift present in unprocessed ATR spectra was reduced. In comparison with the PC1 of the
Table 1. Total variance represented by principal components for a set of 0th, 1st and 2nd derivatized ATR spectra for 48 samples of Croatian extra virgin olive oils
Figure 3. Classification of olive oils using the scores of thefirst and the second principal components obtained by PCAconducted on the set of ATR spectra for 48 samples of Croa-tian extra virgin olive oils. Sample labels and colors are de-
Figure 4. PC1 and PC2 loadings obtained by PCA conducted on the set of ATR spectra for 48 samples of Croatian extra virgin olive oils.
340 O. Jović et al., Chemometric Analysis of Croatian Extra Virgin Olive Oils
Croat. Chem. Acta 86 (2013) 335.
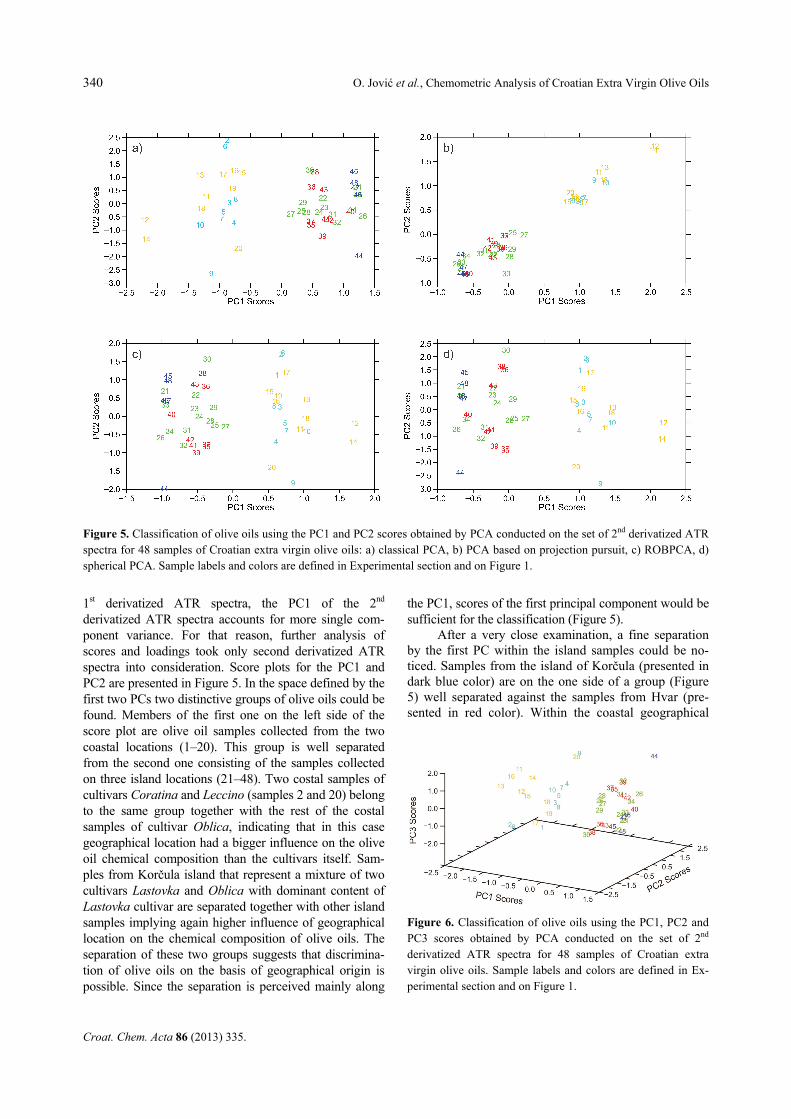
1st derivatized ATR spectra, the PC1 of the 2nd derivatized ATR spectra accounts for more single com-ponent variance. For that reason, further analysis of scores and loadings took only second derivatized ATR spectra into consideration. Score plots for the PC1 and PC2 are presented in Figure 5. In the space defined by the first two PCs two distinctive groups of olive oils could be found. Members of the first one on the left side of the score plot are olive oil samples collected from the two coastal locations (1–20). This group is well separated from the second one consisting of the samples collected on three island locations (21–48). Two costal samples of cultivars Coratina and Leccino (samples 2 and 20) belong to the same group together with the rest of the costal samples of cultivar Oblica, indicating that in this case geographical location had a bigger influence on the olive oil chemical composition than the cultivars itself. Sam-ples from Korčula island that represent a mixture of two cultivars Lastovka and Oblica with dominant content of Lastovka cultivar are separated together with other island samples implying again higher influence of geographical location on the chemical composition of olive oils. The separation of these two groups suggests that discrimina-tion of olive oils on the basis of geographical origin is possible. Since the separation is perceived mainly along
the PC1, scores of the first principal component would be sufficient for the classification (Figure 5).
After a very close examination, a fine separation by the first PC within the island samples could be no-ticed. Samples from the island of Korčula (presented in dark blue color) are on the one side of a group (Figure 5) well separated against the samples from Hvar (pre-sented in red color). Within the coastal geographical
Figure 5. Classification of olive oils using the PC1 and PC2 scores obtained by PCA conducted on the set of 2nd derivatized ATRspectra for 48 samples of Croatian extra virgin olive oils: a) classical PCA, b) PCA based on projection pursuit, c) ROBPCA, d)spherical PCA. Sample labels and colors are defined in Experimental section and on Figure 1.
Figure 6. Classification of olive oils using the PC1, PC2 and PC3 scores obtained by PCA conducted on the set of 2nd
derivatized ATR spectra for 48 samples of Croatian extra virgin olive oils. Sample labels and colors are defined in Ex-perimental section and on Figure 1.
O. Jović et al., Chemometric Analysis of Croatian Extra Virgin Olive Oils 341
Croat. Chem. Acta 86 (2013) 335.
areas (from Makarska to Igrane and Trogir to Marina), further separation could not be achieved.
In order to confirm our findings, the space spanned by first three PC was also investigated (Figure 6). Classification using the scores of PC1, PC2 and PC3 did not provide any additional information, thus con-firming the fact that first two PC are sufficient for clas-sification on the basis of geographical origin. Cross-validation In order to additionally validate our classification, the optimal numbers of components for PCA models were determined using the leave-one-out (LOO) cross-validation (CV). CV is a standard resampling technique
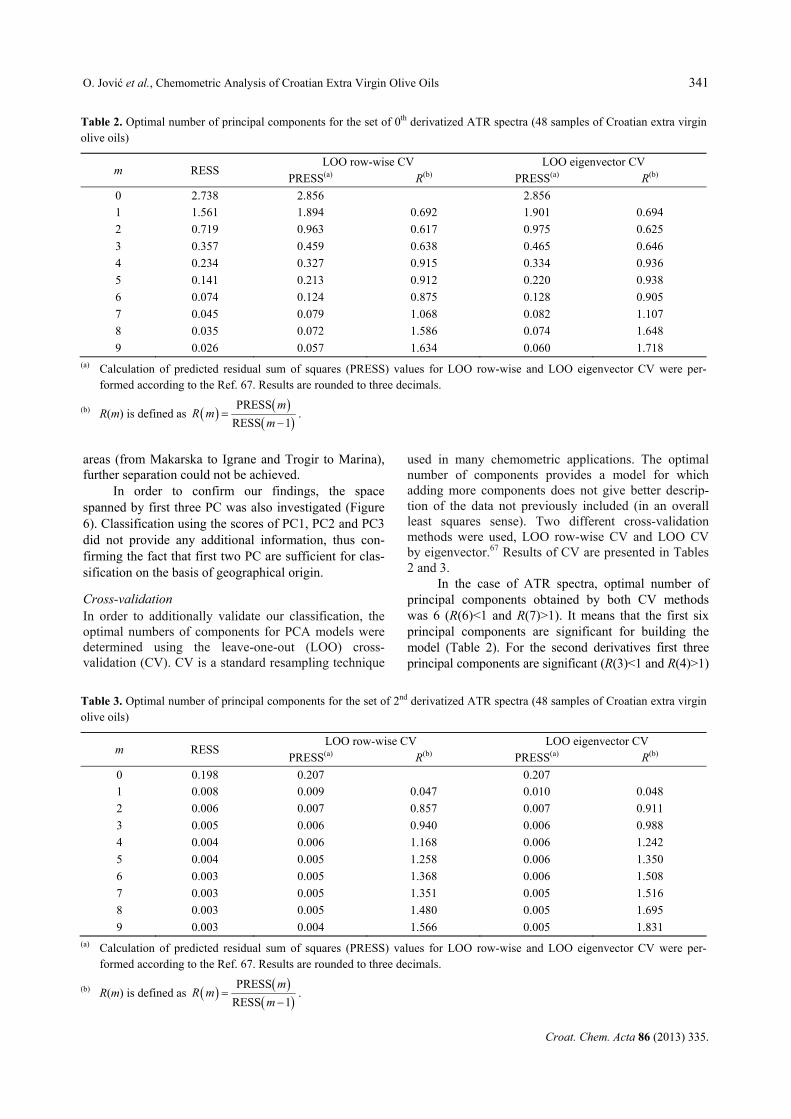
used in many chemometric applications. The optimal number of components provides a model for which adding more components does not give better descrip-tion of the data not previously included (in an overall least squares sense). Two different cross-validation methods were used, LOO row-wise CV and LOO CV by eigenvector.67 Results of CV are presented in Tables 2 and 3.
In the case of ATR spectra, optimal number of principal components obtained by both CV methods was 6 (R(6)<1 and R(7)>1). It means that the first six principal components are significant for building the model (Table 2). For the second derivatives first three principal components are significant (R(3)<1 and R(4)>1)
Table 2. Optimal number of principal components for the set of 0th derivatized ATR spectra (48 samples of Croatian extra virgin olive oils)
m RESS LOO row-wise CV LOO eigenvector CV
PRESS(a) R(b) PRESS(a) R(b)
0 2.738 2.856 2.856
1 1.561 1.894 0.692 1.901 0.694
2 0.719 0.963 0.617 0.975 0.625
3 0.357 0.459 0.638 0.465 0.646
4 0.234 0.327 0.915 0.334 0.936
5 0.141 0.213 0.912 0.220 0.938
6 0.074 0.124 0.875 0.128 0.905
7 0.045 0.079 1.068 0.082 1.107
8 0.035 0.072 1.586 0.074 1.648
9 0.026 0.057 1.634 0.060 1.718 (a) Calculation of predicted residual sum of squares (PRESS) values for LOO row-wise and LOO eigenvector CV were per-
formed according to the Ref. 67. Results are rounded to three decimals.
(b) R(m) is defined as
PRESS
RESS 1
mR m
m
.
Table 3. Optimal number of principal components for the set of 2nd derivatized ATR spectra (48 samples of Croatian extra virgin olive oils)
m RESS LOO row-wise CV LOO eigenvector CV
PRESS(a) R(b) PRESS(a) R(b)
0 0.198 0.207 0.207
1 0.008 0.009 0.047 0.010 0.048
2 0.006 0.007 0.857 0.007 0.911
3 0.005 0.006 0.940 0.006 0.988
4 0.004 0.006 1.168 0.006 1.242
5 0.004 0.005 1.258 0.006 1.350
6 0.003 0.005 1.368 0.006 1.508
7 0.003 0.005 1.351 0.005 1.516
8 0.003 0.005 1.480 0.005 1.695
9 0.003 0.004 1.566 0.005 1.831 (a) Calculation of predicted residual sum of squares (PRESS) values for LOO row-wise and LOO eigenvector CV were per-
formed according to the Ref. 67. Results are rounded to three decimals.
(b) R(m) is defined as
PRESS
RESS 1
mR m
m
.
342 O. Jović et al., Chemometric Analysis of Croatian Extra Virgin Olive Oils
Croat. Chem. Acta 86 (2013) 335.
for both LOO row-wise and LOO eigenvector CV, con-firming the validity of our classification models. Assignment of Principal Components Obtained from 2nd Derivatized ATR Spectra
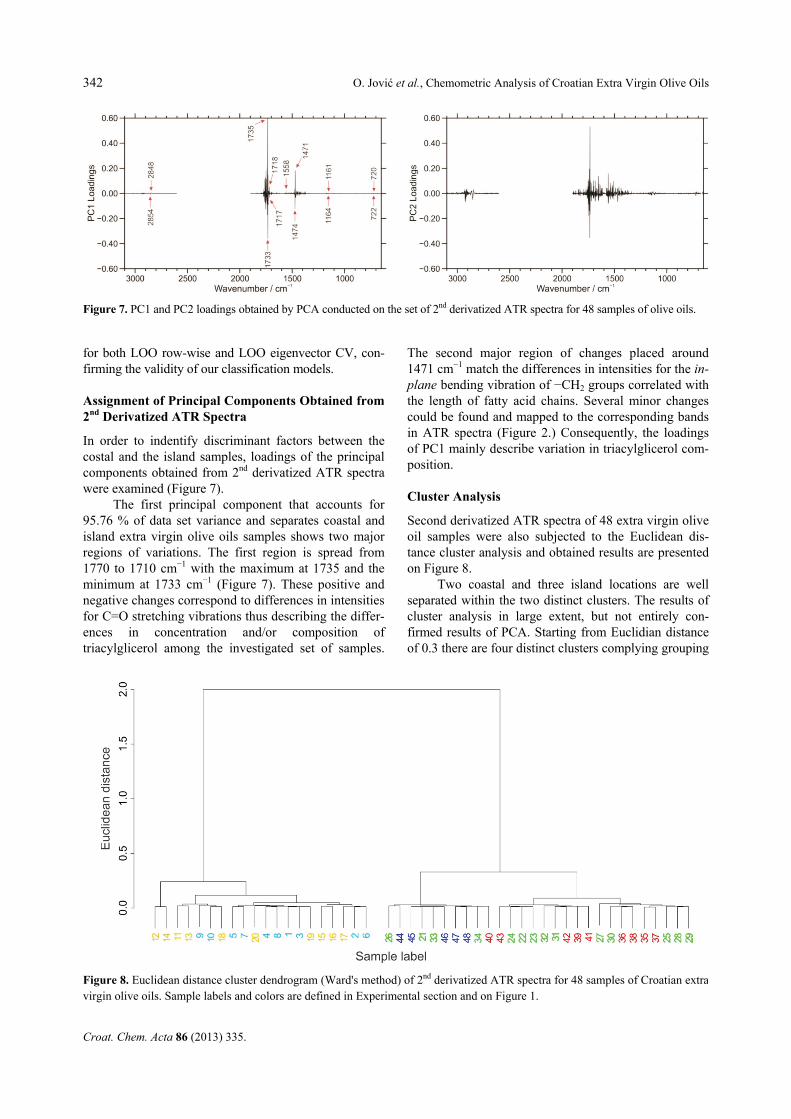
In order to indentify discriminant factors between the costal and the island samples, loadings of the principal components obtained from 2nd derivatized ATR spectra were examined (Figure 7).
The first principal component that accounts for 95.76 % of data set variance and separates coastal and island extra virgin olive oils samples shows two major regions of variations. The first region is spread from 1770 to 1710 cm−1 with the maximum at 1735 and the minimum at 1733 cm−1 (Figure 7). These positive and negative changes correspond to differences in intensities for C=O stretching vibrations thus describing the differ-ences in concentration and/or composition of triacylglicerol among the investigated set of samples.
The second major region of changes placed around 1471 cm−1 match the differences in intensities for the in-plane bending vibration of −CH2 groups correlated with the length of fatty acid chains. Several minor changes could be found and mapped to the corresponding bands in ATR spectra (Figure 2.) Consequently, the loadings of PC1 mainly describe variation in triacylglicerol com-position. Cluster Analysis
Second derivatized ATR spectra of 48 extra virgin olive oil samples were also subjected to the Euclidean dis-tance cluster analysis and obtained results are presented on Figure 8.
Two coastal and three island locations are well separated within the two distinct clusters. The results of cluster analysis in large extent, but not entirely con-firmed results of PCA. Starting from Euclidian distance of 0.3 there are four distinct clusters complying grouping
Figure 7. PC1 and PC2 loadings obtained by PCA conducted on the set of 2nd derivatized ATR spectra for 48 samples of olive oils.
Figure 8. Euclidean distance cluster dendrogram (Ward's method) of 2nd derivatized ATR spectra for 48 samples of Croatian extravirgin olive oils. Sample labels and colors are defined in Experimental section and on Figure 1.
O. Jović et al., Chemometric Analysis of Croatian Extra Virgin Olive Oils 343
Croat. Chem. Acta 86 (2013) 335.
pattern obtained by PCA that can be noticed as sample aggregation along PC1 (Figure 5). The difference be-tween the coastal and the island locations is well pro-nounced in CA but opposing to PCA results, some addi-tional clustering within the island samples could be seen. Samples from Korčula form a subcluster and are separat-ed from those from islands of Hvar and Brač in a manner similar to the PCA results. Further separation between the samples from Hvar and Brač could be seen, but with no clear distinction on the basis of geographical origin. CONCLUSION
Classification of 48 Croatian extra virgin olive oil samples from five geographical areas of Central Dalmatia region is presented in this paper. This classification was carried out without any chemical pretreatment or prior knowledge about the composition of oils. The results of principal component analysis on the second derivatized ATR spectra were found to be superior when compared to results ob-tained from ATR spectra or their first derivatives. In the case of ATR spectra, PC1 accounted for 42.92 % of the total variance among the samples (optimal number of components determined by leave-one-out cross-validation was 6) whereas in the case of second derivatives PC1 ac-counted for 95.76 % of the total variance (optimal number of components was 3). Classification results obtained by classical PCA were further confirmed by using three robust variations of PCA, namely spherical principal components procedure, projection pursuit and robust PCA, as well as hierarchical cluster analysis.
Extra virgin olive oils subjected to chemometric analyses could be divided into two major groups, one containing the coastal samples and the other containing samples from the islands. Investigation of principal component loadings revealed the major differences among the ATR spectra regarding different geograph-ical area. These differences are associated with the total number of carbonyl and methylenic functional groups, reflecting variations in triacylglicerol content and/or composition of olive oils from different geographical locations. However, within the coastal or the island geographical areas, samples from different locations could not be distinguished although large score differ-ences within the same group of samples could be noted. Cluster analysis predicted classification comparable to the PCA results as well as separation within the island samples from Hvar and Brač but with no clear distinc-tion of these samples based on geographical area.
Acknowledgements. This work was supported by the Ministry of Science, Education and Sports of the Republic of Croatia (Project 119-1191342-2959). We wish to thank Professor Tomislav Cvitaš for generously providing us with the map of Croatia.
REFERENCES
1. F. Luchetti, Eur. J. Lipid Sci. Technol. 104 (2002) 559–563. 2. International Olive Council, Olivae No. 117 (2012) 28–34 3. E. Perica, M. Cerjak, and O. Mikuš, Pomologia Croatica 16
(2010) 73–88. 4. B. Zadro and S. Perica, Ed., Maslina i maslinovo ulje A – Ž,
Naklada Zadro, 2007, Zagreb. 5. V. Šimunović, Pomologia Croatica 11 (2005) 69–78. 6. J. Zec, Sortiment maslina u Dalmaciji (1955) 28–39. 7. Croatian Chamber of Economy, http://www.hgk.hr/ 8. O. Koprivnjak and L. S. Conte, Riv. It. Sost. Grasse 73 (1996)
317–320. 9. D. Škevin, D. Rade, D. Štrucelj, Ž. Mokrovčak, S. Neđeral, and
Đ. Benčić, Eur. J. Lipid Sci. Technol. 105 (2003) 536–541. 10. K. Brkić Bubola, O. Koprivnjak, B. Sladonja, and I. Lukić, Food
Technol. Biotech. 50 (2012) 192–198. 11. K. Brkić Bubola, O. Koprivnjak, and B. Sladonja, Food Chem.
132 (2012) 98–103. 12. K. Brkić Bubola, O. Koprivnjak, B. Sladonja, D. Škevin, and I.
Belobrajić, Eur. J. Lipid Sci. Technol. 114 (2012) 1400–1408. 13. V. Majetić Germek, O. Koprivnjak, B. Butinar, L. Pizzale, M.
Bucar-Miklavc ic, and L. S. Conte, J. Agric. Food Chem. 61 (2013) 5921–5927.
14. M. Žanetić, D. Štruceli, S. Perica, D. Škevin, A. Serraiocco, and N. Simone, Riv. It. Sost. Grasse 87 (2010) 24 –33.
15. M. Zeiner, I. Juranovic-Cindric, and D. Skevin, Eur. J. Lipid Sci. Technol. 112 (2010) 1248–1252.
16. D. Škevin, K. Kraljić, L. Miletić, M. Obranović, S. Neđeral, and S. Petričević, Croatian Journal of Food Technology, Biotechnology and Nutrition 6 (2011) 117–122.
17. M. Žanetić, L. Cerretani, D. Škevin, O. Politeo, E. Vitanović, M. Jukić Špika, S. Perica, and M. Ožić, J. Food Agric. Environ. 11 (2013) 126–131.
18. R. Boggia, P. Zunin, S. Lanteri, N. Rossi, and F. Evangelisti, J. Agric. Food Chem. 50 (2002) 2444–2449.
19. S. López-Feria, S. Cárdenas J. A. García-Mesa, and M. Valcárcel, Talanta 75 (2008) 937–943.
20. N. A. Marigheto, E. K. Kemsley, M. Defernez, and R. H. Wilson, J. Am. Oil Chem. Soc. 75 (1998) 987–992.
21. G. Vlahov, A. D. Shaw, and D. B. Kell, J. Am. Oil Chem. Soc. 76 (1999) 1223–1231.
22. A. Sacco, M. A. Brescia, V. Liuzzi, F. Reniero, C. Guillou, S. Ghelli, and P.van der Meer, J. Am. Oil Chem. Soc. 77 (2000) 619–625.
23. L. Mannina, G. Dugo, F. Salvo, L. Cicero, G. Ansanelli, C. Calcagni, and A. Segre, J. Agric. Food Chem. 51 (2003) 120–127.
24. M. De Luca, w. Terouzi, G. Ioele, F. Kzaiber, A. Oussama, F. Oliverio, R. Tauler, and G. Ragno, Food Chem. 124 (2011) 1113–1118.
25. H. S. Tapp, M. Defernez, and E. K. Kemsley, J. Agric. Food Chem. 51 (2003) 6110–6115.
26. N. Dupoy, L. Duponchel, J. P. Huvenne, B. Sombret and P. Legrand, Food Chem. 57 (1996) 245–251.
27. M. J. Lerma-García, G. Ramis-Ramos, J. M. Herrero-Martínez, and E. F. Simó-Alfonso, Food Chem. 118 (2010) 78–83.
28. M. Safar, D. Bertrand, P. Robert, M. F. Devaux, and C. Genot, J. Am. Oil Chem. Soc. 71 (1994) 371−377.
29. G. Gurdeniz and B. Ozen, Food Chem. 116 (2009) 519–525. 30. E. Fedeli, Lipids of olives, in: E. Ralph and T. Holman (Eds.),
Progress of Chemistry of Fats and Other Lipids, Pergamon Press: Paris, France, 1977, pp. 57−74.
31. A. K. Kiritsakis, J. Am. Oil Chem. Soc. 75 (1998) 673−681. 32. C. E. Spangenberg and A. A. Macko, J. Agric. Food. Chem. 46
344 O. Jović et al., Chemometric Analysis of Croatian Extra Virgin Olive Oils
Croat. Chem. Acta 86 (2013) 335.
33. E. Stefanoudaki, F. Kotsifaki, and A. Koutsaftakis, J. Am. Oil Chem. Soc. 76 (1999) 623−626.
34. T. Rezanka and H. Rezanková, Anal. Chim. Acta 398 (1999) 253–261.
35. M. Tasioula-Margari and O. Okogeri, J. Food. Sci. 66 (2001) 530−534.
36. A. Garcia, M. Brenes, C. Romero, P. Garcia, and A. Garrido, Eur. Food Res. Technol. 215 (2002) 407−412.
37. L. Webster, P. Simpson, A. M. Shanks, and C. F. Moffat, Analyst 125 (1999) 97−104.
38. R. Bortolomeazzi, P. Berno, L. Pizzale, and L. Conte, J. Agric. Food. Chem. 49 (2001) 3278−3283.
39. E. Stefanoudaki, F. Kotsifaki, and A. Koutsaftakis, Food Chem. 60 (1997) 425−432.
40. L. Cinquanta, M. Esti, and E. LaNotte, J. Am. Oil Chem. Soc. 74 (1997) 1259−1264.
41. E. Bešter, B. Butinar, M. Bučar-Miklavčič, and T. Golob, Food Chem. 108 (2008) 446–454.
42. G. Vlahov, C. Schiavone, and N. Simone, Magn. Reason. Chem. 39 (2001) 689−695.
43. L. Mannina, M. Patumi, N. Proietti, D. Bassi, and A. L. Segre, J. Agric. Food Chem. 49 (2001) 2687−2696.
44. A. Brescia, G. Alviti, V. Liuzzi, and A. Sacco, J. Am. Oil Chem. Soc. 80 (2003) 945−950.
45. B. F. Ozen and L. J. Mauer, J. Agric. Food. Chem. 50 (2002) 3898−3901.
46. N. Dupuy, L. Duponchel, J. P. Huvenne, B. Sombret, and P. Legrand, Food Chem. 57 (1996) 245−251.
47. V. Baeten, P. Hourant, M. T. Morales, and R. Aparacio, J. Agric. Food Chem. 46 (1998) 2638−2646.
48. V. Baeten, M. Meurenes, M. T. Morales, and R. Aparacio, J. Agric. Food. Chem. 44 (1996) 2225−2230.
49. V. Baeten and R. Aparacio, Biotechnol. Agron. Soc. Environ. 4 (2000) 196−203.
50. B. Muik, B. Lendl, A.Molina-Diaz, and M. J. Ayora-Canada, Anal. Chim. Acta 487 (2003) 211−220.
51. N. A. Marigheto, E. K. Kemsley, M. Defernez, and R. H. Wilson, J. Am. Oil Chem. Soc. 75 (1998) 987–992.
52. H. Yang and J. Irudayaraj, J. Am. Oil Chem. Soc. 78 (2001) 889–895.
53. N. Vlachos, Y. Skopelitis, M. Psaroudaki, V. Konstantinidou, A. Chatzilazarou, and E. Tegou, Anal. Chim. Acta 573–574 (2006) 459–465.
54. S. M. Obeidat, M. S. Khanfar, and W. M. Obeidat, Aust. J. Basic Appl. Sci. 3 (2009) 2048−2053.
55. J. Moros, M. Roth, S. Garrigues, and M. Guardia, Food Chem. 114 (2009) 1529–1536.
56. J. M. Garcia, F. Gutierrez, M. J. Barrera, M. A. Alibi, J. Agric. Food Chem. 44 (1996) 590–593.
57. E. Beltrami, Giornale di Matematiche ad Uso degli Studenti Delle Universita 11 (1873) 98−106.
58. K. Pearson, Phil. Mag. 2 (1901) 559–572. 59. H. Hotelling, J. Educ. Psychol. 24 (1933) 417–441. 60. I. T. Jolliffe, Principal Component Analysis, Springer, Berlin,
1986. 61. A Smilde, R. Bro, and P. Geladi, Multi-way Analysis with
Applications in the Chemical Sciences, John Wiley & Sons Ltd, Chichester, 2004.
62. T. Hrenar, moonee, Code for Manipulation and Analysis of Multi- and Univariate Data, rev. 0.682.
63. P. Geladi and B. Kowalski, Anal. Chim. Acta 185 (1986) 1–17. 64. http://www.r-project.org/ 65. http://www.uga.edu/strata/software/pdf/clusterTutorial.pdf 66. P. Filzmoser and V. Todorov, Anal. Chim. Acta 705 (2011) 2–14. 67. R. Bro, K. Kjeldahl, A. K. Smilde, and H. A. L. Kiers, Anal.
Bioanal. Chem. 390 (2008) 1241–1251. 68. B. S. Everitt, S. Landau, and M. Leese, Cluster Analysis, 4th
Edition, Oxford University Press, Inc., New York, 2001. 69. F. D. Gunstone, The Chemistry of Oils and Fats, Blackwell
Publishing Ltd, Oxford, 2004. 70. N. Sinelli, M. S. Cosio, C. Gigliotti, and E. Casiraghi, Anal.
Chim. Acta 598 (2007) 128–134. 71. I. Dubois, F. R. van de Voort, I. Sedman, A. A. Ismail, and H. R.
Ramaswamy, J. Am. Oil Chem. Soc. 73 (1996) 787−794. 72. T. Hrenar, R. Mitrić, Z. Meić, H. Meier, and U. Stalmach, J.
Mol. Struct. 661–662 (2003) 33–40. 73. M. A. Moharam and L. M. Abbas, Afr. J. Microbiol. Res. 4
(2010) 1921−1927. 74. M. A. Allem and S. F. Hamed, J. Appl. Sci. Res. 3 (2007)