142
Publications of the University of Eastern Finland Dissertations in Health Sciences Sanni Matero Chemometric Methods in Pharmaceutical Tablet Development and Manufacturing Unit Operations

Publications of the University of Eastern Finland
Dissertations in Health Sciences
isbn 978-952-61-0142-2
Publications of the University of Eastern FinlandDissertations in Health Sciences
The main goal of this thesis was to
explore the tableting manufacturing
sub-processes utilizing chemomet-
rics. In the first part of this study,
the tablet quality was explored with
multivariate methods. In the second
part of this study, multi-way meth-
ods in conjunction with acoustic
emission data and process variables
from granulation process of tableting
material in fluidized bed granula-
tion have been exploited. This thesis
shows the feasibility and power of
multivariate data analysis in case of
evaluation of tablet development and
manufacturing unit operations.
dissertatio
ns | 016 | S
an
ni M
atero | C
hem
ometric M
ethod
s in P
harm
aceutical T
ablet Develop
men
t and M
anu
facturin
g Un
it...
Sanni Matero
Chemometric Methods inPharmaceutical Tablet
Development and Manufacturing Unit
Operations
Sanni Matero
Chemometric Methods inPharmaceutical Tablet Development and Manufacturing Unit Operations
SANNI MATERO
Chemometric Methods in Pharmaceutical Tablet
Development and Manufacturing Unit
Operations
To be represented by permission of the Faculty of Health Sciences, University of Eastern Finland for public examination in Auditorium MET, Mediteknia building,
University of Eastern Finland on Saturday 12th June 2010, at 12 noon.
Publications of the University of Eastern Finland Dissertations in Health Sciences
16
School of Pharmacy Faculty of Health Sciences
University of Eastern Finland Kuopio
2010
Kopijyvä Oy Kuopio 2010
Editors:
Professor Veli-Matti Kosma, MD, PhD
Department of Pathology Institute of Clinical Medicine
School of Medicine Faculty of Health Sciences
Professor Hannele Turunen, PhD Department of Nursing Sciences
Faculty of Health Sciences
Distribution:
University of Eastern Finland Kuopio Campus Library/Sales of publications
P.O. Box 1627, FI-70211 Kuopio, FINLAND http://www.uef.fi/kirjasto
ISBN 978-952-61-0142-2
ISBN 978-952-61-0143-9 (PDF) ISSN 1798-5706
ISSN 1798-5714 (PDF) ISSNL 1798-5706

Authors address: School of Pharmacy Faculty of Health Sciences University of Eastern Finland P.O.Box 1627,
I-70211 Kuopio, FINLAND [email protected] Supervisors: Professor Antti Poso, PhD School of Pharmacy Faculty of Health Sciences
University of Eastern Finland Kuopio, Finland
D.Sc. Satu-Pia Reinikainen
Department of Chemical Technology Lappeenranta University of Technology Lappeenranta, Finland
Professor Jarkko Ketolainen, PhD
School of Pharmacy Faculty of Health Sciences
University of Eastern Finland Kuopio, Finland
Ossi Korhonen, PhD
School of Pharmacy Faculty of Health Sciences
University of Eastern Finland Kuopio, Finland
Reviewers: Professor Jukka Rantanen, PhD
Department of Pharmaceutics and Analytical Chemistry Faculty of Pharmaceutical Sciences University of Copenhagen Copenhagen, Denmark
Dr. Johan Westerhuis, PhD Biosystems Data Analysis
Swammerdam Institute for Life Sciences University of Amsterdam Amsterdam, the Netherlands
Opponent: Professor Rasmus Bro, PhD Department of Food Sciences Faculty of Life Sciences
University of Copenhagen Copenhagen, Denmark

iv

v
Matero, Sanni. Chemometric methods in pharmaceutical tablet development andmanufacturing unit operations. Publications of the University of Eastern Finland.Dissertations in Health Sciences 16. 2010. 120 p.
ABSTRACT
The aim of this thesis was to explore the potential benefits of chemometric meth-ods when they are innovatively applied in tableting manufacturing unit operations.Chemometrics is the application of statistical and mathematical methods, in partic-ular multivariate methods, to handle chemical or process data. It aims to explorecomplex relationships and extract information that is related to the system underconsideration.
In this study, the molecular descriptors with multivariate methods have beenutilized as a potential tool for drug dissolution evaluation from a hydrophobic ma-trix tablet. In addition, multivariate and multi-way methods in conjunction withacoustic emission data and process variables from granulation process of tabletingmaterial in fluidized bed granulation have been utilized to enhance process under-standing. In the granulation process, the best results with the models were achievedusing multi-way methods for modelling of the process data. This was most prob-ably due to the three-way nature of process data and batch-to-batch variation thatcould not be captured using bilinear modelling. This thesis shows the feasibilityand power of multivariate data analysis in case of analysis and evaluation of tabletdevelopment and manufacturing unit operations.
National Library of Medicine Classification: QV 736, QV 778, QV 787Medical Subject Headings: Technology, Pharmaceutical; Dosage Forms; Tablets;Multivariate Analysis; Drug Industry; Quality Control

vi
vii
Matero, Sanni. Kemometristen menetelmien soveltaminen tabletin kehityksessä jatuotannossa läpi yksikköoperaatioiden. Itä-Suomen yliopiston julkaisuja. Terveys-tieteiden tiedekunnan väitöskirjat 16. 2010. 120 p.
TIIVISTELMÄ
Tässä väitöskirjatyössä tutkittiin ja kehitettiin kemometristen monimuuttujame-netelmien sovelluksia tabletin valmistusvaiheisiin ja lopputuotteen testaukseen. Ke-mometria käsitteenä on määritelty olevan kemian osa-alue, jossa käytetään tilasto-tieteen, matematiikan ja etenkin monimuuttujaisia menetelmiä ratkomaan kemialli-sia ongelmia. Kemometriset monimuuttuja-analyysit mahdollistavat useiden muut-tujien yhtäaikaisen korrelaatio- ja varianssirakenteen hahmottamisen.
Väitöskirjatyössä keskityttiin matriisitabletin formulaatiokehitykseen, rakeis-tamiseen, suorapuristamisen tabletoinnin optimointiin sekä lääkeaineen vapautu-miskokeiden ennustamiseen monimuuttujamenetelmin laboratorio-olosuhteissa.Kaikki nämä tabletin valmistuksen prosessivaiheet ovat olennaisia osia tabletinvalmistusketjussa, tabletin laadun ja toimivuuden varmistamisessa. Tarkoituksenaoli löytää myös uusia prosessiin koskemattomia prosessilinjaa häiritsemättömiämenetelmiä, joita esimerkiksi lääkefirmat voisivat hyödyntää tutkimuksessaan.Väitöstyössä sovellettiin uudella tavalla lääkeaineiden molekyylitason tietoa en-nustamaan lääkeaineen vapautumista tabletista. Lisäksi monimuuttujamenetelmiäsovellettiin lääke- ja apuaineen rakeistuksen seurantaan. Rakeistusprosessimuuttu-jina käytettiin muun muassa akustista emissio spektroskopiaa, joka on vielä melkovähän sovellettu mittausmenetelmä farmasiassa. Rakeistusprosessin aineistonluonteen vuoksi erityisesti moniulotteisten matriisielementtien (multi-way, engl.)analyysiin tarkoitetut monimuuttujamenetelmät mallinsivat prosessin parhaiten.Jokainen tabletin valmistus vaihe raaka-aineesta lopputuotteeksi tulisi tehdä kont-rolloidusti, jo tablettiformulaation turvallisen käytettävyyden sekä hukkajätteenvähentämisen vuoksi. Tämä vuoksi prosessien optimointi on tärkeää. Tämä väitös-kirjatyö osoittaa monimuuttujamenetelmien hyödynnettävyyden tabletin kehitys-ja valmistusprosessissa.
Yleinen suomalainen asiasanasto: farmasia; tabletit; kehitys; tuotanto; valmistus;prosessit; optimointi; rakeistus; puristus; lääkeaineet; vapautuminen; tilastomene-telmät; monimuuttujamenetelmät; lääketeollisuus; laadunvarmistus

viii

ix
ACKNOWLEDGEMENTS
The research was carried out in the University of Kuopio during 2003–2009. During these years I have been priviliged to discover, study and learnnew concepts both in Finland, in Kuopio and Lappeenranta, and abroad inCopenhagen and Perugia. I have obtained a perspective into scientific re-search from various congresses and meetings I have had opportunity toattend. I am very grateful to the many many individuals who have con-tributed in their own way to this work; by encouraging me and by sharingthe ups and downs. I believe, that these persons, without mentioning themindividually will realize, that their input has not been forgotten. However,I want to direct some special acknowledgements to some of them.
First I owe my sincere gratitude for my principal supervisor ProfessorAntti Poso, for providing me with the opportunity to work in his researchgroup and for introducing me to the field of molecular modelling. I appre-ciate his encouragement during these years as well as his knowledge andenthusiasm toward science. There is no such a thing in science that Anttiwould say: "Don’t try that." He has been supporting me in every situation,even in the craziest modeling trials and well, you never know when thecraziest innovation is the successful one.
Around 2005 I first time encountered the word ’Chemometrics’. In Au-gust 2005 I participated in SSC9 conference in Reykjavik, Iceland. I followedthe lectures carefully and started to realize just how powerful tool chemo-metrics can be. Since then it has become a major interest and a challenge tome. I may repeat myself, but I am so fascinated about chemometrics andtherefore, I am extremely thankful to my main supervisor in chemometricsD.Sc. Satu-Pia Reinikainen who has been supporting and guiding me in thefascinating world of Chemometrics. I have listened very carefully to everypiece of advice and encouraging comment from her and absorbed all of theinformation I have received from her.

x
I want to thank Professor Jarkko Ketolainen for his supervision overthe years and for introducing me to the field of pharmaceutical technology.I also want to thank Ossi Korhonen, Ph.D. (Pharm.) and Maija Lahtela-Kakkonen, Ph.D. (Chem.) for their contribution, especially in the earlyphase of my thesis. I owe my thanks to Maija for her encouragement andthe fact that her door is always open and she is willing to discuss no matterwhat.
Professor Rasmus Bro is greatly acknowledged for kindly agreeing to bethe opponent in the public examination of this dissertation. I want to thankthe official reviewers Professor Jukka Rantanen and Dr. Johan Westerhuisfor their invaluable comments to improve this thesis. Ewen MacDonald,Ph.D. is acknowledged for reviewing the language of this thesis.
I want to sincerely thank my co-authors and persons contributing tomy scientific work. I am so grateful for Pekka Keski-Rahkonen M.Sc.(Analytical Chem.), Marko Kuosmanen M.Sc.(Pharm.), Jari Leskinen M.Sc.(Physics), Sami Poutiainen M.Sc. (Chem.) and Toni Rönkkö Ph.D. (Com-puter science) for so many fruitful discussions concerning science; phar-macy, chemistry, chemometrics, physics, mathematics, computers and ev-eryday life.
It has been a pleasure to work with such a nice people as the PMCgroup as well as the people in the Department of Pharmaceutical Technol-ogy. The present and former members of our Modelling group (especiallyHenna Härkönen M.Sc. (Pharm.)) are all acknowledged not only becauseof friendly and innovative atmosphere but also for the cheerful momentsduring coffee breaks, congress trips and corridor talks.
My warmest thanks go to my closest and dearest friends, family, äiti,isä and Rustam who have been encouraging and supporting me during theKuopio years on the way to becoming a Doctor of Philosophy." Så gick det lilla knyttet ut på stranden och fann en snäcka som var stor och vit han satte sig försiktigt ner
i sanden och tänkte, o så skönt att jag kom hit, och lade vackra stenar i sin hatt och havet var så lugnt och
det blev natt. Långt borta var hemulerna med stora tunga steg och mårran var försvunnen för hon hade
gått sin väg. Och knyttet tog av skorna och han suckade och sa: hur kan det kännas sorgesamt fast allting
är så bra? Men vem ska trösta knyttet med att säga: lilla vän, vad gör man med en snäcka om man ej får
visa den?"
-Tove Jansson "Vem ska trösta knyttet"

xi
The thesis has been financially suported by the National TechnologyAgency for Technology and Innovation (TEKES) Finland (VARMA andPAT-KIVA projects), Magnus Ehrnrooth Foundation, Finnish CulturalFoundation, Kuopio University Foundation, Saastamoinen Foundationand Alfred Kordelin Foundation. PROMIS Centre Consortium projectPROMET, funded by TEKES (ERDF), is also acknowledged for funding thelater stages of this thesis.
Sanni MateroKuopio May 25, 2010

xii

xiii
LIST OF ORIGINAL PUBLICATIONS
This doctoral dissertation is based on the following publications:
I Matero S, Lahtela-Kakkonen M, Korhonen O, Ketolainen J, Lap-palainen R, Poso A: Chemical space of orally active compounds.Chemometr Intell Lab 84: 134-141, 2006. Copyright (2006), withpermission from Elsevier.
II Matero S, Reinikainen S-P, Lahtela-Kakkonen M, Korhonen O, Ke-tolainen J, Poso A. Estimation of drug release profiles of a het-erogeneous set of drugs from a hydrophobic matrix tablet usingmolecular descriptors. J Chemometr 22: 653-660, 2008.
III Matero S, Pajander J, Soikkeli A-M, Reinikainen S-P, Lahtela-Kakkonen M, Korhonen O, Ketolainen J, Poso A: Predicting thedrug concentration in starch acetate matrix tablets from ATR-FTIRspectra using multi-way methods. Anal Chim Acta 595: 190-197,2007.
IV Matero S, Poutiainen S, Leskinen J, Järvinen K, Ketolainen J,Reinikainen S-P, Hakulinen M, Lappalainen R, Poso A: The feasi-bility of using acoustic emissions for monitoring of fluidized bedgranulation. Chemometr Intell Lab 97:, 75-81, 2009.
V Matero S, Poutiainen S, Leskinen J, Reinikainen S-P, KetolainenJ, Järvinen K, Poso A: Monitoring of wetting phase of fluidizedbed granulation process using multi-way methods: The separa-tion successful from unsuccessful batches. Chemometr Intell Lab96: 88-93, 2009.
VI Matero S, Poutiainen S, Leskinen J, Järvinen K, Ketolainen J, PosoA, Reinikainen S-P: Estimation of granule size distribution for

xiv
batch fluidized bed granulation process using acoustic emissionand N-way PLS. J Chemometr, 2010 (in press).
In papers I–VI, the author is the "corresponding author" and per-formed all of the chemometric analysis. In paper I, all data, cal-culations and data analysis were generated and performed by theauthor. All the publications were adapted with the permission ofcopyright owners.

xv
CONTENTS
1 INTRODUCTION . . . . . . . . . . . . . . . . . 1
2 CHEMOMETRICS . . . . . . . . . . . . . . . . . 52.1 Methods . . . . . . . . . . . . . . . . . . . 62.2 Bilinear models . . . . . . . . . . . . . . . . . 72.3 Multi-way models . . . . . . . . . . . . . . . . 142.4 Neural networks . . . . . . . . . . . . . . . . 202.5 Pre-processing . . . . . . . . . . . . . . . . . 222.6 Model validation . . . . . . . . . . . . . . . . 24
3 PROCESS ANALYTICAL TECHNOLOGY, PAT . . . . . . 333.1 Non-destructive methods in PAT . . . . . . . . . . 353.2 Tablet manufacturing . . . . . . . . . . . . . . . 36
4 PAT APPLICATIONS ON TABLETING UNIT OPERATIONS . 434.1 Preformulation studies and formulation design . . . . . 434.2 Mixing . . . . . . . . . . . . . . . . . . . . 464.3 Wet granulation . . . . . . . . . . . . . . . . . 514.4 Tablet compression . . . . . . . . . . . . . . . 58
5 PAT APPLICATIONS ON UNCOATED TABLET QUALITYTESTING . . . . . . . . . . . . . . . . . . . . 615.1 API concentration and content uniformity . . . . . . . 615.2 Dissolution tests . . . . . . . . . . . . . . . . 675.3 Mechanical testing; crushing strength tests and disintegration 72
6 AIMS OF THE STUDY . . . . . . . . . . . . . . . 79
7 CHEMOMETRICS AND TABLET QUALITY I-III . . . . . 817.1 Chemical space of orally active compounds (I) . . . . . 827.2 Estimation of dissolution profiles (II) . . . . . . . . . 837.3 Tablet quality (III) . . . . . . . . . . . . . . . . 857.4 Summary (I–III) . . . . . . . . . . . . . . . . 86

xvi
7.5 Perspectives . . . . . . . . . . . . . . . . . . 87
8 CHEMOMETRICS AND FLUIDIZED BED GRANULATIONIV-VI . . . . . . . . . . . . . . . . . . . . . . 898.1 Feasibility of acoustic emission for fluidized bed granulation
(IV) . . . . . . . . . . . . . . . . . . . . . 908.2 Multi-way models for fluidized bed granulation process (V) 918.3 N-PLS estimation of granule size distribution (VI) . . . . 938.4 Summary (IV–VI) . . . . . . . . . . . . . . . . 958.5 Perspectives . . . . . . . . . . . . . . . . . . 97
9 GENERAL CONCLUSIONS . . . . . . . . . . . . . 99
REFERENCES . . . . . . . . . . . . . . . . . . . . 103

xvii
ABBREVIATIONS
AE acoustic emissionALS alternating least squaresANN artificial neural networkANOVA one-way analysis of varianceAPI active pharmaceutical ingredientATR-FTIR attenuated total reflection Fourier transform infraredBCS biopharmaceutical classification systemBMU best-matching unitCI chemical imagingCLS classical least squaresCORCONDIA core consistency diagnosticCQA critical quality attributeCPP critical process parameterCV cross-validationDoE design of experimentsECT electrical capacitance tomographyEEM excitation-emission matrixEMEA European Medicines AgencyFDA Food and Drug AdministrationFSMW-EFA fixed size moving window-evolving factor analysisFT Fourier transformGA genetic algorithmGI gastrointestinalHPLC high-performance liquid chromatographyICS international chemometrics societyKF Karl Fischer titrationLOD loss on dryingLOO leave-one-outMANOVA multivariate analysis of varianceMCR multivariate curve resolutionMDL multivariate detection limitMDT mean dissolution time

xviii
MLR multiple linear regressionMPCA multi-way principal component analysisMQL multivariate quantification limitMSC multiplicative scatter correctionMSPC multivariate statistical process controlMVSD moving window standard deviationNOC normal operating conditionN-PLS N-way partial least squares or N-way PLSNIPALS nonlinear iterative partial least squaresNIR near infrared spectroscopyOSC orthogonal signal correctionPAC process analytical chemistryPARAFAC parallel factor analysisPAT process analytical technologyPC principal componentPCA principal component analysisPCR principal component regressionPLS partial least squares regressionPLS-DA partial least squares discriminant analysisPRESS prediction error of sum of squaresQbD quality by designQSPR quantitative structure-property relationshipQTPP quality target product profiler2 correlation coefficientR2 variation explained by the modelR2X variation of X explainedR2Y variation of Y explainedRMSEC root mean square error of calibrationRMSECV root mean square error of cross-validationRMSEP root mean square error of predictionRSM response surface methodRTR real time releaseSEE standard error or estimationSECV standard error or cross-validationSPE standard error or predictionSIMCA soft independent modelling of class analogySNV standard normal variateSOM self-organizing mapTS-SOM Tree-structured self-organizing mapUSP United States PharmacopeiaUV ultravioletVIP variable importance on projection

xix
x scalarx vectorX matrixX n-way matrix

xx

1 INTRODUCTION
Before the year 2001, the use of multivariate methods in pharmaceuticalapplications was relatively rare (Gabrielsson et al. 2002). Since USA’sFDA (Food and Drug Administration) launched its guidance for PAT (pro-cess analytical technology) for pharmaceutical industry on September 2004(U.S. Food and Drug Administration 2004), the spectrum of multivari-ate method applications has been increasing. The objective for FDA wasto encourage manufacturers to innovatively apply and develop new non-destructive methods and sensors, in a way that information (about the pro-cess state) would be gathered non-invasively and attained in real-time. ThePAT proposal meant that chemometric multivariate methods became an ac-ceptable tool for acquiring and analyzing data. Multivariate methods en-able the analysis of large data sets by extracting the structural part out ofthe so-called noise and in the best case scenario, it can transform variablevariation into process related information. Today it is recommended thatall facets of pharmaceutical development should be performed using thequality by design (QbD) approach which states that quality should be builtwithin the product rather than tested into a product (ICH Q8(R2) 2009).
The motivation for application of PAT methods in pharmaceutical man-ufacturing and research has emerged from the extensive amount of re-sources spent during the years of drug development, from discovering themolecule to its formulation (Muzzio et al. 2002). The approximate time for anew drug to be launched from the time it is discovered is 10 to 20 years andthe costs can be as high as 1 billion dollars (780 million euros). Nowadaysfewer and fewer new drugs are in the pipeline (Hughes February 2009)while the patents on many important drugs already invented are expiring,thus opening the generic market for these drug products (Shah 2004; Car-ney 2005; Hughes February 2009). This has placed the drug manufacturersin the position where their emphasis has switched to manufacture, since

2
medicines have to be produced faster and with fewer resources (Hardy andCook 2003; McCormick April 2005; Peterson et al. 2009). Any time-savinganalysis, development or prediction method that helps cut down costs toachieve a safe and functional drug formulation is welcome. Since PATmethodology provides process understanding for batch failure or batch-to-batch variation, it is the method of choice. Moreover, PAT methods canprovide information about differences between raw materials, process con-ditions, (tableting) unit operations and end product quality.
In this study, multivariate chemometric techniques have been applied inevaluating a few unit operations in tablet manufacturing. Tablet manufac-ture is of great interest since tablets are still the most common form of drugdelivery since they have many benefits, namely relatively easy manufac-ture, oral administration and formulation stability (Varma et al. 2004). Theideal tablet formulation is a matrix tablet manufactured by direct compres-sion where drug and excipient powders are mixed and then compresseddirectly without the need for any intermediate unit operation. However,certain demands are placed on the excipient and drug in direct compres-sion and in many cases, granulation of the powders prior to tableting isnecessary to provide proper tableting properties for the materials.
In tablet manufacturing according to the ideology of FDA’s PAT guid-ance, every process step of every tablet batch from raw materials to finalproduct can be considered to take place in a controlled manner. This wouldallow the operator to respond to possible defects in the process and correctthe state of the system in order to run the batch pertinently to the end. Thusthe real-time process control is a better indicator of safety for every manu-factured tablet than random end product testing. The optimized manufac-ture according to PAT regulations is also environmentally friendly since itreduces unsuccessful batches and consequently the amount of waste.
In the preface to the book on PAT (Bakeev 2005) edited by KatherineA. Bakeev she wrote: "A subject as broad as Process Analytical Technol-ogy (PAT) is difficult to capture in one volume. It can be covered from somany different angles, covering engineering, analytical chemistry, chemo-metrics, and plant operations, that one needs to set a perspective and start-ing point. This book is presented from the perspective of the spectroscopistwho is interested in implementing PAT tools for any number of processes."

3
By quoting her words, this thesis is presented from a perspective of thechemometrician who is interested in implementing PAT tools for a widerange of tablet related manufacturing processes.
The aim of this work was to study the potential benefits of chemomet-rics methods when they are innovatively applied for tableting manufactur-ing sub processes. The molecular descriptors with multivariate methodshave been utilized as potential tools for the evaluation of drug dissolutionfrom a hydrophobic matrix tablet. Also multivariate and multi-way meth-ods in conjunction with acoustic emission data and process variables fromgranulation process of tableting material in fluidized bed granulation havebeen exploited in order to enhance process understanding.
The multivariate methods have been widely exploited in food science,(petro-) chemical industry, psychology and in environmental science. How-ever, the literature review of this thesis will consider mainly multivariateapplications in the field of pharmaceutical sciences, mainly studies and ap-plication for solid dosage forms. Moreover, in the ideal situation, Designof Experiments (DoE) is one part of process design (Lundstedt et al. 1998).However, in the real world there are several reasons why it is not utilizedsuch as 1) lack of knowledge about DoE methods or effective plan of ex-periments, 2) large number of variables, which should be independent indesign, would lead to a huge amount of measurements, 3) nature of phe-nomena or historical data, e.g., process data (Wold et al. 2006), which needto be analyzed 4) collinearity of variables, e.g., in spectral data 5) noise indata, e.g., acoustic emission spectra In several of the numbered cases, DoEor effective/intelligent plan of the measurements can be applied. However,multivariate methods may well be needed to analyze the data.
During the studies there was no possibility to undertake any of thoseclassical designs (ref. manuscripts III-VI). Instead, in the first (I) and sec-ond (II) published manuscripts, the self-organizing map approach wasused to perform one kind of design.

4

5
2 CHEMOMETRICS
Chemometrics refers to the application of statistical and mathematicalmethods, in particular multivariate methods, to handle chemical or pro-cess data. The need for chemometrics methods originates from the massiveamounts of data produced by modern measuring devices (Geladi and Es-bensen 1990; Esbensen and Geladi 1990). Chemometrics tends to deal withdata tables or matrices consisting of several variables (columns of tables ormatrices) and measurement targets (rows or tables or matrices) as a wholerather than as single variables or means or variations of single variables(Workman 2002). This multivariate approach enables finding the so-calledlatent variables or information of interrelated variables in the original datamatrix which can then be extracted. The latent variable models are basedon the assumption that the original data base dimensionality is not a fullrank (Kourti 2006). The new latent variables are projections of the originalvariables on multivariate space. Thus, even the 100 dimensional variablespace can be reduced into a subspace consisting of a few latent variablesthat describes underlying phenomena (Bro 2003) such that the originally100 dimensional space can be visualized. There are several advantages ofusing multivariate methods over univariate techniques (Bro 2003) such asrobust modelling, noise removal, handling of interacting variables or over-lapping spectral profiles, outlier or fault detection (Kourti et al. 1995; Kourti2006), variable reduction and understanding the reasons for similarity ordissimilarity of measurements (interpretation plus causality).
Generally, chemometric models have been considered as, even referredto as soft models since, these models are based on statistics and mathe-matics of the data rather than the physics or chemistry behind the data(Martens and Martens 2001). In contrast, the laws of mechanics (Newto-nian) in physics are considered as hard models since they are fundamentaland can be deployed universally.

6
There are several definitions about what is meant by the term chemo-metrics (Miller 2005) and they have evolved since Professors Svante Woldand Bruce Kowalski started to apply multivariate methods to handle chem-ical data around the year 1972 (Wold and Sjöström 1998). According toProf. Svante Wold who devised the term "chemometrics", chemometricsinvolves mathematical methods as well as the applications of the methodsin problem solving (Wold and Sjöström 1998). The International Chemo-metrics Society (ICS) defines chemometrics as "the science of relating mea-surements made on a chemical system or process to the state of the sys-tem via application of mathematical or statistical methods (Hibbert et al.2009)." A definition of chemometrics proposed in one of the most impor-tant chemometrics book is as follows (Massart et al. 1997). "Chemometricsis a chemical discipline that uses mathematics, statistics and formal logica) to design or select optimal experimental procedures; b) to provide max-imum relevant chemical information by analyzing chemical data; and c) toobtain knowledge about chemical systems." According to another defini-tion, chemometrics can be considered as "the application of multivariate,empirical modelling methods on chemical data" (Miller 2005). In this lastdefinition, the data-driven empirical modelling, what chemometrics trulyis, rather than theory based is emphasized. However, this does not meanthat chemometrics simply blindly interprets data analysis from any kind ofdata. Some knowledge of potential of data acquiring methods on a mea-surement target based (X matrix) on a phrasing of a question needs to beavailable.
Chemometricians have adopted methods from other research fieldssuch as econometrics and psychometrics where bilinear partial leastsquares and multi-way methods, respectively, have been applied and re-fined (Geladi and Esbensen 1990). Chemometric methods have beenwidely applied in the food, biosciences, petroleum, oil and nowadays phar-maceutical industries, and it is continuing to diverge into new fields suchas metabonomics.
2.1 MethodsChemometric methods can be categorized in several different ways. Thereare clustering, regression and explorative methods. On the other hand,methods can be separated according to how they explore the data arrays

7
u
scalar vector matrix
���
���
���
datacube
Figure 2.1: Illustration of order of arrays for a single sample; one-way, two-way, three-way, four-way. Adapted from Olivieri (2008).
(Fig. 2.1). A distinction can be drawn between bi-linear, non-linear andmulti-way methods as well as between projection, latent variable and fac-tor based methods. However, some methods overlap between the abovecategorizations. Next, bilinear, multi-way and one neural network meth-ods, that have been utilized in this thesis, will be introduced.
2.2 Bilinear modelsBilinearity means that the system is linear with respect to its decomposition,i.e. the system is linear in its estimated parameters. In bilinear models,the data is arranged in data matrices so that each horizontal row containssamples and each vertical column has variables.
Principal component analysis, PCA, is a linear projection method andused for reduction of dimensionality and multivariate data compression.The idea of PCA dates back in 19th century and was named by Hotellingin 1933 (Smilde et al. 2005; Brereton 2003). At that time, mathematiciansexplored multivariate data by fitting it onto lines and planes (Smilde et al.2005). Today, PCA is one of the vast utilized multivariate method sinceits wide applicability for multivariate problems. PCA is deployed for datacompression (Reich 2005) and data exploring within different fields of sci-ence. PCA is also used for checking groupings of the X data, as well asgrouping among the Y data matrix (Garca-Mu noz et al. 2003; Chiang andColegrove 2007). In process monitoring, PCA is used to detect trends, tofind a correlation structure of variables and, in particular, to examine thechanges in variable correlations (Wise and Gallagher 1996; Chiang and
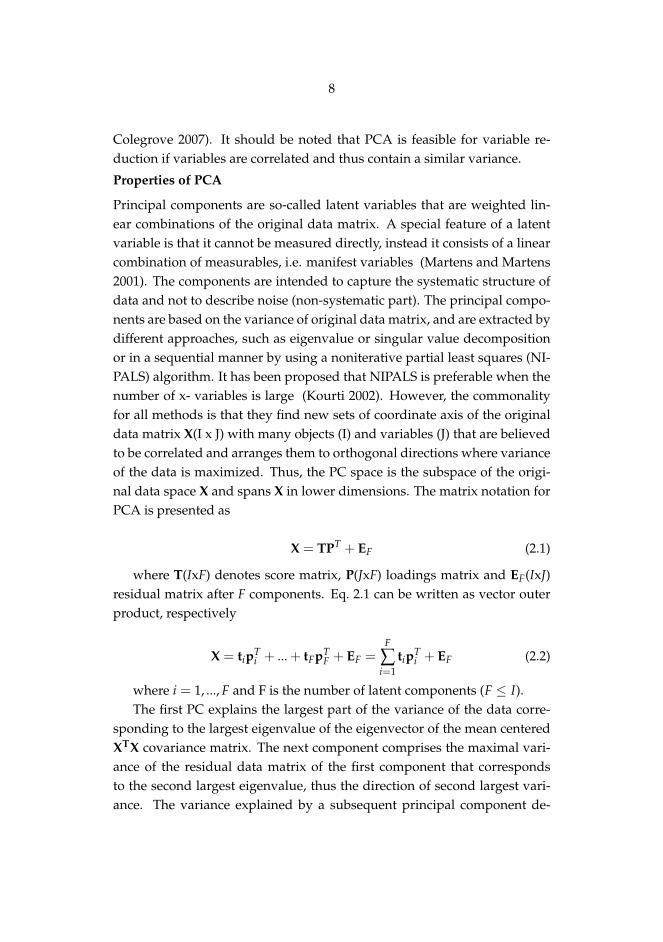
8
Colegrove 2007). It should be noted that PCA is feasible for variable re-duction if variables are correlated and thus contain a similar variance.
Properties of PCA
Principal components are so-called latent variables that are weighted lin-ear combinations of the original data matrix. A special feature of a latentvariable is that it cannot be measured directly, instead it consists of a linearcombination of measurables, i.e. manifest variables (Martens and Martens2001). The components are intended to capture the systematic structure ofdata and not to describe noise (non-systematic part). The principal compo-nents are based on the variance of original data matrix, and are extracted bydifferent approaches, such as eigenvalue or singular value decompositionor in a sequential manner by using a noniterative partial least squares (NI-PALS) algorithm. It has been proposed that NIPALS is preferable when thenumber of x- variables is large (Kourti 2002). However, the commonalityfor all methods is that they find new sets of coordinate axis of the originaldata matrix X(I x J) with many objects (I) and variables (J) that are believedto be correlated and arranges them to orthogonal directions where varianceof the data is maximized. Thus, the PC space is the subspace of the origi-nal data space X and spans X in lower dimensions. The matrix notation forPCA is presented as
X = TPT + EF (2.1)
where T(IxF) denotes score matrix, P(JxF) loadings matrix and EF(IxJ)residual matrix after F components. Eq. 2.1 can be written as vector outerproduct, respectively
X = tipTi + ... + tFpT
F + EF =F
∑i=1
tipTi + EF (2.2)
where i = 1, ..., F and F is the number of latent components (F ≤ I).The first PC explains the largest part of the variance of the data corre-
sponding to the largest eigenvalue of the eigenvector of the mean centeredXTX covariance matrix. The next component comprises the maximal vari-ance of the residual data matrix of the first component that correspondsto the second largest eigenvalue, thus the direction of second largest vari-ance. The variance explained by a subsequent principal component de-

9
creases with increasing order of PC. Since the basic concept of PCA is thatdata matrix with many variables is not a full rank and holds a latent struc-ture that could be explained by a few latent variables, only a small numberof the principal components is needed to explain the maximum variance ofthe original data. In the ideal case, the rest of the data contains redundantdata, i.e., noise and error due to the measurement conditions.
Scores and loadings
Principal components consist of scores and loadings as shown in Eqs. 2.1and 2.2. Most commonly these vectors are plotted because score (Fig. 2.2)and loading (Fig. 2.3) plots visualize original observations (samples) andvariables in new coordinate systems. The loading values depict how theoriginal variables are weighted in order to comprise the new axis whereasthe sample scores shows their position in a new coordinate system. Thesetwo plots (Figs. 2.2 and 2.3) are interactive, and thus reasoning for e.g.clustering of the samples or presence of outliers can be assessed.
Dimensionality
There are several criteria for choosing a dimensionality of a PCA model ormore general, for choosing dimensionality of component models that willbe reviewed in later chapters, such as cross-validation and residuals. Oneof these criteria is Kaiser’s rule, in which all PCs with eigenvalues (vari-ance explained) greater or equal to one should be extracted (de Juan et al.2004), since PCs having an eigenvalue less than one, as a rule of thumb, areexpected to contain less systematic variation than noise. The other test is(Cattell’s) scree plot, in which eigenvalues are plotted as a function of thenumber of PCs, in descending order. The favourable number of PCs is apoint where the variance explained by individual PC do not differ notablyfrom subsequent PC (Smilde et al. 2005). Another criteria for choosingthe model dimensionality is a priori knowledge of the data, residual diag-nostics, cross-validation and statistical diagnostics explained later on thisthesis. The selection of "correct number of PCs" is not essential, if the PCAmodels are not utilized for prediction purposes. PCAs applied only in inter-pretation of data may contain extra PCs as long as the captured informationis seen feasible, and no statistics for residuals, such as for multivariate sta-tistical process control (MSPC) purposes, is computed out of the model.
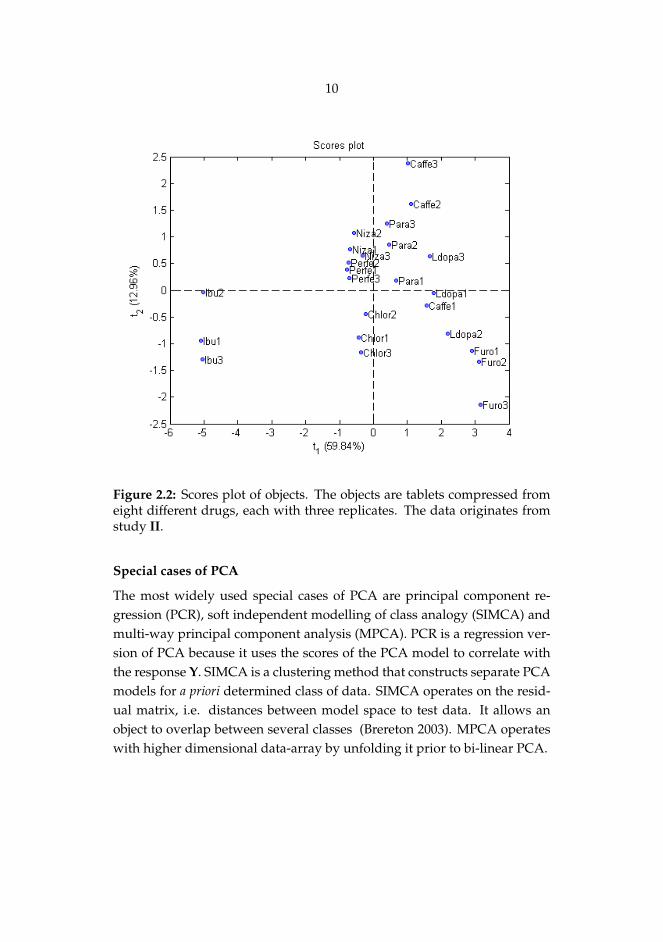
10
Figure 2.2: Scores plot of objects. The objects are tablets compressed fromeight different drugs, each with three replicates. The data originates fromstudy II.
Special cases of PCA
The most widely used special cases of PCA are principal component re-gression (PCR), soft independent modelling of class analogy (SIMCA) andmulti-way principal component analysis (MPCA). PCR is a regression ver-sion of PCA because it uses the scores of the PCA model to correlate withthe response Y. SIMCA is a clustering method that constructs separate PCAmodels for a priori determined class of data. SIMCA operates on the resid-ual matrix, i.e. distances between model space to test data. It allows anobject to overlap between several classes (Brereton 2003). MPCA operateswith higher dimensional data-array by unfolding it prior to bi-linear PCA.

11
Figure 2.3: Loadings plot of variables. The variables are tableting variablesfrom tablet compaction eight different drugs, each having three replicates.The data originates from study II.
2.2.1 Partial least squares
Partial least squares (PLS) is a regression method for multivariate data(Wold et al. 2001). It finds few latent variables from the data X and Y(IxM)blocks simultaneously while maximizing the covariance structures betweenthese two blocks (Wold et al. 2001). PLS is a data decomposition andcompression method since it finds latent, orthogonal directions in the datablocks at lower dimensions than the original data matrices in such a waythat maximal covariance between X and Y can be achieved (Smilde et al.2005; Vandeginste et al. 1998). The inventor of the PLS method is ProfessorSvante Wold, who modified the algorithm that was originally developed byhis father, Herman Wold, for data analysis purposes in econometrics (Wold2001; Brereton 2007). One of the mathematical notations of PLS is illustrated

12
as follows
X = TPT + E (2.3)
Y = UQT + F (2.4)
T = XW (2.5)
U = TD + G (2.6)
where T denotes score matrix, P loadings matrix and E residual matrixin X space, respectively, and U(IxF) denotes score matrix, Q(MxF) loadingsmatrix and F(IxM) residual matrix in Y space, respectively. W(JxF) definesweight matrix in X space. Eq. 2.6 is commonly named as the inner relation-ship (D(1xF) rotation matrix and diagonal matrix), since it connects twodifferent coordinate systems X and Y and G(IxF) is residual matrix of re-gression. Alternatively the score matrix U in Eq. 2.4 can be replaced by Tand one can neglect Eq. 2.6, thus T becomes the common score matrix oftwo spaces (Brereton 2007; Martens 2001). The replacement which simpli-fied the calculus is allowed since X scores are a good approximation of Yscores (Wold et al. 2001).
The PLS regression coefficient matrix B for the matrix Y is expressed as
B = W(PTW)−1QT (2.7)
where W denotes weight matrix in X space, i.e. importance of X in re-gression. The W weight vectors of X matrix are rotated towards the Y matrixin a way that scores T have maximal covariance with scores U in Y space.Thus, PLS extracts the common latent structure between X and Y spacesby also emphasizing the variances of different spaces. The Yhat matrix isestimated by
Yhat = XB = XW(PTW)−1QT (2.8)
NIPALS
PLS regression solution is attained by least square solution of finding com-ponents (direction in multivariate space denoted w) that explains the max-imal variance in the X matrix and also correlate the solution to Y matrix

13
maxw
[cov (t, y) | min
(I
∑i=1
J
∑j=1
(xij − tiwj
)2)∧ ‖ w ‖= 1
](2.9)
where xhat,ij = tiwj. Most often NIPALS is used to find the solution forEq. 2.9. If the common T of Eqs. 2.3 and 2.4 is used, the NIPALS algorithmfinds solutions of PLS1 (with one y variable) as follows (Bro and Elden2009; Ergon 2009)
1. Let X0 = X. For i=1,2,...,F
2. Compute
wi =XT
i−1y
‖ XTi−1y ‖
(2.10)
3. Computeti = Xi−1wi (2.11)
4. Compute
qi =yTti
tTi ti
(2.12)
5. Compute
pi =XT
i−1ti
tTi ti
(2.13)
6. Deflate the first component
Xi = Xi−1 − tipTi (2.14)
7. Perform steps 2. - 6. until F components is reached and fix estimatedp, q and w to the corresponding matrix. Insert matrices W, P and Q in

14
Eq. 2.7 and apply to Eq. 2.8.
As can be seen from the above, PLS is a F-1 component model that isa subset of the F component model, similarly to PCA, i.e. when the firstset of latent variables is calculated that part of the data can be extractedfrom the original data matrices and this is repeated until convergence. Itshould be noted that there are different algorithms which can be used torun PLS, depending on the number of response variables, PLS1 is for oneresponse variable case and PLS2 for several, correlated response variables,respectively. It should be also noted that heterogeneity in the data, i.e ifthe data consist of distinct groupings, can affect the modelling. If the n re-sponse variables indicate phenomenally different things, by if one includesthem into the same PLS models tends to count more latent variables thanseparately performed PLS models (Wold et al. 2001). This leads to a morecomplicated structure and more laborious interpretation.
Properties of PLS
There are advantages associated with PLS and it is thus a widely appliedmultivariate regression method. PLS is capable of handling collinear vari-ables, such as spectral data and it is capable to handle ill-conditioned ma-trices (by using latent variables). PLS can also handle missing data to someextent which is an appealing property, for instance if one needs to processdata where some probes may be malfunctioning or data from a certain dayis missing. The method also assumes that there is noise present both in Xand Y measurements which is lacking in an ordinary regression, such asMLR (multiple linear regression) (Brereton 2003, 2007). In general, the PLSmethod is applicable for any kind of multivariate regression problem, andis often the initial method of choice.
One special modification of PLS is PLS-DA (partial least squares dis-criminant analysis), where the X matrix is regressed into a dummy matrixconsisting of zeros and ones indicating the class to which the samples be-long and this has been done using the PLS algorithm.
2.3 Multi-way modelsMulti-way models are used when the data is multivariate and linear inmore than two dimensions. These can be considered to devise a model

15
in n-dimensions so that the system is linear in n dimensions. A three-linearsystem is often visualized as a data cube and is called a 3-way data or 3-way array whereas bilinear system is a rectangular matrix that can be con-sidered as 2-way data. For instance, three-way array can be created outof data of different batch runs, samples with variables in two dimensions,like fluorescence measurements and measurements acquired from differentlocations (Bro 1996; Smilde et al. 2005). Simply put, if the data from onesample forms a matrix, then data from several samples can be set in a boxthat is a three-way array (Bro 2003).
The multi-way modelling originated from psychological data treat-ment where bilinear data analyzing methods were not adequate (Smildeet al. 2005). These multi-way models have proven to be useful multi-waydata handling methods for extracting chemically relevant information fromspectra (Bro 2006), e.g. enhancing chemical understanding and evaluatingrelative concentrations of compounds in a sample (Bro 1998; Geladi andForsstrom 2002; Andersen and Bro 2003). Multi-way methods have alsobeen applied to process control as well as in regression analyses (Smildeet al. 2005; Andersen and Bro 2003; Bro 1999).
2.3.1 Parallel Factor Analysis, PARAFAC
Parallel factor analysis (PARAFAC) is a decomposition method for mod-elling three-way or higher data introduced independently by Harshman(1970) and Carroll and Chang (1970) (Smilde et al. 2005; Bro 1998, 1997).PARAFAC is a generalisation of the principal component analysis (PCA)projection method for a multi-way array. The data is decomposed into threelinearly related matrices which describe the most important variation of thedata matrix with the same factors, which is depicted in Fig 2.4.
The mathematical notation of a trilinear PARAFAC model is depicted as
Xk = ADkBT + Ek, k = 1, ..., R (2.15)
where Xk(IxJxK) is a matrix containing the original data of dimensions,A(IxR) the loadings for sample mode, B(JxR) the loadings of the variablemode, D weights or relative contribution of loadings of A and B (loadingsC(KxR) of the third mode are in diagonal of D) and Ek(IxJxK) the residualterm not related to the model. The PARAFAC model may alternatively beexpressed (Smilde et al. 2005) element-wise of the Xk matrix as follows

16
Xhat
��
��
��
��
a1
b1
c1
��
a2
b2
c2����
A
BC
Figure 2.4: A graphical illustration of a two-component PARAFAC model.
xijk =R
∑r=1
airbjrckr + eijk (2.16)
where R is the number of PARAFAC components. The PARAFAC model(i.e. loadings A, B and C) can be estimated iteratively utilizing the alternat-ing least squares (ALS) by minimizing the residual sums of squares (Bro1997). First, R is determined. An initial approximation for matrices B and Cis then given, and A loadings are estimated from Xk, B and C. Thereupon Band C are estimated, respectively, and the iteration from A to C starts overagain until convergence is achieved, i.e. fit of the loadings are sufficientlystable (Bro 1997).
The PARAFAC model has a second-order advantage, i.e. it can han-dle interferents in new samples by fitting the new interferent with an extracomponent (Rinnan et al. 2007; Bro 2003). For instance, if three-way dataconsists of three chemical constituents and one interferent, a four compo-nent PARAFAC model is anticipated. The estimated PARAFAC loadings foreach of the modes are relative amounts for each component, however, themodel can be utilized for calibration, if at least one sample concentration orother response value is known (Rinnan et al. 2007).
PARAFAC is not a sequential algorithm, where a R-1 component modelis a subset of the R component model, since loadings do not have to be or-thogonally decomposed (Bro 1998). Each PARAFAC model is unique andnot related to other models that have different amounts of components,hence the effect of the number of components differs from PCA. PARAFACloadings cannot be rotated like principal components, without affecting themodel fit (Bro 1997). It should be noted that PARAFAC components are

17
not forced to be orthogonal which is a useful feature when modelling spec-troscopic data and finding the true estimates for parameters of the data.Different constraints which are present prior to modelling can be imposedfor loading matrices, such as non-negativity which may be adequate forspectral data and unimodality e.g. for chromatographic data. Constraintscan help interpretability of the model and assist in obtaining realistic modelloadings (Andersen and Bro 2003).
2.3.2 Tucker3
The Tucker3 method can be used for compression and data exploration ofN-way array (Smilde et al. 2005). The Tucker3 model consists of loadingmatrices in n modes, factors that are typically orthogonal and a (P, Q, R)-dimensional core array G. The mathematical notation of Tucker3 model isillustrated in Eq. 2.17
Xk = AG(
C | ⊗ | BT)
+ Ek, (2.17)
where Xk(IxJxK) stands for an original data array, G(QxPxR) is a corearray with dimensions of chemical ranks of modes and weights of differentloadings A(IxP), B(JxQ) and C(KxR) are the loading matrices of the first,second and the third modes, respectively, | ⊗ | the Khatri-Rao product andEk(IxJxK) the residual matrix. The core array encompasses the inherent in-teractions of different loadings and provides an approximation of the vari-ation of Xk (Bro 1998). The core elements reveal the importance of respec-tive factor combinations for the model Xk. The Tucker3 core array differsfrom the PARAFAC core by having at least one off-diagonal core elementas non-zero, whereas the PARAFAC has a so-called superdiagonal core ar-ray (Bro 1998) and thus PARAFAC can be considered as a special case ofthe Tucker3 model (Smilde 2001). This Tucker3 core array has the abil-ity to fit variation in data more efficiently. It is noteworthy that differentmodes may exhibit different numbers of components in the Tucker3 modelwhereas in PARAFAC that is not the case. Moreover, Tucker3 is often usedas a compensatory method for PARAFAC. If two or one modes of Tucker3model only need to be compressed, the models are then called Tucker2 andTucker1 models, respectively. Let i, j, k be the modes for 3-way Xk data

18
xijk =P
∑p=1
Q
∑q=1
aipbjqgpqk + eijk, (2.18)
xijk =P
∑p=1
aipgpjk + eijk, (2.19)
Westerhuis et al. (1999) illustrated that the Tucker1 model is a feasiblemethod to model batch data where Tucker1 core array exhibits specificallythe interactions of time and variable modes in between the interactions arefrequently presented. However, it is case-specific which of the multi-waymodels work best for batch data and no general conclusions can be drawn(Smilde 2001).
2.3.3 Parallel Factor Analysis 2, PARAFAC 2
PARAFAC2 is intended also for modelling N-way data but, in contrast toPARAFAC, it handles experiments of different lengths and variable profilesthat are shifted or in a different phase (Smilde et al. 2005; Bro et al. 1999;Kiers et al. 1999). The PARAFAC2 model is similar to the PARAFAC modelexcept that the loading matrix Bk that has k dimensions and it needs tofulfil the conditions of covariance equality BT
1 B1 = ... = BTk Bk (Bro 1998).
This condition is more flexible than in PARAFAC, where profiles of slabs(e.g. B1 = B2 = ... = Bk) must be of equal size (Bro 1998). PARAFAC2enables trilinearity not to be fulfilled in one mode, whereas in PARAFACtrilinearity is a fundamental condition. However, it should be noted thatalso PARFAC may fit non-linearity to some extent in one mode but in caseswhen data shifts from linearity are regular.
2.3.4 N-partial least squares, N-PLS
N-PLS is an extension of the PLS algorithm for multi-way data (Bro 1998,1996). The main principles are similar to the bilinear PLS algorithm, i.e.,N-PLS uses also dependent and independent variables for finding the la-tent variables to describe their pairwise maximal covariance. N-PLS is a se-quential algorithm like PLS. Thus, the F-1 component model is a subset ofthe F component model. N-PLS decomposition starts by constructing a dis-tinct PARAFAC like model for dependent response variables (Yk(IxMxK))and for descriptor variables (Xk(IxJxK)) and maximizing the covariance be-
19
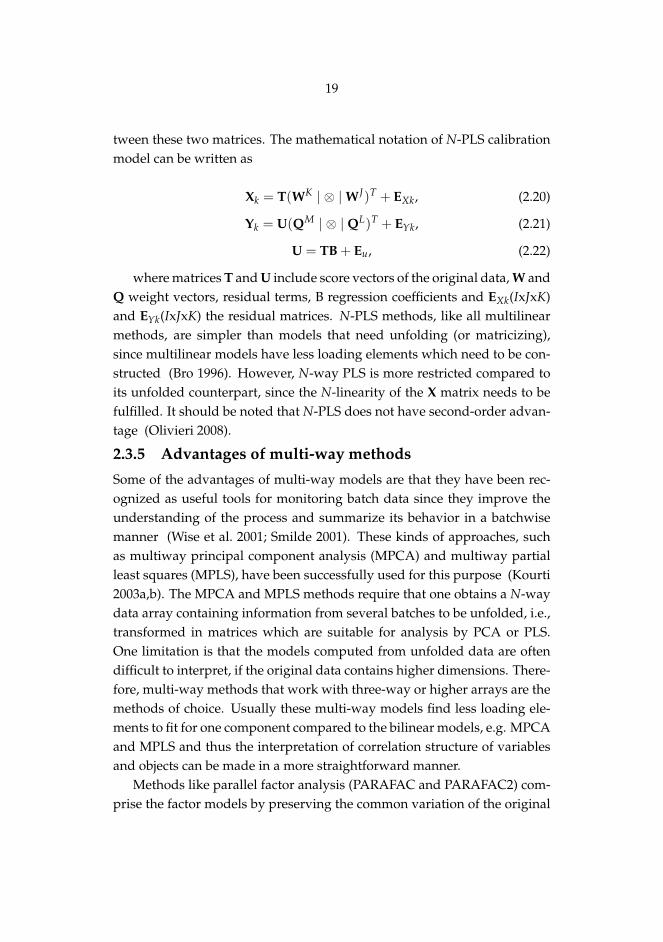
tween these two matrices. The mathematical notation of N-PLS calibrationmodel can be written as
Xk = T(WK | ⊗ | WJ)T + EXk, (2.20)
Yk = U(QM | ⊗ | QL)T + EYk, (2.21)
U = TB + Eu, (2.22)
where matrices T and U include score vectors of the original data, W andQ weight vectors, residual terms, B regression coefficients and EXk(IxJxK)and EYk(IxJxK) the residual matrices. N-PLS methods, like all multilinearmethods, are simpler than models that need unfolding (or matricizing),since multilinear models have less loading elements which need to be con-structed (Bro 1996). However, N-way PLS is more restricted compared toits unfolded counterpart, since the N-linearity of the X matrix needs to befulfilled. It should be noted that N-PLS does not have second-order advan-tage (Olivieri 2008).
2.3.5 Advantages of multi-way methods
Some of the advantages of multi-way models are that they have been rec-ognized as useful tools for monitoring batch data since they improve theunderstanding of the process and summarize its behavior in a batchwisemanner (Wise et al. 2001; Smilde 2001). These kinds of approaches, suchas multiway principal component analysis (MPCA) and multiway partialleast squares (MPLS), have been successfully used for this purpose (Kourti2003a,b). The MPCA and MPLS methods require that one obtains a N-waydata array containing information from several batches to be unfolded, i.e.,transformed in matrices which are suitable for analysis by PCA or PLS.One limitation is that the models computed from unfolded data are oftendifficult to interpret, if the original data contains higher dimensions. There-fore, multi-way methods that work with three-way or higher arrays are themethods of choice. Usually these multi-way models find less loading ele-ments to fit for one component compared to the bilinear models, e.g. MPCAand MPLS and thus the interpretation of correlation structure of variablesand objects can be made in a more straightforward manner.
Methods like parallel factor analysis (PARAFAC and PARAFAC2) com-prise the factor models by preserving the common variation of the original

20
data in every dimension (Smilde et al. 2005; Bro et al. 1999; Kiers et al.1999). The assumption on which these models is based is that every di-mension includes similar information, i.e. a latent structure but with dif-ferent amounts for individual experiments (Bro et al. 2008). For instance,for batch data, this property allows one to define in detail the differencesin structure between well and badly performed batches by evaluating theprocess outcome. PARAFAC is mainly intended for data having congru-ent variable profiles within each batch, whereas PARAFAC2 can handledata with different temporal durations and variable profiles. PARAFAC aswell as PARAFAC2 have been mainly applied for analyzing chemical datafrom experiments that form a 3-way or higher data structure, e.g. chro-matographic data, fluorescence spectroscopy measurements, temporal var-ied spectroscopy data with overlapping spectral profiles (Bro 2006; Ander-sen and Bro 2003) and process data (Meng et al. 2003; Wise et al. 2001; Bro1999). The advantage of multi-way models in analysing spectral data istheir ability to determine the compound composition of a mixture, whichis often a demanding task due to overlapping and other problems typi-cally present in spectral data (Jiji et al. 1999; Moberg et al. 2001). Thesemulti-way models have proven to be useful multi-way data handling meth-ods for extracting chemically relevant information from spectra (Bro 2006),e.g., enhancing chemical understanding and evaluating relative concentra-tions of compounds in a sample (Bro 1998; Stedmon et al. 2003; Andersenand Bro 2003; Geladi and Forsstrom 2002). Multi-way methods have alsobeen applied to process control procedures as well as in regression analyses(Smilde et al. 2005; Andersen and Bro 2003; Bro 1999).
It should be noted that utilization of multi-way models in problem solv-ing has been on the increase in recent years (Bro 2006), most probably be-cause of the increased awareness of the potential advantages of these multi-way methods.
2.4 Neural networksNeural networks are widely applied in pattern recognition and classifica-tion tasks (Agatonovic-Kustrin and Beresford 2000; Zupan and Gasteiger1999). The neural network mimics the human brain containing neuronsthat are mathematical entities interrelated to other neurons and workingaccording to the functions of each neuron (Agatonovic-Kustrin and Beres-

21
ford 2000). The detailed structure of the neural network differ dependingthe application but the main principles are somewhat similar (Zupan andGasteiger 1999). Neural nets are shortly described in this thesis because oftheir occasional utilization in this context.
2.4.1 Tree-structured self-organizing maps (TS-SOM)
TS-SOM (Koikkalainen 1994) as implemented in Visual Data (Visipoint2003) is a modified version of Kohonen’s unsupervised Self - Organiz-ing Map (Kohonen 2001), that has an ability to represent high dimen-sional data in lower dimensions, i.e. 2-dimensional lattice. The latticeconsists of neurons that describe the weight vector of original variables,(ws = ws1 + ws2 + ... + wsj) of each neurons s. Since SOM is an unsupervisedlearning method, it "learns" the data and performs the grouping based onweight vector similarity of the data objects. In the TS-SOM, ordinary SOMsare organized hierarchically and at every level, the size of the SOM is fourtimes greater than at a previous level. In addition to the TS-SOM, the neigh-bourhood function of the Best-Matching Unit (BMU) neuron is connectedto four adjacent neurons. The BMU is the winning neuron where Euclideandistance between the input data object vector xi and the respective weightvector wm is the smallest:
c(xi, W) = argminj‖xi − wj‖, (2.23)
where W present weight vectors of SOM (Kolehmainen 2004).After defining the BMU, the weight vectors of respective and neighbour-
ing neurons are corrected in order to represent the weights of the prevailingmapping.
The neighbourhood neurons contain objects having more similar prop-erties. Thus the SOM algorithm creates regions containing the same kind ofinformation. The basic idea behind the SOM is that with this iteration andself- learning it can create a feature map that is a good approximation of theinitial data space (Kohonen 2001). Due to the neighbourhood function cri-terion and the hierarchical structuring, TS-SOM is a more efficient tool forhandling massive data sets than the ordinary SOMs (Kolehmainen 2004).

22
2.5 Pre-processingPre-processing refers data transformation prior analysis, i.e., weighing theoriginal data differently, removing non-linearity, handling data so that itbecomes more suitable for analysis (Vandeginste et al. 1998) and/or it candecrease the model complexity (Rinnan et al. 2009). Usually, it is performedin a variable-wise manner since the most common operations are run in col-umn space. Most commonly pre-processing method for data is called meancentering to unit variance and is the default option in some software pack-ages, such as SIMCA-P. However more advanced and other pre-processingroutines need to be taken into account e.g. with spectral, noisy and pro-cess data. The following pre-processing operations are presented mainly inthe column space of a two-way matrix. However, sometimes raw data ishandled without any pre-processing (Sekulic et al. 1998).
2.5.1 (Mean) Centering
Centering is applied for data including offsets (Bro and Smilde 2003) sincethe purpose of centering is to remove this feature. This action may reducethe rank of the truncated, model matrix (Bro and Smilde 2003). Center-ing is applied across the first mode, i.e. subtracting column average fromelements of matrix or across the second mode, i.e. by subtracting the rowaverage, respectively (Bro and Smilde 2003). Mean centering of variables isachieved by subtracting each column in the matrix by its mean value (Van-deginste et al. 1998).
zij = xij −mj = xij −1I
I
∑i
xij (2.24)
z stands for the transformed elements of data matrix after mean center-ing, x for the elements of original data matrix, m for mean (vai average) ofthe column. The column vectors of transformed matrix Z have zero mean.In the case of a multi-way array, centering across one mode, i.e. single-centering is carried out by first unfolding the data matrix then subtract-ing the offset and folding the array. If centering is to be performed in twomodes (double-centering), centering is accomplished one mode at a time,hence, first one mode is to be unfolded and centered column-wise followedby centering of the other mode.

23
It is noted that centering refers to projection onto nullspace of 1T (Broand Smilde 2003). Therefore data matrix is moved in the direction of off-set and the offset is thus removed. Centering changes the structure of themodel (Bro and Smilde 2003). Centering, with process data, can be alsosubtracting set points instead of the mean value (Wold et al. 2001).
2.5.2 Scaling
Scaling is used for data with variables of different magnitudes (Bro andSmilde 2003), i.e., variables from different sources. The scaling involvesthe rows or columns to be multiplied by a scalar value, mostly this will bethe inverse of the standard deviation. The row-wise scaling is preferredas scaling within the first mode whereas column-wise scaling is preferredwithin the second mode, respectively (Bro and Smilde 2003).
sj =
√√√√∑Jj=1(xij −mj)2
J − 1; (2.25)
zij =xij −mj
sj; (2.26)
where sj is standard deviation zij stands for the transformed the ele-ments of data matrix after scaling, x for the elements for original data ma-trix, m for the mean of the column. The column vectors of transformedmatrix Z have zero mean. The scaling of multi-way array is implementedin a slab-wise manner, after unfolding of the data (Bro and Smilde 2003).
Scaling to unit variance or column-standardization or autoscaling (Broand Smilde 2003) is a commonly utilized method for pre-processing (Van-deginste et al. 1998) and it is typically applied when lacking prior informa-tion of the importance of variables relative to the model (Wold et al. 2001).Applying the scaling to data to a unity allows an equal weight of everyvariable for model fitting. Scaling does not affect the structure of the modeland has a less dramatic influence on the model (Bro and Smilde 2003).
2.5.3 Partial weighting of variables
Partial weighting of variables can be considered as a special case of variablescaling. In order to achieve similar variance by ranking the importance ofdata points, scaling of less important part of the data is applied. If data is

24
acquired with different methods from the same measuring target but of un-equal sizes (multi-block data) (Bro and Smilde 2003) or if some part of datais more relevant for the specific problem such as fault diagnostics in pro-cess chemometrics (Kourti 2006; Kourti et al. 1995), then partial weighingof data points may be used. In process monitoring for instance, some vari-ables are under tighter control than others and if these variables indicatethe fault occurrence they need to be highlighted in order to contribute tothe first latent components for fault diagnostics (Kourti 2006). In addition,if some variables are known to contribute to the quality significantly theycould be weighted by two-fold or so (Kourti 2002).
2.5.4 Variable or subset selection
A variable or subset selection is one of the most widely studied topicsin chemometrics. Dimension reduction of an original data table prior tomultivariate modelling becomes essential when hundreds or thousands ofvariables are used for understanding or defining the present data structure(Willighagen et al. 2006). The idea of variable selection is to extract variablesthat do not contribute to the latent structure of the data (Höskuldsson 1996,2001, 2003) and also to find, on the contrary, those variables that contributeto the best or most stable latent structure. Thus, the variable selection en-ables easier interpretation of the most important variables which modifythe modelling output.
There are many different methods from which to select the most im-portant variables for regression or classification problems such as classi-cal forward and backward selection, interval partial least squares (iPLS)(Norgaard et al. 2000), genetic algorithm (GA) (Leardi and Norgaard 2004),covariance procedures (CovProc) (Reinikainen and Hoskuldsson 2003) toname a few. In SIMCA-P software, a special VIP (variable importance onprojection) is used to select the most important variables that contribute tothe model. Also weight vectors (with some possible cut-off value) can beused as the basis for the selection in some approaches, such as CovProc.
2.6 Model validationPerformance of the model to predict the future samples and to describeunderlying data can be elucidated by using different statistical diagnosticssuch as monitoring residuals and loadings with respect to the statistical

25
confidential limit (Martens and Martens 2001; Smilde et al. 2005). Modelvalidation includes not only the model’s ability to fit and predict futuredata but also an assessment of the calibration data set used for creatingthe model. Good calibration data is representative for modeled phenom-ena and contains no outliers i.e., a differently or badly behaving sampleor variable that would have a crucial effect on the model. Alternatively, ifone uses robust counterparts of ordinary chemometric methods, the out-liers should not affect the models detrimentally (Daszykowski et al. 2007;Lin et al. 2007). In addition, choosing the right number of components forthe model is an important aspect of model validation.
In terms of algorithm perspective, model validation needs to be carriedout, since modelling methods are intended to achieve the best fit of datawithout any knowledge about its soundness for the real-world (Willigha-gen et al. 2006). The best-fit approach can easily lead to overfitted models,i.e. poor models that are not robust and applicable for future data. More-over, a data set with many variables may lead to chance correlation withthe given response (Willighagen et al. 2006).
Despite the existence of statistical methods, it is best to analyze the func-tionality of the model, if possible, by using an external test set which isindependent of the calibration data (Smilde et al. 2005; Willighagen et al.2006; Dahl and Esbensen 2007; Golbraikh and Tropsha 2002; Vandeginsteet al. 1998). In addition, the visual appearance of loadings (Andersen andBro 2003), common sense and understanding of the applied analysis, ana-lytical and measuring methods need to be taken into consideration in theevaluation of model performance (Smilde et al. 2005; Doherty and Lange2006). Badly validated models may lead over-fitted, non-robust models andultimately to false conclusions.
In the following sections, some of the most commonly utilized valida-tion methods are presented.
2.6.1 T2 diagnostics
T2 diagnostics is used to define statistical confidence limits for multivariatemodel (Hotelling’s T2). It is computed as follows
T2i =
F
∑f =1
t2i f
s2t f
(2.27)

26
The T2 value is a measure of the sample distance from the mean of themultidimensional model plane, F is the number of latent variables and s2
t isthe estimated variance of the score vector ti. For new data, it is an indica-tion of whether or not the new data is fitting into the model plane (Kourti2006). It is used in multivariate process control charts in order to assess ifthe process is under control or it can be used for outlier diagnostics.
2.6.2 Residual (Q) diagnostics
Residual diagnostics is used to assess the relevant number of components ofthe model, the goodness of the calibration set, outliers and fault detection inprocess chemometrics (Smilde et al. 2005; Bro 1998; Wold et al. 1998; Miller1995; Kourti et al. 1995; Qin 2003; Chiang and Colegrove 2007). Residualrefers to the part of the data that is not modelled and assumed to consist ofnoise or redundant random information and it is computed as
EX = X− Xhat (2.28)
EY = Y− XB (2.29)
where EX(IxJ) and EY(IxJ) stand for residual matrices, X and Y original datamatrices, respectively, Xhat for modelled data matrix and B denotes regres-sion coefficients matrix.
In calibration, the appropriate number of components is usually ex-tracted when residuals contain only unsystematic variation (Smilde et al.2005). Especially in the case of spectral data, the systematic variationin residuals may indicate that some spectral information is unmodelled(Smilde et al. 2005). However, the unfilled assumption of the model struc-ture can be reflected in the residuals and thus bias the residual analysis(Smilde et al. 2005). Nonetheless, it should be noted that the calibration setand the final model define the common object.
In the case of outlier diagnostics, the normal sample has small residualsin contrast to the outlying object (Daszykowski et al. 2007). If the predicteddata set encompasses similar residuals of the magnitude the test set is con-sistent with the calibration data and the prediction can be expected to bevalid (Bro 2003). If, instead, the magnitude of residuals of the test set isobviously greater than those in the calibration data, the existing model isnot able to estimate reliably the new source of variation which have been

27
introduced (Bro 2003). This might be the case for instance with processmonitoring when the process is about to move to an unwanted direction orsome new interferent has been introduced into the system.
2.6.3 Cross-validation (internal validation)
Full (leave-one-out, LOO) and leave a portion out cross-validation (CV)methods are two widely applied methods for assessing the number ofmodel components i.e. underlying latent structure in the data with an in-ternal test set (Bro et al. 2008; Golbraikh and Tropsha 2002; Vandeginsteet al. 1998). The rationale behind the applicaton of CV is to avoid overfit-ted models to be determined (Bro et al. 2008; Höskuldsson 1996).In somecases, CV is used for judging the goodness of the model, i.e., validating themodel predictivity when the external data set is not available. However, ithas been demonstrated that cross-validated variance explained Q2
CV doesnot provide reliable estimate for predictive power of the model (Golbraikhand Tropsha 2002). Thus, it should be used only for assessing the numberof the model components and as a starting point in the model evaluation.
The basic principle of cross-validation is to build a model and leave oneor several samples out from the modelling at a time and then to test themodel performance by predicting the latent values or response with theexisting model (Brereton 2003; Vandeginste et al. 1998)
PRESS = ∑ (yi − yi,hat)2 , (2.30)
RMSECV =
√PRESS
I(2.31)
where PRESS stands for prediction error of sum of squares, RMSECV forroot mean square error of cross-validation and yi is the reference value andyi,hat predicted value of response, respectively and n number of samples.For example, in the case of PCA, yi is replaced by X in Eq. 2.30 and yi,hat byXhat.
The modelling cycles continues until all data rows are used both in mod-elling and internal testing. Summing over the prediction error for the testset for every component leads to determining the number of componentsthat best describes the data using Eq. 2.30 and Eq. 2.31. This involves plot-ting RMSECV as a function of the number of components, where RMSEP(root mean square error of prediction) typically diminishes until reaching

28
the maximum number of components that are less likely to explain thenoise (Brereton 2003).
There has been some criticism about the cross-validation suitability andlimitations of using CV for variety of data in PCA analysis and CV algo-rithms from different chemometric software package (Bro et al. 2008). Byusing an internal validation of the model, the predictive performance forfuture samples from different laboratory, locations, batches or process timeis still unknown (Brereton 2003). Bro et al. (2008) showed that some of theCV algorithms applied for PCA in different programs can bias the originalpurpose of CV, i.e., the model has to be independent from the part of thedata being left-out and tested. It has also been debated whether or not theLOO- method will provide overfitted models (Kalivas 2005; Vandeginsteet al. 1998) and that CV is only valid for comparative purposes of regres-sion models built from the same calibration set (Dahl and Esbensen 2007).
2.6.4 Split-half analysis
Split-half analysis is intended for assessing the performance of the modelsthat are unique and do not have rotational freedom, e.g., PARAFAC andfactor analysis (Harshman1984) (Smilde et al. 2005). The name of the anal-ysis is a direct reference to the concept of the method, i.e. the original datamatrix has been divided into two data blocks that are modelled indepen-dently. Due to the uniqueness of these kinds of models, the model loadingswill be similar for subsets if the correct number of components has beenextracted (Smilde et al. 2005). It should be noted that splitting needs to beperformed in a mode where as a result, subsets exhibit the region of interestand most likely are to be decomposed with the same latent factors. How-ever, if the number of samples in the splitted mode is too few, the replicatelatent variable decomposition may not be feasible (Smilde et al. 2005).
2.6.5 Core consistency
The core consistency diagnostic (CORCONDIA) indicates the goodness offit of decomposition multi-way models (Bro and Kiers 2003). CORCON-DIA compares the truly trilinear structure to the model estimated corewhich varies on a scale from 0 to 100%. If the value of core consistencyis near zero, the model has too many or too few components. If it is near to100%, then the fit of the model is perfectly trilinear.
29
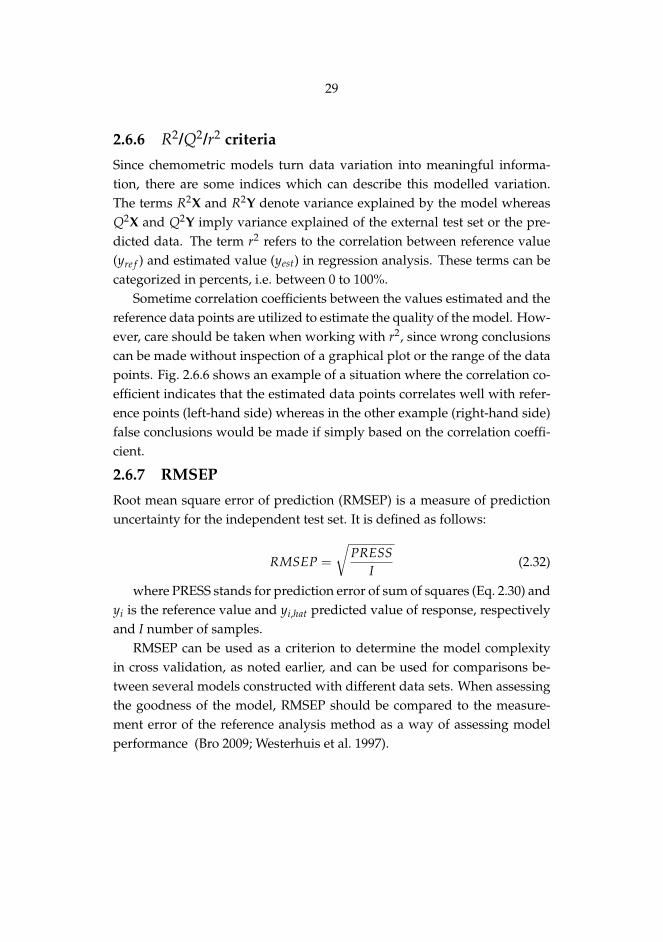
2.6.6 R2/Q2/r2 criteria
Since chemometric models turn data variation into meaningful informa-tion, there are some indices which can describe this modelled variation.The terms R2X and R2Y denote variance explained by the model whereasQ2X and Q2Y imply variance explained of the external test set or the pre-dicted data. The term r2 refers to the correlation between reference value(yre f ) and estimated value (yest) in regression analysis. These terms can becategorized in percents, i.e. between 0 to 100%.
Sometime correlation coefficients between the values estimated and thereference data points are utilized to estimate the quality of the model. How-ever, care should be taken when working with r2, since wrong conclusionscan be made without inspection of a graphical plot or the range of the datapoints. Fig. 2.6.6 shows an example of a situation where the correlation co-efficient indicates that the estimated data points correlates well with refer-ence points (left-hand side) whereas in the other example (right-hand side)false conclusions would be made if simply based on the correlation coeffi-cient.
2.6.7 RMSEP
Root mean square error of prediction (RMSEP) is a measure of predictionuncertainty for the independent test set. It is defined as follows:
RMSEP =
√PRESS
I(2.32)
where PRESS stands for prediction error of sum of squares (Eq. 2.30) andyi is the reference value and yi,hat predicted value of response, respectivelyand I number of samples.
RMSEP can be used as a criterion to determine the model complexityin cross validation, as noted earlier, and can be used for comparisons be-tween several models constructed with different data sets. When assessingthe goodness of the model, RMSEP should be compared to the measure-ment error of the reference analysis method as a way of assessing modelperformance (Bro 2009; Westerhuis et al. 1997).

30
0 5 10 15 200
5
10
15r2=95.4%
0 50 100 150−20
0
20
40
60
80
100
120r2=99.5%
Figure 2.5: Example of different correlation coefficients.

31
2.6.8 Leverage and influence diagnostics
Leverage diagnostic, i.e., the measure of sample or variable influence on themodel has been used for assessing the model fit for calibration data and foroutlier detection (Smilde et al. 2005; Vandeginste et al. 1998; Miller 1995). Asample with a low leverage value has a low impact in the model whereas asample with high leverage may cause fatal damage to the calibration modelif it contains erroneous information. In general, the low leverage value indi-cates that the sample is an average sample that contributes to the model. Incontrast, the high leverage sample contains some specific variation whichneeds to be checked carefully. Thus the high leverage value of certain sam-ple may be an indication of an outlier that is a differently behaving sample(Smilde et al. 2005; Vandeginste et al. 1998) or it may be the source of infor-mation that is important for the model but which at the present is unrep-resented (Smilde et al. 2005). According to Martens and Martens (2001), asample having a leverage value twice as large as the others in the calibra-tion set may be considered as an outlier. However, its relevance and thedistribution of calibration set needs to be checked. If there is a single sam-ple with high leverage value, it can be questioned, if the calibration set isprobabilistic and covers the variance or modelled phenomenon adequately.
Leverages of samples can be observed in X (Eq. 2.33) space or modellingof y (Eq. 2.34) (Höskuldsson 1996; Martens and Martens 2001).
hi,X = ti
(TTT
)−1tTi +
1I
(2.33)
where hi,X is the leverage and ti the score vector of respective observa-tion in X(IxJ) space, and 1
I is the offset term for mean centered data with Iobservations (Smilde et al. 2005). In the case of multi-way models, loadingmatrices are subsituted into Eq. 2.33.
hi,Xyi = hi,X +(yi − yi,hat)
2
(y− yhat)T (y− yhat)
(2.34)
where subscript hat denotes the estimated y value.

32

33
3 PROCESS ANALYTICAL TECHNOLOGY,PAT
PAT stands for Process Analytical Technology and it aims to change thepresent thinking and operation within the pharmaceutical industry to-wards real-time process control or monitoring instead of the intermediateor end product testing off-line (Munson et al. 2006; Scott 2002). FDA definesPAT as "a system for designing, analyzing, and controlling manufacturingthrough timely measurements (i.e., during processing) of critical qualityand performance attributes of raw and in-process materials and processeswith the goal of ensuring final product quality" (U.S. Food and Drug Ad-ministration 2004). The PAT approach applied to the pharmaceutical pro-duction is intended to enhance process understanding, hasten analysis ofintermediate and final product and provide better control of the process(Scott 2002).
PAT is a synonym for PAC (process analytical chemistry) (Workmanet al. 2007) since it uses similar methods, e.g. multivariate and spectroscopictechniques, that convert variances in the process into information (Balboni2003). These methods are well known and have been applied in processchemistry and process lines in other industries for several decades (Hardyand Cook 2003; Kourti 2006). According to FDA, the PAT guidance liststhe core concepts of PAT and process understanding to be (1) multivariatedata acquisition and analysis tools, (2) process analyzers and sensors, (3)process and endpoint monitoring and control, and (4) tools for informationmanagement for ongoing improvement. Thus, chemometrics plays a criti-cal role in the PAT context and this needs to be appreciated (Balboni 2003;Miller 2005).
PAT, as well as PAC, tools refer to measuring and analyzing methodsthat provide real-time information about the process state and control, and
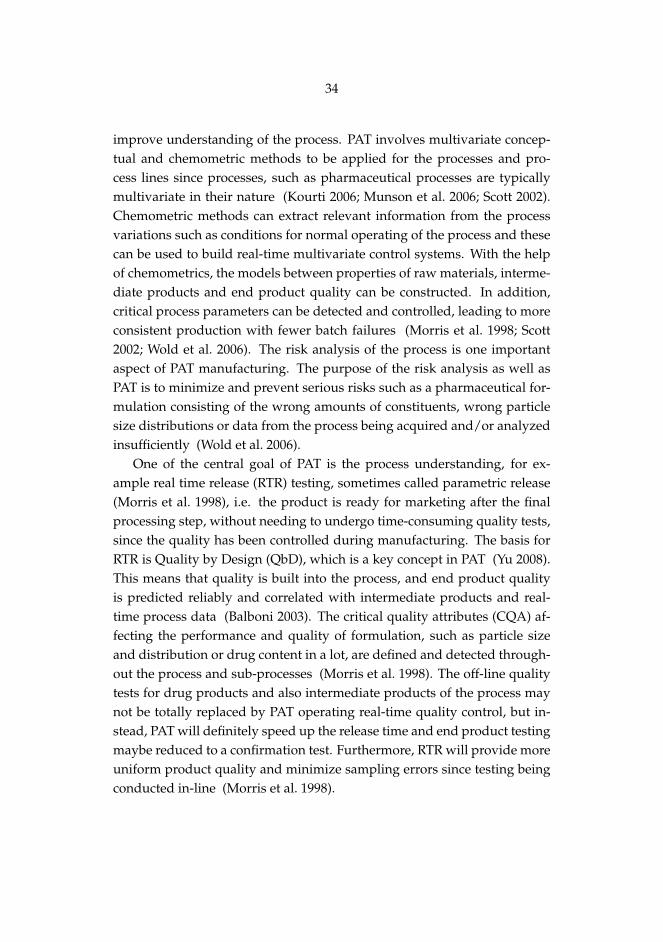
34
improve understanding of the process. PAT involves multivariate concep-tual and chemometric methods to be applied for the processes and pro-cess lines since processes, such as pharmaceutical processes are typicallymultivariate in their nature (Kourti 2006; Munson et al. 2006; Scott 2002).Chemometric methods can extract relevant information from the processvariations such as conditions for normal operating of the process and thesecan be used to build real-time multivariate control systems. With the helpof chemometrics, the models between properties of raw materials, interme-diate products and end product quality can be constructed. In addition,critical process parameters can be detected and controlled, leading to moreconsistent production with fewer batch failures (Morris et al. 1998; Scott2002; Wold et al. 2006). The risk analysis of the process is one importantaspect of PAT manufacturing. The purpose of the risk analysis as well asPAT is to minimize and prevent serious risks such as a pharmaceutical for-mulation consisting of the wrong amounts of constituents, wrong particlesize distributions or data from the process being acquired and/or analyzedinsufficiently (Wold et al. 2006).
One of the central goal of PAT is the process understanding, for ex-ample real time release (RTR) testing, sometimes called parametric release(Morris et al. 1998), i.e. the product is ready for marketing after the finalprocessing step, without needing to undergo time-consuming quality tests,since the quality has been controlled during manufacturing. The basis forRTR is Quality by Design (QbD), which is a key concept in PAT (Yu 2008).This means that quality is built into the process, and end product qualityis predicted reliably and correlated with intermediate products and real-time process data (Balboni 2003). The critical quality attributes (CQA) af-fecting the performance and quality of formulation, such as particle sizeand distribution or drug content in a lot, are defined and detected through-out the process and sub-processes (Morris et al. 1998). The off-line qualitytests for drug products and also intermediate products of the process maynot be totally replaced by PAT operating real-time quality control, but in-stead, PAT will definitely speed up the release time and end product testingmaybe reduced to a confirmation test. Furthermore, RTR will provide moreuniform product quality and minimize sampling errors since testing beingconducted in-line (Morris et al. 1998).

35
In the PAT concept, the following terms are used to describe analyzingevent; in-line, on-line, at-line and off-line. In-line means that the measure-ments have been acquired from the process stream, on-line is similar butthe sample has either been removed and returned to the process in orderto conduct measurements or measurements are run periodically. At-linemeans that the sample is removed for running the measurements in thevicinity of the process stream but it is not returned whereas off-line meansthat the sample has been transported to some other laboratory for analysis.
Two cornerstones of PAT ideology are as follows: (1) non-destructivemeasuring methods that gather real-time process data, which will be de-scribed shortly in the next chapter and (2) multivariate methods in chemo-metrics that analyze and transform (convert) data variation into meaningfulinformation, which were described in Chapter 2.
3.1 Non-destructive methods in PATNon-destrucitve methods are essential measuring tools to achieve processrelated information since they do not destroy a sample and can be appliedwithout any contact with the sample. One of the basic non-destructive toolsfor process monitoring is a thermometer. However, spectroscopic meth-ods, in particular NIRS (Near infrared spectroscopy), will often consideredmore advantageous in the context of PAT (Blanco and Alcala 2005; Cogdillet al. 2005). These methods can be considered as detection tools for spe-cific multivariate fingerprints of the components (Berntsson et al. 2002)or the process. Spectroscopic methods can be divided into whether theyare based on electromagnetism or an sound waves. Their common prin-ciple is an energy spectrum that they produced. The spectrum is a rangeof adjacent wavelengths or frequency points that include the characteristicsensitivity or absorbancy of electromagnetic or sound wave (pressure) fora specific material. The basic concept of the spectrum is that each spectrumincludes specific information, this can be about one molecule or one atomor infinitely many. The sensitivity of the gathered spectrum depends on thewavelength in which the target material is either illuminated or passivelydetected. Different wavelength ranges have different energetic properties.For instance, the NIR electromagnetic radiation that is considered is in therange 780-2526 nm (Reich 2005) causes vibration and stretching of bonds.On the other hand, much smaller wavelengths, X-ray in a range of 10 to 0.01

36
nm, can penetrate deeper into the material and interact between atoms bycausing absorption or emissions of photons to the incident radiation source.
The interest in utilizing different spectroscopic methods is due totheir ability to acquire and carry physicochemical information, in a non-destructive manner. As mentioned, NIR is the most commonly used tech-nique to characterize tableting unit operations (Reich 2005; Luypaert et al.2007; Roggo et al. 2007) since the NIR spectra of solid material contains aplethora of physical and chemical information and process-related changes(Roggo et al. 2005). Recently, also Raman and terahertz spectrocopies haveattracted interest as potential PAT tools for use in pharmaceutical research(McGoverin et al. 2008). Both NIR and Raman require no sample prepara-tion hence they are non-destructive PAT tools. The difference between theanalysis of NIR and Raman is that the latter method displays more distinctspectral peaks (Sasic 2007) whereas NIR produces a broad and overlap-ping absorbance spectra which needs proper pre-processing prior to anal-ysis. However because the spectra include multidimensional fingerprint ofchemical constituents and even physical properties, multivariate analysistools will be needed in the analysis.
It should be noted that even though optical spectroscopic methdods areuseful PAT tools, the probe contamination and sampling location may rep-resent a problem. Thus, more research concerning other non-destructivemeasuring devices e.g. those based on sound waves (acoustic emission) orelectric properties of the system of interest (electrical capacitance) shouldbe continuously carried out. Summing up, it is clear that one measuringtool may not be able to detect all compounds or process fluctuations due tolimited detectability of the analyte of interest or the tendency to destroy orchange the target which is being measured.
3.2 Tablet manufacturingThe tablet is the most widely used orally administered dosage form becauseof its many advantages such as easy administration, the cost effectivenessof its manufacturing and the stability of the formulation (Varma et al. 2004;McCormick April 2005; York 2002). The tableting process aims to put a drugsubstance into a 3-dimensional preparation and to implement it in such away that the drug product is safe and functional for the purpose for whichit is intended. Tableting consists of several intermediate phases, called unit

37
-wei -mix1 -gra -dry sie - mix2 - tab - pack
Figure 3.1: The examples of unit operations in tableting. Wei refers toweighting of mixture components, mix1,2 to the first and second mixing,respectively, gra referes to granulation, S to sieving, dry to drying phase, sieto sieving, tab to tablet compression and pack to packaging.
operations (Skibsted et al. 2007; Doherty and Kettler 2005). The unit oper-ations ranges from raw material characterization to tableting, tablet testingand packaging (Fig. 3.1). Tablet production by direct compression is themost desirable option for pharmaceutical companies, in particular for thegeneric manufacturer, since it does not need the powder granulation and itis more cost effective (McCormick April 2005).
Different unit operations exhibit multivariate characteristics since eachof their (intermediate) products depends on the loads of different variablesand measurement conditions. Variation in the raw materials e.g. due toparticle size distribution or different manufacturer can affect the output ofunit operations. Despite this multivariate nature, the processes still tend tobe monitored univariately. Some of the unit operations, such as blendingand granulation have been equated to "art instead of science" (Muzzio et al.1997; Tsujimoto et al. 2000; Iveson et al. 2001; Litster 2003). For instance, thegranulation process is one of the most poorly understood unit operationso far (Cameron et al. 2005), the success of which depends of many inter-related process variables. Hence, the reasons for the poor understandingof processes are mainly due to lack of multivariate process control and de-tection as well as the lack of real-time information about of process condi-tions. Even though the FDA’s PAT guidance recommends and encourages

38
the Quality by Design (QbD) approach for pharmaceutical manufacturingin which product quality is assessed real-time, it does appear that the qual-ity and success of different unit operations relies heavily on evaluating theoutput material of sub-processes, off-line (Reich 2005).
3.2.1 Typical tableting control scheme
At present, tableting quality control is carried out by testing (1) raw mate-rials, (2) in-process materials and intermediate product, and (3) end prod-uct off-line according to the regulations in the relevant pharmacopeias, andmanufacturing (Munson et al. 2006) is conducted as a fixed process (Yu2008). A fixed process means that the manufacture is carried out accordingto very strict specifications which over time have been discovered to ensure,at least most probably, a good quality tablet. If some out-of-specificationevent occurs during processing, the process is judged to have failed andall of the materials will be discarded (Yu 2008) without the possibility fortrouble-shooting (Wu et al. 2007). Moreover, univariate control charts areutilized and different process parameters are recorded individually. Theunivariate control charts may or may not detect faults or the success inthe process line i.e. they may well be inappropriate controlling tool forprocess and assessing the goodness of the final quality (Kourti 2006; Chi-ang and Colegrove 2007). The conventional process parameters utilized forcontrol are time (Westerhuis et al. 1997; Jørgensen et al. 2004; Tabasi et al.2008), temperature, or other trivial or fundamental measurements from theprocess line (Doherty and Kettler 2005) that do not necessarily equate toappropriate process information nor directly link to quality attributes. Inessence, this means that the process is not understood and optimized in amanner that a controlling system would either prevent the failures or en-able the manufacturer to react to process conditions variation by changingkey parameters and thus to stabilize the process. This is fundamentally dueto the unknown causality between processing variables and product qual-ity (Lionberger et al. 2008). Therefore, batch-to-batch variation exists, butvariation within process conditions are forbidden and neither understoodnor controlled. Thus, it should be noted, that under strict and inflexibleprocessing conditions, a batch that may possess acceptable properties maybe discarded (Yu 2008).
Since the pharmaceutical industry operates in a highly regulated envi-
39
ronment for obvious reasons, each unit operation in tablet production needsto be carefully tested to guarantee that the product meets the set specifica-tions. At present, this means much time-consuming off-line testing (Reich2005) in laboratories with the result being either batch approval or rejection.At this stage, almost nothing can be done to compensate for the process andprevent rejection. Thus, by utilizing the more advanced techniques appliedalready in other industries including spectroscopic tools, chemometrics andmultivariate control charts (Kourti 2006) for tableting process control fromthe beginning to the end, a more in-depth knowledge of the process and itsvariable correlation structure (Chiang and Colegrove 2007) is gained andeventually, process quality risks are minimized (Bakeev 2005).
3.2.2 Quality control scheme by PAT approach
In principle, there are three different approaches to apply PAT in tabletmanufacturing. The most conventional is to concentrate on modelling oneunit operation at time. Next level PAT applications include connecting twoor several unit operations, e.g. via regression models, which is useful sinceanything that has happened in process conditions in the preceding phaseswill affect the subsequent process phases (Skibsted 2005; Kourti 2006; Skib-sted et al. 2007). For instance, an optimal implementation of PAT in tabletmanufacturing requires the unit operations such as wet granulation andend product quality to be linked with multivariate latent variable models(Westerhuis et al. 1997; Skibsted et al. 2007). The third and most desiredPAT implementation level is to connect all critical unit operations togetherand create a feed-forward controlling system. The feed-forward controlsystem enables process conditions to vary but still to be compensated toreach the desired output. Lastly, if all the unit operations are controlledcontinuously with respect to critical process parameter and critical qual-ity attributes (CPP and CQA, respectively) real-time-release of end prod-uct is possible (Yu 2008; Rathore et al. 2009). This leads to the result thatonly those batches that deviate from a pre-determined process signature aretested off-line or rejected (Rathore et al. 2009). However, only a very fewapplication connecting several unit operations with latent variable modelshave been published.

40
3.2.3 Examples of process control strategies
According to PAT, and more generally in process optimization, critical pro-cess parameters (CPP) that affect critical quality attributes (CQA) need tobe defined and controlled and their interrelationships understood. The im-portance of a control strategy for the manufacturing is emphasized (Lion-berger et al. 2008; Yu 2008; Kourti 2009), but nonetheless, only a very fewcase studies have been published concerning pharmaceuticals (Westerhuiset al. 1997; Skibsted et al. 2007).
In 1997, Westerhuis et al. (1997) considered a tablet manufacturing witha granulation step as a two-step process where first the powder blend wasgranulated and subsequently tabletted. This study is a unique exampleof optimizing and predicting the multi-step process of tableting and howthe different unit operations can be treated as a whole. This study will bescrutinized thoroughly later, in Chapter 5.3.4.
After a 10 year gap, Skibsted (Skibsted 2005) depicted in his thesis anexample of a feed-forward control and real-time release system for interme-diate and end product for tablet production. Skibsted et al. (2007) utilizeda feed-forward PLS regression model which was constructed using the pre-ceding conditions of unit operation for assessment of conditions of the nextunit operation, i.e. settings of a granulation parameter in order to obtainthe desired tablet quality. Also, Kourti (2009) illustrated conceptually someyears later, in 2009, the main principles of feed-forward control as it ap-plies to tablet production by emphasizing the importance of the actions tobe made for N+1 unit operation according to the latent projection model ofN unit operation outcome. In this way, raw material variation and batch-to-batch variation could be compensated by affecting process conditions inorder to achieve the target product.
A very recently framework published by Huang et al. (2009) outlinedalso how multivariate data analysis could be integrated into tablet produc-tion from the beginning to the final product evalution. In Fig. 3.2, box-likechart shows the principal idea of managing the tableting process, whichin fact can be applied on other batch processes within pharmaceutics. Theprocess under study constructed of high shear wet granulation, milling,blending, compression and coating unit operations. Milling and coatingare not a part of this thesis, and thus will not be further discussed. How-
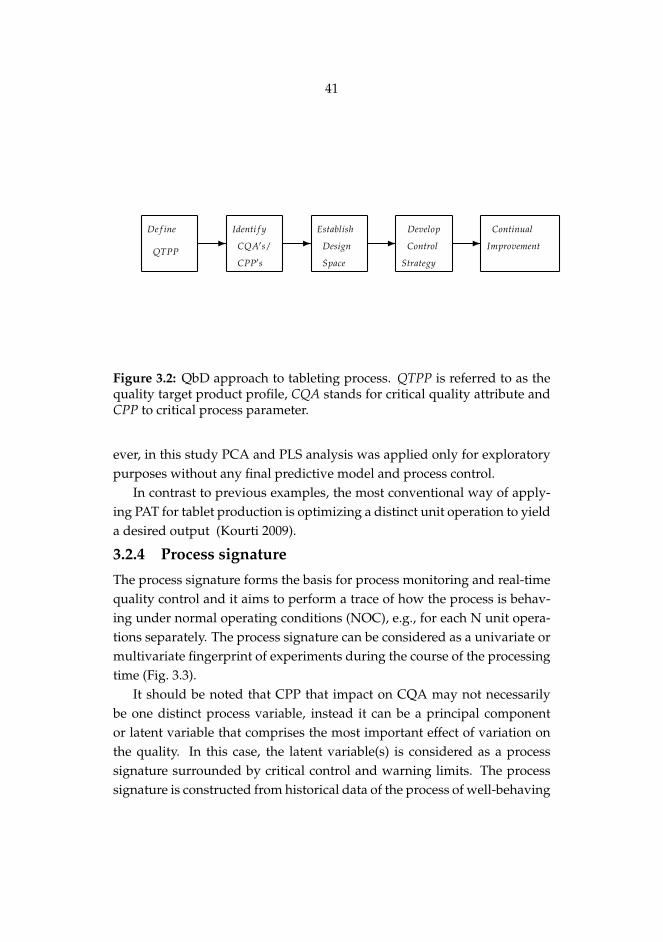
41
-De f ine
QTPP-
Identi f y
CQA′s/
CPP′s
-Establish
Design
Space
-Develop
Control
Strategy
Continual
Improvement
Figure 3.2: QbD approach to tableting process. QTPP is referred to as thequality target product profile, CQA stands for critical quality attribute andCPP to critical process parameter.
ever, in this study PCA and PLS analysis was applied only for exploratorypurposes without any final predictive model and process control.
In contrast to previous examples, the most conventional way of apply-ing PAT for tablet production is optimizing a distinct unit operation to yielda desired output (Kourti 2009).
3.2.4 Process signature
The process signature forms the basis for process monitoring and real-timequality control and it aims to perform a trace of how the process is behav-ing under normal operating conditions (NOC), e.g., for each N unit opera-tions separately. The process signature can be considered as a univariate ormultivariate fingerprint of experiments during the course of the processingtime (Fig. 3.3).
It should be noted that CPP that impact on CQA may not necessarilybe one distinct process variable, instead it can be a principal componentor latent variable that comprises the most important effect of variation onthe quality. In this case, the latent variable(s) is considered as a processsignature surrounded by critical control and warning limits. The processsignature is constructed from historical data of the process of well-behaving

42
Figure 3.3: The process signature for an arbitrary process. A well behavingprocess runs within the control limits as a function of time. Data from theprocess is analyzed by PCA and the first latent variable (t1) captures themost important process information.
batches or processes (Kourti 2006; Skibsted et al. 2007).
3.2.5 Summary of PAT advantages
The advantage of the controlled and well optimized processes, where thefinal or intermediate product quality can be predicted using chemometricmodels provides batch-to-batch consistency and less batch rejections. Sinceintermediate process outcomes can be predicted beforehand and one cansee if the process is about to reach the critical warning limit, the processpersonnel may save the batch by altering the settings of the process condi-tions.
In the following sections, the cross-section of some chemometric appli-cations providing increased process or product understanding, i.e. PATstudies within uncoated tablet unit operations and techniques with whichthese methods can be applied.

43
4 PAT APPLICATIONS ON TABLETING UNITOPERATIONS
In this chapter, typical process phases with common problems in tablet pro-cessing are introduced. Furthermore, the appropriate chemometric andPAT tools involved are presented. The multivariate control strategy (i.e.models across several unit operations) is introduced whenever possible.There are some other unit operations such as solid state screening and dry-ing phase after granulation that are not considered within the context ofthis thesis. Even though the pre-formulation stage introduced at first inthis chapter, is normally not considered as a separate unit operation sinceit is a learning phase of formulation design covering the actual unit opera-tions, it is included here due to its importance in tablet manufacturing. Inthe following sections, X in the title depicts the data matrix under consider-ation.
4.1 Preformulation studies and formulation de-sign
The foundation for every drug formulation lies in the pre-formulationphase and how effectively and how well it has been carried out. The pre-formulation step covers studies which help in selecting the formulationtype, components to include and check their interactions, such as whetheror not to direct compress or granulate the powder blend prior to tableting.The optimization of tablet manufacturing is also included in formulationstudies such as target dissolution, strength and disintegration time as wellas amounts and types of different fillers and inactive excipients (Hwangand Kowalski 2005; Gabrielsson et al. 2006; Andersson et al. 2007). Com-paction profiles such as compaction force and speed and depth of the die areexamined at this phase since all these modify the tablet properties (Haware

44
et al. 2009a). The quality target product profile (QTPP), i.e. drug safety andfunction sets the limits on the formulation design (Hwang and Kowalski2005). If the API needs to dissolve rapidly, the formulation has to deliverthis requirement e.g. by adding disintegrants etc. If, on the other hand, thedrug is to be released in a controlled way, e.g. slowly or evenly, the formu-lation needs to ensure that this happens. Conventionally, the formulationprocess has been based on an empirical trial and error approach which isnot the most effective way to conduct this kind of procedure (Leuenbergerand Lanz 2005). Moreover, due to the limited amounts of API, the numberof trials and experiments needs to be minimized (Andersson et al. 2007).
The first step in the manufacture of an oral solid dosage form is to as-sess the requirements of drug substance to be suited for oral administra-tion, since the drug substance needs to pass through the gastrointestinal(GI) tract to its site of action without losing its effectiveness. The drug in-tended for oral delivery needs to have suitable physicochemical propertiessuch as appropriate solubility, lipophilicity, permeability and compatibil-ity with excipients (York 2002; Hwang and Kowalski 2005). To achievethe appropriate performance, the drug needs to have a certain dissolutionprofile and formulation for its intended performance. Biopharmaceuticalclassification system (BCS) and Lipinski 5 rule are well known and widelyapplied methods for assessing the drug-likeness and orally activeness of amolecule. However, the concept of orally administered drug is as difficultas the concept of assessing the characteristic of a drug-like molecule amongthe billions of different chemical compounds in the universe. Due to thisunknown field, i.e. unpredictable space of compounds, the properties ofdrugs intended for an oral dosage form need to be tested in a case-specificmanner.
The predictive techniques and models have been used in pharmaceuti-cal pre-formulation studies (Tarvainen et al. 2001; Hardy and Cook 2003;Korhonen et al. 2005; Suihko et al. 2005; Matero et al. 2008; Pajander et al.2009) as well as designing of experiments (Hwang and Kowalski 2005; An-dersson et al. 2007) in order to reduce the time and costs of formulationdevelopment and span the experimental space maximally. Several stud-ies have utilized computational molecular descriptors to characterize thephysicochemical properties of molecules and pharmaceutical materials for
45
predictions or discovering the causality of molecular or material charac-teristics for further processing (Matero et al. 2008; Allesø et al. 2008; Ko-rhonen et al. 2005; Suihko et al. 2005; Tarvainen et al. 2001). This researchfield comprises quantitative structure-property relationships (QSPR) thatis the correlation between molecular constituents to their physicochemicalproperties (Grover et al. 2000a,b). Alternatively, Willighagen et al. haveused the term ’molecular chemometrics’ (Willighagen et al. 2006). Manyproperties can be predicted which cover basically all of the preformulationtests (Wells 2002) ranging from molecular solubility and lipophilicity (Hu-uskonen et al. 2000; Cruciani et al. 2000), pKa value (Milletti et al. 2007)to dissolution (Korhonen et al. 2005; Matero et al. 2008), drug-excipientcompatibility studies (Matero et al. 2008) and tablet strength characteristics(Andersson et al. 2007). Molecular descriptors are appealing since usuallythey can be computed relatively quickly without any experimental work.
Different kinds of neural network and response surface methods (RSM)have been used in formulation design (Sun et al. 2003; Siepmann and Siep-mann 2008). In addition, the classical multivariate methods like PCA andPLS regression have been utilized . The downside of the neural networksthat mimic the visualization ability of human brains are often consideredas black box methods since the data processing is hidden from the user.Moreover, neural networks are prone to over-fitting (Manallack and Liv-ingstone 1999) because of inappropriate model validation. On the contrary,the RSM method, where two or three important variables are changed as afunction of target parameter, lacks the ability to handle a multivariate cor-relation which is crucial for complex systems such as tablet formulations(Leuenberger and Lanz 2005).
Next, a few examples of formulation design studies of optimizationwhere multivariate data analysis has been utilized is introduced.
4.1.1 Multivariate optimization in tablet manufacturing
Gabrielsson et al. (2006) proposed principal properties (i.e. principal com-ponents) of inactive constituents to evaluate and predict new mixture char-acteristics based on the mixture design and known additives. According tothese assumptions, new mixtures close to known ones in the score space in-hibit similar physicochemical properties and can be thus used as alternativeexcipients. The X matrix consisted of NIR or FT-IR data of mixture blends.

46
Andersson et al. (2007) used PLS and simulated simplex methods to an-alyze and optimize simultaneously tablet strength and dissolution and toconduct as few experiments as possible. The results indicated that the tar-get strength and fast dissolution were attained with the amounts of con-stituents, i.e., a specific filler ratio and a high concentration of disintegrant.The filler is used in tablets in order to obtain the desired size and disinte-grant to speed up drug release. In this study, the conclusions of the mostimportant DoE variables to affect response were drawn using a PLS VIPplot (Wold et al. 2001).
Recently, Haware et al. (2009a) evaluated PLS and PCA as a "formula-tion development tool" in the case of placebo tablets. In this study threedifferently behaving excipients (i.e. plastic, fragmentation and elastic com-pression behaviour) were compressed with varying formulation parame-ters utilizing full-factorial design. The formulation parameters were thepunch velocity of tablet compressor, lubricant and fourth excipient frac-tions. The compression properties of formulations, were assessed usingloading and weight plots of PCA and PLS, respectively. However, thestudy provided only an exploratory aspect instead of a quantitative aspect,which is of great interest in the pre-formulation stage. In the second studyof Haware et al. (2009b), the quantitative PLS models were developed be-tween tablet tensile strength (quality attribute, the Y matrix) and tabletingprocess parameters (punch velocity) and material properties (starting mate-rial variable size distribution and processing method). In the experiments,one excipient of different grades served as the basis for the variation in themanufacturing mode and particle size distribution. The PLS models forcompression behavior, i.e. tensile strength, were designed by leaving onematerial (one excipient of different grades) out of each time and to imple-ment it in an external test set. Although there was good predictive abilityfor the models, no consensus was achieved about what is of the most de-scriptive and useful model as an formulation development tool.
4.2 MixingOnly a few drug compounds can be tabletted without any excipients(Twitchell 2002) because of the compaction characteristics and amounts ofconstituents. Usually, the excipient forms the tablet structure together withan active pharmaceutical ingredient (API) (van Veen et al. 2005). The pur-

47
pose of the mixing unit operation is to prepare a homogeneous mixturewith a predefined error deviation because the perfect mixture is unattain-able, particularly when the mass of the lot and the density differences in-creases. The importance of blend homogeneity or uniformity is to assurethat the same amount of API is compressed into each tablet of the batch(Skibsted et al. 2006) and therefore it needs to receive special attention intablet manufacturing. If the mixing is not carried properly nor analyzed ac-curately (Muzzio et al. 2003) variation between API content of tablets mayincrease (Skibsted 2005) which may lead to batch rejection or the recall ofthe product (Muzzio et al. 1997; El-Hagrasy et al. 2001). However, the APIvariation within the tablets may also be due to blend segregation duringtablet compression, large size differences between components (Berntssonet al. 2000; Muzzio et al. 2002), lack of granulation step or even mix transferor storing between unit operations (Muzzio et al. 1997, 2002, 2003) and isnot necesseraly due to a badly performed mixing phase.
A classical way to blend a drug substance with excipient(s) is to mixthem in a blender for a pre-defined time. After a pre-determined mixingtime, the homogeneity of the mixture is tested invasively and if it is notmeeting the acceptance level with respect to API content, mixing is contin-ued for a pre-determined time. The common and acceptable way to controlthe homogeneity of a mixture is to take a few samples from the lot usinga sampling probe, then dissolve the mixture in to the buffer and estab-lish the API content with a UV-spectrometer (ultraviolet spectrometer) ora high-performance liquid chromatography (HPLC), off-line (Muzzio et al.1997, 2003). It has been known, already for years, that the analysing tech-niques are time-demanding and labour intensive (Lai et al. 2001; Skibstedet al. 2006; Wargo and Drennen 1996), produce limited number of samples(Muzzio et al. 2003; Skibsted et al. 2006) and do not take into account dif-ferences between individual processes nor mixture components (Skibstedet al. 2006) or the distribution of excipients (Reich 2005). Morever, exces-sive time of mixing can cause segregation between components e.g. dueto particle attrition and thus particle size and shape distribution and thiscan worsen the homogeneity (Wargo and Drennen 1996; El-Hagrasy et al.2001; Lee and Lin 2004; Skibsted et al. 2006; Skibsted 2005). In addition,the sampling procedure by a thief probe may face significant problems in

48
the sampling such as segregation and unrepresentative sample extraction(Muzzio et al. 1997, 2003; El-Hagrasy et al. 2001; Berntsson et al. 2002) andanalytical errors (Lai et al. 2001) let alone its relevance to future formula-tions (Paakkunainen et al. 2009). As an alternative to the classical way, areal-time or at-line measuring tool for detecting mixture homogeneity andmixing end-point that is in accordance with the PAT regulations and takesinto account representativeness of the samples should be preferable.
4.2.1 NIR as an X in mixing
Both qualitative and quantitative multivariate modelling approaches havebeen utilized for monitoring of blending process. NIR instruments arewidely used PAT tools here to measure the success of the mixing process(Wargo and Drennen 1996; Berntsson et al. 2002; Skibsted et al. 2006). Twoof the earliest implementations using NIR and multivariate data analysis toqualitatively monitor the pharmaceutical blending process were the studiesof Wargo and Drennen (1996) and Sekulic et al. (1998). Wargo and Drennen(1996) used a bootstrap technique for PC compressed NIR data to assessuniformity of the blend and to define the optimal mixing time, off-line. Themodels revealed that excessive time of mixing decreased the homogeneitywhich was later supported by subsequent researchers (El-Hagrasy et al.2001; Skibsted et al. 2006). Sekulic et al. (1998) applied a qualitative PCAand SIMCA model to on-line NIR data acquired from mixing and com-pared the results with other methods (spectral dissimilarities, mean stan-dard deviation and pre-processing options) in blend homogeneity determi-nations.The batches with different target homogeneity compositions wereseparated by the PCA model whereas the homogeneity of the batches witha similar target composition could be evaluated using the SIMCA modelconsisting of one class, i.e., a homogeneous blend.
Berntsson et al. (2002) applied NIR and PLS for in-line determinationof powder content of a powder mixture prone to segregation. The cali-bration model was constructed using the so-called mean-spectrum method(Berntsson et al. 2000) that enables one to construct a calibration model fordetermining the overall API content in binary powder mixtures using rela-tively few, but representative, randomly acquired, calibration samples. Thefirst loading of the PLS model corresponded to the difference spectrum ofpure mixture components revealing that PLS was able to capture variation
49
within the powder mixture. Rather similarly, Rantanen et al. (2005) utilizedPCA scores constructed from in-line NIR data of mixing corresponding tothree mixing components, API and excipients, for determining the mixingend-point. The levelling off of the root-mean-square values of three differ-ent scores during the course of time reflected the increased blend homo-geneity.
El-Hagrasy et al. (2001) performed preliminary SIMCA analysis for NIRspectra acquired from six different locations of the blender during mixing.There were four SIMCA classes; cluster A consisting of spectra at time pointzero, clusters B and C of spectra during premixing and cluster D of spec-tra at the homogeneous stage. The model provided for the test for homo-geneity of the sample, on-line. Furthermore, the study indicated that theend-point for mixing depended on the API concentration and individualbatch emphasizing the major benefits for real-time monitoring system ofmixing (El-Hagrasy et al. 2001). Subsequently El-Hagrasy et al. (2006a,b);El-Hagrasy and Drennen (2006c) studied systematically the effect of pro-cess variables on blending and spectral pre-processing on variability in thedata (El-Hagrasy et al. 2006a), developed qualitative SIMCA (El-Hagrasyet al. 2006b) and quantitative real-time models (El-Hagrasy and Drennen2006c) for blend homogeneity and end-point evaluation. The first studyshowed that 2nd derivative pretreatment applied from the NIR data frombatches with varying process conditions could minimize the batch-to-batchvariability (El-Hagrasy et al. 2006a) thus could benefit the global (robust)model to be constructed (El-Hagrasy et al. 2006b). The studies (El-Hagrasyet al. 2006a; El-Hagrasy and Drennen 2006c) highlighted the importance ofdeeper knowledge of the blending process, e.g., to be able to place the de-tector into a representative site or to construct reliable end-point control inorder to perform high quality batches.
Sulub et al. (2009) developed an off-line PLS calibration model to pre-dict the API concentration on-line in the course of the blending process.The end-point for blending was achieved when the desired API concentra-tion was steady as predicted by the model. When this model was utilizedfor separate powder mixtures it was possible to avoid the stopping of theblending process which has been the common approach in earlier applica-tions (El-Hagrasy et al. 2006a,b; El-Hagrasy and Drennen 2006c). Shi et al.

50
(2008) utilized the PLS model with NIR data for in-line detection of blend-ing end-point and also the batch-to-batch variability of the end-point. Inthe comparison with the traditional end-point detection method, the mov-ing window standard deviation (MVSD), PLS model was more robust onthe basis of variable process conditions.
However, even though NIR is a very useful PAT tool, probe contam-ination and locations may represent a problem. Thus, more research con-cerning other non-destructive measurement devices still needs to be carriedout. The fundamental problem with the measuring device is, however, thatthe same measurement tool is not relevant for all parameters since eitherthey do not detect the signal of certain substances at all or they also coulddestroy or damage the measurement target.
4.2.2 Raman as an X in mixing
Recently Raman spectroscopy with SIMCA classification was utilized forin-line and real-time mixing end-point monitoring (De Beer et al. 2008).The SIMCA model consisted of only one class, i.e. reference spectra ac-quired from the end of each blending when a homogeneous mixture wasprovided. The model was tested with the rest of the data that showed in-creasing homogeneity of the blend towards the end of the mixing process.Plotting the peak area of the Raman spectra with the highest variance in aunivariate way was not able to produce the same results.
4.2.3 Image analysis and chemometrics in mixing
Image analysis is an emerging technology for use in analyzing pharmaceu-tical unit operations since it provides both spatial and spectral data aboutthe object (Gowen et al. 2008). The image data set is considered as a hy-percube and most often, conventional chemometric methods such as PCAand PLS are utilized on unfolded data. Image analysis using multivariatemethods has been recently applied to characterize a small-scale blendingprocess (Ma and Anderson 2008). The score images performed by PCAprovided qualitative spatial information of the mixture constituents in theblend whereas the PLS-DA model obtained the concentration profiles ofAPI at different regions over the course of time. The model estimated thatAPI variability was highest at the edges of the blender thus suggesting thata single sensor NIR sampler should be located at the periphery in order to
51
detect the sampling end-point.
Advantages of multivariate methods in mixing
The advantage of previously introduced spectroscopic methods togetherwith multivariate data analysis over the traditional UV method is that inaddition to the API concentration determination they are also able to detectexcipient(s) concentration (Ma and Anderson 2008). This is a clear benefitsince traditionally the API concentration distribution in the mixer has beenconsidered (Sekulic et al. 1998) and if it is satisfactory the excipient con-centration is assumed to be satisfactory as well. However, this conclusionmight be misleading as claimed by Ma and Anderson (2008).
However, there are still issues that need to be resolved e.g. sampling,since for instance, the probe contamination of the NIR device has still notbeen solved, although new technologies to prevent the material sticking tothe probe have been published. In addition, issues concerning samplingneed to be taken into account since some PAT methods gather mixing in-formation from the same single location or from the edge/surface region ofthe process stream.
Despite many applications within powder mixing, issues concerning thetrue API distribution within the mixer are still unresolved (Muzzio et al.1997; Skibsted et al. 2006). The question remains how best to extract repre-sentative samples for homogeneity evalutions.
4.3 Wet granulationGranulation is an important unit operation in a pharmaceutical powder ag-glomeration process in the manufacture of for oral dosage forms withinthe pharmaceutical industry. The granulation is carried out to ensure pro-cessability (Alderborn and Wikberg 1996), i.e. the desirable properties ofthe drug-excipient mixture (Bin et al. 1985; Faure et al. 2001; Hemati et al.2003) to form a homogeneous material (Lee and Lin 2004) with suitablecompaction properties since it prevents segregation of the powder mixtureand powder sticking to the punches of the tablet compressor. Generallythis is the desired way that has been chosen by pharmaceutical companies,though, for those companies that manufacture generic drug products, thegranulation unit operation is not desirable (McCormick April 2005).
In wet granulation, granules are typically manufactured in two different
52
types of wet-agitation equipment, i.e. a high shear mixer or a fluidized bedgranulator (Alderborn and Wikberg 1996; Frake et al. 1997; Faure et al.2001). In fluidized bed granulation, the wetting and drying phase takeplace in the same process equipment (Gao et al. 2002) whereas in highshear granulation, the wetting phase is carried out in a different appara-tus from the drying of granular mass. Despite the transfer of granulationmass into different process phases, high shear granulation is a widely usedmethod in the pharmaceutical industry because of its efficiency in obtain-ing dense granules with low porosity (Faure et al. 2001; Gao et al. 2002;Fung et al. 2006). On the contrary, fluidized bed granulation, due to itsmore complicated nature of monitoring and understanding of the processis a better option when one wishes narrow granule size distribution, i.e. ho-mogeneous granules (Hemati et al. 2003). However, fluidized bed methodsare prone to suffer de-fluidization, resulting in undesired oversize granulescalled clumps.
Fluidized bed granulation, as well as high shear, is a complex and dy-namic particle size enlargement process consisting of several overlappingphases, i.e., mixing, granulation and drying (Faure et al. 2001; Hemati et al.2003). Granulation consists of three overlapping sub-processes (1) wettingand nucleation taking place due to a binder solution, (2) granule growthby collisions, and (3) attrition and breakage upon impact (Iveson et al.2001). The outcome of the granulation conducted in a fluidized bed de-pends on many inter-related processes and product related variables (Funget al. 2006), such as inlet air humidity and temperature, spray rate of liquidbinder and binder viscosity, processing conditions and, in particular, thevariability of the size distribution of the starting materials. The variablesare competitive, as well as granulation growth and breakage at some point(Knight 2004), thus they are difficult to stabilize and their net effects de-termines the final result (Zhang et al. 2002; Hemati et al. 2003; Thielmannet al. 2008). In addition, the fact that the granulation process is mainly car-ried out in a batch mode, leads to the possibility of batch-to-batch variation(Leuenberger 2001a,b; Vervaet and Remon 2005). Thus, there is increasinginterest towards a continuous type of manufacturing.
Granulation is one of the most poorly understood unit operations dueto the uncontrollable sub-phases during wetting, measurements of process

53
0 5 100
2
4
6
8
x1
Sample0 5 10
0
2
4
6
8
10
x2
Sample0 2 4 6 8
0
2
4
6
8
10
x1
x 2
Figure 4.1: Example of univariate control. In the left and middle plots vari-ables x1 and x2 are measured during the course of processing time and con-trolled separately. The blue lateral lines depict fixed control limits withinthe process which is anticipated to be under control. In the plot on theright-hand side, the variables are plotted with respect to each other. Thus,by plotting two variables simultaneously, one can see that sample no. 4(black dot) differs in its correaltion structure from the rest of the samples(red dots).
parameters that do not provide information, or if they do provide infor-mation, it tends to be indirect about quality attributes, such as particle size(Halstensen et al. 2006). Moreover, the conventional manufacturing detec-tion is univariate detection.
The univariate detection of granulation performance consists of the pro-cess signature of individual standard process variables that are experimen-tally known to affect product quality based on the experience of the oper-ator. For example, time, temperature, impeller speed and pressure mea-surements are these kinds of variables. It should be noted that today’s bestpractice for controlling high-shear granulation in pharmaceutical industryis the univariate detection of power consumption (Luukkonen et al. 2008),while the success of fluidized bed granulation is monitored using the tem-perature difference of in- and outlet or mass temperature (Rantanen et al.2001). However, the separate detection of variables misses the correlationstructure present in the whole process data which is known to be very crit-ical to be captured by the process modelling (Kourti 2006) (Fig. 4.1). Thus,multivariate process monitoring could well be incorporated in granulation,but until recently, it has not been widely employed.
Next, typical quality attributes, interests and barriers that are confrontedare reviewed, especially in areas where chemometrics has been utilized.

54
4.3.1 Granules characterization; size, distribution andmoisture content
The main characteristics to be followed during granulation are the gran-ule size and granule size distribution since they have a major impact ontableting, tablet properties and thus on dissolution (Fung et al. 2006). Forinstance, if there is a too wide particle size distribution, this may promotesegregation and thus heterogeneous tablets, since smaller granules are an-ticipated to contain a smaller amount of active ingredient with relation tobigger granules (van den Dries and Vromans 2002). Usually, the desiredgranule properties are attained by following a few process parameters sep-arately or processing time and finally the end product is tested and evalu-ated. The moisture content of granules is determined mainly by Karl Fis-cher titration (KF) or weight loss on drying (LOD) whereas size analysis iscarried out by sieving or laser diffractometry. Occasionally, a batch mayfail but reasons for this often remains obscure. Thus this univariate processevaluation is not the best option since it lacks both process control and un-derstanding. If one could achieve proper process control, the batch failurescould be detected earlier and also corrective actions can be initiated. Next,some examples of multivariate applications will be reviewed to providedeeper insight into the granulation process.
4.3.2 NIR as an X in granulationHigh-shear granulation
NIR spectroscopy together with multivariate data analysis have been ap-plied to some extent to monitor wet granulation performance and outcome.The main reason to justify the use of NIR in wet granulation is its sensitiv-ity towards the water environment (Rantanen et al. 2001) and its ability todetect physical characteristics such as particle size (Rantanen et al. 2005).Self-organizing maps (SOM) have been employed for visualization of thephases of high shear wet granulation processes exploiting both process pa-rameters and NIR data and assess variables input of phases (Rantanen et al.2001; Jørgensen et al. 2004). Rantanen et al. (2005) utilized in-line monitor-ing by PLS for end-point determination by means of particle size. Sincegranule size during wet mass processing is greatly affected by water whichis incorporated into NIR signal as well as particle size, orthogonal signal

55
correction (OSC) (Wold et al. 1998) prior to PLS was applied in order toremove the variation due to the presence of water. The end-point of gran-ulation predicted using OSC-PLS method was comparable to the off-linemeasurement of the final granule size.
Fluidized bed granulation
In-line measurements of granule moisture content have been conductedin a of fluidized bed system by Rantanen et al. (2001). The acquired NIRdata were subjected to PLS and back-propagation neural network analysis.The variable x vector for sampling points during twelve granulated batchruns consisted of two NIR water absorbing wavelengths and sixteen pro-cess variables (e.g. temperature, humidity) with three of them indicatingmixing, wetting and drying phases of granulation. The reference moisturecontent of samples was determined using an infrared dryer and sampledby a thief probe. Liquid addition was seen as a baseline increment in theraw NIR spectra. Although the neural network did provide better regres-sion ability than PLS, with the latter technique the correlation between xvariables in different phases could be inspected.
Multivariate statistical process control
Skibsted et al. (2007) successfully developed an early warning system withmultivariate statistical process control (MSPC) charts using PCA and D andSPE (standard error of prediction) statistics. This process is illustrated inFig. 4.2. Two models were constructed; the first model with NIR1 data ac-quired after the initial mixing of raw materials and the second model withNIR2 obtained in the postgranulation step. Calibration data consisted ofbatches run in normal operating conditions (NOC) whereas test batcheshad quality defects, except for one NOC batch. From these two models,only the second one could separate bad batches with too much fines ortoo many coarse particles, from the good batches. The work demonstrateshow the MSPC model benefits the user by omitting the traditional time-and resource-consuming particle size analysis relying on laser diffractom-etry (Skibsted 2005) conducted on only two unit operation steps later byassessing earlier batch quality of the intermediate material.
Even though NIR suffers from probe or window contamination whenutilized as an in-line tool, the building of a special probe port and probe

56
-wei -mix1
NIR1
-gra
NIR2
� ��-S dry
NIR3
- � ��-S mix2 -
NIR4
tab -
NIR5
Figure 4.2: The unit operations with NIR measurements (NIR1,...,5), inwhich NIR3 is acquired on-line while the other measurement were donelater. Wei refers to weighing of mixture components, mix1,2 to the first andsecond mixing, respectively, gra referes to granulation, S to sieving, dry todrying phase and tab to tableting.
system (PATandbeyond), cuvette or off-line analysis may solve this prob-lem.
4.3.3 Image analysis in granulation
A few applications have been described of image analysis for in-line andoff-line granule size and distribution analysis (Watano and Miyanami 1995;Watano 2001; Laitinen et al. 2002, 2004). There is, though, only the studiesof Laitinen et al. (2002, 2004) where multivariate data analysis has been ex-ploited. SOM was utilized for the visualization of granule size distributionprocessed by a fluidized bed using off-line image data, which included fivedifferent shape and size parameters (Laitinen et al. 2004). In the first ofthese studies (Laitinen et al. 2002) a PLS model was created between par-ticle size distribution data measured by sieving (Y) and grey scale images(X) from off-line samples. Images were assembled by illuminating sam-ples from two opposite directions and calculating the difference matrix on apixel-by-pixel basis and subsequently the pixel value distribution was plot-ted and found to correspond to the particle size distribution as determinedby sieving. The image analysis took 3 minutes whereas sieving required120 min, highlighting the time-saving benefits of the PLS model.
It should be noted that the image analysis during granulation suffers

57
from window contamination if the wet powder sticks to the window andthis can interfere with real-time measurements.
4.3.4 Acoustic emission
Acoustic emission (AE) is an elastic sound wave formed during granula-tion due to particle impact on granulator wall and other particles. Acousticsound waves are not detectable by the human ear, but are detected by aby piezoelectric transducer. There are two kinds of acoustic emission mea-suring modes; active and passive (Whitaker et al. 2000). In active acousticemission, the acoustic wave is transmitted into a sample system whereas inpassive acoustics, acoustic signals produced intrinsically by the process aredetected. Above the frequency range of 100 kHz, the AE signal attenuatesrapidly in the air but propagates in solid material (Tsujimoto et al. 2000)thus it is feasible to place a detector on the wall outside of the granulatorand gather signals from the process. Thus, acoustic emission is a totallynon-invasive method, and does not require any windows or orifices sincethe piezoelectric sensor can be attached to the outer surface of the granula-tor chamber. AE appears to be very feasible for measuring particle proper-ties as well as granulation process if supplemented with multivariate dataanalysis (Halstensen et al. 2006).
The first implementation utilizing multivariate data analysis for acous-tic emission data from pharmaceutical granulation was carried out byWhitaker et al. (2000), where PLS was used to predict granule size. Mea-surements from the end of the process were used in the calibration. Anadequate correlation between AE and granule median size was revealed.However, there were some problems of reliability of reference particle sizesversus prevailing acoustic emission signal, though this may have been dueto since sieving of granules during the post-process analysis which mayhave affected the granule size.
Recently, an acoustic emission method has been exploited to character-ize the mean granule size in a high-shear wet granulator (Papp et al. 2008)with a granulation end-point (Hansuld et al. 2009). Hansuld et al. (2009)utilized the PLS-DA method only to select the frequency regions that cor-responded to manually determined wetting, end-point and over-wettingzones. These regions were subsequently transformed into a power spec-trum and used for univariate detection of end-point. On the contrary, Papp

58
et al. (2008) subjected AE data from different batches to PCA and PLS anal-yses. Granule end product moisture content and particle median size andsize distribution were predicted. However, the interpretation of AE signalseven if combined with multivariate data analysis, can be very complicated.
4.3.5 End-point detection
The main goal to monitor granulation is to define the process end-pointsince overwet granules, too wide size distribution, and too fragile or finegranules are undesired. The granulation end-point has been assessed con-ventionally by using either a fixed time (Jørgensen et al. 2004) or theamount of granulation liquid, that is required to achieve the desired out-put. The drying end-point may also be controlled using a thermometeror measured at a fixed time. However, if one uses a fixed time one doesnot obtain thorough process control or any understanding of the process,i.e. real-time control would be an advantage. Examples of some feasi-ble tools have been reviewed in this chapter. However, Leuenberger et al.(2009) very recently questioned the end-point seeking by emphasizing thatno global end-point exists and end-point of granulation is formulation de-pendent and case-specific.
4.4 Tablet compressionTablets are compressed from the powder mixture (or granules, alterna-tively) using either a single-punch or rotary compression (Alderborn 2002).Compression consist of different phases, i.e. die filling by the powder, tabletformation and tablet ejection, i.e. removal of the tablet from the die. Intableting, attractions due to interparticle bonding, such as hydrogen bondsare formed and depending on the material properties, fragmentation, elas-tic or plastic deformation may take place. Most typically there are addi-tives in the formulation e.g. excipient(s), lubricant, disintegrant, binder andfiller. The excipients greatly affect tablet matrix formation by maintainingits intact shape whereas disintegrants promote drug release after adminis-tration. The function of a lubricant (magnesium stearate is mainly used) isto prevent the tablet from sticking to the punches after compression and toimprove the flowability of the blend (Zuurman et al. 1999). The filler isused to increase tablet mass and thus volume.
Typical problems that affect tablet quality are weight variation between
59
tablets e.g. due to poor flowability of powders (Huang et al. 2009) anduneven filling of dies (Paakkunainen et al. 2009), and the tablet sticking tothe die wall in the ejection phase which can affect the texture and compo-sition. During die filling, segregation between larger and smaller particlesmay occur causing uneven distribution of mixture component in the tablet.
In general and according to the above literature survey the very few ofthese processes in tablet compression phase cannot be handled by chemo-metrics. However, compression profile and tableting is usually based onpre-formulation stage trials or more sophisticated and planned experi-ments. Nonetheless, the output of the tablet compression unit operation,i.e. tablets, can be characterized with the aid of chemometrics as will bedescribes in the next chapter.

60

61
5 PAT APPLICATIONS ON UNCOATEDTABLET QUALITY TESTING
The prepared tablet must be functional, safe for administration, contain pre-defined amounts of ingredients and has to remain intact in every processphase of its lifetime; during packing, storage and transport. The commonways to test the (uncoated) tablet quality according to pharmacopoeia are,time demanding and destructive i.e. dissolution tests, mechanical testing,API content determination, and dimension and weight testing. With thepresent methods, only 30 out of 4 000 000 tablets, i.e. less than 0.00075%are analyzed (Cournoyer et al. 2008). The desirable tests need to be rapidand accurate (Damiani et al. 2005), repeatable and robust and thus alterna-tive methods would be welcome. These methods would utilize correlationbetween quality attributes, non-destructive measurements (such as spec-troscopic techniques), the end product and raw or intermediate materials(e.g. granules). In the optimal situation when PAT with QbD and RTR isapplied, the destructive testing could be totally avoided. All these tests arespecifically described in the European and United States Pharmacopoeias.
5.1 API concentration and content uniformityThe content uniformity refers to the API (active pharmaceutical ingredi-ent, drug substance) content in the tablet and how much the content variesbetween tablets. API content in tablets is one of the most critical qualityparameters (Skibsted et al. 2007) since it greatly affects drug release andpotency of a medication (Cournoyer et al. 2008). In particular, the detectionof a potent API at very low concentrations, i.e. a dose of a few milligrams oreven less (Lewis et al. 2005) is a very critical task to ensure that the manu-facturer maintains quality (Gowen et al. 2008). The acceptance limit for thedrug content in the individual dose must normally fall within ±5%, how-

62
ever, these limits are dependent on the formulation and can be found caseby case in the European Pharmacopoeia. Heterogeneity of API in a tabletis also an important quality issue since it affects the tablet’s properties, e.g.dissolution (Roggo et al. 2005; Gendrin et al. 2008) and thus its quality.
The conventional way to test the content uniformity within a batch isto take a small random portion of tablets (e.g. 10 units) from the produc-tion line, for instance from the start, middle and end of the process (Ravnet al. 2008) and these are typically analyzed by HPLC in a separate lab-oratory (Skibsted et al. 2007; Sulub et al. 2008). This is destructive andtime-consuming, and in addition, the tablet batch cannot proceed to furthertreatment, such as coating or packaging, before the tests are finished (Skib-sted 2005; Skibsted et al. 2007), which can sometimes take days, even weeks(Sulub et al. 2008). It is noted that also the excipient(s) concentration withinthe tablet formulation has to be taken into account since the complete char-acterization of formulation cannot be fulfilled by detecting API concentra-tion only (Wu et al. 2008). This situation could be made less cumbersome ifspectroscopic data could be acquired and analyzed with multivariate dataanalysis (Cournoyer et al. 2008).
5.1.1 NIR as an X matrix in API testing
Reliable non-destructive tests need to be developed for API content deter-mination for final tablets. Models and methods need to be validated, sothat they are sufficiently robust for use on a daily basis, repeatable, inde-pendent of the analyst and provide accurate results (Tabasi et al. 2008).NIR with PCA, MLR (multiple linear regression) and PLS have been uti-lized to assess the API content in direct compressed (Tabasi et al. 2008) andwet-granulated tablets (Skibsted et al. 2007) and tablets consisting of APIpellets (Gottfries et al. 1996). Tabasi et al. (2008) implemented a PLS modelbetween NIR and API content and the method was statistically evaluated asbeing able to provide as accurate predictions as the UV method, i.e. within±5%. acceptance limit. Gottfries et al. (1996) were able to construct a PLSmodel utilizing NIR transmission data that predicted the API concentrationwithin tablets. The PLS model was able to capture variation of water con-tent and thickness of the tablets and performed accurate predictions with aprediction error of ±2% in relation to the average API content in samples.Blanco et al. (2006) developed a PLS model with laboratory-made samples

63
to predict the API content of commercial tablets. The prerequisite for agood model is that both the calibration and test sets must span the same la-tent variable space. Thus, the preparation conditions for laboratory-madesamples mimicked production conditions, i.e. samples were prepared un-der similar tablet compression forces (Blanco and Alcala 2006; Blanco et al.2006). The models of the first study were calibrated using laboratory-madepowder and tablet samples and tablets from production with good mod-elling ability (Blanco and Alcala 2006). The second model consisted onlyof laboratory made tablets in which there was extensive variation both inAPI content and compression force and the technique succeeded in predict-ing API with an accuracy of ±5% compared to results of HPLC referenceanalysis.
Skibsted et al. (2007) predicted API content (for wet-granulated tablets)utilizing PLS model and transmission NIR spectra from the wet-granulatedtablets. The model enabled the real time release (RTR) of the tablet prod-uct. The PCA model they applied was able to differentiate tablets with dif-ferent API contents. Moreover, the model showed also the differentiationbetween the size of the batch from which the tablets had been processedand it could identify the method that had been used. This finding indicatesthat the scale of the production adds a variation source on the batches. Sar-raguca and Lopes (2009) studied the feasibility to predict API and excipientcontent in powder and tablet samples manufactured on a pilot-scale utiliz-ing the PLS1 models with NIR in a lab-scale manufactured powder. Thestudy showed that the physical differences between samples, i.e. particlesize, manufactured in different sites which is present in the NIR data couldbe minimized with pre-processing. Thus, using a calibration model withlab-scale samples including intentional variations in the constituents couldbe utilized for testing production scale samples which do not provide suf-ficient variation in order to perform a robust model (Cogdill et al. 2005;Sarraguca and Lopes 2009).
NIR and multivariate calibration methods have been applied for detec-tion of tablets with low API content (Chalus et al. 2005; Alcala et al. 2008).The study of Chalus et al. (2005) was conducted with 9 to 12 PLS compo-nents which were determined as a minimum of SECV (standard error orcross-validation) curve. The authors tested the model and claimed that it
64
was accurate and repeatable and could be used as an alternative method totraditional testing. Alcala et al. (2008) emphasized the importance of cali-bration samples and proposed a method to select concentration ranges formodel calibration and implemented a multivariate detection and quantifi-cation limits (MDL, MQL) for models. According to the MQL results, thereduction of the upper concentration level in calibration enabled a more ac-curate prediction for low API contents. The artificial neural network (ANN)model was developed to predict API. The model performance was evalu-ated as being better than PLS at predicting the content of tablets with lowAPI content whereas an API content equal or more than 5% was more ac-curately predicted by PLS (Chen et al. 2001). Certain wavelengths of NIRwere emphasized in ANN and they were found to correspond to the chem-ical groups presented in API.
The PLS1 models have been constructed to analyze multiple compo-nents in tablets with two API and three excipients (Cournoyer et al. 2008).In this study, however, DoE was applied in order to attain calibration sam-ples with none or minimal correlation between the constituents, since ac-cording to the authors, a low correlation of constituents is needed in orderto achieve a good PLS model.
Sulub et al. (2008) mimicked PLS calibration transfer between develop-ment and production sites using a primary NIR spectrometry and four sec-ondary devices two of them being situated kilometres apart. The studyshowed the feasibility of developing a transfer matrix between a localmodel of primary instrument and others in order to minimize the responsevariation and to estimate the content uniformity accurately regardless ofwhat kind of spectrometry was used. The purpose of transfer matrices isto convert spectra acquired with other instruments into the same spectralspace attained from the primary instrument.
5.1.2 Raman as an X matrix in API testing
Johansson et al. (2005) utilized PLS for predictions of both API and excipientconcentrations from Raman data. The study also examined sub-samplingissues concerning effective sampling size, i.e, 0.4, 8, 16 and 39% of thearea of the tablet surface were illuminated with different patterns (point,small and large circle and round area pattern, respectively) and comparedin terms of accuracy and repeatability. PLS performed the most accurate

65
predictions with RMSEP of 1.7% compared to univariate techniques; fur-thermore round area (39%) as well as a large circle (16%) were found to bethe most representative sampling areas.
5.1.3 Terahertz as an X matrix in API testing
More recently Terahertz spectroscopy with multivariate data analysis hasbeen also evaluated for detecting the API concentration as well as theamounts of excipients in direct compressed and wet granulated tablets (Wuet al. 2008). The feasibility study illustrated the superiority of multivariatemethods (PLS 1, PCR) over the univariate techniques (i.e. characteristicpeak maxima and superimposition method) to estimate different formula-tion constituents, except for magnesium stearate that is a very low fractionof the tablet. However, the method as such requires sample preparation andthus, cannot be considered as a non-invasive PAT method, instead it maybe used as a supplemental or compensatory method in the wet chemistry.
5.1.4 Chemical imaging and multivariate applications inAPI testing
NIR, Raman and FTIR chemical imaging (CI) analysis in conjunction withchemometrics have been utilized for the detection of API as well as excip-ient concentrations in tablets (Clarke 2004; Zhang et al. 2005; Chan et al.2005; Gendrin et al. 2007; Ravn et al. 2008; Amigo and Ravn 2009; Vajnaet al. 2010). Chemical imaging of the system allows detection of the spa-tial distribution of different chemical constituents even if they are presentat very low concentrations (Gowen et al. 2008; Sasic 2007). One of the ear-liest study with multivariate analysis applied on hyper-spectral images inthe field of pharmaceutical tablet was conducted by Clarke (2004). Clarke(2004) applied PCA and PLS for images and evaluated process behaviorand cluster sizes of constituents from score images constructed using PCAand PLS. Comparisons between different chemometrics methods for hyper-spectral imaging of tablets have been conducted (Gendrin et al. 2007; Ravnet al. 2008; Amigo and Ravn 2009). Gendrin et al. (2007) studied the util-ity of hyperspectral imaging with PLS2 and CLS (classical least squares,amodel construction described in the publication of de Juan et al. (2004)) toquantify API and other tablet constituents by averaging the predictions ofeach pixel. Both methods, with and without model calibration, provided

66
accurate API predictions, however, PLS2 was the only method to provideaccurate results about all constituents. Ravn et al. (2008) evaluated PLS1,CLS and univariate wavenumber regression to predict the overall concen-trations and distribution of three major tableting constituents out of five,i.e. two excipients and API. PLS1 provided the most accurate predictionsalthough all methods were suitable for handling the hyper-spectral images.One drawback of the PLS method is that it requires a calibration set which isnot always available (Zhang et al. 2005; Gendrin et al. 2007; Ravn et al. 2008;Amigo and Ravn 2009). Amigo and Ravn (2009) employed CLS, MCR (mul-tivariate curve resolution) and augmented MCR with NIR-CI to predict allfive tablet constituents without a calibration step and also to evaluate sam-ple homogeneity. CLS and MCR performed well but failed to predict thecomponents at the smallest nominal concentrations due to a lack of selec-tivity, i.e. pure spectra were highly correlated and formed a non-full rank.The augmented version of MCR, where the full-rank or standard image hadbeen added to the analysis, achieved good predictions for all componentsand depiction of spatial distribution over the pixels.
In the study of de Juan et al. (2004) Raman images of tablets with 0, 20,40, 60 and 80% of API were analyzed using Fixed Size Moving Window-Evolving Factor Analysis (FSMW-EFA). The method provided local rankmaps which could detect small regions (2 x 2 pixels) of heterogeneity, i.e.heterogeneity between pixel-to-pixel. The rank one regions were eitherconstructed with one chemical constituents or had a constant composition.Zhang et al. (2005) applied Raman image mapping to tablets and evaluatedclustering, CLS, PCA and MCR methods in terms of data processing. Allmethods provided fairly comparable images with respect to the three mainconstituents, however, CLS was considered as being the most reliable sinceit was the only method based on a priori information, i.e. pure spectra. Sa-sic (2007) applied Raman mapping for commercial tablets having low APIconcentrations (0.5 mg and 1.0 mg of API). Raman signals were pre-treatedwith PCA filtering since API could not be detected using raw data. Thestudy highlighted the feasibility of quantifying the API content from bina-rized Raman score imaging. However, care must be taken to set thresh-old limits in the binarization. Vajna et al. (2010) applied Raman imagingfor tablets that were either direct compressed, high shear or fluidized bed

67
granulated and compared manufacturing methods according to the CLSprocessed score images. The study showed that API was distributed spa-tially differently in the tablet, depending on the manufacturing method.
FTIR-imaging feasibility study of Chan et al. (2005) acquired spectrafrom three miniature size of tablets (weighing ca. 10 mg) compacted in aspecial device with the ATR diamond being (at) the bottom of the die, insitu. CLS was exploited to resolve the data cube into spectral and concen-tration loadings corresponding to components (API and excipient). in thisway, the component concentrations and spatial distribution could be estab-lished.
5.1.5 Multi-way applications in API testing
In addition to two-way methods, three-way calibration for API contentfrom NIR (Alcala et al. 2009) and fluorescence excitation-emission matrix(EEM) (da Silva et al. 2002) data have been utilized, the latter being ap-plied in the evaluation of a tablet solution. Alcala et al. (2009) decomposeda three-way PARAFAC model with the first mode having tablets of differ-ent API concentration, the second mode of NIR spectra and the third modeof different compression force levels. The loadings of the first mode werecorrelated with known nominal API concentrations within the tablets. ThePARAFAC model performed better compared to the unfolded PLS modelwhich was not capable of predicting API concentration of tablets com-pressed at different forces since compression force and concentration vari-ation are known to affect the NIR signal (Blanco and Alcala 2006; Blancoet al. 2006; Alcala et al. 2009) and this was not captured by bilinear model.On the contrary, PARAFAC decomposed the physical (compression force)and chemical (API) information from NIR spectra with different modes ina meaningful way.
5.2 Dissolution testsThe in vitro dissolution testing is the standard and the primary methodused to ensure functionality and similarity of tablets in a batch and betweenbatches. In this test, the concentration of the drug is detected as a functionof time in the liquid dissolution medium (Ferraro et al. 2003; Costa et al.2003; Adams et al. 2001). The amount of dissolved API is detected using aUV spectrophotometer or HPLC but the UV method may suffer from prob-

68
lems with detection, due to the non-selective nature of detection (Wibergand Hultin 2006; Gray et al. 2009). However, applications have been pro-posed to detect dissolution characteristics of two or three API componentmixture of tablets with PLS1 utilizing a range of UV-vis spectra with over-lapping peaks instead of one characteristic wavelength (Ferraro et al. 2003;Dinc et al. 2003; Markopoulou et al. 2005).
Two widely utilized methods approved by the authorities are availablefor dissolution testing; 1) the tablet is either set in a metal grid, e.g. a bas-ket which is rotating (USP 1) or 2) the tablet is placed atthe bottom of thedissolution vessel with the paddle rotating at the top of the vessel (USP2). The tablet dissolution test is one of the most important in vitro tests fordrug bioavailability (Dokoumetzidis and Macheras 2006). However, thedissolution methodology is a very simplified environment compared to thehuman gastrointestinal tract and thus its relevance for extrapolating to thein vivo situation can be questioned (Dokoumetzidis and Macheras 2006;Gray et al. 2009). The tests provide, however, information about the dis-solution mechanism, batch-to-batch consistency, critical process variablesand the reproducibility of drug release for formulation development; theseare important parameters for assessing tablet quality both immediately af-ter manufacturing and during its shelf life (Graffner 2006; Gray et al. 2009).However, these kinds of tests are time-consuming, destructive and prone tointerference and measurement variation (Gray 2006) thus there is a need foran alternative method. In addition, discussion about dissolution methodol-ogy inconsistencies such as between USP 1 & 2 and hydrodynamics (Baxteret al. 2005; Pajander et al. 2008), and sampling issues (Baxter et al. 2005;Paakkunainen et al. 2009) that give rise to variability in the test results,have been highlighted recently (Gray et al. 2009). If reliable predictionsof dissolution behavior can be performed e.g. by monitoring and testingcritical quality attributes within a design space, the dissolution test may bereplaced by real time release (RTR) (Tong et al. 2007).
Next, novel methods based on chemometrics for dissolution tests willbe reviewed.
5.2.1 Prediction of dissolution profiles
Non-destructive methods, e.g. NIR, are predicted to replace destructive dis-solution test (Gray August 2004) mainly in conjunction with the PLS anal-

69
ysis and there are indeed many NIR applications being utilized to assessdissolution behavior (Donoso and Ghaly 2004; Freitas et al. 2005; Tatavartiet al. 2005; Blanco et al. 2006; Otsuka et al. 2007). Bi-linear methods aremainly utilized in the data analysis.
Freitas et al. (2005) acquired spectra from tablets with varying excipientconcentrations with the diffuse reflectance mode of NIR and establishedthe PLS model with the Y matrix consisting of percentages of dissolvedAPI as a function of time. The model was calibrated with 30 samples (threetablets per batch, with the samples being dissolved at three different pHvalues) resulting in a 10 component model and validated using LOO cross-validation (internal validation) and external validation by leaving one batchout of the modelling. The conclusions were that NIR and multivariate dataanalysis provided adequate alternatives to conventional dissolution test-ing. Tatavarti et al. (2005) made similar conclusions when they predictedQ60 and Q120 (the percentage of dissolved API at times 60 and 120 minutes,respectively) using NIR and PLS. Blanco et al. (2006) utilized the PLS cali-bration model for determining API dissolution profiles using NIR data ac-quired in the reflectance mode from intact laboratory-made tablets with dif-ferent porosities. The Y matrix consisted of the percent of API dissolved atthe 30 min time point. The model was tested using commercially producedtablets where reference analysis and PLS estimation provided comparableresults. Since the good quality of the conventional immediate release tabletsrequires that 80% of API is dissolved by a time of 30 min, a PLS-DA modelwas constructed to predict if tablets would meet this specification. It wasfound that all production tablets did meet this specification. Otsuka et al.(2007) applied a PCR model on NIR data on tablets with different porositieswith Y matrix of time required for 75% dissolution (T75) and mean dissolu-tion time (MDT). In order to perform a good model the X matrix needed toinclude information related to dissolution behavior. The loadings seemedto capture and were related to porosity and pore volume variation whichhave a major impact on API dissolution.
NIR has certainly rich with chemical and physical contents. It containsinformation about tablet porosity which has a major impact on drug disso-lution (Donoso and Ghaly 2004). However, NIR acquired from intact tabletdoes not contain interaction terms between the chemical constituents such
70
as API-excipient, solvent-API, excipient-excipient interactions which havealso major effects on in vitro drug release (van Veen et al. 2005; Pajanderet al. 2009). In particular this is important if drug release of several differ-ent APIs is being evaluated. In the study of Korhonen et al. (2005), molec-ular descriptors were used to characterize the molecular level interactionsoccurring during drug dissolution in conjunction with process parameters.PLS was utilized to predict dissolution for multiple different drug formu-lations and to explain cause and causality relationships. Recently, Huanget al. (2009) utilized all processing and material parameters of 13 differentDoE batches to develop a dissolution model using PLS in order to assessthe most important parameters related to dissolution. The process param-eters of granulation and compaction unit operations were used as well asmaterial attributes from intermediate phases. The variables from differentphases were assessed as being the most important, such as particle size, wetmassing time and amount of water and compaction force.
Multi-way methods, namely PARAFAC, have been applied for decom-position of dissolution rate profiles of several experiments for tablets en-closed in hard gelatin capsules with two API concentrations (Wiberg andHultin 2006). The first mode of the three-way array was the samples, thesecond was the UV spectra and the third dissolution time. The presenceof gelatin capsule interfered the API UV-vis spectrum which, however, didnot interfere PARAFAC analysis that could estimate well both the releaseprofiles of API and excipient, their respective pure spectra and concentra-tions. However, Rajko et al. (2009) questioned the use of PARAFAC foranalyzing dissolution data since rate profiles of constituents change fromsample to sample and thus do not fulfil the required trilinearity conditionof PARAFAC.
5.2.2 Comparison of dissolution profiles
After dissolution profile determination or prediction, the profile similar-ity needs to be specified in the terms of quality control. A similar disso-lution profile compared to the reference sample is one quality indicatorto demonstrate that the batch is acceptable and to monitor batch-to-batchconsistency. The release profile comparison is traditionally obtained usingmethods such as ratio tests, difference ( f1) and similarity factors ( f2) tests,statistical (nonlinear) mixed effect models or one-way or multivariate anal-

71
ysis of variance (ANOVA and MANOVA, respectively) (Costa et al. 2001;Graffner 2006). FDA (U.S. Food and Drug Administration) and EMEA (Eu-ropean Medicines Agency) have approved the pair-wise similarity tests ( f1,f2) for comparison of dissolution profiles, preferably f2 (O’Hara et al. 1998),as is described in Eq. 5.1 (Costa et al. 2001).
f2 = 50×
[
1 +
(1n
n
∑j=1
|Rj − Tj|2)]−0.5
(5.1)
where Tj and Rj are the percent dissolved in each sampling point n oftest and reference product, respectively and n represent the time points ofdissolution profiles. According to the FDA, if f2 is between 50 and 100, thedissolution profiles are considered as being similar. However, the similar-ity test based on f2 has faced some criticism concerning its scientific basis(Costa et al. 2001). For instance, it does not take into account either theshape of the dissolution profiles (Costa et al. 2001; Adams et al. 2001), orany variability and correlation structure (O’Hara et al. 1998; Adams et al.2001) and thus can lead false conclusions about similarity.
Adams et al. (2001) proposed an alternative method using PCA for de-termining similarity between the dissolution profiles of test and referencetablets. The PC based similarity model was able to detect both similar pro-files and the outlying observations. The outlying dissolution profiles dif-fered either along the first (PC 1) or second (PC 2) axes corresponding to thelevel and shape of the dissolution profiles, respectively. Subsequently Mag-gio et al. (2008) utilized a similar modelling approach to compare dissolu-tion profiles of tablets with the same API formulation but different brands.Hotelling’ s T2 statistics provided an arbitrary similarity limit of 80% forcomparison of dissolution. Profiles inside the 80% confidence interval cor-responded to batches of similar qualities.
Roggo et al. (2005) constructed a PCA model that could differentiatebetween tablets with bad and good dissolution behaviors thus enablingthe detection of samples out of specification. The parameters used in themodel were first derivative spectra of transmittance NIR of tablets. Tabletswith bad dissolution properties had a longer melt granulation time andan increased compaction force had been used and in that way, they dis-played decreased API particle size as well as slower dissolution. Recently,

72
Paakkunainen et al. (2009) showed that a careful optimization strategy ofthe whole tableting process could prevent tablet-to-tablet variation in dis-solution properties.
5.3 Mechanical testing; crushing strength testsand disintegration
Tablets need to stand the stress of packaging, transfer and storage (Alder-born 2002). In order to test this property so-called friability and crushingor mechanical strength tests need to be carried out according to USP guide-lines. These tests provide physical information of tablets by mimicking theconditions to which tablets may be subjected during down stream process-ing (friability test) and how the tablet can resist the mechanical forces towhich it will be subjected (crushing strength). The friability test is con-ducted by either shaking or rotating the tablet for a predetermined timeand subsequent measuring the weight loss after the test. Crushing strengthtesting is carried out by compressing intact tablet with punches at a certainforce either in the lateral or vertical directions until the tablet break. Thesetests destroy the tablet totally and therefore, they are not suitable tests forlarge number of samples (Lewis et al. 2005). Moreover, concerns have beenraised about the accurate representation of a batch being evaluated and op-erator errors can occur (Morisseau and Rhodes 1997; Kirsch and Drennen1999). It should be noted, that tablet compression force is generally directlylinked to hardness and strength, however, the applicability is always casedependent.
Several studies have established the relationship between NIR spec-tra and physical information such as tablet hardness, i.e. by examiningtablets compressed with varying forces (Gottfries et al. 1996; Morisseauand Rhodes 1997; Roggo et al. 2005; Blanco and Alcala 2006; Blanco et al.2006; Otsuka et al. 2007; Tabasi et al. 2008; Alcala et al. 2009; Sarraguca andLopes 2009). In these studies, chemical information in NIR is the interestingfactor and the physical effect is an interferent, thus it is removed using pre-processing methods such as the standard normal variate (SNV), multiplica-tive scatter correction (MSC) and derivatives (Short et al. 2009). Therefore,it is quite straightforward in the context of tablet mechanical properties totake advantage of this ’interference’ and to establish a model between NIR

73
and tablet hardness without needing to resort to conventional destructivemethods. However, a non-destructive test needs to be validated properlyto ensure its robustness, repeatibility and accuracy.
5.3.1 NIR as an X in mechanical testing
NIR is far and away the most widely applied data acquiring method inhardness analysis of intact tablets. The earliest applications of chemometricdetermination of relationship between NIR and tablet hardness were es-tablished at the turn of this century (Morisseau and Rhodes 1997; Kirschand Drennen 1999). Morisseau and Rhodes (1997) carefully optimized PLSand MLR models that were evaluated by the comparison of standard er-ror or estimation (SEE) and the standard error of the reference method. Inthis way, the authors emphasized the basic principle of calibration, i.e., nomodel is better than the reference method. The study proved the usabilityof the methods as alternative hardness testing tools, though, with the lim-iting factor of drug content dependence. Thereafter, Kirsch and Drennen(1999) applied PCA and PCR analysis from NIR and tablet strength data.In that study, a general model to predict tablet strengths across a range ofAPI contents was developed to some extent. Subsequently, Tatavarti et al.(2005) established a PLS model with reasonably good predictive abilitieseven though there were varying API levels in the samples. Untreated spec-tra were utilized in the predictions since variation in baseline reflects vari-ation in the crushing strength. On the contrary, Cogdill et al. (2005) applieda combination of MSC and first derivative for pre-processing and asa re-sult RMSEP values of the PLS model were pretty high. However, the errorintroduced by the reference method was almost equally large, manifestingthe error source of the reference analysis. Later, Short et al. (2009) acquiredboth reflectance and transmittance data from laboratory made samples andconstructed PLS models. In order to show that spectral treatments such asSNV and derivatives could remove the unwanted scatter effect in NIR, afew PLS models with poor performances were established. The best mod-els required mean centering of spectra and autoscaling of the response. Theminimum of RMSECV as a function of latent variables determined the com-plexity of the model.
Artificial neural networks (ANN) have also been used to predict tablethardness with a range of differet API contents (Chen et al. 2001). Chen et al.
74
(2001) compared the ANN and PLS methods in estimation of tablet hard-ness and the ANN method was evaluated to exhibit better predictive abil-ities over PLS. The optimum ANN model was the one with the minimumsum of squared error values. The input strengths of the model revealed allof the wavelengths which were important for model. Thus tablet strengthis a physical property not characterized by any particular wavelength asnoted many times earlier.
5.3.2 Raman as an X matrix in mechanical testing
Raman spectra contain also physical information just as NIR since the base-line of raw spectra changes as a function of tablet crushing strength (Virta-nen et al. 2008) and a few applications conducted by chemometric analysishave been published. Therefore, Raman spectroscopy utilied in the chemo-metric analysis can offer an alternative PAT tool for tablet testing.
Shah et al. (2007) constructed predictive PLS models with untreated Ra-man data scanned from direct compressed and wet-granulated tablets, re-spectively. According to these authors, the complexity of the model wasoptimum when root mean squared error of calibration (RMSEC) and pre-dictions (RMSEP) were small and nearly the same. Virtanen et al. (2008)predicted tablet crushing strength from the corresponding Raman spectraalso by using PLS. Prior modelling, spectra were scaled to unit variance,since most of the typically used pre-processing methods would eliminatethe baseline variation. The model performance was evaluated by inspect-ing R2 and Q2 values and residuals. The PLS model error resembled thereference method error.
5.3.3 Predictions across one of the previous unit operations
Tablet hardness has been predicted from outcome of the preceding unit op-erations (in contrast to determination from intact tablets), such as granula-tion (Luukkonen et al. 2008) and mixing (Otsuka and Yamane 2006, 2009).This kind of prediction forms a key element of QbD where conditions ofunit operations are linked to the end product quality, enabling real-timerelease of the product.
Otsuka and Yamane (2006) measured NIR spectra from powder mix-tures processed with different lubricant (magnesium stearate) mixing timesprior to compression and used this data as an X matrix in the PCR anal-

75
ysis. Variation of raw spectra was observed between the different pro-cess conditions, i.e. tablet hardness decreased with increasing mixing time.The regression vector represented the scientific basis for the analysis, i.e.,there was a positive correlation of hydrogen groups on the hardness valuewhereas there was a negative impact of the lubricant magnesium stearateon strength. Magnesium stearate is known to affect mechanical strengthof a tablet since it may change material properties and interparticle bond-ing (Wargo and Drennen 1996; Zuurman et al. 1999). Hydrogen bondingin addition to van der Waals forces, is one of the strongest molecular levelinteractions and is known to be linked to tablet strength.
NIR measurements performed during high-shear wet granulation weresuccessfully utilized as independent variables in multivariate and multi-way predictions of tablet hardness (Luukkonen et al. 2008). The goal of thisstudy was to reveal the relationship between granule properties signallingby NIR (Rantanen et al. 2005) and tablet quality. PLS and N-PLS wereapplied to data, i.e. the last NIR spectrum of the granulation process wasutilized in PLS whereas all obtaned spectra during the course of the processwere exploited in N-PLS, the latter having batches in one of the modes ofthe 3-way X array (Luukkonen et al. 2008). Prior analysis spectra werecentered. The explained variances of Y by the PLS and N-PLS models werereported as being 92% and 94%, respectively.
5.3.4 Predictions across several unit operations and feed-forward control schemes
Westerhuis et al. (1997) considered tablet manufacturing with a granulationstep as a two-step process (Fig. 5.1), i.e. first granulating the powder blendand subsequently tableting. They utilized the process information of sev-eral units in order to a) optimize and b) predict the end product, i.e. thetablet quality, in terms of crushing strength and disintegration time. TwoPLS models were constructed; model 1 captured the blend composition andprocess variables between unit operations and model 2 captured the sameas model 1 and also granule properties. Since physical granule propertiesare highly collinear and also dependent on previous process step, the useof PLS for prediction was justified. Model 1 was intended for finding pro-cess variable settings if, for instance, the amount of a blend constituent waschanged. Model 2 was aimed for routine use to estimate tablet quality dur-

76
-Powder
mixture
PV1-
Granules
PV2
Tablet
compaction
Figure 5.1: Illustration of two-step tableting process. PV1 and PV2 denotesprocess variables in the first and second steps, respectively. Adapted fromWesterhuis et al. (1997).
ing production since batch-to-batch variability of granules was taken intoaccount in the model. This model can be also used to help make adjust-ments to process variables in order to ensure that the end product will beable to meet its specifications. Westerhuis et al. (1997) also constructed acontrol scheme as a result of certain estimated tablet quality parameters(strength and disintegration) which differ from batch to batch. The controlscheme depicted estimated values as a function of two process parameters,granule moisture content and compaction force for each batch according tothe predictions obtained with model 2.
Similarly, Skibsted et al. (2007) constructed PLS regression models be-tween precending unit operations and final quality, i.e. the mean tabletdisintegration time, in order to demonstrate the benefits of a feed-forwardcontrol system. The first model was designed with mixing time of raw con-stituents, prior granulation (mix), three first PC scores of average NIR spec-trum from mixing (NIR1∗ ) and granulation liquid flow (gra) (Fig. 5.2). Thesecond model comprised of variables used in the first model and the aver-age three first scores of NIR spectrum of granulation (NIR2∗ ), the three firstscores of the last spectrum of drying (NIR3∗ ), the three first scores of theaverage spectrum of lubricant mixing (NIR4∗ ) and process variables. The

77
-mix1
NIR∗1
mixTime liqFlow
model1
-gra
NIR∗2
-dry
NIR∗3
-mix2
airT dryTime punF
model2
NIR∗4
tab - disT
Figure 5.2: The unit operations (mix1,2, gra dry, tab) with NIR measure-ments (NIR∗
1,...,4) acquired post processing. The controlled variables weremixTime refering to mixing time of dry powders, liqFlow refers to granula-tion liquid flow, airT represents air temperature inside the granulator, dry-Time is the drying time and punF is the average punch force in tableting.The quality variable is disT which refers to the mean disintegration time oftablet.
process variables were drying temperature (airT), drying time (dryTime)and upper punch force of tableting (punF).
The first model can be applied for estimation of setting of granulationliquid flow on the basis of the desired tablet disintegration time. This re-quires hypothetical liquid flow values to be inserted into the model. Thesecond model could be utilized to estimate compression force equivalently.However, raw material variation was not included into the models of West-erhuis et al. (1997) and Skibsted et al. (2007).

78

79
6 AIMS OF THE STUDY
The main thrust of this thesis was to explore the potential benefits of chemo-metric methods that have been innovatively applied in the tableting manu-facturing sub-processes of two-component matrix tablets. In the first part ofthis study, the molecular descriptors with multivariate methods were uti-lized as a potential tool for drug dissolution evaluation from the hydropho-bic matrix tablet and the evaluation of drugs’ physicochemical properties.In addition, the suitability of utilizing multi-way analysis for examiningspectral data acquired from tablets was evaluated.
In the second part of this research, multivariate and multi-way meth-ods in conjunction with acoustic emission data and process variables fromgranulation process of tableting material in fluidized bed granulation havebeen exploited in order to enhance process understanding.

80

81
7 CHEMOMETRICS AND TABLET QUALITYI-III
These studies were conducted during the VARMA project years 2003–2007,which aimed to develop a model that is able to predict all kinds of orallyadministered drug release from the hydrophobic matrix tablet. The initialway to accomplish this goal was to be able to explore as many orally activedrug compounds as possible (I). Next, the collected orally active compounddatabase was subjected to analysis with unsupervised clustering methodTS-SOM. The clustering of the chemical space of orally active compoundswas solely based on molecular descriptors characterizing the compoundproperties. Next, one kind of Design of Experiments took place, i.e. a setof physicochemically different drug compounds was chosen from differentregions of the map for further analysis. During the following years, thesecompounds were subjected to tableting and to dissolution testing and inspring 2007 an extensive set of dissolution profiles was acquired and an-alyzed (II). The final chemometric analysis (II) required only one month,whereas some of the experimental work took years. This project revealsclearly how chemometric methods can aid and hasten the analysis time.
The study of the API content determination in matrix tablets (III) wasdeveloped from the concept of utilizing multi-way methods on spectraldata (attenuated total reflection Fourier transform infrared ATR-FTIR) ac-quired from tablets. The study was carried out in the years 2005–2006. Stilltoday few multi-way analysis have been conducted to evaluate tablet prop-erties, thus this study (III), has novelty value. Next, the main results anda very short introduction to the subject will be given. All data analyseshave been carried out using the commercial software package PLS_toolbox(Eigenvector 2006) if not mentioned otherwise.

82
7.1 Chemical space of orally active compounds (I)In this study, the chemical space of orally active compounds was exploredin order to select 15 compounds (II: Table 1) from different regions of spacefor further processing. Chemical space consists of regions with drugs hav-ing different properties, such as different biological activities. The selec-tion of drugs for tableting and dissolution testing needs to encapsulate ashigh variance as possible within the chemical space, that is spanned by thevariables relevantly describing the drug molecules. This is especially im-portant if any general model is to be constructed or conclusions are to bedrawn on the basis of the selected drugs. Since chemical space is spannedby several molecular variables (descriptors) related to drug properties andthese variables are most probably correlated to some extent, the selection ofthe model drugs with high variance should not be based on separate vari-ables (Westerhuis 1997). Instead, multivariate methods that encompass themain variation within the data into lower dimensions should be used. Neu-ral networks and clustering methods have proven to be tools for buildingframes for previous conditions and distinguishing rather similar moleculesfrom others (Schneider 2000; Miller 2002).
Thus, in this work, the clustering was performed with TS-SOM (Visi-point 2003) in which the clustering outcome depends on non-selective in-put variables, meaning that no variables other than molecular level inter-actions (VolSurf descriptor) were used in the training. VolSurf descriptorsare scalar values of physicochemical properties extracted from the 3D in-teraction fields between target and probe molecules (Mannhold et al. 2006;Cruciani et al. 2000; Crivori et al. 2000) (II: Table 2). The VolSurf descrip-tors were computed using software version 4.1.4 (Molecular Discovery Ltd2004). The goodness of clustering was generally assessed based on the def-inition of chemical space, i.e.,the proper chemical space should be struc-turally diverse (Manallack and Livingstone 1999) and contain regions withdrugs having the same activity.
As a result of this work, similar activities of drugs were located inthe same or neighboring neurons thus manifesting adequate clustering (II:Table 2). Moreover, drugs located in distinct regions possessed differentphysicochemical characteristics, such as different solubility and permeabil-ity in biological fluids and membranes.
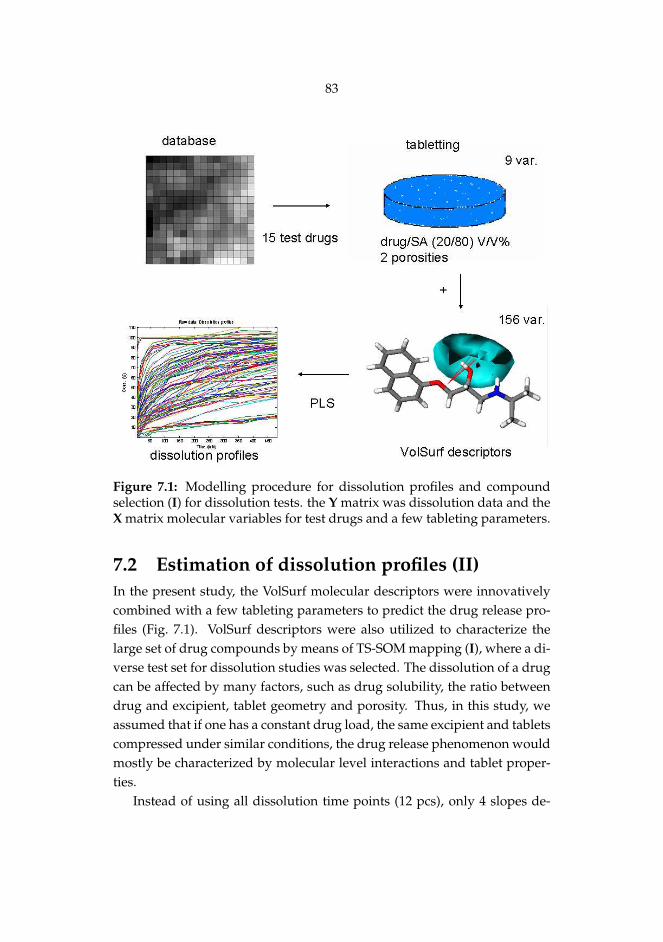
83
Figure 7.1: Modelling procedure for dissolution profiles and compoundselection (I) for dissolution tests. the Y matrix was dissolution data and theX matrix molecular variables for test drugs and a few tableting parameters.
7.2 Estimation of dissolution profiles (II)In the present study, the VolSurf molecular descriptors were innovativelycombined with a few tableting parameters to predict the drug release pro-files (Fig. 7.1). VolSurf descriptors were also utilized to characterize thelarge set of drug compounds by means of TS-SOM mapping (I), where a di-verse test set for dissolution studies was selected. The dissolution of a drugcan be affected by many factors, such as drug solubility, the ratio betweendrug and excipient, tablet geometry and porosity. Thus, in this study, weassumed that if one has a constant drug load, the same excipient and tabletscompressed under similar conditions, the drug release phenomenon wouldmostly be characterized by molecular level interactions and tablet proper-ties.
Instead of using all dissolution time points (12 pcs), only 4 slopes de-
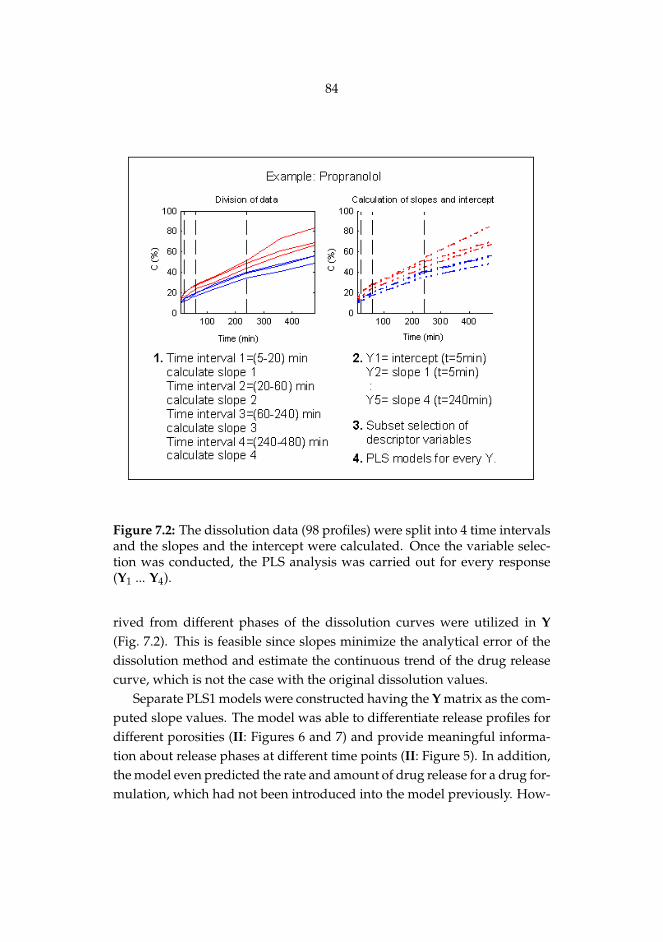
84
Figure 7.2: The dissolution data (98 profiles) were split into 4 time intervalsand the slopes and the intercept were calculated. Once the variable selec-tion was conducted, the PLS analysis was carried out for every response(Y1 ... Y4).
rived from different phases of the dissolution curves were utilized in Y(Fig. 7.2). This is feasible since slopes minimize the analytical error of thedissolution method and estimate the continuous trend of the drug releasecurve, which is not the case with the original dissolution values.
Separate PLS1 models were constructed having the Y matrix as the com-puted slope values. The model was able to differentiate release profiles fordifferent porosities (II: Figures 6 and 7) and provide meaningful informa-tion about release phases at different time points (II: Figure 5). In addition,the model even predicted the rate and amount of drug release for a drug for-mulation, which had not been introduced into the model previously. How-

85
ever, there were issues with tablet homogeneity typical of matrix tabletswhich could not be predicted by the model. Thus, it would be beneficial tohave a proper sampling plan, which would ensure better tablet homogene-ity (Paakkunainen et al. 2009).
In conclusion, the model could be utilized as a feed-forward processmonitoring method, since hypothetical tableting values, i.e. compactionforces and porosities could be inserted into the model and used to predictthe resulting dissolution profile. For instance, a similar control scheme waspresented by Westerhuis et al. (1997) which can be used to determine theoptimal compaction force values for new drug compound to obtain thedesired dissolution profile. It could be feasible to carry out similar mod-elling studies in a pharmaceutical company, since most companies utilizethe same excipient(s) and technologies on a regular basis (Yu 2008).
7.3 Tablet quality (III)The aim of the present study was to build trilinear calibration models and tostudy their ability to predict the amount of drug compound in an axially cutcylindrical starch acetate matrix tablet. The amounts of drug and excipientwere predicted from ATR-FTIR spectra using PARAFAC and N-PLS. Datamatrices consisted of dissolved and undissolved parallel samples havingdifferent drug content and spectra, which were collected at the axially cutsurface of the flat-faced matrix tablets. Spectra were recorded comprehen-sively at different points on the axially cut surface of the tablet (III: Figure2). The sample drug concentrations varied between 2 to 16% V/V. Three-way data array consisted of tablet samples of different drug loads in thefirst mode, spectra in the second mode and sampling locations (i.e. repli-cate measeures from different regions of tablet) in third mode, respectively.
In this study, the size of the three-way array was (6x1401x4). Thus,the by-product of the second order advantage (Olivieri 2008) has been ex-ploited since the calibration (and test) set included very few samples. Inaddition, using only a few calibration samples is allowed when the con-stituents in the samples are well-known and no unexpected interferencee.g. instrumental or new constituents (Martens and Martens 2001). Never-theless, PARAFAC loadings coincided well with pure spectra of both con-stituents (III: Figure 4 A), drug and excipient, despite the partial overlap-ping of the spectra (III: Figure 3). Sample loadings depicted relative con-
86
centration of constituents in samples (III: Figure 4 B). The third loadings,which depicted sampling location on the tablet, i.e. a parallel measurementpoint showed almost no variation with respect to the excipient concentra-tion in tablet (III: Figure 4 C). Instead, drug concentrations do exhibit somevariation thus suggesting homogeneity issues with respect to the drug.
The multi-way methods together with ATR-FTIR spectra represented apotential method for the determination of drug and excipient distributionin the tablets. As a resultn N-PLS was more robust in terms of provid-ing an accurate quantification of the amount of components in the samplewhereas the PARAFAC model provided approximate relative amounts ofcomponents.
7.4 Summary (I–III)The results show how bi-linear, multi-way and neural networks chemomet-ric methods can be utilized to extract information from multivariate datarelated to tableting unit operations ranging from pre-formulation studies(I) to feed-forward controlling tool of tablet compression (II) and qualitytesting (III).
I) This is the first time that unsupervised tree-structured self-organizingmap has been utilized for DoE purposes for evaluating a drug databasethat included only compounds that were orally active or potentially orallyactive drugs. The clustering showed physicochemically different drugs tobe located in distinct regions. The TS-SOM clustering is useful for visual-ization of multidimensional (heterogenic) molecular data, e.g. data whichwould need many principal components in order to accomplish the analy-sis. However, TS-SOM cannot be used for reliable predictions since it lacksthe ability to save the initial model.
II) This is the first time that molecular modelling tools (molecular de-scriptors) have been combined with pharmaceutical technological data (dis-solution data) and utilized to perform quantitative model between drugdissolution data (Y) and computed drug descriptors in conjunction with afew tablet compaction parameters (X). The model enables a relatively rapidestimation of the dissolution data of new drug molecules based on molec-ular data and hypothetical tablet compression values. Even though themodel works well for drugs having an average release profile, it estimatesrelease profiles best in the model space. For instance, extreme release pro-

87
files such as very slow or immediate release profiles may appear as outliersin the model.
III) This is the first time that multi-way chemometric methods have beenapplied for tablet quality inspection by means of elucirating the API con-tent uniformity (III). The model enabled the reliable prediction of the drugin different locations of the tablet thus revealing potential heterogeneity re-lated quality defects. The results indicated that by applying a multi-wayanalysis method, reliable (good predictive ability) and meaningful (truespectral loadings) models can be achieved with only a few calibration sam-ples.
7.5 PerspectivesThe studies (I-III) of this thesis represent valuable starting points for furtherdevelopment of feed-forward control systems for the tablet compaction unitoperation and ultimately, real-time-release applications (RTR). The resultsof studies (I-II) indicate that the combined TS-SOM - PLS method could beapplied for other kinds of matrix systems. The method presented in (II)could be utilized as a process control or a development tool in the phar-maceutical industry, e.g. for providing information about drug dissolu-tion behaviour in the early phase of formulation studies. In the future, amodel (Matero et al. 2008) to distinguish the drugs which do not success-fully form a stable matrix tablet together with starch acetate will be stud-ied further. This will allow a better understanding of the physicochemicalnature of drugs in order to facilitate controlled release from hydrophobicmatrix tablets.
The current state of tablet quality research mainly involves studies ofAPI content in the tablets and univariate detection of other critical qualityattributes. In the future, tablet quality could be considered as a multivariateproperty. For instance, quality matrix Y could be subjected to PCA and testquality in a multivariate manner, or the NIR method and weight variationtest could replace unit dose content tests (ICH Q8(R2) 2009). Accordingto the literature review, chemical imaging (IC) techniques are emerging inthis field since e.g. NIR-CI provides both chemical and spatial informationabout the active and inactive constituents in tablets (Ravn et al. 2008). Forinstance, the studies of Sasic (2007) and Gowen et al. (2008) have demon-strated the feasibility of using CI methods to detect API present at very low

88
concentrations. However, images as well as any tableting unit operation,will produce lots of data and these could be well processed with multivari-ate analysis methods. Multivariate data analysis will soon be incorporatedto tablet development, manufacturing and quality testing during severalphases of pharmaceuticals production. Unfortunately, there are no guide-lines to indicate which chemometric and measuring method would be ap-propriate for a particular unit operation or CQA or details on how best toperform the data analysis from different processes which rarely are similarto another. This is due to the fact that alternative chemometric methods canlead to a feasible solution. For instance, the modelling part of the study(III) concerning API content in the tablets could have been carried out byapplying the PLS method.

89
8 CHEMOMETRICS AND FLUIDIZED BEDGRANULATION IV-VI
These studies were carried out within the PATKIVA project years 2007–2009. Here, the aim was to develop a feed-forward process control for batchfluidized bed granulation and to construct a model that could separate badbatches from their well-performed counterparts. The strategy was to useacoustic emission (AE) spectra and traditional process variables in analy-sis in conjunction with chemometrics. In order to achieve this goal, certaincritical quality parameters need to be determined and these are followed,predicted and assessed. In the first paper IV CQA’s were granule size andwater content and in the last two papers (V, VI) they were yield, i.e., gran-ule size distribution. In paper V, the yield was determined post-processwhereas in paper VI granule size distributions were determined duringthe process, i.e. different batches were carried out with a different processlength. Even though the feed-forward model was not able to be developed,it was established that this model could separate batch quality from pro-cess variables and also two feasibility studies were conducted with AE as ameasurement tool of the granulation process. In summary, the results high-lighted the potential benefits of utilizing multivariate as well as multi-waymethods to study granulation.
Next, the main results and a very short introduction to the subject willbe presented. All data analyses have been carried out using the commercialsoftware package PLS_toolbox (Eigenvector 2006) if not mentioned other-wise.

90
8.1 Feasibility of acoustic emission for fluidizedbed granulation (IV)
Granule size and water content during granulation are of importantparametrs to be determined. In this study, the potential for using acousticemissions as a way of monitoring fluidized bed granulation was evaluated.The basis of AE monitoring of fluidized bed granulation is that as granulesgrow larger and the moisture content changes, their elastic properties alsochanges and that also affects AE signals. In addition, other granule prop-erties such as shape, hardness, porosity and uniformity of content affectthe signal. The relationship between granule properties and acoustical sig-nals has not been unequivocally established since these attributes cannotbe measured directly. Instead, a regression model needs to be created, ifpossible.
Two different case studies were provided. The purpose of the case 1study was to develop a model for detecting and distinguishing qualita-tively different sized pharmaceutical granules from acoustic emissions dur-ing fluidization. In the case 2 study, a model was developed for quantifi-cation of the bed moisture content during granulation. For these models,data from process variables and AE signals within the frequency region of50 - 625 kHz (IV: Figure 2 A) were combined using PLS and PCA. Gran-ulations were performed with identical process settings, e.g. inlet air tem-perature and humidity and formulation composition were constant. Thegranule size and water content were determined during fluidization by athief probe and later in laboratory analysis. For the quantification models,the information from the process parameters and acoustic emission datawere combined using PLS regression. During the modeling, the first twominutes of process were excluded from the analysis since it was the mixingtime of mixture components and AE signals that differed greatly betweenpowder mixing and the wetting phase.
The models were able to monitor the granule water content to be trackedthroughout the granulation process and granule size determination dur-ing fluidization in most cases (IV: Figure 6). Thus, the multivariate meth-ods were able to gather and extract physical information from the acousticemission spectra of fluidization and granulation. The relative humidity ofambient air is crucial in determining the granule moisture and therefore
91
it is important to stabilize its impact on the model and on batch-to-batchvariation. In addition, the AE measurement set-up need to be carefully val-idated.
In order to minimize computing time for the AE signals and to simplifythe data handling, the spectra were pre-processed by averaging them intosegments (IV: Figure 2 B). Pre-processing was considered to be essentialfor the good quality of the models and the averaging the spectra includedenough process information for the models. However, the problem remainsthat one still cannot see inside the granulation process and therefore moreresearch needs to be done. Nonetheless, the results demonstrate that the AEmethod is a very sensitive method for determining even the smallest gran-ule sizes in powder blends, even under unusual process conditions, i.e. anexternal material in the granulator (IV: Figure 7). Thus, the method is apromising technique to be utilized as a process analytical tool for the phar-maceutical industry since it provides useful information about the qualityattributes of fluidized bed granulation in real-time.
8.2 Multi-way models for fluidized bed granula-tion process (V)
Pharmaceutical processes are typically run in the batch mode providinga list of advantages, e.g. quality assurance of batch and disadvantages(Leuenberger 2001a; Kourti 2009), such as batch-to-batch inconsistency. Asa simplification, one can state that understanding and controlling of gran-ulation process is a black box. Its output is the knowledge of whether theprocess has produced either good or bad quality granules. Thus, the objec-tive here was to develop a model for differentiation of a successful qualitybatch of fluidized bed granulation from unsuccessful batches where therewas a varied temporal duration between batches. Some of the batches weredeliberately over-wetted to induce bed collapse in order to obtain batch-to-batch variance while other batches were run under normal conditions.Here, the temperatures of the in- and outlet air and mass temperature wereutilized to monitor the performance of different batch granulations. The flu-idized bed granulation is a thermodynamic equilibrium process, and eventhough the water vapour in inlet air has latent heat, which increases thetemperature of the wet granular mass to some extent, and the outlet air
92
humidity is a direct indication on the extent of evaporation, we applieda multi-way analysis on only the temperature variables. Nevertheless, thebatches with an appropriate granule distribution could be identified, whichindicated that the monitoring equipment and set-up can be simple and yetoffer a valid insight into the process.
Modelling was performed by PARAFAC and PARAFAC2. In theircomparison, the PARAFAC2 method provided a good differentiation be-tween the successful and unsuccessful batches (V: Figure 7) whereas thePARAFAC failed (V: Figure 5) due to the practical reasons inherent in themethod. In terms of process control purposes, the PARAFAC2 model en-abled the evaluation of the goodness of the batch with different lengths ofprocessing, e.g. during the process run, by means of granule size distribu-tion. However, the model limits do need to be established to define thoseregions of the process phase that distinguish the unsuccessful batches fromgood ones if real-time process control is the goal. In conclusion, the resultsillustrated the well-known fact that the granulation process utilized in thepharmaceutical industry is a complex process, which is often difficult tomodel. However, the use of multi-way methods made it possible to obtaininformation that enhanced the understanding of the process.
However, it should be noted that initially, PLS and PCA modeling weretried but due to failure of modelling, the results were not published. Thusfor granulation process data, the best models were those performed usingmulti-way methods. This was most probably due to the three-way natureof the process data and batch-to-batch variation that could not be capturedusing bilinear modelling. In addition, if one thinks the definition of goodand bad quality batches, the definition would be that a good quality batchconsists of low variation of granule sizes whereas an unsuccessful batchconsists of fines and clumps (V: Figure 1). In other words, granule sizevariation is one of the reasons for an unsuccessful batch. In this study, onlytemperature variables (in- and outlet, and mass temperature, respectively)were needed to provide information about quality content. It is widelyrecognized that bed moisture, i.e. moisture conditions inside the granula-tor, affect granule growth, since wet granulation is based on mass wettingand kinetics. As an oversimplification, one can say that when conditionsare too dry, granules will not become larger whereas too moist conditions
93
will induce bed collapse and the formation of clumps. However, it shouldbe noted that temperature is not the sole reason for poor batch quality. Thegranule size properties are the sum of starting materials and nucleation sizedistribution and processing conditions caused by multiple varying and in-teracting process parameters.
8.3 N-PLS estimation of granule size distribution(VI)
In this study, it was shown for the first time that the nucleation phase ofgranulation can be detected using acoustic emission techniques and sec-ondly the possibility to predict an end product granule size distributionby means of acoustic emission measurement of the nucleation phase. Theend product granule size distribution was determined in the early phaseof granulation, based on the observation that the quality of the early phasenucleation strongly affected the quality of the end product. In the quantita-tive model, the information gained from the process stream acquired withan acoustic emission transducer was modeled using N-way PLS. The refer-ence sieve analysis for the granule size distribution was performed off-lineand was used as the response variable. Since AE is influenced by the size ofthe granules, and the acoustic signal is the sum of impacts of different sizegranules, the AE signal could be expressed as a function of granule sizedistribution (Fig. 8.1).
In order to predict the size distribution from non-selective AE signal,one figure was needed to be created that describes (the shape of) the dis-tribution. The 25% quartile of cumulative granule size distribution wasconsidered to be equivalent to the size distribution. Since the nuclei sizedistribution was recognized as directly affecting the end product size distri-bution, and because the elastic properties of the granules changed betweennucleation and steady growth regimes, the off-line analysis was based onthe acoustic data collected during nucleation only. In addition, a similaranalysis was performed on data collected during the steady growth phase,and on data consisting of both the nucleation and steady growth phase fromthe acoustic emissions to further emphasize the importance of identifyingthe different growth regimes for process control.
Prior modelling, batch and AE modes were centered, which is the ac-

94
Figure 8.1: The segmented AE signals by averaging the original signal(left-hand side) can be expressed as the cumulative granule size distribu-tion (right-hand side). The lateral solid line depicts the 25% quartile of thecumulative sum, that is, the intersection of 25% and the cumulative sumcurve.
cepted way for multi-way models (Bro and Smilde 2003). The N-PLS mod-els for different periods of granulation were calibrated. The three-way ar-rays consisted of batch in the first mode, acoustic emission segments in thesecond mode and time in the third mode, respectively. The predicted versusreference 25% quartile (f25%) values for test sets are illustrated in Figs. 8.2and 8.3. The 25% quartile was the best for prediction of the granule sizedistribution of the end product since it was the parameter which separatedbest the successful from unsuccessful batches i.e. it encapulated informa-tion about the size distribution. The result in Fig. 8.2 and 8.3 depicted howmodelling ability was decreasing after nucleation phase was detected. Thisis understandable since the two overlapping phases, i.e. nucleation andgranule growth by collisions, could not be modelled together adequately.If the phases are based on a different mechanism, they should be modelledseparately.
The model can be implemented into a process line. The ability to predictthe end product quality using acoustic emission measurement at the begin-ning of the process, will notify the operators much earlier if a bad qualitybatch is being produced. Thus, the operator is able to shut down the pro-cess without losing more processing time and consequently, is able to savemoney.
Still today, multi-way models in manufacturing or development of phar-

95
Figure 8.2: The reference f25% values of calibaration samples versus thepredicted ones attained from the N-PLS calibration model (left-hand side)and same for the test set (right-hand side). The calibration samples wereacquired within the time period of 60 – 450 sec of the process. RMSEP forcalibration set was 0.03.
maceutical solid dosage forms have not been extensively employed. Thiswork showed that utilizing a multi-way modelling may provide new in-sights from the process and, capture the batch-to-batch variance which is amajor concern and uncontrollable factor in tablet unit processing.
8.4 Summary (IV–VI)The results reveal that how multi-way methods (V, VI) are very suitablefor handling batch granulation data and better than bi-linear methods (IV),since they are able to capture batch-to-batch variation which cannot beachieved with two-way methods. The studies provide one step on the routetowards the ultimate goal of coupling the information from multiple pro-cess steps to achieve real time release of the product.
IV) This is the first time that bi-linear chemometric methods have beenutilized to extract information from acoustic emission data acquired duringfluidized bed granulation. The study showed that AE contains informationof granule size as well as the moisture content of granule mass and it canbe utilized as an X matrix in the predictive modelling. However, there weresome limits for predicting granule sizes from AE spectra. In reality, if a mix-ture of different granule sizes needs to be fluidized, the detected AE spectra

96
Figure 8.3: The reference f25% values of test samples versus the predictedones attained from the N-PLS calibration models. The calibration samplesfor models were acquired within a varying time period for each model, 60 –750 sec of the process. RMSEPs for each calibration set were from left uppercorner to right lower corner 0.07, 0.08, 0.11, 0.17, 0.15 and 0.18.
will be the sum spectra of different size fractions in the powder mass. Thus,the granule size predicted by any quantitive model, such as the PLS model,will be the average of different sizes. This was demonstrated in this paperby fluidizing a powder mixture which consisted of two component. More-over, when the moisture content of granule mass was predicted, processvariables in conjunction with AE were needed in order build a model pro-viding good predictivity.
V) This is the first time that a multi-way method has been utilized forhandling granulation process data. The model was able to distinguishbadly performed runs from the good runs utilizing only a few process pa-rameters measured by default. The next step would be the construction ofthe model capable of feed-forward control.
97
VI) This is the first time that a multi-way calibration method has beenutilized to build a predictive model between the AE signal and the respec-tive granule size distribution. The modelling procedure revealed the nucle-ation end-point of granulation at the beginning of granulation which couldbe utilized to predict the final granule size distribution. The modelling pro-cedure showed that AE spectra is the sum of different granule sizes andcannot be exploited to characterize of individual sizes of granules in thereal world. These findings are in accordance with the results of case study1 in (IV)).
8.5 PerspectivesThe goal of this project was to try to construct a feed-forward model forgranulation by utilizing acoustic emission data acquired from the process.If one wishes to build a model for feed-forward control, certain processparameters (e.g. temperature, liquid flow, droplet size) need to be incorpo-rated into the modelling in order that the process conditions can be com-pensated appropriately. Spectroscopic measurements, e.g. AE do not solelyprovide a firm foundation for a feed-forward model since a spectroscopicmeasurement of the process is unlikely to signal some critical process pa-rameter (CPP). Thus, spectroscopic methods may only be used for predict-ing critical quality attributes (CQAs) or establishing a multivariate finger-print of the process in a design space (DS). Moreover, throughout thesestudies many process parameters were kept constant and no DoE was ap-plied. For example, this reduces the opportunities to find and estimatean optimal combination of CPPs which will guarantee the desired prop-erties in a batch of granules. If one wishes a reliable feed-forward controlscheme one also needs to incorporate raw material or input material vari-ation into the model. For instance, information of input material can begathered through a spectroscopic scan or by doing an analysis in the labo-ratory which is obviously more time demanding. Nonetheless, the studies(IV-VI) provide valuable starting points for further development of controlsystems for tableting unit operations and ultimately, for real time releasetesting (RTR).
In general, no multivariate applications are being widely applied amonggranulation processing. However, multivariate methods can be applied notonly in process monitoring but also in basic research for revealing hidden

98
information within the data generated. The studies (IV) and (VI) clearlyhighlight this benefit. It is interesting that new and sophisticated spectro-scopic techniques are constantly praised as potential PAT tools, but it isoften overlooked that there are other non-destructive measuring tools e.g.thermometer. In study (V) this issue was addressed i.e. the basic processparameters measured during granulation i.e. temperature of mass as wellas temperature of the in and outlet air may include information related toCQAs when analyzed with an appropriate method. It would thus be ad-vantageous to critically examine the limits of each non-invasive measuringtool and to establish the best combination of tools providing informationof CQA to achieve the best understanding of process conditions. For in-stance, the studies (IV) and (VI) indicate that AE can provide informationof granule size distribution and mean granule size, which are two CQA inthe granulation process, but it does not gather specific information aboutdifferent granule sizes. For example, it would be feasible to evaluate if AEdata would provide any clear benefit (other than a somewhat unique mea-suring technique) to aid process understanding in preference to other spec-troscopic instruments. AE data should also be analyzed more extensivelyif it can provide any other details about the CQA of granules in addition tosize and moisture.
Since granulation processes may be considered as a ’black-box’, it wouldbe advantageous to ’see’ inside the process e.g. using imaging techniquessuch as chemical imaging (CI) which are an emerging field especially in APIcontent determination. One potential technique providing 3D informationof granulation process by permitting one to ’see’ inside the process couldbe electrical capacitance tomography (ECT) which is a noninvasive and rel-atively novel method. However, it should be noted that correct samplingis still the major issue in all aspects of sample acquiring, and this needs toreceive more attention in the future. In summary, chemometric methods ormodels are only as reliable as the data on which they are created.

99
9 GENERAL CONCLUSIONS
PAT thinking and operating involves multivariate thinking, having chemo-metrics as an integral part of the concept. Certain processes, e.g. tableting,are multivariate in their very nature (Balboni 2003; Kourti 2006; Munsonet al. 2006) since they consist of several unit operations and produce multi-variate data. Multivariate data needs to be analyzed with appropriate tools,that is multivariate data analysis tools in chemometrics. Multivariate dataanalysis provides an understanding of complex phenomena by discoveringrelationships between measurements and in the best case, it can reveal thereasons for certain process behaviors. For instance, multivariate calibra-tion such as widely applied PLS enables "the development of mathematicalmodel relating unselective multiple instrumental signals with analyte con-centrations (Olivieri 2008)".
In essence, the ideology behind PAT for tablet manufacturing is toachieve 1) in-depth process understanding and 2) real-time process mon-itoring via timely and non-destructive measurements from the processstream. PAT is used for defining the process signature that enables the mon-itoring of the process and its state. By achieving real-time monitoring andprocess knowledge, it is possible to detect possible failures early and, inthe best case scenario, to prevent the failures by compensating critical pro-cess variables. This is because one can use multivariate models to detect ifsamples are out of specifications and also to reveal the variable(s) that areresponsible for specific process behavior. There are several advantage tousing PAT framework e.g. fewer batch rejections, less labratory tests andwaste, deeper understanding of the process that is the ultimate prerequisitefor process control and real-time process state monitoring.
There has been a lot hype about PAT in tablet manufacturing for sev-eral years. Nonetheless the literature reveals that the PAT applications aremainly utilized for evaluation of one unit operation at a time and not for

100
connecting all the operations via multivariate models. Moreover, the sit-uation where process is carried out in terms of quality by design has notyet conducted. If one considers PAT strategies, it is obvious that true pro-cess control, which means that possible defects and process variation canbe compensated, has not yet being achieved, or at least the case studies arenot released in public. There are several reasons for this, such as inappro-priate measuring devices, sampling problems and invalid analyzing (e.g.univariate) methods. 1) Some unit operations are still very poorly under-stood, such as complex granulation phase and they will need much morebasic research to unravel the relationships between process conditions, pro-cessing material and end (or intermediate) product characteristics. 2) Thecultural and historical reasons should not be forgotten when consideringwhy the pharmaceutical industry lags far behind certain other industries,e.g. food industry, with respect to process controlling. Pharmaceutical pro-duction can be considered to be a very delicate nature of the chemical in-dustry with its strict regulatory atmosphere (Cook 2007). Pharmaceuticalshave to be safe for human use and any changes concerning those processesinvolve masses of paper work to be submitted to the authorities if changesare being implemented because of the strict regulation in this field (Mun-son et al. 2006). This, in particular is against real-time process control in-troduced by the PAT guidance. 3) Finally, the most striking argument forlack of ultimate PAT applications within tablet manufacturing is the inabil-ity to see how chemometrics can be utilized, one could almost say that theignorance of chemometrics, which is in essence a major portion of PAT. Thisis mainly due to lack of awareness of the power of chemometrics and dueto the blurred vision that chemometrics is a difficult and complicated sys-tem involving mathematics and complicated calculations and the need forsophisticated hardware (Workman 2002).
Despite the success of applying chemometrics within pharmaceuticalresearch, there are some drawbacks and concerns about the overall chemo-metric approach. Firstly, many scientists are not yet ready to forego uni-variate measurements and move towards a multivariate way of thinking.Secondly, there is a major concern about the usage of chemometrics by in-experienced scientists (Pretsch and Wilkins 2006) and the challenge of ex-plaining the issues and concepts to non-chemometricians, e.g., creating a

101
dialogue between process personnel and chemometricians (Miller 2005).Perhaps one of the greatest challenges is to convince those individuals whobelieve that only fundamental, theoretical, i.e. hard models, are the key tosuccess that data-driven methods, i.e., chemometrics methods, can do thejob just as well. Already in 1990 an article was published based on inter-views of originators of chemometrics, where Prof. Bruce Kowalski specu-lated whether there would be any equivalent chemometrics application inphysics, i.e. physiometrics or Physics-ometry, since "physicists can’t leavetheory" (Geladi and Esbensen 1990). Thus, we need more education andknowledge within chemometrics and to demonstrate time and time againthat chemometrics actually works. All in all, the ultimate situation wouldbe that if one is confronted with the term ’chemometrics’, one should cat-egorize it as one more scientific discipline just as one does with chemistry,mathematics and physics.
Today tablets are being produced in a safe, accepted and validated man-ner but monitoring is carried out in a univariate manner and control isbased on post-process quality checks. The end product analysis providesalmost no information about process itself, thus it adds nothing to processunderstanding and this eliminates the possibility of fault diagnostics. In or-der to fully understand the process (Cook 2007), it is understood when 1)one can explain batch-to-batch variability, 2) can reliably predict if a batchwill be successful or not from the in-process data, and 3) all factors affect-ing quality have been considered (Cook 2007). However, the PAT toolsmay certainly improve process understanding and would be one step to-wards safer products, consistent quality (Dziki 2008) and reduced costs.In essence, chemometrics will be no doubt play a great role in tablet pro-duction and also in basic research in the future. Nonetheless, it is unlikelythat traditional end product testing will ever be totally replaced by on-lineprocess control and predictive models.
Finally, a few ideas (some of them being addressed in theses of West-erhuis (1997) and Skibsted (2005)) about how multivariate methods can beapplied to tableting in future
1) Tablet quality, as well as intermediate product quality, such as gran-ules, could be considered as a multivariate property. For instance, qualitymatrix Y could be subjected to e.g. PCA and test quality in a multivariate

102
manner.2) Multivariate models, e.g. latent variable models, could be utilized to
connect unit operations, since the end or the intermediate product is thesum of the process events.
3) The pharmaceutical industry and related research laboratories couldadopt control strategies more efficiently and learn from other industries.
4) Raw material characterization e.g. with spectra should be includedin chemometrics models since raw material variation can lead to batch-to-batch variation.

103
REFERENCES
Adams E, De Maesschalck R, De Spiegeleer B, Vander Heyden Y, Smeyers-VerbekeJ, Massart D: Evaluation of dissolution profiles using principal component analysis.Int J Pharm 212: 41–53, 2001
Agatonovic-Kustrin S, Beresford R: Basic concepts of artificial neural network(ANN) modeling and its application in pharmaceutical research. J PharmaceutBiomed pp. 717–727, 2000
Alcala M, Leon J, Ropero J, Blanco M, Romanach RJ: Analysis of Low ContentDrug Tablets by Transmission Near Infrared Spectroscopy: Selection of CalibrationRanges According to Multivariate Detection and Quantitation Limits of PLS Mod-els. J Pharm Sci 97: 5318–5327, 2008
Alcala M, Ropero J, Vazquez R, Romanach RJ: Deconvolution of Chemical and Phys-ical information from Intact Tablets NIR Spectra: Two- and Three-Way MultivariateCalibration Strategies for Drug Quantitation. J Pharm Sci 98: 2747–2758, 2009
Alderborn G, Wikberg M: Granule properties. In: Pharmaceutical powder com-paction technology, Vol. I, pp. 1323–1373. Eds. Alderborn G, Nystrom C, MarcelDekker, Inc, New York, 1996
Alderborn G: Tablets and compaction. In: Pharmaceutics: The Science of DosageForm Design, pp. 397–440. Ed. Aulton ME, Churchill Livingstone, Edinburgh, 2002
Allesø M, Rantanen J, Aaltonen J, Cornett C, van den Berg F: Solvent subset selectionfor polymorph screening. J Chemometr 22: 621–631, 2008
Amigo JM, Ravn C: Direct quantification and distribution assessment of major andminor components in pharmaceutical tablets by NIR-chemical imaging. Eur J PharmSci 37: 76–82, 2009
Andersen C, Bro R: Practical aspects of PARAFAC modeling of fluorescenceexcitation-emission data. J Chemometr 17: 200–215, 2003
Andersson M, Ringberg A, Gustafsson C: Multivariate methods in tablet formula-tion suitable for early drug development: Predictive models from a screening designof several linked responses. Chemometr Intell Lab 87: 125–130, 2007

104
Bakeev KA: Preface. In: Process Analytical Technology: Spectroscopic Tools andImplementation Strategies for the Chemical and Pharmaceutical Industries, pp. 15.Ed. Bakeev KA, Blackwell Publishing Ltd, 2005
Balboni M: Process Analytical Technology: Concepts and principles. Pharm TechOctober, 2003
Baxter J, Kukura J, Muzzio F: Hydrodynamics-induced variability in the USP appa-ratus II dissolution test. Int J Pharm 292: 17–28, 2005
Berntsson O, Danielsson L, Johansson M, Folestad S: Quantitative determination ofcontent in binary powder mixtures using diffuse reflectance near infrared spectrom-etry and multivariate analysis. Anal Chim Acta 419: 45–54, 2000
Berntsson O, Danielsson L, Lagerholm B, Folestad S: Quantitative in-line monitor-ing of powder blending by near infrared reflection spectroscopy. Powder Technol123: 185–193, 2002
Bin A, Warych J, Komorowski R: The batch granulation process in a fluidised bed.Powder Technol 41: 1–11, 1985
Blanco M, Alcala M: Use of Near-Infrared Spectroscopy for Off-Line Measurementsin the Pharmaceutical Industry. In: Process Analytical Technology: SpectroscopicTools and Implementation Strategies for the Chemical and Pharmaceutical Indus-tries, pp. 362–391. Ed. Bakeev KA, Blackwell Publishing Ltd, 2005
Blanco M, Alcala M, Gonzalez JM, Torrasz E: A process analytical technology ap-proach based on near infrared spectroscopy: Tablet hardness, content uniformity,and dissolution test measurements of intact tablets. J Pharm Sci 95: 2137–2144, 2006
Blanco M, Alcala M: Content uniformity and tablet hardness testing of intact phar-maceutical tablets by near infrared spectroscopy - A contribution to process analyt-ical technologies. Anal Chim Acta 557: 353–359, 2006
Brereton RG: Chemometrics: Data analysis for the laboratory and chemical plant.John Wiley & Sons Ltd, 2003
Brereton RG: Applied chemometrics for scientists. John Wiley & Sons Ltd, 2007
Bro R: Multiway calibration. Multilinear PLS. J Chemometr 10: 47–61, 1996
Bro R: PARAFAC. Tutorial and applications. Chemometr Intell Lab 38: 149–171, 1997
Bro R: Multi-way analysis in the food industry. PhD thesis, University of Amster-dam, 1998. Thesis/Dissertation
Bro R: Exploratory study of sugar production using fluorescence spectroscopy andmulti-way analysis. Chemometr Intell Lab 46: 133–147, 1999
Bro R, Andersson C, Kiers H: PARAFAC2 - Part II. Modeling chromatographic datawith retention time shifts. J Chemometr 13: 295–309, 1999

105
Bro R, Kiers H: A new efficient method for determining the number of componentsin PARAFAC models. J Chemometr 17: 274–286, 2003
Bro R, Smilde A: Centering and scaling in component analysis. J Chemometr 17:16–33, 2003
Bro R: Multivariate calibration - What is in chemometrics for the analytical chemist?Anal Chim Acta 500: 185–194, 2003
Bro R: Review on multiway analysis in chemistry - 2000-2005. Crit Rev Anal Chem36: 279–293, 2006
Bro R, Kjeldahl K, Smilde A, Kiers H: Cross-validation of component models: Acritical look at current methods. Anal Bioanal Chem 390: 1241–1251, 2008
Bro R, Qannari EM, Kiers HA, Naes T, Frost MB: Multi-way models for sensoryprofiling data. J Chemometr 22(1-2): 36–45, 2008
Bro R, Elden L: PLS works. J Chemometr 23: 69–71, 2009
Bro R: Some chemometric tricks. What to do and what not to do. In: The 11th Scan-dinavian Symposium on Chemometrics. Norway, 2009. Plenary lecture
Cameron I, Wang F, Immanuel C, Stepanek F: Process systems modelling and appli-cations in granulation: A review. Chem Eng Sci 60: 3723–3750, 2005
Carney S: How can we avoid the productivity gap? Drug Discov Today 10: 1011 –1013, 2005
Chalus P, Roggo Y, Walter S, Ulmschneider M: Near-infrared determination of activesubstance content in intact low-dosage tablets. Talanta 66: 1294–1302, 2005
Chan K, Elkhider N, Kazarian S: Spectroscopic imaging of compacted pharmaceu-tical tablets. Chem Eng Res Des 83: 1303–1310, 2005
Chen Y, Thosar S, Forbess R, Kemper M, Rubinovitz R, Shukla A: Prediction ofdrug content and hardness of intact tablets using artificial neural network and near-infrared spectroscopy. Drug Dev Ind Pharm 27: 623–631, 2001
Chiang LH, Colegrove LF: Industrial implementation of on-line multivariate qualitycontrol. Chemometr Intell Lab 88: 143–153, 2007
Clarke F: Extracting process-related information from pharmacetical dosage formsusing near infrared microscopy. Vib Spectrosc 34: 25–35, 2004
Cogdill R, Anderson C, Delgado-Lopez M, Molseed D, Chisholm R, Bolton R, Herk-ert T, Afnan A, Drennen J: Process analytical technology case study part I: Feasibilitystudies for quantitative near-infrared method development. AAPS Pharm Sci Tech6: 262–272, 2005
Cook J: The five steps to starting PAT. Pharm Tech March 1, 2007

106
Costa F, Sousa J, Pais A, Formosinho S: Comparison of dissolution profiles ofIbuprofen pellets. J Control Release 89: 199–212, 2003
Costa P, Manuel J, Lobo S: Modeling and comparison of dissolution profiles. Eur JPharm Sci 13: 123–133, 2001
Cournoyer A, Simard J, Cartilier L, Abatzoglou N: Quality control of multi-component, intact pharmaceutical tablets with three different near-infrared appa-ratuses. Pharm Dev Technol 13: 333–343, 2008
Crivori P, Cruciani G, Carrupt P, Testa B: Predicting blood-brain barrier permeationfrom three-dimensional molecular structure. J Med Chem 43: 2204–2216, 2000
Cruciani G, Pastor M, Guba W: VolSurf: a new tool for the pharmacokinetic opti-mization of lead compounds. Eur J Pharm Sci 11: 29–39, 2000
Dahl CK, Esbensen KH: Image analytical determination of particle size distributioncharacteristics of natural and industrial bulk aggregates. Chemometr Intell Lab 89:9–25, 2007
Damiani P, Escandar G, Olivieri A, Goicoechea H: Multivariate calibration: A pow-erful tool in pharmaceutical analysis. Curr Pharm Anal 1: 145–154, 2005
Daszykowski M, Kaczmarek K, Vander Heyden Y, Walczak B: Robust statistics indata analysis -Basic concepts. Chemom Intell Lab 85: 203–219, 2007
De Beer T, Bodson C, Dejaegher B, Walczak B, Vercruysse P, Burggraeve A, LemosA, Delattre L, Heyden YV, Remon J, Vervaete C, Baeyens W: Raman spectroscopyas a process analytical technology (PAT) tool for the in-line monitoring and under-standing of a powder blending process. J Pharmaceut Biomed 48: 772–779, 2008
Dinc E, Serin C, Tugcu-Demiroz F, Doganay T: Dissolution and assaying of mul-ticomponent tablets by chemometric methods using computer-aided spectropho-tometer. Int J Pharm 250: 339–350, 2003
Doherty S, Kettler C: On-Line Applications in the Pharmaceutical Industry. In: Pro-cess Analytical Technology: Spectroscopic Tools and Implementation Strategies forthe Chemical and Pharmaceutical Industries, pp. 329–361. Ed. Bakeev KA, Black-well Publishing Ltd, 2005
Doherty SJ, Lange AJ: Avoiding pitfalls with chemometrics and PAT in the pharma-ceutical and biotech industries. TrAC-Trend Anal Chem 25: 1097–1102, 2006
Dokoumetzidis A, Macheras P: A century of dissolution research: From Noyes andWhitney to the Biopharmaceutics Classification System. Int J Pharm 321: 1–11, 2006
Donoso M, Ghaly E: Prediction of drug dissolution from tablets using near-infrareddiffuse reflectance spectroscopy as a nondestructive method. Pharm Dev Technol 9:247–263, 2004

107
van den Dries K, Vromans H: Relationship between inhomogeneity phenomena andgranule growth mechanisms in a high-shear mixer. Int J Pharm 247: 167–177, 2002
Dziki W: Process Analytical Technology in Product Development and its Impact onPre-approval Inspections. American Pharmaceutical Review 11: 12–22, 2008
Eigenvector: PLS toolbox 4.0. 2006. www.eigenvector.com
El-Hagrasy A, Morris H, D’Amico F, Lodder R, Drennen J: Near-infrared spec-troscopy and imaging for the monitoring of powder blend homogeneity. J PharmSci 90: 1298–1307, 2001
El-Hagrasy A, D’Amico F, Drennen J: A process analytical technology approach tonear-infrared process control of pharmaceutical powder blending. Part I: D-optimaldesign for characterization of powder mixing and preliminary spectral data evalu-ation. J Pharm Sci 95: 392–406, 2006a
El-Hagrasy A, Delgado-Lopez M, Drennen J: A process analytical technology ap-proach to near-infrared process control of pharmaceutical powder blending: Part II:Qualitative near-infrared models for prediction of blend homogeneity. J Pharm Sci95: 407–421, 2006b
El-Hagrasy A, Drennen J: A process analytical technology approach to near-infraredprocess control of pharmaceutical powder blending. Part III: Quantitative near-infrared calibration for prediction of blend homogeneity and characterization ofpowder mixing kinetics. J Pharm Sci 95: 422–434, 2006c
Ergon R: Re-interpretation of NIPALS results solves PLSR inconsistency problem. JChemometr 23: 72–75, 2009
Esbensen K, Geladi P: The start and early history of Chemometrics - Selected inter-views. Part 2. J Chemometr 4: 389–412, 1990
Faure A, York P, Rowe RC: Process control and scale-up of pharmaceutical wet gran-ulation processes: a review. Eur J Pharm Biopharm 52: 269 – 277, 2001
Ferraro M, Castellano P, Kaufman T: Chemometrics-assisted simultaneous determi-nation of atenolol and chlorthalidone in synthetic binary mixtures and pharmaceu-tical dosage forms. Anal Bioanal Chem 377: 1159–1164, 2003
Frake P, Greenhalgh D, Grierson S, Hempenstall J, Rudd D: Process control andend-point determination of a fluid bed granulation by application of near infra-redspectroscopy. Int J Pharm 151: 75–80, 1997
Freitas M, Sabadin A, Silva L, Giannotti F, do Couto D, Tonhi E, Medeiros R, CocoG, Russo V, Martins J: Prediction of drug dissolution profiles from tablets using NIRdiffuse reflectance spectroscopy: A rapid and nondestructive method. J PharmaceutBiomed 39: 17–21, 2005
Fung KY, Ng KM, Nakajima S, Wibowo C: A systematic iterative procedure for de-termining granulator operating parameters. AIChE J 52: 3189–3202, 2006

108
Gabrielsson J, Lindberg N, Lundstedt T: Multivariate methods in pharmaceuticalapplications. J Chemometr 16: 141–160, 2002
Gabrielsson J, Sjostrom M, Lindberg N, Pihl A, Lundstedt T: Multivariate methodsin the development of a new tablet formulation: Excipient mixtures and principalproperties. Drug Dev Ind Pharm 32: 7–20, 2006
Gao J, Jain A, Motheram R, Gray D, Hussain M: Fluid bed granulation of a poorlywater soluble, low density, micronized drug: comparison with high shear granula-tion. Int J Pharm 237: 1–14, 2002
Garca-Mu noz S, Kourti T, MacGregor J, Mateos A, Murphy G: Troubleshootingof an industrial batch process using multivariate methods. Ind Eng Chem Res 42:3592–3601, 2003
Geladi P, Esbensen K: The start and early history of Chemometrics: Selected inter-views. Part 1. J Chemometr 4: 337–354, 1990
Geladi P, Forsstrom J: Monitoring, of a batch organic synthesis by near-infraredspectroscopy: modeling and interpretation of three-way data. J Chemometr 16: 329–338, 2002
Gendrin C, Roggo Y, Collet C: Content uniformity of pharmaceutical solid dosageforms by near infrared hyperspectral imaging: A feasibility study. Talanta 73: 733–741, 2007
Gendrin C, Roggo Y, Collet C: Pharmaceutical applications of vibrational chemicalimaging and chemometrics: A review. J Pharmaceut Biomed 48: 533–553, 2008
Golbraikh A, Tropsha A: Beware of q(2)! J Mol Graph Model 20: 269–276, 2002
Gottfries J, Depui H, Fransson M, Jongeneelen M, Josefson M, Langkilde F, WitteD: Vibrational spectrometry for the assessment of active substance in metoprololtablets: A comparison between transmission and diffuse reflectance near-infraredspectrometry. J Pharmaceut Biomed 14: 1495–1503, 1996
Gowen A, O’Donnell C, Cullen P, Bell S: Recent applications of chemical imaging topharmaceutical process monitoring and quality control. Eur J Pharm Biopharm 69:10–22, 2008
Graffner C: Regulatory aspects of drug dissolution from a European perspective.Eur J Pharm Sci 29: 288–293, 2006
Gray V: Challenges to the dissolution test including equipment calibration. PharmTech 1: February, 2006
Gray V, Kelly G, Xia M, Butler C, Thomas S, Mayock S: The Science of USP 1 and2 Dissolution: Present Challenges and Future Relevance. Pharm Res 26: 1289–1302,2009

109
Gray V: Future directions for dissolution testing in the pharmaceutical industry. Dis-solution Technologies 3: 13–14, August 2004
Grover M, Singh B, M B, Singh S: Quantitative structure-property relationships inpharmaceutical research - Part 1. Pharmaceut Sci Tech Today 3: 28–35, 2000a
Grover M, Singh B, M B, Singh S: Quantitative structure-property relationships inpharmaceutical research - Part 2. Pharmaceut Sci Tech Today 3: 50–57, 2000b
Halstensen M, de Bakker P, Esbensen KH: Acoustic chemometric monitoring of anindustrial granulation production process - a PAT feasibility study. Chemometr In-tell Lab 84: 88–97, 2006
Hansuld EM, Briens L, McCann JAB, Sayani A: Audible acoustics in high-shear wetgranulation: Application of frequency filtering. Int J Pharm 378: 37–44, 2009
Hardy IJ, Cook WG: Predictive and correlative techniques for the design, optimisa-tion and manufacture of solid dosage forms. J Pharm Pharmacol 55: 3–18, 2003
Haware RV, Tho I, Bauer-Brandl A: Application of multivariate methods to com-pression behavior evaluation of directly compressible materials. Eur J Pharm Bio-pharm 72: 148–155, 2009a
Haware RV, Tho I, Bauer-Brandl A: Multivariate analysis of relationships betweenmaterial properties, process parameters and tablet tensile strength for alpha-lactosemonohydrates. Eur J Pharm Biopharm 73: 424–431, 2009b
Hemati A, Cherif R, Saleh K, Pont V: Fluidized bed coating and granulation: in-fluence of process-related variables and physicochemical properties on the growthkinetics. Powder Technol 130: 18–34, 2003
Hibbert DB, Minkkinen P, Faber NM, Wise BM: IUPAC project: A glossary of con-cepts and terms in chemometrics. Anal Chim Acta 642: 3–5, 2009
Höskuldsson A: Prediction methods in science and technology. Thor Publishing,1996
Höskuldsson A: Variable and subset selection in PLS regression. Chemometr IntellLab 55: 23–38, 2001
Höskuldsson A: Selection of subsets of variables in linear regression. Homepage ofChemometrics November, 2003
Huang J, Kaul G, Cai C, Chatlapalli R, Hernandez-Abad P, Ghosh K, Nagi A: Qualityby design case study: An integrated multivariate approach to drug product andprocess development. Int J Pharm 382: 23–32, 2009
Hughes B: 2008 FDA drug approvals. Nat Rev Drug Discov 8: 93–96, February 2009
Huuskonen J, Rantanen J, Livingstone D: Prediction of aqueous solubility for a di-verse set of organic compounds based on atom-type electrotopological state indices.Eur J Med Chem 35: 1081–1088, 2000

110
Hwang R, Kowalski D: Design of experiments for formulation development. PharmTech December, 2005
ICH Q8(R2): Pharmaceutical Development. International Conference of Harmoni-sation. 2009. www.ich.org
Iveson S, Litster J, Hapgood K, Ennis B: Nucleation, growth and breakage phenom-ena in agitated wet granulation processes: a review. Powder Technol 117: 3–39, 2001
Jiji R, Cooper G, Booksh K: Excitation-emission matrix fluorescence based determi-nation of carbamate pesticides and polycyclic aromatic hydrocarbons. Anal ChimActa 397: 61–72, 1999
Johansson J, Pettersson S, Folestad S: Characterization of different laser irradiationmethods for quantitative Raman tablet assessment. J Pharmaceut Biomed 39: 510–516, 2005
Jørgensen A, Rantanen J, Luukkonen P, Laine S, Yliruusi J: Visualization of a phar-maceutical unit operation: Wet granulation. Anal Chem 76: 5331–5338, 2004
de Juan A, Tauler R, Dyson R, Marcolli C, Rault M, Maeder M: Spectroscopic imag-ing and chemometrics: a powerful combination for global and local sample analysis.TrAC-Trend Anal Chem 23: 70–79, 2004
Kalivas J: Multivariate calibration, an overview. Anal Lett 38: 2259–2279, 2005
Kiers H, Ten Berge J, Bro R: PARAFAC2 - Part I. A direct fitting algorithm for thePARAFAC2 model. J Chemometr 13: 275–294, 1999
Kirsch J, Drennen J: Nondestructive tablet hardness testing by near-infrared spec-troscopy: a new and robust spectral best-fit algorithm. J Pharmaceut Biomed 19:351–362, 1999
Knight P: Challenges in granulation technology. Powder Technol 140: 156–162, 2004
Kohonen T: Self-Organizing Maps, 3rd ed. Springer-Verlag, 2001
Koikkalainen P: Progress with the tree-structured self-organizing map. In: Proceed-ings of the 11th European Conference on Artificial Intelligence, pp. 211–215. Ed.Cohn A, Wiley & Sons, 1994
Kolehmainen M: Data exploration with self-organizing maps in environmental in-formatics and bioinformatics. PhD thesis, University of Kuopio, 2004. ISBN 951-781-305-8
Korhonen O, Matero S, Poso A, Ketolainen J: Partial least square projections to la-tent structures analysis (PLS) in evaluating and predicting drug release from starchacetate matrix tablets. J Pharm Sci 94: 2716–2730, 2005
Kourti T, Nomikos P, JF M: Analysis, monitoring and fault diagnosis of batch pro-cess using multiblock and multiway PLS. J Proc Cont 5: 277–284, 1995

111
Kourti T: Process analysis and abnormal situation detection: from theory to practise.IEEE Contr Syst Mag 22: 10–25, 2002
Kourti T: Multivariate dynamic data modeling for analysis and statistical processcontrol of batch processes, start-ups and grade transitions. J Chemometr 17: 93–109,2003a
Kourti T: Abnormal situation detection, three-way data and projection methods;robust data archiving and modeling for industrial applications. Annu Rev Control27: 131–139, 2003b
Kourti T: Process analytical technology beyond real-time analyzers: The role of mul-tivariate analysis. Crit Rev Anal Chem 36: 257–278, 2006
Kourti T: The process analytical technology initiative and multivariate process anal-ysis, monitoring and control. Anal Bioanal Chem 384: 1043–1048, 2006
Kourti T: Quality by design in the pharmaceutical industry: The role of multivariateanalysis. American Pharmaceutical Review 12: 118–123, 2009
Lai C, Holt D, Leung J, Cooney C, Raju G, Hansen P: Real time and noninvasivemonitoring of dry powder blend homogeneity. AIChE J 47: 2618–2622, 2001
Laitinen N, Rantanen J, Laine S, Antikainen O, Rasanen E, Airaksinen S, YliruusiJ: Visualization of particle size and shape distributions using self-organizing maps.Chemometr Intell Lab 62: 47–60, 2002
Laitinen N, Antikainen O, Rantanen J, Yliruusi J: New perspectives for visual char-acterization of pharmaceutical solids. J Pharm Sci 93: 165–176, 2004
Leardi R, Norgaard L: Sequential application of backward interval partial leastsquares and genetic of relevant spectral regions. J Chemometr 18: 486–497, 2004
Lee T, Lin S: Microspectroscopic FT-IR mapping system as a tool to assess blendhomogeneity of drug-excipient mixtures. Eur J Pharm Sci 23: 117–122, 2004
Leuenberger H: New trends in the production of pharmaceutical granules: batchversus continuous processing. Eur J Pharm Biopharm 52: 289–296, 2001a
Leuenberger H: New trends in the production of pharmaceutical granules: the clas-sical batch concept and the problem of scale-up. Eur J Pharm Biopharm 52: 279–288,2001b
Leuenberger H, Lanz M: Pharmaceutical powder technology - from art to science:the challenge of the FDA’s Process Analytical Technology initiative. Adv PowderTechnol 16: 3–25, 2005
Leuenberger H, Puchkov M, Krausbauer E, Betz G: Manufacturing pharmaceuticalgranules: Is the granulation end-point a myth? Powder Technol 189: 141–148, 2009

112
Lewis E, Schoppelrei J, Lee E, Kidder L: Near-Infrared Chemical Imaging as a Pro-cess Analytical Tool. In: Process Analytical Technology: Spectroscopic Tools and Im-plementation Strategies for the Chemical and Pharmaceutical Industries, pp. 187–225. Ed. Bakeev KA, Blackwell Publishing Ltd, 2005
Lin B, Recke B, Kundsen J, Jørgensen S: A systematic approach for soft sensor de-velopment. Comput Chem Eng 31: 419–425, 2007
Lionberger RA, Lee SL, Lee L, Raw A, Yu LX: Quality by design: Concepts for AN-DAs. AAPS J 10: 268–276, 2008
Litster J: Scaleup of wet granulation processes: science not art. Powder Technol 130:35–40, 2003
Lundstedt T, Seifert E, Abramo L, Thelin B, Nystrom A, Pettersen J, Bergman R:Experimental design and optimization. Chemometr Intell Lab 42: 3–40, 1998
Luukkonen P, Fransson M, Bjorn IN, Hautala J, Lagerholm B, Folestad S: Real-timeassessment of granule and tablet properties using in-line data from a high-sheargranulation process. J Pharm Sci 97: 950–959, 2008
Luypaert J, Massart DL, Heyden YV: Near-infrared spectroscopy applications inpharmaceutical analysis. Talanta 72: 865–883, 2007
Ma H, Anderson CA: Characterization of pharmaceutical powder blends by NIRchemical imaging. J Pharm Sci 97: 3305–3320, 2008
Maggio RM, Castellano PM, Kaufman TS: A new principal component analysis-based approach for testing "similarity" of drug dissolution profiles. Eur J Pharm Sci34: 66–77, 2008
Manallack D, Livingstone D: Neural networks in drug discovery: have they livedup to their promise? Eur J Med Chem 34: 195–208, 1999
Mannhold R, Berellini G, Carosati E, Benedetti P: Use of MIF-based VolSurf De-scriptors in Physicochemical and Pharmacokinetic Studies. In: Molecular Interac-tion Fields, pp. 173–196. Ed. Cruciani G, Wiley, Weinheim, 2006
Markopoulou C, Malliou E, Koundourellis J: Application of two chemometric meth-ods for the determination of imipramine, amitriptyline and perphenazine in contentuniformity and drug dissolution studies. J Pharmaceut Biomed 37: 249–258, 2005
Martens H, Martens M: Multivariate Analysis of Quality: An Introduction. JohnWiley & Sons, Ltd, 2001
Martens H: Reliable and relevant modelling of real world data: a personal accountof the development of PLS Regression. Chemometr Intell Lab 58: 85–95, 2001
Massart D, Vandeginste B, Buydens L, De Jong S, Lewi P, Smeyers-Verbeke J: Hand-book of chemometrics and qualimetrics: Part A. Elsevier, 1997

113
Matero S, Reinikainen SP, Ketolainen J, Poso A: Estimation of compatibility of drugand starch acetate to form a sustainable matrix tablet with a desired drug releaseprofile. In: 11th Conference on Chemoemtrics in Analytical Chemistry. France, 2008.Poster
Matero S, Reinikainen SP, Lahtela-Kakkonen M, Korhonen O, Ketolainen J, A P: Es-timation of drug release profiles of heterogeneous drugs from starch acetate matrixtablet using molecular descriptors. J Chemometr 22: 653–660, 2008
McCormick D: Evolutions in direct compression. Pharm Technol April 2005
McGoverin CM, Rades T, Gordon KC: Recent Pharmaceutical Applications of Ra-man and Terahertz Spectroscopies. J Pharm Sci 97: 4598–4621, 2008
Meng X, Morris A, Martin E: On-line monitoring of batch processes using aPARAFAC representation. J Chemometr 17: 65–81, 2003
Miller C: The use of chemometric techniques in process analytical method develop-ment and operation. Chemom Intell Lab 30: 11–22, 1995
Miller C: Chemometrics in Process Analytical Chemistry. In: Process AnalyticalTechnology: Spectroscopic Tools and Implementation Strategies for the Chemicaland Pharmaceutical Industries, pp. 226–328. Ed. Bakeev KA, Blackwell PublishingLtd, 2005
Miller M: Chemical database techniques in drug discovery. Nat Rev Drug Discov 1:220–227, 2002
Milletti F, Storchi L, Sforna G, Cruciani G: New and original pK(a) predictionmethod using grid molecular interaction fields. J Chem Inf Model 47: 2172–2181,2007
Moberg L, Robertsson G, Karlberg B: Spectrofluorimetric determination of chloro-phylls and pheopigments using parallel factor analysis. Talanta 54: 161–170, 2001
Molecular Discovery Ltd: Volsurf version 4.1.4. 2004. www.moldiscovery.com
Morisseau K, Rhodes C: Near-infrared spectroscopy as a nondestructive alternativeto conventional tablet hardness testing. Pharm Res 14: 108–111, 1997
Morris K, Nail S, Peck G, Byrn S, Griesser U, Stowell J, Hwang S, Park K: Advancesin pharmaceutical materials and processing. Pharmaceut Sci Tech Today 1: 235–245,1998
Munson J, Stanfield CF, Gujral B: A review of process analytical technology (PAT)in the US pharmaceutical industry. Curr Pharm Anal 2: 405–414, 2006
Muzzio F, Robinson P, Wightman C, Brone D: Sampling practices in powder blend-ing. Int J Pharm 155: 153–178, 1997

114
Muzzio F, Shinbrot T, Glasser B: Powder technology in the pharmaceutical industry:the need to catch up fast. Powder Technol 124: 1–7, 2002
Muzzio F, Goodridge C, Alexander A, Arratia P, Yang H, Sudah O, Mergen G: Sam-pling and characterization of pharmaceutical powders and granular blends. Int JPharm 250: 51–64, 2003
Norgaard L, Saudland A, Wagner J, Nielsen J, Munck L, Engelsen S: Interval partialleast-squares regression (iPLS): A comparative chemometric study with an examplefrom near-infrared spectroscopy. Appl Spectrosc 54: 413–419, 2000
O’Hara T, Dunne A, Butler J, Devane J: A review of methods used to compare dis-solution profile data. Pharmaceut Sci Tech Today 1: 214–223, 1998
Olivieri A: Analytical advantages of multivariate data processing. One, two, three,infinity? Anal Chem 80: 5713–5720, 2008
Otsuka M, Yamane I: Prediction of tablet hardness based on near infrared spectra ofraw mixed powders by chemometrics. J Pharm Sci 95: 1425–1433, 2006
Otsuka M, Tanabe H, Osaki K, Otsuka K, Ozaki Y: Chemoinformetrical evaluation ofdissolution property of indomethacin tablets by near-infrared spectroscopy. J PharmSci 96: 788–801, 2007
Otsuka M, Yamane I: Prediction of Tablet Properties Based on Near Infrared Spectraof Raw Mixed Powders by Chemometrics: Scale-Up Factor of Blending and Tablet-ing Processes. J Pharm Sci 98: 4296–4305, 2009
Paakkunainen M, Matero S, Ketolainen J, Lahtela-Kakkonen M, Poso A, ReinikainenSP: Uncertainty in dissolution test of drug release. Chemometr Intell Lab 97: 82–90,2009
Pajander J, Soikkeli AM, Korhonen O, Forbes RT, Ketolainen J: Drug release phe-nomena within a hydrophobic starch acetate matrix: FTIR mapping of tablets afterin vitro dissolution testing. J Pharm Sci 97: 3367–3378, 2008
Pajander J, Korhonen O, Laamanen M, Ryynnen E, Grimsey I, van Veen B, Keto-lainen J: Effect of formulation parameters and drug-polymer interactions on drugrelease from starch acetate matrix tablets. J Pharm Sci 98: 3676–3690, 2009
Papp M, Pujara C, Pinal R: Monitoring of high-shear granulation using acousticemission: Predicting granule properties. J Pharm Innov 3: 113–122, 2008
Peterson JJ, Snee RD, McAllister PR, Schoffeld TL, Carella AJ: Statistics in Pharma-ceutical Development and Manufacturing. J Qual Technol 41: 111–134, 2009
Pretsch E, Wilkins C: Use and abuse of chemometrics. TrAC Trend Anal Chem 25,2006
Qin S: Statistical process monitoring: basics and beyond. J Chemometr 17: 480–502,2003

115
Rajko R, Nassab P, Szabo-Revesz P: Self-modeling curve resolution method appliedfor the evaluation of dissolution testing data: A case study of meloxicam-mannitolbinary systems. Talanta 79: 268–274, 2009
Rantanen J, Rasanen E, Antikainen O, Mannermaa J, Yliruusi J: In-line moisturemeasurement during granulation with a four-wavelength near-infrared sensor: anevaluation of process-related variables and a development of non-linear calibrationmodel. Chemometr Intell Lab 56: 51–58, 2001
Rantanen J, Jørgensen A, Rasanen E, Luukkonen P, Airaksinen S, Raiman J, Han-ninen K, Antikainen O, Yliruusi J: Process Analysis of Fluidized Bed Granulation.AAPS Pharm Sci Tech 2: 21, 2001
Rantanen J, Laine S, Antikainen O, Mannermaa J, Simula O, Yliruusi J: Visualizationof fluid-bed granulation with self-organizing maps. J Pharmaceut Biomed 24: 343–352, 2001
Rantanen J, Wikstrom H, Turner R, Taylor L: Use of in-line near-infrared spec-troscopy in combination with chemometrics for improved understanding of phar-maceutical processes. Anal Chem 77: 556–563, 2005
Rathore A, Saleki-Gerhardt A, Montgomery S, Tyler S: Quality by Design: Indus-trial Case Studies on Defining and Implementing Design Space for PharmaceuticalProcesses Part 2. Biopharm Int 22: 36+, 2009
Ravn C, Skibsted E, Bro R: Near-infrared chemical imaging (NIR-CI) on pharmaceu-tical solid dosage forms-Comparing common calibration approaches. J PharmaceutBiomed 48: 554–561, 2008
Reich G: Near-infrared spectroscopy and imaging: Basic principles and pharmaceu-tical applications. Adv Drug Deliver Rev 57: 1109–1143, 2005
Reinikainen S, Hoskuldsson A: COVPROC method: strategy in modeling dynamicsystems. J Chemometr 17: 130–139, 2003
Rinnan A, Riu J, Bro R: Multi-way prediction in the presence of uncalibrated inter-ferents. J Chemometr 21: 76–86, 2007
Rinnan A, van den Berg F, Engelsen SB: Review of the most common pre-processingtechniques for near-infrared spectra. TrAC Trend Anal Chem 28: 1201–1222, 2009
Roggo Y, Jent N, Edmond A, Chalus P, Ulmschneider M: Characterizing processeffects on pharmaceutical solid forms using near-infrared spectroscopy and infraredimaging. Eur J Pharm Biopharm 61: 100–110, 2005
Roggo Y, Chalus P, Maurer L, Lema-Martinez C, Edmond A, Jent N: A review of nearinfrared spectroscopy and chemometrics in pharmaceutical technologies. J Pharma-ceut Biomed 44: 683–700, 2007
Sarraguca MC, Lopes JA: Quality control of pharmaceuticals with NIR: From lab toprocess line. Vib Spectrosc 49: 204–210, 2009

116
Sasic S: Raman mapping of low-content API pharmaceutical formulations. I. Map-ping of alprazolam in Alprazolam/Xanax tablets. Pharm Res 24: 58–65, 2007
Schneider G: Neural networks are useful tools for drug design. Neural Netw 13:15–16, 2000
Scott P: Process analytical technology: Applications to the pharmaceutical industry.Dissolution Technologies 9: August, 2002
Sekulic S, Wakeman J, Doherty P, Hailey P: Automated system for the on-line mon-itoring of powder blending processes using near-infrared spectroscopy - Part II.Qualitative approaches to blend evaluation. J Pharmaceut Biomed 17: 1285–1309,1998
Shah N: Pharmaceutical supply chains: key issues and strategies for optimisation.Comput Chem Eng 28: 929–941, 2004
Shah RB, Tawakkul MA, Khan MA: Process analytical technology: Chemometricanalysis of Raman and near infra-red spectroscopic data for predicting physicalproperties of extended release matrix tablets. J Pharm Sci 96: 1356–1365, 2007
Shi Z, Cogdill RP, Short SM, Anderson CA: Process characterization of powderblending by near-infrared spectroscopy: Blend end-points and beyond. J Pharma-ceut Biomed 47: 738–745, 2008
Short SM, Cogdill RP, Wildfong PLD, DrennenIII JK, Anderson CA: A Near-InfraredSpectroscopic Investigation of Relative Density and Crushing Strength in Four-Component Compacts. J Pharm Sci 98: 1095–1109, 2009
Siepmann J, Siepmann F: Mathematical modeling of drug delivery. Int J Pharm 364:328–343, 2008
da Silva J, Leitao J, Costa F, Ribeiro J: Detection of verapamil drug by fluorescenceand trilinear decomposition techniques. Anal Chim Acta 453: 105–115, 2002
Skibsted E: PAT and beyond. PhD thesis, University of Amsterdam, 2005. The-sis/Dissertation
Skibsted E, Boelens H, Westerhuis J, Witte D, Smilde A: Simple assessment of homo-geneity in pharmaceutical mixing processes using a near-infrared reflectance probeand control charts. J Pharmaceut Biomed 41: 26–35, 2006
Skibsted E, Westerhuis J, Smilde A, Witte D: Examples of NIR based real time releasein tablet manufacturing. J Pharmaceut Biomed 43: 1297–1305, 2007
Smilde A: Comments on three-way analyses used for batch process data. JChemometr 15: 19–27, 2001
Smilde A, Bro R, P G: Multi-way analysis with applications in the chemical sciences.John Wiley & Sons Ltd, 2005

117
Stedmon C, Markager S, Bro R: Tracing dissolved organic matter in aquatic environ-ments using a new approach to fluorescence spectroscopy. Mar Chem 82: 239–254,2003
Suihko E, Forbes R, Korhonen O, Ketolainen J, Paronen P, Gynther J, Poso A: Pre-diction of contact angle for pharmaceutical solids from their molecular structure. JPharm Sci 94: 745–758, 2005
Sulub Y, LoBrutto R, Vivilecchia R, Wabuyele BW: Content uniformity determina-tion of pharmaceutical tablets using five near-infrared reflectance spectrometers: Aprocess analytical technology (PAT) approach using robust multivariate calibrationtransfer algorithms. Anal Chim Acta 611: 143–150, 2008
Sulub Y, LoBrutto R, Vivilecchia R, Wabuyele B: Near-infrared multivariate calibra-tion updating using placebo: A content uniformity determination of pharmaceuticaltablets. Vib Spectrosc 46: 128–134, 2008
Sulub Y, Wabuyele B, Gargiulo P, Pazdan J, Cheney J, Berry J, Gupta A, Shah R,Wu H, Khan M: Real-time on-line blend uniformity monitoring using near-infraredreflectance spectrometry: A noninvasive off-line calibration approach. J PharmaceutBiomed 49: 48–54, 2009
Sun Y, Peng Y, Chen Y, Shukla A: Application of artificial neural networks in thedesign of controlled release drug delivery systems. Adv Drug Deliver Rev 55: 1201–1215, 2003
Tabasi S, Fahmy R, Bensley D, O’Brien C, Hoag S: Quality by design, part I: Appli-cation of NIR spectroscopy to monitor tablet manufacturing process. J Pharm Sci 97:4040–4051, 2008
Tarvainen M, Sutinen R, Somppi M, Paronen P, Poso A: Predicting plasticization ef-ficiency from three-dimensional molecular structure of a polymer plasticizer. PharmRes 18: 1760–1766, 2001
Tatavarti A, Fahmy R, Wu H, Hussain A, Marnane W, Bensley D, Hollenbeck G,Hoag S: Assessment of NIR spectroscopy for nondestructive analysis of physicaland chemical attributes of sulfamethazine bolus dosage forms. AAPS Pharm SciTech 6: E91–E99, 2005
Thielmann F, Naderi M, Ansari MA, Stepanek F: The effect of primary particle sur-face energy on agglomeration rate in fluidised bed wet granulation. Powder Technol181: 160–168, 2008
Tong C, Souza S, Parker J, Mirza T: Commentary on AAPS workshop - Dissolutiontesting for the twenty-first century: Linking critical quality attributes and criticalprocess parameters to clinically relevant dissolution. Pharm Res 24: 1603–1607, 2007
Tsujimoto H, Yokoyama T, Huang C, Sekiguchi I: Monitoring particle fluidizationin a fluidized bed granulator with an acoustic sensor. Powder Technol 113: 88–96,2000
118
Twitchell A: Mixing. In: Pharmaceutics: The Science of Dosage Form Design, pp.181–196. Ed. Aulton ME, Churchill Livingstone, Edinburgh, 2002
U.S. Food and Drug Administration: PAT - A Framework for Innovative Pharma-ceutical Development, Manufacturing, and Quality Assurance. 2004. www.fda.gov
Vajna B, Farkas I, Szabo A, Zsigmond Z, Marosi G: Raman microscopic evaluationof technology dependent structural differences in tablets containing imipraminemodel drug. J Pharmaceut Biomed 51: 30–38, 2010
Vandeginste B, Massart D, Buydens L, De Jong S, Lewi P, Smeyers-Verbeke J: Hand-book of chemometrics and qualimetrics: Part B. Elsevier, 1998
Varma M, Kaushal A, Garg A, Garg S: Factors affecting mechanism and kinetics ofdrug release from matrix-based oral controlled drug delivery systems. Am J DrugDeliv 2: 43–57, 2004
van Veen B, Pajander J, Zuurman K, Lappalainen R, Poso A, Frijlink H, KetolainenJ: The effect of powder blend and tablet structure on drug release mechanisms ofhydrophobic starch acetate matrix tablets. Eur J Pharm Biopharm 61: 149–157, 2005
Vervaet C, Remon J: Continuous granulation in the pharmaceutical industry. ChemEng Sci 60: 3949–3957, 2005
Virtanen S, Antikainen O, Yliruusi J: Determination of the crushing strength of intacttablets using Raman spectroscopy. Int J Pharm 360: 40–46, 2008
Visipoint: Visual Data version 3.1.9. 2003. www.visipoint.fi
Wargo D, Drennen J: Near-infrared spectroscopic characterization of pharmaceuti-cal powder blends. J Pharmaceut Biomed 14: 1415–1423, 1996
Watano S, Miyanami K: Image-processing for online monitoring of granule size dis-tribution and shape on fluidized-bed granulation. Powder Technol 83: 55–60, 1995
Watano S: Direct control of wet granulation processes by image processing system.Powder Technol 117: 163–172, 2001
Wells J: Pharmaceutical preformulation: the physicochemical properties of drugsubstances. In: Pharmaceutics: The Science of Dosage Form Design, pp. 113–138.Ed. Aulton ME, Churchill Livingstone, Edinburgh, 2002
Westerhuis J, Coenegracht P, Lerk C: Multivariate modelling of the tablet manufac-turing process with wet granulation for tablet optimization and in-process control.Int J Pharm 156: 109–117, 1997
Westerhuis J: Multivariate statistical modelling of the pharmaceutical process ofwet granulation and tableting. PhD thesis, University of Groningen, 1997. The-sis/Dissertation

119
Westerhuis J, Kourti T, MacGregor J: Comparing alternative approaches for multi-variate statistical analysis of batch process data. J Chemometr 13: 397–413, 1999
Whitaker M, Baker G, Westrup J, Goulding P, Rudd D, Belchamber R, Collins M:Application of acoustic emission to the monitoring and end point determination ofa high shear granulation process. Int J Pharm 205: 79–91, 2000
Wiberg KH, Hultin UK: Multivariate chemometric approach to fiber-optic dissolu-tion testing. Anal Chem 78: 5076–5085, 2006
Willighagen E, Wehrens R, Buydens L: Molecular chemometrics. Crit Rev AnalChem 36: 189–198, 2006
Wise B, Gallagher N: The process chemometrics approach to process monitoringand fault detection. J Process Contr 6: 329–348, 1996
Wise B, Gallagher N, Martin E: Application of PARAFAC2 to fault detection anddiagnosis in semiconductor etch. J Chemometr 15: 285–298, 2001
Wold S, Sjöström M: Chemometrics, present and future success. Chemom Intell Lab44: 3–14, 1998
Wold S, Kettaneh N, Friden H, Holmberg A: Modelling and diagnostics of batchprocesses and analogous kinetic experiments. Chemom Intell Lab 44: 331–340, 1998
Wold S, Antti H, Lindgren F, Ohman J: Orthogonal signal correction of near-infraredspectra. Chemometr Intell Lab 44: 175–185, 1998
Wold S: Personal memories of the early PLS development. Chemometr Intell Lab58: 83–84, 2001
Wold S, Sjostrom M, Eriksson L: PLS-regression: a basic tool of chemometrics.Chemometr Intell Lab 58: 109–130, 2001
Wold S, Cheney J, Kettaneh N, McCready C: The chemometric analysis of point anddynamic data in pharmaceutical and biotech production (PAT) - some objectivesand approaches. Chemometr Intell Lab 84: 159–163, 2006
Workman J: The state of multivariate thinking for scientists in industry: 1980-2000.Chemometr Intell Lab 60: 13 – 23, 2002
WorkmanJr. J, Koch M, Veltkamp D: Process analytical chemistry. Anal Chem 79:4345–4363, 2007
Wu H, , Khan M, Hussain A: Process control perspective for process analytical tech-nology: Integration of chemical engineering practice into semiconductor and phar-maceutical industries. Chem Eng Comm 194, 2007
Wu H, Heilweil E, Hussain A, Khan M: Process analytical technology (PAT): Quan-tification approaches in terahertz spectroscopy for pharmaceutical application. JPharm Sci 97: 970–984, 2008

120
York P: The design of dosage forms. In: Pharmaceutics: The Science of Dosage FormDesign, pp. 1–12. Ed. Aulton ME, Churchill Livingstone, Edinburgh, 2002
Yu LX: Pharmaceutical quality by design: Product and process development, un-derstanding, and control. Pharm Res 25: 781–791, 2008
Zhang D, Flory J, Panmai S, Batra U, Kaufman M: Wettability of pharmaceuticalsolids: its measurement and influence on wet granulation. Colloids and Surfaces206: 547–554, 2002
Zhang L, Henson M, Sekulic S: Multivariate data analysis for Raman imaging of amodel pharmaceutical tablet. Anal Chim Acta 545: 262–278, 2005
Zupan J, Gasteiger J: Neural networks in chemistry and drug design. Wiley-VCH,Weinheim, Germany, 1999
Zuurman K, Maarschalk K, Bolhuis G: Effect of magnesium stearate on bonding andporosity expansion of tablets produced from materials with different consolidationproperties. Int J Pharm 179: 107–115, 1999

Publications of the University of Eastern Finland
Dissertations in Health Sciences
isbn 978-952-61-0142-2
Publications of the University of Eastern FinlandDissertations in Health Sciences
The main goal of this thesis was to
explore the tableting manufacturing
sub-processes utilizing chemomet-
rics. In the first part of this study,
the tablet quality was explored with
multivariate methods. In the second
part of this study, multi-way meth-
ods in conjunction with acoustic
emission data and process variables
from granulation process of tableting
material in fluidized bed granula-
tion have been exploited. This thesis
shows the feasibility and power of
multivariate data analysis in case of
evaluation of tablet development and
manufacturing unit operations.
dissertatio
ns | 016 | S
an
ni M
atero | C
hem
ometric M
ethod
s in P
harm
aceutical T
ablet Develop
men
t and M
anu
facturin
g Un
it...
Sanni Matero
Chemometric Methods inPharmaceutical Tablet
Development and Manufacturing Unit
Operations
Sanni Matero
Chemometric Methods inPharmaceutical Tablet Development and Manufacturing Unit Operations


