CHEMOMETRIC SCREENING AND OPTIMIZATION OF LIQUID CHROMATOGRAPHIC METHOD FOR SIMULTANEOUS DETERMINATION OF SEVEN ANTIHISTAMINES
SELVAKUMAR KANTHIAH*a, VALLIAPPAN KANNAPPAN
aDepartment of Pharmacy, Faculty of Engineering and Technology, Annamalai University, Annamalai Nagar, Tamil Nadu 608002, India Email: [email protected]
Received: 28 Mar 2016 Revised and Accepted: 17 May 2016
ABSTRACT
Objective: Chemometric optimization and validation of a HPLC method for the simultaneous determination of seven antihistamines viz., loratadine, fexofenadine, desloratadine, levocetirizine, doxylamine, promethazine and cinnarizine in bulk and their dosage form.
Methods: Analytes were separated on Phenomenex cyano column by using ACN: MeOH: NH4OAc buffer as a mobile phase and peaks were detected at 220 nm. Optimization was performed in three steps: initially, fractional factorial design experiments were employed to eliminate parameters which were having an insignificant effect on responses. Significant variables: %ACN, pH and flow rate were incorporated in the central composite design and as the response variables, the retention factor (k1), resolution (Rs) of all seven investigated substances and retention time of last eluted peak (tR7) were studied. Finally, Derringer’s desirability function a global optimization technique was utilized to obtain ideal chromatographic conditions for a best possible combination of separation and analysis time.
Results: The results were analyzed by using ANOVA for the establishment of an appropriate statistical relationship between the inputs and outputs. The predicted response values corresponding to the highest desirability value (D = 0.815) was selected. The optimized condition of %ACN: 19.88%v/v, pH: 4 and flow rate of 1 ml/min was obtained through global optimization procedure. While using proposed condition up to seven antihistamines were separated in the same chromatogram with good resolution.
Conclusion: The present study demonstrated the benefit of applying the chemometric approach in selecting optimum conditions for the simultaneous determinations of cited drugs in pharmaceutical formulations.
Drugs belonging to piperazine (levocetirizine, cinnarizine), piperidine (loratadine, desloratadine and fexofenadine), phenol-thiazine (promethazine) and pyridine (doxylamine) are generally classified as antihistamines (H1 antagonist). These antihistamines inhibit the action of histamine in the body by blocking the receptors of histamine and effectively relieve from the symptoms of colds, rhinoconjunctivitis, urticaria and other allergic diseases [1]. Some of them viz., cinnarizine and promethazine are used to handle motion sickness, nausea, and vomiting. Furthermore, drugs like levocetirizine, loratadine, desloratadine and fexofenadine are classified as Rx to OTC switches [2]. Antihistamines are widely used in pharmaceutical formulation viz., tablets and syrups, etc. as single unit dose or in combination with other drugs in the Indian market. The chemical structure of loratadine (LRT), fexofenadine (FEX), desloratadine (DES), doxylamine (DOX), levocetirizine (LCT), promethazine (PRZ) and cinnarizine (CIN) are shown in fig. 1.
Antihistamines are the most commonly prescribed medication for allergic rhinitis [3] as well as daily dermatologic practice, to adults and children [4]. Research and markets analyst reported the increasing demand of using systemic antihistamines and allergy medication [5]. To keep pace with these conditions, it is necessary to continue focusing research on quality assurance of these therapeutic substances and its dosage forms in order to have a wide safety margin and must bear understandable labelling to ensure proper use.
In the literature, various liquid chromatographic methods (LC) have been reported for the determination of cited antihistamines. For instance, the HPLC method for the estimation of LRT [6], FEX [7-9], DES [10-13], LCT [14, 15], PRZ [16] and CIN [17] has been applied to bulk and their pharmaceutical dosage forms. However, an intensive literature survey revealed several other LC methods for multi-component analysis of cited agents. For instance, a micellar electrokinetic chromatographic method was reported for the
simultaneous determination of LRT and DES in pharmaceutical preparations and biological fluids [18].
Fig. 1: Structure of analytes
Similarly, LC with a microemulsion as eluent was also described for the simultaneous determination of LRT and DES in pharmaceutical
International Journal of Pharmacy and Pharmaceutical Sciences
preparations [19]. Capillary zone electrophoresis method was proposed for the simultaneous determination of LRT, DES and LCT [20].
None of the aforesaid methods can be generalized, besides having other shortcomings. For example, the reported methods are not multi-purposeful, analysis of similar class drugs involving different chromatographic condition resulted in more consumption of organic solvents and reagents. Use of conventional C8 and C18 stationary phase separates compounds based mainly on their overall hydrophobicity. Some of the methods worth mentioning for simultaneous estimation are not simple and are based on gradient flow requiring robotic and complicated instrumentations, while many of the methods have been applied to a single component of this class (antihistamine) LRT, FEX, DES, LCT, PRZ and CIN are very common drugs of the antihistamine family available in many commercial pharmaceutical products either alone or in combination with other drugs, as is always the case in complicated health issues where multidrug therapy is in practice. To the best of author’s knowledge, there is no common analytical method that has been previously reported for the simultaneous analysis of cited antihistamines. Hence, the goal of the present study was to develop, optimize and validate an HPLC method for the simultaneous determination of piperazine (levocetirizine, cinnarizine), piperidine (loratadine, desloratadine, and fexofenadine), pyridine (doxylamine) and phenothiazine (promethazine) drugs present in commercial formulations and drug substances.
The conventional trial and error based HPLC separation did not provide any possible information to track and predict the chromatographic behavior of analytes when multiple analytes are screened. The application of chemometric tool in liquid chromatography (LC) method development enables a thorough understanding of the investigated system and resolves complex optimization problems that are not achieved by a traditional change one-factor-at-a-time approach [21]. The use of certain chemometric tools viz., fractional factorial design (FFD), central composite design (CCD)-response surface methodology provides valuable data in order to evaluate the relationship between the studied factors and selected response [22]. In this way, the minimal experimental runs provides statistical data to investigate the separation behaviour of the analytes in the given experimental domain as well as to find optimum experimental conditions where the system generated desirable results by without performing the additional experiments.
The present study demonstrates the utility of chemometric procedure for the optimization of chromatographic condition for the simultaneous estimation of seven antihistamines. In this study, retention factor, the resolution between adjacent peaks and analysis time were screened. To evaluate all these responses simultaneously, Derringer’s desirability function a global optimization technique [23] was utilized to obtain ideal chromatographic conditions for a best possible combination of separation and analysis time for regular quality control analysis of cited antihistamines.
MATERIALS AND METHODS
Standards and reagents
Working standards of LRT, FEX, DES, DOX and CIN was procured from Yarrow Chemical Ltd, Mumbai, India. LCT was kindly donated by M/S. Sunglow Pharma, Puducherry, India. PMZ was kindly provided by Pharmssan Pharmaceuticals, Tiruchi, Tamil Nadu, India. Acetonitrile (ACN) and methanol (MeOH) were of HPLC grade and purchased from M/S SD Fine chemicals, Mumbai, India. Ammonium acetate (NH4OAc) analytical grade (AR) was procured from Fischer Chemic Ltd, Chennai, India. Acetic acid was of analytical grade purchased from Spectrochem, Mumbai, India.
High purity HPLC water was prepared by passing through a Millipore Milli-Q plus system (Millipore, Bangalore, India) and was used to prepare buffer solutions. The pharmaceuticals: Lorfast Mel tab (10 mg of LRT), Allegra 120 tab (120 mg FEX), Deslor 5 mg tab (5 mg DES), Vozet 5 tab (5 mg LCT), Phenergan 10 mg tab (10 mg PRZ) and Stugeron 25 mg tab (25 mg CIN) were procured from local pharmacy shop and evaluated for the amount present in the formulation.
Instrumentation and chromatographic condition
The chromatographic method development and validation were performed on Shimadzu HPLC (Shimadzu Corporation, Kyoto, Japan). The system consisted of two LC 20 AD solvent delivery modules, an SPD-M 20A PDA detector and a Rheodyne injector (model 7125, USA) valve fitted with a 20-μl loop. The system was controlled by a system controller (SCL-10A) and a personal computer using a Shimadzu chromatographic software (LC Solution, Release 1.11SP1) installed on it. Absorbance spectra were recorded using a UV-Visible spectrophotometer (Model UV-1601PC; Japan) using quartz cell of 1.00 cm path length. The chromatographic separations were carried out on a Phenomenex cyano analytical column (150 mm x 4.6 mm i.d., 5 µm) connected with a Phenomenex cyano guard cadridge (4 mm x 3 mm i.d., 5 µm). The mobile phase consisted of ACN: MeOH: NH4OAc buffer (pH 4.0) adjusted with acetic acid. Prior to use, the mobile phase was degassed for 15 min in an ultrasonic bath and vacuum filtered through a 0.45-μm membrane filter (Gelman Science, India). The wavelength of 220 nm (isosbestic point) was selected for detection. An injection volume of the sample was 20 µl. The HPLC system was used in an air conditioned laboratory atmosphere (20±2ºC).
Software tools employed
Experimental design, data analysis, and desirability function calculations were performed by using Design expert®, 8.0 version (Stat-Ease, MN, USA). Sensitivity plot and prediction plot was generated using JMP®, 9.0 trial version (SAS Institute Inc., Cary, NC). The rest of the calculations were performed using Microsoft Excel 2010 software (Microsoft, USA).
Preparation of the standard solution
A stock solution (1 mg/ml) of LRT, FEX, DES, LCT, PRZ, CIN and DOX was prepared separately by dissolving 10 mg of each in a 10 ml volumetric flask using MeOH as diluent. DOX (fig. 1) was used as an internal standard (IS) as it presented acceptable resolution and retention time with all these analytes. From this stock solution, a mixture of working standard solution of 10 mg/ml strength was prepared by transferring 100 µl of each stock solution into a 10 ml volumetric flask using mobile phase as diluents. This mixture was considered as 100% solution. These stock solutions were stored at approximately 5ºC and were found to be stable for several weeks.
Preparation of the sample solution for the assay of tablets
The developed HPLC method was used for the determination of selected drugs in pharmaceutical formulations. Marketed formulations viz., brand name: Lorfast Mel tab (10 mg of LRT), Allegra 120 tab (120 mg FX), Deslor 5 mg tab (5 mg DEL), Vozet 5 tab (5 mg LCT), Phenergan 10 mg tab (10 mg PRZ) and Stugeron 25 mg tab (25 mg CIN) were evaluated for the amount present in the formulation. Twenty tablets of each were weighed and powdered separately. Accurately measured powder equivalent to 10 mg of each drug was transferred separately into each 10 ml volumetric flask containing 5 ml of the diluent (MeOH). Then the resulted solution of each was sonicated for 15 min to ensure complete solubility of the drugs. Finally, the volume was adjusted up to 10 ml with the same diluent. Further dilutions were made to obtain a concentration of LRT, FEX, DES, LCT, PRZ, CIN and DOX (IS) as 5, 12, 5, 5, 10, and 25 µg/ml) respectively. The resulted solution was centrifuged at 4000 rpm for 10 min; the clear supernatant was collected and filtered through a 0.2 µm membrane filter (Gelman Science, India) and 20 µl of this solution was injected for HPLC analysis in the presence of doxylamine (10 μg/ml) as IS.
Method validation
The analytical performance parameters such as linearity, precision, accuracy, limit of detection, limit of quantification, specificity and robustness were validated according to ICH Q2 (R1) guidelines [24].
RESULTS AND DISCUSSION
Initial screening
A set of initial experiments were performed to decide the basic analytical requirements for the simultaneous analysis of LRT, FEX,
Kanthiah et al.
Int J Pharm Pharm Sci, Vol 8, Issue 7, 288-295
290
DES, LCT, PRZ, CIN and DOX (IS). The performance of three analytical columns viz., Phenomenex monolithic C18 (100 mm x 4.6 mm id.), Phenomenex phenyl-hexyl (150 mm x 4.6 mm id, 5 µm) and Phenomenex cyano (100 mm x 4.6 mm i.d. 5 µm) was tested. The better selectivity and peak separation were obtained with cyano column by using the mobile phase consisting of a ternary solvent mixture of ACN-MeOH-NH4OAc buffer. Formic acid and acetic acid were tested as buffer pH modifier. It was observed that the better separation and peak shape were obtained when acetic acid was used as pH modifier. In order to achieve a quality separation, it is important to identify the factors that need to be optimized for acceptable retention band spacing (either to maximize or to minimize) in a short analysis time on the cyano column.
Optimization stage
The goal of the optimization stage was to establish an optimal condition in which all analytes separate from each other in a short analysis time. The factors are predominantly affecting peak resolution and the analysis time was selected for the further optimization design. Before starting on optimization procedure, it is important to identify the significant factor using fractional factorial design (FFD) with center points in order to eliminate parameters which were having an insignificant effect on selected responses. For instance, the percentage ACN in the mobile phase resulted in better separation and elution strength when to compare to MeOH hence, ACN (factor A) being selected as the organic modifier in the mobile phase. On the other hand, the pH range (factor B) and buffer concentration (factor C) are other key factors in separation procedure when multiple compounds to be analyzed. Therefore, pH and buffer concentration were selected to test their role an analyte separation. Finally, mobile phase flow rate (factor D) was selected to investigate the effect on the time of analysis. The factor space of this design was expanded within the following range: %ACN concentration (15-25%v/v), pH (3.5-4.5), buffer Strength (30-50 mM), and flow rate (0.8-1.2 ml/min) with the fixed concentration of MeOH (40% v/v). The rest of the volume of mobile phase was constituted by NH4OAc buffer solution.
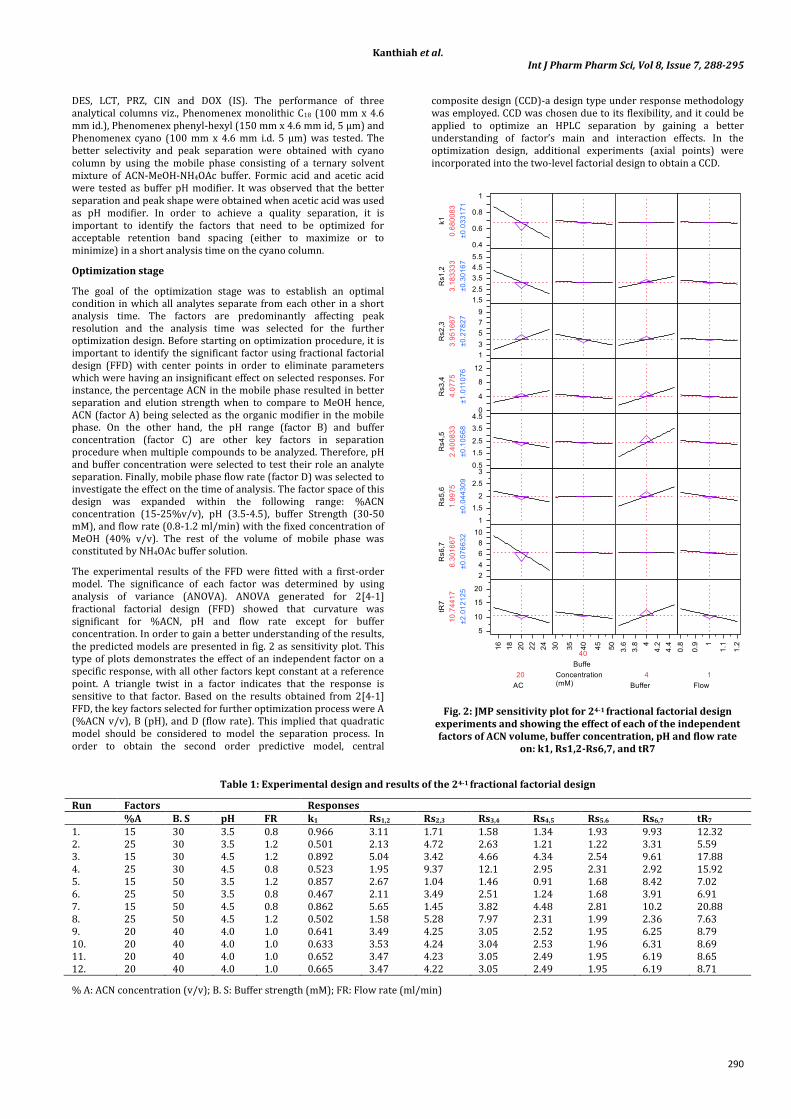
The experimental results of the FFD were fitted with a first-order model. The significance of each factor was determined by using analysis of variance (ANOVA). ANOVA generated for 2[4-1] fractional factorial design (FFD) showed that curvature was significant for %ACN, pH and flow rate except for buffer concentration. In order to gain a better understanding of the results, the predicted models are presented in fig. 2 as sensitivity plot. This type of plots demonstrates the effect of an independent factor on a specific response, with all other factors kept constant at a reference point. A triangle twist in a factor indicates that the response is sensitive to that factor. Based on the results obtained from 2[4-1] FFD, the key factors selected for further optimization process were A (%ACN v/v), B (pH), and D (flow rate). This implied that quadratic model should be considered to model the separation process. In order to obtain the second order predictive model, central
composite design (CCD)-a design type under response methodology was employed. CCD was chosen due to its flexibility, and it could be applied to optimize an HPLC separation by gaining a better understanding of factor’s main and interaction effects. In the optimization design, additional experiments (axial points) were incorporated into the two-level factorial design to obtain a CCD.
Fig. 2: JMP sensitivity plot for 24-1 fractional factorial design experiments and showing the effect of each of the independent factors of ACN volume, buffer concentration, pH and flow rate
on: k1, Rs1,2-Rs6,7, and tR7
Table 1: Experimental design and results of the 24-1 fractional factorial design
Table 1 shows the levels of each factor studied for finding out the optimum values and responses. The ranges of each factor used were ACN concentration (15-25%v/v), buffer pH (3.5-4.5) and flowed rate (0.8-1.2 ml/min). Since the factor C (buffer strength) was not significant, it was fixed at the corresponding center value (40 mM) of the FFD.
As response variables, the retention factor for the first eluted peak LRT (k1), the resolution between peaks Rs1,2 to Rs6,7 and the retention time of the last peak tR7 were selected. For an experimental design with the three factors, including linear, quadratic and cross terms, the model can be expressed as
Y = β0+β1X1+β2X2+β3X3+β12X1X2+β13X1X3+β23X2X3+β11X12+β22X22+β33X32
Where, Y is the response to be modelled, β is the regression coefficient and X1, X2 and X3 represent factors A (ACN), B (pH) and C (flow rate) respectively. Table 2 summarizes the conducted experiments, viz. (n = 14+6) six replicates at the center point and the responses. All experiments were conducted in randomized order to minimize the effects of uncontrolled variables that may introduce a bias on the measurements. Statistical parameters obtained from ANOVA for the reduced models were given in table 3. The insignificant terms (p>0.05) were eliminated from the model through a backward elimination process to obtain a simple and realistic model.
Table 2: Design of experiments and results of the central composite designa
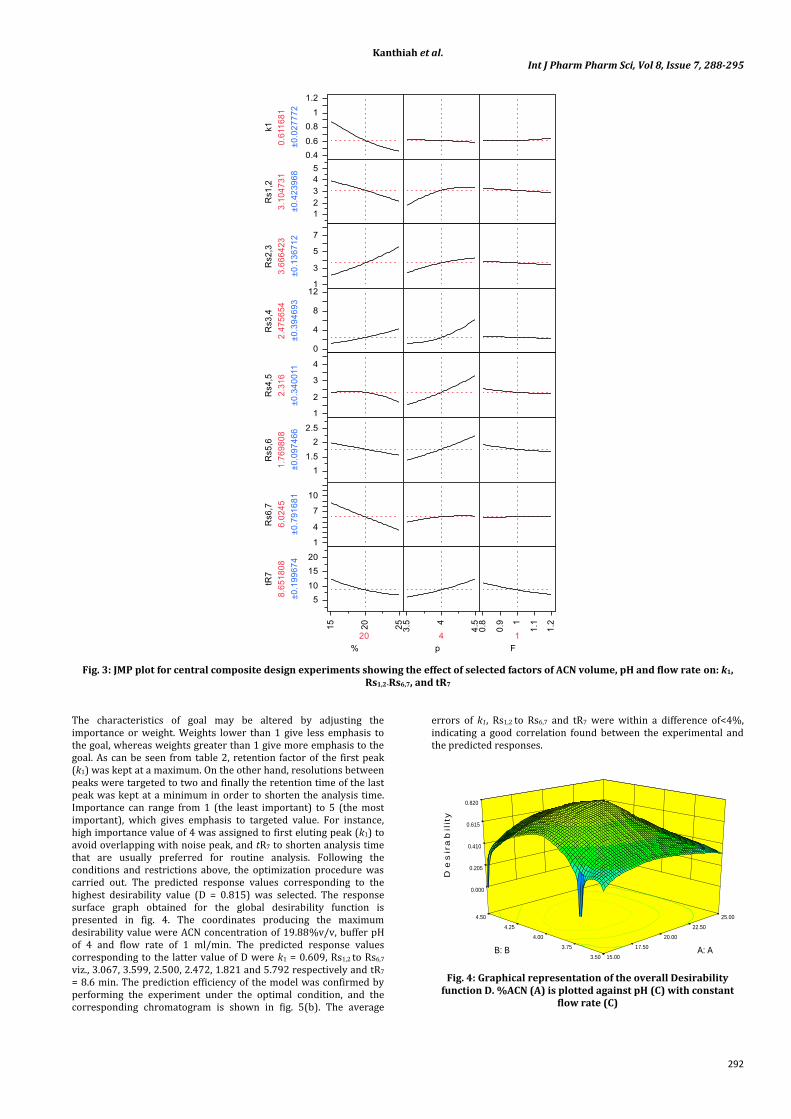
Table 3 shows that the adjusted R2 values were well within the acceptable limits of R2 ≥ 0.80, which revealed that the experimental data showed a good fit with second order polynomial equations. For all the reduced models p value<0.05 was obtained, implying these models were significant. The adequate precision value is a measure of the signal (response) to noise (deviation) ratio. A ratio greater than 4 is desirable. The ratio was found to be in the range from 15.86 to 71.76 which indicated an adequate signal and therefore the model was significant for the separation process. From the polynomial equations (summarized in table 3) positive interaction terms indicate the combined effect of independent variables on response variables. As in the case of response Rs2,3 and Rs3,4 one of the interaction terms were positive, i.e., the effect of concentration of ACN and pH. Similarly for tR7 interaction term was positive for ACN and flow rate. In order to gain a better understanding of the results, the predicted models are presented in fig. 3 as JMP prediction plot. This type of plots demonstrates the effect of an independent factor on a specific response, with all other factors kept constant at a reference point. A steep slope or curvature in a factor indicates that the response is sensitive to that factor.
ACN concentration increases that resulted decline in the retention factor of the first eluted peak k1. It was interesting to note that decreasing the level of pH significantly distorted the resolution of Rs1,2 to Rs5,6. The existence of such interactions emphasized the necessity to carry out active multifactor experiments for the optimization of chromatographic separation. The selected responses were not affected in the same manner with the changes in experimental parameters, it was necessary to arrive a best possible combination of good baseline separation and runtime.
Global optimization
The selected responses were not affected in the same manner with the changes in experimental parameters; hence, it was necessary to strike a right balance to arrive a quality separation. Derringer’s desirability function (D) was employed for global optimization of selected responses and to identify the optimal conditions for the regular quality control analysis of selected antihistamines. The expression that defines the Derringer’s desirability function is:
D = [d1p1x d2p2x d3p3x. . xdnpn]1/n
Table 3: Reduced response models and statistical parameters obtained from ANOVA
Fig. 3: JMP plot for central composite design experiments showing the effect of selected factors of ACN volume, pH and flow rate on: k1, Rs1,2-Rs6,7, and tR7
The characteristics of goal may be altered by adjusting the importance or weight. Weights lower than 1 give less emphasis to the goal, whereas weights greater than 1 give more emphasis to the goal. As can be seen from table 2, retention factor of the first peak (k1) was kept at a maximum. On the other hand, resolutions between peaks were targeted to two and finally the retention time of the last peak was kept at a minimum in order to shorten the analysis time. Importance can range from 1 (the least important) to 5 (the most important), which gives emphasis to targeted value. For instance, high importance value of 4 was assigned to first eluting peak (k1) to avoid overlapping with noise peak, and tR7 to shorten analysis time that are usually preferred for routine analysis. Following the conditions and restrictions above, the optimization procedure was carried out. The predicted response values corresponding to the highest desirability value (D = 0.815) was selected. The response surface graph obtained for the global desirability function is presented in fig. 4. The coordinates producing the maximum desirability value were ACN concentration of 19.88%v/v, buffer pH of 4 and flow rate of 1 ml/min. The predicted response values corresponding to the latter value of D were k1 = 0.609, Rs1,2 to Rs6,7 viz., 3.067, 3.599, 2.500, 2.472, 1.821 and 5.792 respectively and tR7 = 8.6 min. The prediction efficiency of the model was confirmed by performing the experiment under the optimal condition, and the corresponding chromatogram is shown in fig. 5(b). The average
errors of k1, Rs1,2 to Rs6,7 and tR7 were within a difference of<4%, indicating a good correlation found between the experimental and the predicted responses.
Fig. 4: Graphical representation of the overall Desirability function D. %ACN (A) is plotted against pH (C) with constant
flow rate (C)
Design-Expert® Software
Desirability1
0
X1 = A: AX2 = B: B
Actual FactorC: D = 1.01
15.00
17.50
20.00
22.50
25.00
3.50
3.75
4.00
4.25
4.50
0.000
0.205
0.410
0.615
0.820
D
es
ira
bil
ity
A: A B: B
Kanthiah et al.
Int J Pharm Pharm Sci, Vol 8, Issue 7, 288-295
293
Assay method validation
Validation of the optimized method was performed by following ICH guidelines to ensure adequate selectivity, linearity, precision, accuracy, limit of detection (LOD), limit of quantitation (LOQ) and robustness. Selectivity of the method was assessed by comparing the chromatograms of placebo sample containing a mixture of the commonly used excipients (starch, lactose monohydrate, hydroxypropyl methylcellulose, titanium dioxide and magnesium stearate) with that of selected analytes; no interfering peaks were noticed in the chromatogram. The respective chromatogram was shown in fig. 5(a). The linearity was established by analyzing five working solutions of LRT (2-10 µg/ml), FEX (5-25 µg/ml), DES (2-10 µg/ml), LCT (2-10 µg/ml), PRZ (4-20 µg/ml) and CIN (5-50 µg/ml) corresponding to 20-200 % of expected test concentration for quality control of LRT, FEX, DES, LCT, PRZ and CIN tablets. Calibration curves were plotted using peak area ratios of all the analytes. The obtained regression equations for LRT, FEX, DES, LCT, PRZ and CIN are summarized in table 4. The obtained correlation coefficients for LRT, FEX, DES, LCT, PRZ and CIN was>0.9 that indicated high linearity over the entire concentration range.
The accuracy of the method was tested at three concentration levels of 80, 100 and 120 % of the expected assay value of the marketed formulation. The % recovery of LRT, FEX, DES, LCT, PRZ and CIN (n = 3) and mean % recovery (n = 9) were determined, and data are
presented in table 4. The recoveries of LRT, FEX, DES, LCT, PRZ and CIN at each level were found to lie within the acceptable criteria of the bias 2 %. The method precision was evaluated by injecting six replicates of LRT, FEX, DES, LCT, PRZ and CIN at three concentration levels for intra-and inter-day precision and the results were expressed as % RSD. The results are summarized in table 4. Limit of detection (LOD) and limit of quantification (LOQ) values for LRT, FEX, DES, LCT, PRZ and CIN were estimated by plotting calibration curves at five levels ranging from 0.05 to 1.0 % of the nominal concentration, and the values are presented in table 4. The stock and the sample solutions were stable throughout the period of study (30 d). No significant degradation was found within the period of evaluation, indicating that solutions are stable. Peak areas of all the analytes were almost identical to that obtained during initially prepared solutions, and additional peaks were not observed.
The robustness of the method was evaluated from CCD experiments data. When the ACN content of mobile phase was increased above 3.2%, a significant decrease in the retention factor was observed. Increasing ACN content and decreasing pH negatively affected the resolution between Rs5,6. Increasing ACN content, decreasing pH and increasing the flow rate reduced the run time of the method. However, the method was more robust within the normal operating range, i.e., % ACN, 19.88±0.7 % v/v (factor A); pH, 4±0.02 (factor B) and flow rate, 1.0±0.05 ml/min (factor C), demonstrating the robustness of the method.
Table 4: Summary of validation report
Validation parameters Analytes LOR FEX DES LCT PRZ CIN
r2 0.992 0.995 0.994 0.995 0.998 0.999 LOD 1.51 ng/ml 5.32 ng/ml 8.51 ng/ml 1.77 ng/ml 4.04 ng/ml 5.57 ng/ml LOQ 4.60 ng/ml 16.05 ng/ml 25.81 ng/ml 5.37 ng/ml 12.24 ng/ml 16.90 ng/ml Specificity The method is specific with respect to tablets ingredients Accuracy Mean Recovery±SD(%), (n = 3) at 80% 101.02±0.16 100.37±0.58 101.41±0.28 100.60±0.09 102.29±0.07 102.35±0.04 at 100% 99.85±0.97 101.00±0.01 100.30±0.19 101.47±0.13 99.82±0.02 99.83±0.03 at 120% 99.67±0.55 98.61±0.39 98.99±0.29 98.68±0.05 99.02±0.04 99.02±0.04 Mean recovery±SD(%), (n = 9) 100.18±0.85 99.99±1.12 100.23±1.07 100.25±1.23 100.37±1.47 100.40±1.50 Precision n=6 a. Intraday Conc. %RSD Conc. %RSD Conc. %RSD Conc. %RSD Conc. %RSD Conc. %RSD 2µg 2.44 5µg 2.65 2µg 2.80 2µg 1.11 4µg 2.31 5µg 0.95 6µg 1.28 15µg 2.49 6µg 1.30 6µg 1.04 12µg 1.18 25µg 1.02 10 µg 1.78 25µg 2.14 10µg 1.30 10 µg 1.23 20µg 2.10 50µg 0.82 b. Interday Conc. %RSD Conc. %RSD Conc. %RSD Conc. %RSD Conc. %RSD Conc. %RSD 2µg 2.48 5µg 2.44 2µg 2.78 2µg 1.10 4µg 2.24 5µg 0.84 6µg 1.32 15µg 2.32 6µg 1.31 6µg 1.02 12µg 1.21 25µg 1.32 10 µg 1.82 25µg 2.12 10µg 1.34 10 µg 1.24 20µg 2.08 50µg 0.96 Robustness Variations did not alter response more than 2% and therefore it could be concluded that the method conditions are
robust.
Application of the developed method
To assess the applicability of the developed method for intended purpose, an attempt was made to determine the content of LRT, FEX, DES, LCT, PRZ and CIN in commercially available tablets. For the assay, the sample solution was prepared as described under section “Preparation of sample solution”. The assay
results are summarized in table 5. From table 5, it can be seen that the recoveries of cited antihistamines from tablets were high (% recovery), consistent (low %RSD) and agreed with the label claim of corresponding marketed formulations. The obtained results demonstrate high accuracy and reproducibility of the proposed method. A typical chromatogram of tablet analysis is shown in fig. 5(c).
Table 5: Assay data for quality control of marketed formulation
Fig. 5: Representative overlaid chromatograms corresponding to (a) placebo solution (b) laboratory made mixtures and (c) marketed tablet dosage forms as per elution order: loratadine (LRT), fexofenadine (FEX), desloratadine (DES), doxylamine (IS), levocetirizine (LCT),
promethazine (PRZ) and cinnarizine (CIN) under optimum condition
CONCLUSION
In this paper a simple, rapid, and efficient RP-HPLC method was developed, optimized and validated for the simultaneous determination of the LRT, FEX, DES, LCT, PRZ, CIN and DOX (IS). Time of analysis, resolution, and quality of the peaks were optimized by applying useful tools of chemometrics: fractional factorial design, central composite design and global optimization technique (Derringer’s desirability function). The results of the study demonstrated the benefit of applying chemometric tools in selecting optimum conditions for the determinations of cited drugs in pharmaceutical formulations. This method reduced overall assay development time and provided essential information regarding the sensitivity of various chromatographic variables on separation attributes. The validation study supported the selection of the assay conditions by confirming that the assay was accurate, linear, precise and robust. Therefore, it could be successfully adopted for routine quality control of cited antihistaminic drugs in bulk drug and pharmaceutical formulations.
ACKNOWLEDGEMENT
The author is grateful to University Grants Commission (UGC), New Delhi, India, for the financial assistance through UGC-BSR fellowship and UGC-SAP-DRS Phase-II sponsored Department of Pharmacy, Annamalai University, Tamil Nadu, India for providing the facilities to carry this research work.
CONFLICT OF INTERESTS
The authors declare that there is no conflict of interest.
REFERENCES
1. Paulo RC, Roberta FJC, Celina WM, Carlos AMF. Histamine, histamine receptors and antihistamines: new concepts. A Bras Dermatol 2010;85:195-210.
2. Chris S, Tomas P, Margaret A, Neeraj S. Utilization effects of Rx-OTC switches and implications for future switches. Health 2013;5:1667-80.
3. Montoro J, Sastre J, Jáuregui I, Bartra J, Dávila I, Cuvillo A, et al. Allergic rhinitis: continuous or on demand antihistamine therapy? J Invest Allergol Clin Immunol 2007;17:21-7.
4. Cuvillo A, Sastre J, Montoro J, Jáuregui I, Ferrer M, Dávila I, et al. Use of antihistamines in paediatrics. J Investig Allergol Clin Immunol 2007;17:28-40.
5. The 2016-2021 World Outlook for Systemic Antihistamines and Allergy Medication. Research and Markets Brochure. Available from: http://www.researchandmarkets.com/ reports/3251793/ [Last accessed on 20 Feb 2016].
6. Georgeta P, Vasile D, Antoanela P. Validation and application of a new DAD-HPLC method for determination of loratadine from pharmaceuticals. Farmacia 2015;63:366-70.
7. Oliveira DC, Weigch A, Rolim CM. Simple and reliable HPLC analysis of fexofenadine hydrochloride in tablets and its application to dissolution studies. Pharmazie 2007;62:96-100.
8. Farya Z, Muhammad HS, Rabia IY. Development of RP-HPLC method for fexofenadine determination in tablet formulations and development of dissolution method. Pakistan J Pharmacol 2011;28:43-9.
9. Arayne MS, Sultana N, Shehnaz H, Haider A. RP-HPLC method for the quantitative determination of fexofenadine hydrochloride in coated tablets and human serum. Med Chem Res 2011;20:55-61.
10. Razib BMMA, Ashik U, Mohammad AKA, Rebeka S, Hasina Y, Abul H. Validation and application of a modified RP-HPLC method for the quantification of desloratadine in pharmaceutical dosage Forms. Dhaka Univ J Pharm Sci 2006;5:1-4.
11. Valarmathy J, Samuel J, Guptha NTH, M Ganesh, A Lakshmana R, Sivakumar T. RP-HPLC estimation of desloratadine in pharmaceutical dosage form. Asian J Chem 2009;21:7431-3.
12. Patel RB, Patel MR, Mehta JB. Validation of stability-indicating high performance liquid chromatographic method for estimation of desloratadine in tablet formulation. Arabian J Chem 2012. Doi.org/10.1016/J.Arabjc.2012.10.026. [Article in Press]
13. Qi M, Wang P, Geng Y. Determination of desloratadine in drug substance and pharmaceutical preparations by liquid chromatography. J Pharm Biomed Anal 2005;38:355–9.
14. Chaitanya Prasad MK, Vidyasagar G, Sambasiva Rao KRS, Madhusudhanareddy I, Ramanjeneyulu S. Development of a validated liquid chromatographic method for estimation of levocetirizine from pharmaceutical dosage forms. J Appl Pharm Sci 2011;1:95-7.
15. Rahul PG, Raju G, Ramesh BA, Mallikarjun N, Nalini S, Srinivasa R. HPLC and LCMS studies on stress degradation behaviour of levocetirizine and development of a validated specific stability-indicating method. J Liq Chromatogr Relat Technol 2011;34:955-65.
16. Thumma S, Zhang SQ, Repka MA. Development and validation of an HPLC method for the analysis of promethazine hydrochloride in hot-melt extruded dosage forms. Pharmazie 2008;63:562-7.
17. Heda AA, Sonawane AR, Naranje GH, Puranik PK. A rapid determination of cinnarizine in bulk and pharmaceutical dosage form by LC. E J Chem 2010;7:1080-4.
18. El-Awady M, Fathalla B, Ute P. Robust analysis of the hydrophobic basic analytes loratadine and desloratadine in pharmaceutical preparations and biological fluids by sweeping-cyclodextrin-modified micellar electrokinetic chromatography. J Chromatogr A 2013;1309:64-75.
19. El-Sherbiny DT, El-Enany N, Belal FF, Hansen SH. Simultaneous determination of loratadine and desloratadine in pharmaceutical preparations using liquid chromatography
with a microemulsion as eluent. J Pharm Biomed Anal 2007;43:1236–42.
20. Hancu G, Campian C, Rusu A, Mircia E, Kelemen H. Simultaneous determination of loratadine, desloratadine and cetirizine by capillary zone electrophoresis. Adv Pharm Bull 2014;4:161-5.
21. Mannemala SS, Valliappan K. Systematic robustness testing of a liquid chromatographic method: a case study. J AOAC Int 2015;98:1769-74.
22. Sivakumar T, Manalapan R, Muralidharan C, Valliappan K. An improved HPLC method with the aid of a chemometric protocol: simultaneous analysis of amlodipine and atorvastatin in pharmaceutical formulations. J Sep Sci 2007;30:3143-53.
23. Sivakumar T, Manalapan R, Valliappan K. Global optimization using Derringer’s desirability function: enantioselective determination of ketoprofen in formulations and in biological matrices. Acta Chromatogr 2007;19:29-47.
24. ICH. Q2 (R1), Validation of analytical procedures, proceedings of the International Conference on Harmonisation, Geneva; 2005.