Page 1
License and Terms: This document is copyright 2020 the Author(s); licensee Beilstein-Institut.
This is an open access publication under the terms of the Creative Commons Attribution License (https://creativecommons.org/licenses/by/4.0). Please note that the reuse,redistribution and reproduction in particular requires that the author(s) and source are credited.
The license is subject to the Beilstein Archives terms and conditions: https://www.beilstein-archives.org/xiv/terms.The definitive version of this work can be found at https://doi.org/10.3762/bxiv.2020.100.v1
This open access document is posted as a preprint in the Beilstein Archives at https://doi.org/10.3762/bxiv.2020.100.v1 and isconsidered to be an early communication for feedback before peer review. Before citing this document, please check if a final,peer-reviewed version has been published.
This document is not formatted, has not undergone copyediting or typesetting, and may contain errors, unsubstantiated scientificclaims or preliminary data.
Preprint Title Control over size, shape, and photonics of self-assembled organicnanocrystals
Authors Chen Shahar, Yaron Tidhar, Yunmin Jung, Haim Weissman, SidneyR. Cohen, Ronit Bitton, Iddo Pinkas, Gilad Haran and BorisRybtchinski
Publication Date 07 Sep 2020
Article Type Full Research Paper
Supporting Information File 1 SI _ONCphoto_BJOC.pdf; 1.4 MB
ORCID® iDs Gilad Haran - https://orcid.org/0000-0003-1837-9779; BorisRybtchinski - https://orcid.org/0000-0002-2071-8429
Page 2
1
Control over size, shape, and photonics of self-assembled organic
nanocrystals
Chen Shahar1, Yaron Tidhar1, Yunmin Jung2#, Haim Weissman1, Sidney R. Cohen3, Ronit Bitton4,5, Iddo
Pinkas3, Gilad Haran2, and Boris Rybtchinski1*
Departments of 1Organic Chemistry, 2Chemical Physics, and 3Chemical Research Support, Weizmann
Institute of Science, Rehovot 76100, Israel. 4 Department of Chemical Engineering, and 5Ilse Katz Institute for Nanoscale science and Nanotechnology
Ben-Gurion University, Beer Sheva 84105, Israel.
# Current address: Center for Cancer Immunotherapy, La Jolla Institute for Immunology, La Jolla, CA,
USA
*Corresponding Author
E-mail: [email protected]
Abstract
Facile fabrication of free-floating organic nanocrystals (ONCs) was achieved via
kinetically controlled self-assembly of simple amphiphilic perylene diimide building
blocks in aqueous media. The ONCs have a thin rectangular shape, with the aspect ratio
that is controlled via organic co-solvent (THF) content. The nanocrystals were
characterized in solution by cryogenic transmission electron microscopy (cryo-TEM) and
small angle X-ray scattering (SAXS); the ONCs retain their structure upon drying as was
evidenced by TEM and AFM. Photophysical studies, including femtosecond transient
absorption spectroscopy, revealed a distinct influence of the ONC morphology on their
Page 3
2
photonic properties (excitation energy transfer was observed only in the high aspect
ONCs). Convenient control over structure and function of organic nanocrystals can
enhance their utility in new and developed technologies.
Keywords: self-assembly; organic nanocrystals; aromatic amphiphiles; exciton
diffusion; perylene diimides.
Introduction
Semiconductor and metal nanoparticles exhibit size and morphology-dependent
properties arising from confinement effects and strong interactions between neighboring
atoms[1–3]. The correlation between nanoparticle size and the related electronic and
optical properties was extensively studied, leading to applications in novel technologies
and devices[4–6]. The development of the reprecipitation method[7] allowed facile
fabrication of (often crystalline) organic nano- and microparticles based on
polydiacetylene[8], pyrazoline[9], perylene[10], and other molecules. In several cases,
size-dependent absorption was reported[11,12]. These crystals found use in
optoelectronic materials[13], as markers for imaging applications[12], and demonstrated
anticancer properties[14]. However, control over the size and shape in such systems is
challenging[8–16].
Surface chemistry methodologies allow improved control over crystalline product
formation; however these methods are indirect and limited by the nature of the interface
involved in the process. For example, well-defined two-dimensional nanocrystals were
Page 4
3
obtained by the vapor transport method, resulting in improved charge mobility[17], but
no control over the crystal size and morphology was demonstrated. Using self-assembled
monolayers as templates for the seeding and growth of molecular crystals may offer
control over structure and polymorphism[18]. However, in this method, the crystal
formation is limited by the monolayer surface, so that it does not allow facile bulk
fabrication, and restricts control over the crystal morphology[19,20]. Crystalline
nanobelts assembled from perylene and perylene diimide (PDI) derivatives were
reported, but their size and shape could not be controlled[21,22]. Modification of the
building blocks in such systems result in a certain degree of control[23,24], yet the PDI
nanobelts do not remain free-floating in solution and normally are characterized as solid
state materials[25], limiting the processability of the nanocrystals, control over their
morphology, and insights into their assembly.
In general, gaining control over crystal formation represents a long-standing
challenge[26–28]. In this respect, understanding and controlling the crystallization
process is key to fabricating organic nanocrystals with predesigned morphology and
properties[29]. We have reported on 2D crystalline self-assembled systems based on a
hierarchical assembly mode promoted by hydrophobic and π-π interactions[30]. Yet, the
size and shape of these systems could not be controlled beyond the 2D morphology.
We report herein on aqueous self-assembly of organic nanocrystals with tunable aspect
ratio. These systems are quite uniform and exhibit morphology-dependent photonics:
strikingly divergent exciton diffusion properties as a function of their shape.
Page 5
4
Results and discussion
Following our interest in self-assembly of amphiphilic perylene diimide (PDI)
derivatives, we employed compound 1, a PDI system with a hydrophilic group (phenoxy
benzoic acid) attached to the aromatic core of PDI at the bay area [29c]. Compound 1 is
an asymmetric amphiphile that was designed to result in arrays that differ from fibrous
and monolayer structures assembled from symmetrically substituted bolaamphiphilic PDI
systems[30,31].
Figure 1: Chemical structure of compound 1 and UV-vis spectra in aggregating aqueous media
and in disaggregating solvent (THF).
Crystalline Self-Assembly. We have found that noncalssical crystallization of 1 in neutral
aqueous solutions can be manipulated to result in different polymorphs[29c], 3D crystals
with dissimilar structures and morphologies. We envisaged that crystallization of 1 in
basic aqueous media can lead to 2D arrays (bilayers) due to the higher solubility of the
Page 6
5
assemblies as a result of charged carboxylate groups that are expected to favor solvation
by water. We induced the self-assembly process by injecting concentrated solution of 1 in
THF (210-3 M) into basic water (pH 10), or a water/THF mixture to reach 110-4 M
concentration. We studied the following three assembly conditions: 10% THF, injection
of the stock solution to basic water/THF mixture to obtain 10% THF content by volume;
5% THF, injection of the stock solution to basic water to give 5% THF content; 5%
0% THF, injection of the stock solution to basic water to result in 5% THF content,
followed by the immediate evaporation of THF under high vacuum and adding water to
reach 110-4 M concentration.
The self-assembly is instantaneous as indicated by a color change from bright orange to
pink in all systems. UV-vis spectra of compound 1 in aqueous medium exhibit 0-0/0-1
vibronic band inversion, red shift and significant broadening in comparison with the
molecularly dissolved system (Figure 1B). This is a typical spectral signature of ordered
PDI systems and crystals[32–36] having face-to-face orientation of π-systems.
Cryo-TEM and TEM studies reveal that the 10% THF assemblies are long rectangular-
shaped crystals, ~3 µm in length (Figures 2A). The crystals have an aspect ratio of
2.6±1.3 and their crystalline order was evident from Fast Fourier Transform (FFT)
analysis, exhibiting well-defined spots corresponding to periodicity of 1.6 nm. 5% THF
assembly gave rise to crystals that are ~1 µm in length, with an aspect ratio of 5.0±1.9.
FFT analysis revealed the spacing value of 1.6 nm, identical to 10% THF system (Figure
2B). In the case of 5% 0% THF, the crystals were over 5 µm long and under 0.5 µm
in width, thus having the largest aspect ratio amongst the studied systems: 10±3.5.
Crystalline order gave rise to 1.6 nm spacing as indicated by FFT (Figures 2C). The
Page 7
6
aspect ratio values and the calculated standard deviations are based on two different
assembly solutions including 50 crystals for each system.
Figure 2: TEM images (left, zoomed-out and zoomed-in; 110-4 M solutions of 1 deposited on
TEM grids) and crystal morphology sketches (right):. A) 10% THF. B) 5% THF. C)
5%0%THF. Insets: FFT analysis of the crystalline material (in the marked areas),
demonstrating identical spacing of 1.6 nm in all systems.
All obtained crystalline assemblies demonstrated structural stability toward drying and
presented an identical fine structure composed of an ordered array of alternating dark and
light contrast stripes as observed by TEM and cryo-TEM (Figures 2 and 3 respectively).
100 nm1 µm
1 µm
0.0 0.5 1.0 1.5 2.0
0.0
2.0
4.0
6.0
8.0
10.0
1/nmDistance
Gra
y V
alu
e
Line profile 1 of CS9 10% THF two weeks
0.5 1.5
nm
-1
100 nm1 µm
100 nm
0.5 1.51.0
nm
-1
100 nm
0.0 0.5 1.0 1.5
0.0
5.0
10.0
15.0
20.0
25.0
1/nmDistance
Gra
y V
alu
e
Line profile 1 of CS9 5%THF basic 1 day
0.5 1.51.0
nm
-1
5% THF
5%0% THF
10% THFA
B
T
H
F
C
Page 8
7
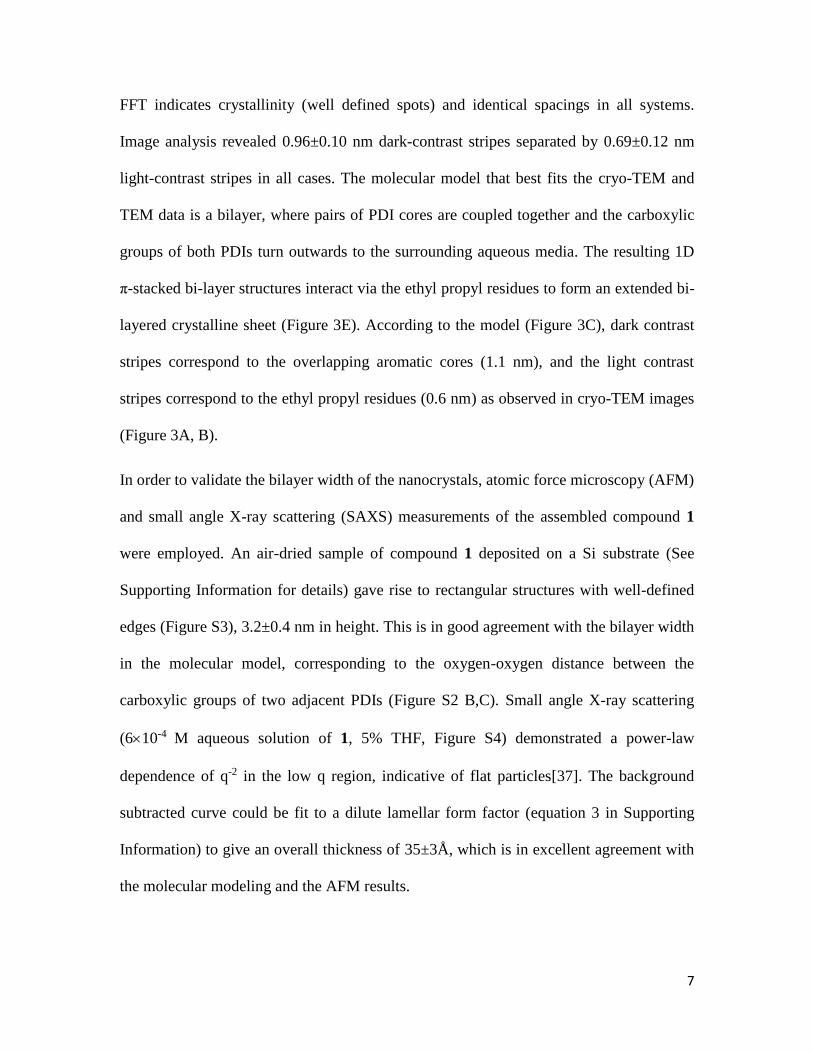
FFT indicates crystallinity (well defined spots) and identical spacings in all systems.
Image analysis revealed 0.96±0.10 nm dark-contrast stripes separated by 0.69±0.12 nm
light-contrast stripes in all cases. The molecular model that best fits the cryo-TEM and
TEM data is a bilayer, where pairs of PDI cores are coupled together and the carboxylic
groups of both PDIs turn outwards to the surrounding aqueous media. The resulting 1D
π-stacked bi-layer structures interact via the ethyl propyl residues to form an extended bi-
layered crystalline sheet (Figure 3E). According to the model (Figure 3C), dark contrast
stripes correspond to the overlapping aromatic cores (1.1 nm), and the light contrast
stripes correspond to the ethyl propyl residues (0.6 nm) as observed in cryo-TEM images
(Figure 3A, B).
In order to validate the bilayer width of the nanocrystals, atomic force microscopy (AFM)
and small angle X-ray scattering (SAXS) measurements of the assembled compound 1
were employed. An air-dried sample of compound 1 deposited on a Si substrate (See
Supporting Information for details) gave rise to rectangular structures with well-defined
edges (Figure S3), 3.2±0.4 nm in height. This is in good agreement with the bilayer width
in the molecular model, corresponding to the oxygen-oxygen distance between the
carboxylic groups of two adjacent PDIs (Figure S2 B,C). Small angle X-ray scattering
(610-4 M aqueous solution of 1, 5% THF, Figure S4) demonstrated a power-law
dependence of q-2 in the low q region, indicative of flat particles[37]. The background
subtracted curve could be fit to a dilute lamellar form factor (equation 3 in Supporting
Information) to give an overall thickness of 35±3Å, which is in excellent agreement with
the molecular modeling and the AFM results.
Page 9
8
Figure 3: Cryo-TEM images of 110-4 M solution of 1 (5% THF) and the corresponding
molecular model and a cartoon illustrating the self-assembly process. A) cryo-TEM image, the
crystal is highlighted with a yellow contour. B) Zoom-in showing fine-structure composed of
alternating dark and light contrast stripes. Insets: FFT analysis of the crystalline material giving
rise to a spacing value of 1.6 nm. (C-D) Molecular model: C) the interacting stacks and their
dimensions corresponding to the observed fine-structure; D) cross-section demonstrating the
Page 10
9
bilayer structure composed of two adjacent PDI cores. The measured distance (3 nm)
corresponds to the oxygen-oxygen distance between the carboxylic groups of two PDIs. E)
Schematic representation of the assembly structuring.
The presented crystalline structures are kinetically trapped products since they do not
equilibrate upon changing the assembly conditions after they are fully formed. Thus,
addition of THF to pre-assembled 5%0% THF crystals to 5% THF content did not
result in any observable morphological change (Figure S6B). Similarly, when THF was
added to the assembled 5% THF material to result in 10% THF content (Figure S6A) no
change was observed. Evidently, the structure of the crystals is defined by the assembly
pathway rather than equilibration at a given solvent composition.
In order to gain insight into the crystallization mechanism and the effect of the THF
concentration on the crystallization process, we performed cryo-TEM imaging of the
early assembly stages. In the case of 5% THF, monomolecular 1D stacks, 1.5±0.3 nm in
width were observed after 1 min aging (Figure 4A). The assembled material appeared as
short fibers (10-80 nm length), some of which interact and align. In the case of 10%
THF, crystalline arrays ~100 nm in length and ~10 nm in width were observed after 1
min (Figure 4B). The structural differences between 5% THF and 10% THF systems at
early assembly times reveal the distinct dynamics of the nucleation/growth process. Thus,
the 10% THF system shows a faster ordering process (THF makes the system more
dynamic, lowering activation barriers for molecular reorganization[38]), resulting in long
rigid fibers that interact (Figure 3E), leading to larger ordered arrays and templating the
further assembly process. This, together with better stabilization of the aromatic cores at
higher THF content, leads to large, low aspect ratio crystals in 10% THF case. Thus,
Page 11
10
kinetically controlled pathway-dependent nucleation/growth defines the outcome of the
crystalline self-assembly process. In both 5% THF and 10% THF systems, the
crystallization is largely completed after 5 min (Figure S7). The observed crystallization
pathways are consistent with gradual order evolution mechanisms recently observed by
us[29b].
Figure 4: Cryo-TEM images of 110-4 M compound 1 in THF/water solutions after one minute
of aging. A) 5% THF: monomolecular 1D π-stack fibers B) 10% THF: crystalline platelets.
Controlling the crystal morphology also can be achieved in an alternative fashion using
variation in pH (Figure S8). However, crystals assembled under different pH conditions
are less homogeneous and demonstrate a larger size distribution than the crystals obtained
using control via THF content.
Exciton dynamics. In order to investigate whether the morphology affects photonic
properties, we studied the excited state dynamics of the nanocrystals. Femtosecond
A B
Page 12
11
transient absorption (fsTA) spectra of all assemblies displayed typical PDI excited state
absorption peaks in the range of 600-770 nm[39], matching PDI bleaching represented by
negative features at 550-600 nm. In the disaggregated state, almost no power dependence
was observed. The decay kinetics of 5% THF and 5%0% THF systems demonstrated
power dependence (Figure 5A and S9A respectively). In contrast, 10% THF
nanocrystals exhibit essentially power-independent kinetics (Figure 5B). Power
dependence is indicative of the exciton-exciton annihilation process, occurring when a
high photon flux results in multiple excitons which can efficiently diffuse through the
aggregated material resulting in exciton annihilation.[40]
In order to validate the observed behavior and prove that the measured differences
between 5% THF and 10% THF assemblies stem from the different crystal morphology
and not from the difference in THF concentration, a control experiment was performed.
A sample of 1 prepared in 5% THF was aged for two days, after which the THF
concentration was adjusted to 10%. The control sample was measured, showing exciton
dynamics very similar to the original 5% THF sample (Table 1, Figure S9B).
0 100 200 300 4000.0
0.2
0.4
0.6
0.8
1.0
Time [ps]
no
rma
lize
d in
ten
sity
5% THF 0.2 uJ
0.4 uJ
0.6 uJ
0.8 uJ
0 100 200 300 4000.0
0.2
0.4
0.6
0.8
1.010% THF
no
rma
lize
d in
ten
sity
Time [ps]
0.2 uJ
0.6 uJ
0.8 uJ
1.0 uJ
10%
Page 13
12
Figure 5: Transient kinetics at different laser powers probed at 755 nm (110-4 M solution at
pH10): A) 5% THF solution. B) 10% THF solution.
In order to estimate exciton diffusion coefficient and diffusion length we used an analysis
method employed in our previous work,[30] and based on a one-dimensional diffusion
model for the annihilation rate[41–44]. The model fits our data, revealing that exciton
diffusion occurs primarily within 1D aromatic stacks, in agreement with the reported
annihilation studies[43,44]. The fitted data is presented in Figures S10-S12 and the
exciton diffusion parameters are given in Table 1:
Table 1. Diffusion coefficient and exciton diffusion length
LD*, nm D, cm2/s Measured crystal system
198±4 0.07±0.01 5% 0% THF
170±13 0.05±0.01 5% THF
114±14 0.04±0.01
pre-aged 5% THF adjusted to
10% THF
No power dependence 10% THF
*Exciton diffusion length is calculated using 𝐿𝐷 = √𝐷𝜏, where τ is the exciton lifetime
(estimated as a longer decay component of the decay fit, representing a lower limit for the exciton
lifetime).
Page 14
13
5% THF and 5%0% THF systems gave rise to similar diffusion coefficients: 510-2
cm2/s and 710-2 cm2/s respectively. These values are comparable with the reported
exciton diffusion coefficients of 2D PDI crystalline arrays reported by us[25] and those of
PTCDA (perylene tetracarboxylic dianhydride) solid crystalline films (410-2 cm2/s)[41].
Exciton diffusion lengths in the assembled material are also comparable or higher than
the reported values for 2D PDI crystals (120 nm)[25], PTCDA films (61 nm)[41] and
PDI J-aggregates (96 nm)[45], indicating efficient exciton hopping. 10% THF assembly
showed almost no power dependence, in striking difference to other systems. This can be
attributed to the exciton trapping[21], probably at the large aromatic “edges” in the 10%
THF crystals.
Super-resolution fluorescence microscopy measurements were carried out in order to
further study the photonic behavior of the systems. Interestingly, the 5% THF system
displayed emission that was localized at regions that appeared to be matching the shape
and dimensions of the crystal’s edges (Figure S13), with a clear preference for emission
at the crystal corners (the microscopy of the 10% THF system did not provide reliable
super-resolution images). This further underscores the influence of crystal morphology
on the photonic properties,46 and will be a subject of future studies.
Experimental
General information. The 1
H, and 13
C NMR spectra were recorded at 20 °C on 300
MHz NMR spectrometer (Bruker). Electrospray Ionization (ESI) Mass-Spectrometry was
performed using Micromass Platform instrument. UV-vis absorption and fluorescence
Page 15
14
measurements were carried out on a Cary-5000 spectrometer (Varian) and Cary Eclipse
fluorimeter (Varian), respectively.
Preparation of assemblies Samples of compound 1 were prepared by dissolving the dry
material in THF followed by the injection of the THF solution into double-distilled water
(Barnstead NANOpure Diamond water system, used for all sample preparations) at the
desired pH (adjusted by adding NaOH solution). 5%0% THF samples were prepared
by an immediate evaporation of the THF co-solvent, followed by dilution with water to
the desired final concentration. Clear homogeneous pink solutions were obtained.
Transmission electron microscopy (TEM) imaging was performed using Tecnai T12
transmission electron microscope operated at 120 kV. Sample-preparation: 8 µl of each
sample was applied to a 400-mesh copper grid coated with carbon (on nitrocellulose
support) and blotted 2 minutes later from the back side of the grid.
Cryo-transmission electron microscopy (cryo-TEM) imaging was performed using a
Tecnai F20 transmission electron microscope operating at 200 kV, and using a Gatan 626
cooling holder and transfer station with a Gatan US4000 CCD digital camera, or a Tecnai
T12 transmission electron microscope operated at 120 kV, using a Gatan 626 cooling
holder and transfer station, with a TVIPS F244HD CCD digital camera. Sample-
preparation: 8 μL of each sample was applied to a 300-mesh copper grid coated with
holey carbon (Pacific Grid-Tech supplies). The samples were blotted at 25°C and 95%
relative humidity, and plunged into liquid ethane using Leica EM-GP Automatic Grid
Plunger. Specimens were equilibrated at -178°C in the microscope prior to the imaging
process. Time dependent cryo-TEM samples were prepared just before the plunging,
Page 16
15
using a stopwatch. The same assembly solution that was plunged at t=1 minute was used
again at t=5 minutes and t=30 minutes in order to elucidate the structural evolution of the
self-assembled crystals.
Femtosecond transient absorption spectroscopy was performed using a system based on
a mode-locked Ti:sapphire oscillator (Spectra Physics MaiTai). The oscillator produces a
train of <120-fs pulses (bandwidth ~10 nm FWHM), with a peak wavelength centered at
800 nm. The weak oscillator pulses are amplified by a chirped pulse regenerative
amplifier (CPA) (Spectra Physics Spitfire ACE). The pulses are first stretched, then
regeneratively amplified in a Ti:sapphire cavity, pumped by a pulsed Nd :YLF laser
(Spectra Physics Empower 45) operating at 1 kHz. After the pulse has been amplified and
recompressed, its energy is about 5.0 mJ in a train of 1-kHz pulses, and about 1mJ is used
in the transient absorption set-up. An independent pump pulse is obtained by pumping an
optical parametric amplifier (Spectra Physics OPA-800CF) that produces 120-fs pulses
tunable from 300 nm to 3 μm. The output power of the OPA is a few micro joules
(depending on the chosen wavelength) at 1 kHz. The pump beam is mechanically
chopped at half the amplifier repetition rate. The chopper (C-995 TTI) is synchronized
with the Spitfire pulses. Normally a few thousand pulse pairs (pump on/pump off) are
averaged to produce a transient absorption spectrum with a noise level below 0.3 mOD.
A small portion of the remaining amplified pulse is used to generate a white light
continuum as a probe pulse. To this end, the Ti:sapphire beam is focused onto a 3-mm
thick sapphire disk by a 10-cm focal length lens, and the numerical aperture of the beam
is controlled by an iris placed in front of the lens to obtain a stable and smooth white light
continuum. The resulting beam is passed through a Raman notch filter in order to remove
Page 17
16
the remains of the 800 nm fundamental beam from the probe white light continuum. The
pump and probe pulses are crossed in the sample at a small angle, while maintaining a
magic angle between the pump and probe polarizations. The remains of the pump pulse
are removed by passing the probe through an iris, and it is then imaged onto an optical
fiber that brings it into a fiber optic interface, which focuses the light onto the entrance
slit of a Jobin Yivon Triax 180 spectrograph. The light is normally dispersed by a 300
gr/mm grating onto a fast CCD camera (Andor Newton DU-970N-UV, operating at 1,000
spectra per second using "crop mode"). The whole setup is controlled by National
Instruments LabView software. A variable neutral-density filter was employed to adjust
the pump power for studying the power dependence. The pump power intensities were
measured using an Ophir powermeter with a photodiode sensor in proximity to the
sample. The excitation densities were calculated for a laser spot of 300 μm diameter on
the sample. This diameter was measured by placing beamprofiler (Ophir Beamstar FX33)
at the sample position and determining the 4-sigma (95% of the power) parameter. In the
reported experiments the pump was tuned to 525 or to 590 nm and the optical densities of
the samples (in 4 mm and 2 mm optical path length cuvettes) were kept between 0.2 and
0.5 at the excitation wavelength. The instrument response function (300 fs) was recorded
by repetition of the experiments with sample replaced by pure solvent and keeping all
other parameters unchanged. Spectral corrections and analysis were performed using
Surface Xplorer Pro (Ultrafast Systems) and Origin 7.5 (OriginLab) software.
Conclusions
Page 18
17
We have demonstrated that a simple amphiphilic building block assembles into well-
defined free-floating crystals in aqueous media. The crystalline assemblies are stable and
their morphology can be fine-tuned as a function of the initial THF concentration or the
pH in the assembly solution. The nanocrystals demonstrate morphologically-dependent
photonic properties, showing uniquely dissimilar exciton diffusion behavior. Facile
fabrication of well-defined nanocrystals combined with the ability to control their
morphology and photonic properties represents a convenient structure/function tool
advancing the applicability of organic nanocrystals.
Supporting Information
Supporting Information File 1.
Funding
This work was supported by grants from the Israel Science Foundation, Minerva
Foundation, Schmidt Minerva Center for Supramolecular Architectures, and the Helen
and Martin Kimmel Center for Molecular Design.
References
1. Brus, L. Appl. Phys. A 1991, 53, 465–474.
Page 19
18
2. Kelly, K. L.; Coronado, E.; Zhao, L. L.; Schatz, G. C. J. Phys. Chem. B 2003, 107,
668–677.
3. Alivisatos, A. P. Science 1996, 271, 933–937.
4. Halperin, W. Rev. Mod. Phys. 1986, 58, 533–606.
5. Peng, X.; Schlamp, M. C.; Kadavanich, A. V.; Alivisatos, A. P. J. Am. Chem. Soc.
1997, 119, 7019–7029.
6. Colvin, V. L.; Schlamp, M. C.; Alivisatos, A. P. Nature 1994, 370, 354–357.
7. Kasai, H.; Nalwa, H. S.; Oikawa, H.; Okada, S.; Matsuda, H.; Minami, N.; Kakuta,
A.; Ono, K.; Mukoh, A.; Nakanishi, H. Jpn. J. Appl. Phys. 1992, 31, L1132–
L1134.
8. Iida, R.; Kamatani, H.; Kasai, H.; Okada, S.; Oikawa, H.; Matsuda, H.; Kakuta, A.;
Nakanishi, H. Mol. Cryst. Liq. Cryst. Sci. Technol. A. 1995, 267, 95–100.
9. Fu, H.-B.; Wang, Y.-Q.; Yao, J.-N. Chem. Phys. Lett. 2000, 322, 327–332.
10. Kasai, H.; Kamatani, H.; Okada, S.; Oikawa, H.; Matsuda, H.; Nakanishi, H. Jpn.
J. Appl. Phys. 1996, 35, L221–L223.
11. Fu, H.-B.; Yao, J.-N. J. Am. Chem. Soc. 2001, 123, 1434–1439.
Page 20
19
12. (a) Baba, K.; Kasai, H.; Masuhara, A.; Oikawa, H.; Nakanishi, H. Jpn. J. Appl.
Phys. 2009, 48, 117002–2 –117002–4. (b) Fery-Forgues, S. Nanoscale 2013, 5,
8428-8442.
13. (a) Nakanishi H.; Katagi, H. Supramol. Sci. 1998, 5, 289–295. (b) Rosenne, S.;
Grinvald, E.; Shirman, E.; Neeman, L.; Dutta, S.; Bar-Elli, O.; Ben-Zvi, R.;
Oksenberg, E.; Milko, P.; Kalchenko, V.; Weissman, H.; Oron, D.; Rybtchinski, B.
Nano Lett. 2015, 15, 7232-7237. (c) Schierl, C.; Niazov-Elkan, A.; Shimon, L. J.
W.; Feldman, Y.; Rybtchinski, B.; Guldi, D. M. Nanoscale 2018, 10, 20147-
20154.
14. Kasai, H.; Murakami, T.; Ikuta, Y.; Koseki, Y.; Baba, K.; Oikawa, H.; Nakanishi,
H.; Okada, M.; Shoji, M.; Ueda, M.; Imahori, H.; Hashida, M. Angew. Chem. Int.
Ed. 2012, 51, 10315–10318.
15. Zhao, Y. S.; Fu, H.; Peng, A.; Ma, Y.; Xiao, D.; Yao, J. Adv. Mater. 2008, 20,
2859–2876.
16. Komai, Y.; Kasai, H.; Hirakoso, H.; Hakuta, Y.; Okada, S.; Oikawa, H.; Adschiri,
T.; Inomata, H.; Arai, K.; Nakanishi, H. Mol. Cryst. Liq. Cryst. Sci. Technol. A.
1998, 322, 167–172.
17. Jiang, H.; Zhang, K. K.; Ye, J.; Wei, F.; Hu, P.; Guo, J.; Liang, C.; Chen, X.;
Zhao, Y.; McNeil, L. E.; Hu, W.; Kloc, C. Small 2013, 9, 990–995.
Page 21
20
18. Hiremath, R.; Basile, J. A.; Varney, S. W.; Swift, J. A. J. Am. Chem. Soc. 2005,
127, 18321–18327.
19. Kang, J. F.; Zaccaro, J.; Ulman, A.; Myerson, A. Langmuir 2000, 16, 3791–3796.
20. Briseno, A. L.; Aizenberg, J.; Han, Y.; Penkala, R. A.; Moon, H.; Lovinger, A. J.;
Kloc, C.; Bao, Z. J. Am. Chem. Soc. 2005, 127, 12164–12165.
21. Kim, B. J.; Yu, H.; Oh, J. H.; Kang, M. S.; Cho, J. H. J. Phys. Chem. C 2013, 117,
10743–10749.
22. Balakrishnan, K.; Datar, A.; Oitker, R.; Chen, H.; Zuo, J.; Zang, L. J. Am. Chem.
Soc. 2005, 127, 10496–10497.
23. Balakrishnan, K.; Datar, A.; Naddo, T.; Huang, J.; Oitker, R.; Yen, M.; Zhao, J.,
Zang, L. J. Am. Chem. Soc. 2006, 128, 7390–7398.
24. Zhang, Z.; Zhang, X.; Zhan, C.; Lu, Z.; Ding, X.; He, S.; Yao, J. Soft Matter 2013,
9, 3089–3097.
25. Che, Y.; Datar, A.; Balakrishnan, K.; Zang, L. J. Am. Chem. Soc. 2007, 129, 7234–
7235.
26. Weissbuch, I.; Lahav, M.; Leiserowitz, L. Cryst. Growth Des. 2003, 3, 125–150.
27. (a) Vekilov, P. G. Cryst. Growth Des. 2010, 10, 5007–5019. (b) Jehannin, M.;
Rao, A.; Colfen, H. J. Am. Chem. Soc. 2019, 141, 10120-10136.
Page 22
21
28. Sear, R. P. Int. Mater. Rev. 2012, 57, 328–356.
29. (a) Davey, R. J.; Schroeder, S. L. M.; Ter Horst, J. H. Angew. Chem. Int. Ed.
2013, 52, 2166–2179. (b) Tsarfati, Y.; Rosenne, S.; Weissman, H.; Shimon, L. J.
W.; Gur, D.; Palmer, B. A.; Rybtchinski, B. ACS Cent. Sci. 2018, 4, 1031-1036.
(c) Shahar, C.; Dutta, S.; Weissman, H.; Shimon, L. J. W.; Ott, H.; Rybtchinski, B.
Angew. Chem. Int. Ed. 2016, 55, 179-182.
30. Shahar, C.; Baram, J.; Tidhar, Y.; Weissman, H.; Cohen, S. R.; Pinkas, I.,
Rybtchinski, B. ACS Nano 2013, 7, 3547–3556.
31. (a) Krieg, E.; Rybtchinski, B. Chem. Eur. J. 2011, 17, 9016–9026. (b) Krieg, E.;
Niazov-Elkan, A.; Cohen, E.; Tsarfati, Y.; Rybtchinski, B. Noncovalent Aqua
Materials Based on Perylene Diimides. Acc. Chem. Res. 2019, 52, 2634-2646.
32. Cormier, R. A.; Gregg, B. A. Chem. Mater. 1998, 10, 1309–1319.
33. Kazmaier, P. M.; Hoffmann, R. J. Am. Chem. Soc. 1994, 116, 9684–9691.
34. Klebe, G.; Graser, F.; Hädicke, E.; Berndt, J. Acta Crystallogr. B 1989, 45, 69–77.
35. Zang, L.; Che, Y.; Moore, J. S. Acc. Chem. Res. 2008, 41, 1596–608.
36. Würthner, F.; Bauer, C.; Stepanenko, V.; Yagai, S. Adv. Mater. 2008, 20, 1695–
1698.
Page 23
22
37. Glatter, O.; Kratky, O. Small Angle X-ray Scattering, Academic Press, London,
1982.
38. Tidhar, Y.; Weissman, H.; Wolf, S. G.; Gulino, A.; Rybtchinski, B. Chem. Eur. J.
2011, 17, 6068–6075.
39. Wasielewski, M. R. J. Org. Chem. 2006, 71, 5051–5066.
40. Pope, C. E.; Swenberg, M. Electronic Processes in Organic Crystals and
Polymers, Oxford University Press, 1999.
41. Engel, E.; Leo, K.; Hoffmann, M. Chem. Phys. 2006, 325, 170–177.
42. Ahrens, M. J.; Sinks, L. E.; Rybtchinski, B.; Liu, W.; Jones, B.; Giaimo, J. M.;
Gusev, A. V.; Goshe, A. J.; Tiede, D. M.; Wasielewski, M. R. J. Am. Chem. Soc.
2004, 126, 8284–94.
43. Suna, A. Phys. Rev. B 1970, 1, 1716–1739.
44. Inoue, A.; Yoshihara, K.; Nagakura, S. Bull. Chem. Soc. Jpn. 1972, 45, 1973–
1976.
45. Marciniak, H.; Li, X.-Q.; Würthner, F.; Lochbrunner, S. J. Phys. Chem. A 2011,
115, 648–654.
46. Bisri, S. Z.; Takenobu, T.; Yomogida, Y.; Shimotani, H.; Yamao, T.; Hotta, S.;
Iwasa, Y. Adv. Funct. Mater. 2009, 19, 1728–1735.