This is an electronic reprint of the original article. This reprint may differ from the original in pagination and typographic detail. Powered by TCPDF (www.tcpdf.org) This material is protected by copyright and other intellectual property rights, and duplication or sale of all or part of any of the repository collections is not permitted, except that material may be duplicated by you for your research use or educational purposes in electronic or print form. You must obtain permission for any other use. Electronic or print copies may not be offered, whether for sale or otherwise to anyone who is not an authorised user. Chen, Yuwei; Zhu, Lingli; Tang, Jian; Pei, Ling; Kukko, Antero; Wang, Yiwu; Hyyppä, Juha; Hyyppä, Hannu Feasibility Study of Using Mobile Laser Scanning Point Cloud Data for GNSS Line of Sight Analysis Published in: MOBILE INFORMATION SYSTEMS DOI: 10.1155/2017/5407605 Published: 01/01/2017 Document Version Publisher's PDF, also known as Version of record Please cite the original version: Chen, Y., Zhu, L., Tang, J., Pei, L., Kukko, A., Wang, Y., ... Hyyppä, H. (2017). Feasibility Study of Using Mobile Laser Scanning Point Cloud Data for GNSS Line of Sight Analysis. MOBILE INFORMATION SYSTEMS, 2017, [5407605]. DOI: 10.1155/2017/5407605
Transcript
This is an electronic reprint of the original articleThis reprint may differ from the original in pagination and typographic detail
Powered by TCPDF (wwwtcpdforg)
This material is protected by copyright and other intellectual property rights and duplication or sale of all or part of any of the repository collections is not permitted except that material may be duplicated by you for your research use or educational purposes in electronic or print form You must obtain permission for any other use Electronic or print copies may not be offered whether for sale or otherwise to anyone who is not an authorised user
Chen Yuwei Zhu Lingli Tang Jian Pei Ling Kukko Antero Wang Yiwu Hyyppauml JuhaHyyppauml HannuFeasibility Study of Using Mobile Laser Scanning Point Cloud Data for GNSS Line ofSight Analysis
Published inMOBILE INFORMATION SYSTEMS
DOI10115520175407605
Published 01012017
Document VersionPublishers PDF also known as Version of record
Please cite the original versionChen Y Zhu L Tang J Pei L Kukko A Wang Y Hyyppauml H (2017) Feasibility Study of Using MobileLaser Scanning Point Cloud Data for GNSS Line of Sight Analysis MOBILE INFORMATION SYSTEMS 2017[5407605] DOI 10115520175407605
Research ArticleFeasibility Study of Using Mobile Laser ScanningPoint Cloud Data for GNSS Line of Sight Analysis
Yuwei Chen1 Lingli Zhu1 Jian Tang2 Ling Pei3 Antero Kukko1
YiwuWang1 Juha Hyyppauml1 and Hannu Hyyppauml4
1Department of Remote Sensing and Photogrammetry Finnish Geospatial Research Institute 02431 Masala Finland2GNSS Research Center Wuhan University Wuhan Hubei China3School of Electronic Information and Electrical Engineering Shanghai Jiao Tong University Shanghai China4Department of Real Estate Planning and Geoinformatics Aalto University Espoo Finland
Correspondence should be addressed to Jian Tang tangjianwhueducn
Received 1 September 2016 Revised 7 December 2016 Accepted 12 February 2017 Published 5 March 2017
Academic Editor Gonzalo Seco-Granados
Copyright copy 2017 Yuwei Chen et al This is an open access article distributed under the Creative Commons Attribution Licensewhich permits unrestricted use distribution and reproduction in any medium provided the original work is properly cited
Thepositioning accuracywith goodGNSSobservation can easily reach centimetre level supported by advancedGNSS technologiesHowever it is still a challenge to offer a robust GNSS based positioning solution in a GNSS degraded area The concept of GNSSshadowmatching has been proposed to enhance theGNSS based position accuracy in city canyons where the nearby high buildingsblock parts of the GNSS radio frequency (RF) signals However the results rely on the accuracy of the utilized ready-made 3D citymodel In this paper we investigate a solution to generate a GNSS shadow mask with mobile laser scanning (MLS) cloud dataThe solution includes removal of noise points determining the object which only attenuated the RF signal and extraction of thehighest obstruction point and eventually angle calculation for the GNSS shadow mask generation By analysing the data with theproposed methodology it is concluded that the MLS point cloud data can be used to extract the GNSS shadow mask after severalsteps of processing to filter out the hanging objects and the plantings without generating the accurate 3D model which depicts theboundary of GNSS signal coverage more precisely in city canyon environments compared to traditional 3D models
1 Introduction
GNSS plays an important role in current navigation appli-cations in a pervasive way However the accuracy andavailability of such solutions in city canyons are a well-knownproblem which has attracted researchersrsquo attention in thelast few decades Since currently the urbanization level indeveloped countries is more than 80 percent and about 50percent worldwide the majority of positioning demands arethus requested fromurban areasTherefore augmented solu-tions helping positioning and navigation in city canyons areobviously needed The main cause of degraded performanceof GNSS in the city canyons is that tall buildings block directradio signal path from the GNSS to users Part or even fullGNSS observations are missed because of the GNSS shadow
cast by the buildings nearby As a result the availability andaccuracy of positioning are not always guaranteed
However GNSS shadow information can be calculatedif 3D city model information is available by applying 3Dray tracing technique [1] to GNSS signals to analyse lineof sight (LOS) in the city canyon The shadow matchingconcept was first published in 2004 by Tiberius and Verbree[2] A corresponding GNSS shadow match technique hasbeen evaluated and proved its capability of refining the posi-tioning accuracy by many research groups recently [1ndash13]especially researchers from Britain they proposed the ideaand simulated the urban canyon case with multiple GNSSconstellations scenario [3] and utilized the 3D city model ofLondon to verify the idea [4 5] with visibility scoring algo-rithm [4] to achieve optimized positioning results in London
HindawiMobile Information SystemsVolume 2017 Article ID 5407605 11 pageshttpsdoiorg10115520175407605
2 Mobile Information Systems
Such technology was also to be investigated in Finland [8]United States [9ndash11] Canada [12] and Taiwan [13] Themajor advantage of the shadow matching technology is thatit is applicable to receivers which output standard NationalMarine Electronics Association (NMEA) messages Thus thepotential of the method is extensive which can be utilizedin various platforms to improve the position accuracy in theGNSS signal degrade area especially for low-end receivers
There have been several attempts to calculate LOS usingvarious 25D surfaces (Digital Surface Model (DSM) orDigital Terrain Model (DTM)) However all algorithms mayrely greatly on the accuracy and integrity of the 25D3Dsurfaces or models A 3D model is a simplified version of thereal world and some explicit details are omitted deliberatelyfor various reasons It influences the LOS analysis to someextent Normally the model accuracy varies between meter-level to decimetre-level [1] In this research the shadowmask is generated with centimetre level accurate MLS clouddata instead of any existing 3D models because we arguethat the modelling accuracy degraded during 3D modelreconstruction processing from point cloud
AMLS system consists of a mobile platform that is a cara laser scannerseveral laser scanners and possibly camerasIt is integrated with a georeferencing system consisting ofGNSS and inertial measurement unit (IMU) It providesgeoreferenced 3D point cloud of a measured scene with highaccuracy With good GNSS visibility the errors of MLS pointcloud are trivial Kaartinen et al [14] demonstrated that theelevation accuracy of commercial and research MLS systemswere better than 35 cm up to a range of 35mThe best systemachieved a planimetric accuracy of 25 cm over a range of45m Applications of MLS include extraction and modellingof buildings [15ndash19] trees [18 20ndash23] pole detection [21 24ndash28] and ground and road surface [18 29ndash31] and changedetection in fluvial environments [32] Also Nokia HERE(previously Navteq) True Cars and Google Street View Carsare collecting large data sets however no research based onthose data sets is released to the public yet
Processing of MLS data is a relatively new field ofscience One of the major disadvantages of the MLS is thelimited number of software applications capable of processingthe huge amount of data Current systems can provide ascanning rate ofmore than 1MptssThus efficient processingtechniques are needed especially when working with rawmobile laser scanning data
In this paper a novel solution for GNSS LOS analysisis demonstrated to generate the GNSS shadow mask usingMLS point cloud data The solution includes (1) removal ofnoise points (2) removal of points coming from objects thatdo not interfere with GNSS such as wires and poles anddetermining the objects only attenuating the RF signal and(3) the highest point extraction and the angle calculation forshadowmask generationThe following section explains whypoint cloud but not 3D models is utilized for shadow maskgeneration Section 3 summarizes the processing algorithmsfor MLS data followed by introduction of field tests forthe research Then we discuss the experimental results andanalyse them in detail Finally conclusions are drawn andfuture improvements are discussed
2 Why Point Cloud Rather Than 3D Models
A 3D model is a simplified version of the real world Inorder to distinct the difference between dense point cloudand 3Dmodel the following part is a brief introduction aboutthe procedure of 3D model reconstruction from point cloudThe reconstruction of 3D models of a scene is a complicatedprocess The universal point cloud processing methods toautomatically generate 3D models are still not availableThe dedicated modelling methods for different objects arediverse as aforementioned in introduction [15ndash33] Howeverin general the processing chain includes the following stepsas Figure 1 presented (i) noise point filteringreductionfrom the georeferenced point cloud (ii) object classificationgrounds buildings roads trees and other street furnituresuch as traffic signs and fences (iii) building reconstructionby planar detection edge generalization from zigzagged pointcloud to extract the outline of a plane (roof or facade)constrained right-angle processing for all edges (iv) foreignobjects filtering such as the hanging objects and the plantsto minimize the size and complexity of the generated 3Dmodel (v) meshing or triangulating the building geometry(vi) texture mapping project rectified images onto buildingroofs and facades With proposed method shadow mask isavailable without a specific and detailed 3D city model butraw point cloud which will save excessive labour cost andsystem investment
Compared to original point cloud it is possible that theaccuracy degrades during the model reconstruction in eachaforementioned step Figure 2 shows an example as part ofthe model reconstruction As it can be observed the edges inunorganized point cloud are jagged The outline extractionfrom a planar roof points is the process of generalizationUsually after 3D model reconstruction an evaluation is nec-essary to check which accuracy level has been achieved whencompared to the original point cloud Therefore when using3Dmodels for shadowmatching there are several issues thatneeded to be considered (i) what kind of data sources hasbeen used for 3Dmodel generation (ii) what kind of methodhas been used for the 3D model reconstruction (iii) whatkind of accuracy level has been achieved in the resulting3D models This paper will not extend these topics too farbecause they are beyond the scope of this paper However itis clear that when the 3D models are reconstructed the lossof the accuracy is inevitable
The point cloud data quality of the adoptedMLS platformwas already analysed in Kaartinen et al [14] there was noneed to analyse further the point cloud quality and betterthan 5 cm accuracy of the data is guaranteed in the wholeexperiment which is more accurate than most available 3Dmodels A potential application for such technology is thatit can utilize the point cloud generated by the LiDAR sensorequipped by autonomous driving car in near future
In this research we investigate the feasibility of utilizingpoint cloud collecting by MLS platform to generate theshadowmask by removing the objects which only attenuatingthe GNSS signal The enhancement comparison between theproposed method and other will be discussed future if acentimetre level accurate 3D model of the investigated area
Mobile Information Systems 3
Georeferencedpoint cloud generation
Noise reduction Foreign objectsfiltering
Objectclassification
Buildingreconstruction
Meshing thebuilding
geometryTexture mapping
Figure 1 General processing chain fromMLS data collection to 3D city model
Figure 2 An example of outline extraction from planar roof pointsa part of 3D model reconstruction
is available Besides the performance enhancement is a com-prehensive result affected by geometry of GNSS constellationselected GNSS receivers and the adopted algorithm (such asparticle filter and optimized visibility scoring scheme [4])
3 Methodology and Algorithm
As Figure 3 illustrating a typical shadow matching scenarioin the city canyon assuming the distance between thepedestrian and the building is 119889 the height of the building in3Dmodel is1198671015840 against its truth119867 the error 119864 introduced bythe inaccuracy of themodel 119890 (normally in several decimetresto meters level) can be calculated with
119864 = arctg( 119889119867) minus arctg(1198891198671015840)
= arctg( 119889119867) minus arctg(119889119867 + 119890)
(1)
As a result satellites 1198782 and 1198786 are excluded for the positioningcomputation when they actually should be used This isbecause these satellites are actually in view but the inaccuracyin the 3D model will excluded satellites 1198782 and 1198786 fromthe observed list It implies that the less accurate 3D modelmight cause the shadow matching positioning not applicable
H
d
S7S6S5
S4
S3
S2
S1
H998400
Figure 3 How the accuracy of the model affects the shadowmatching results
in practical It can also be concluded that this research haspotential benefits to improve the positioning accuracy withshadowmatching method if a more accurate 3D city model isavailable
One issue that has been addressed is that in this researchwe do not utilize the existing 3D model but investigate themethod to generate the GNSS shadow mask directly from3D point cloud collected from a MLS system 3D modelis actually a simplified expression of physical environmentwhich ignores some details on purpose while the point cloudcollected by theMLS contains themost detailed environmen-tal objectThus themethodology investigated in this researchis to filter out the unnecessary information to generate aGNSS shadow mask as precise as possible by consideringthe physical natures of the scanned environmental objectswithout generating a real 3D model from the point cloud
In this research a small-footprint phase-based laserscanner is utilizedThemajor reasons that phase-basedmodelis used rather than a pulse-based version are explained in thefollowing
(1) Phase-based model has smaller field of view (FOV)the one utilized for this research has 019mRad FOVwhilemost pulse-based laser scanners arewith severalmRad FOV Considering the 25 metersrsquo range thebeam diameter at exit is 225mm and the maximumfootprint size of the adopted phased based model is
4 Mobile Information Systems
73mm which is considerably smaller in comparisonto 10ndash20 cm of larger FOV pulsed based scannersTo generate a point cloud as detailed as possible thefootprint should be small due to the fractional inter-ception of laser energy by scattered objects withinthe laser footprint Large footprint laser scanner willintroduce more measurement error [34ndash38]
(2) Phase-based model has higher acquisition speedcomparing with pulsed based model the acquisitionspeed of the selected model can be approximately 1Mpoint per second against 10sim100 k ofmost pulse-basedlaser scanners It implies that a considerable denserpoint cloud can be generated with a higher efficientmanner comparing with that generated by the pulse-based model In other words more details can beunveiled by the denser point cloud
(3) Phase-based model has higher range resolution Inthis research the range resolution is 1mm againstone to several centimetresrsquo range resolution of mostpulsed based models
(4) Phase-based model adopts the laser with less trans-mission power comparing with pulsed based laserscanner Eye safety is an issue determining the accep-tance of laser scanners especially for massive civilapplications
However the field measurements indicate that the phase-based laser scanner is more sensitive to environment factorand results in higher noise levels [38] A noise mitigatingprocedure is necessary to filter out the noise measurementbefore calculating the shadow mask
Thedata sources conducted in this research areMLSpointcloud (from a FARO Focus laser scanner) trajectory data(from a NovAtel SPAN georeferenced system) GNSS datacollected by a dual-frequency receiver (a NovAtel OEMVreceiver) and precise satellite ephemeris downloaded froman Internet service
MLS point cloud is a set of georeferenced points whichcontain 3D coordinates (119883 119884 119885) and intensity values Theresearch adopts ETRS-TM35FIN with GRS80 ellipsoidalheight map coordinate system in which 119883 is pointing tothe east 119884 towards the north and 119911-axis upwards In thisresearch when we mention ldquothe top viewrdquo it means in 119883119884plane view
Usually laser scanning point cloud contains much noiseas a result of failed ranging or multiple reflections whenreflecting surface is smaller than the footprint of the scan-ning laser point which will directly lead to wrong resultsTherefore it is comparably important to filter out the noiseand the noise reduction is the foundation of all point cloudprocessing Otherwise such sparsely existing spatial noisemight be recognized as the highest obstruction point infurther processing Normally the noise is present as isolatedpoint(s) and can be detected efficiently with a spatial filterAn adaptive spatial filter (ASF) was utilized to mitigatethe noise from raw laser scanning points After noise wasfiltered out we designed another ASF for detecting pointscoming from objects that do not interfere with GNSS for
example the hanging power cable flag From a GNSS userperspective those objects cast little GNSS shadow on theantenna of a receiver thus such objects do not attenuatethe physical signal strength of the GNSS However suchobjects do influence the calculation of the highest obstructionangles of the scene The ASF can also determine the objectswhich only attenuate the GNSS signal rather than block itsuch as plantings Next the highest obstruction angle foreach azimuth along a grid point can be calculated Finallythe GNSS visibility map for the whole area is built with ahigh density two-dimensional grid for example with 1-meterspacing
31 NoiseMitigation Processing of RawLaser Point Cloud TheASF for noise mitigation was developed based on the isolateddistribution characteristic of the noise with the followingsteps
(1) The point cloud is projected into 2D views of119883119884119883119885and 119884119885 planes
(2) From each 2D view we use a bivariate histogram toanalyse each grid (with a grid size of 15 times 15 meters)and calculate the number of points that fall in eachgrid
(3) If the number of points is less than the threshold ofthe filter (150 as initialized value with current systemconfiguration) it was considered as noise
Because the filter is mainly for mitigating spatial noisewe refer to it as a ldquospatial filterrdquo The threshold setting of thespatial filter adaptively relies on the density of the point cloudnoise distribution the size of grid and the scene situationFor example when a scene contains water area or a large areaof glass-made objects noise level will be higher Thereforeuser knowledge and experience are needed for setting thethreshold value
32 Space Hanging Objects and Plantings Detection andRemoval Space hanging objects for example pipelinespowerlines and hanging flags are ubiquitous and usually asa part of a cityrsquos infrastructure especially in the city canyonwhich cast too little GNSS shadowon theGNSS receiver to beconsidered changing the visibility of the satellites Thereforethese objects need to be removed from the scene beforethe calculation of the highest obstruction angle In additionconsidering the complex of the scene for example when aperson is located under a bridge or a tunnel the concretestructure of these objects would block the signals In thiscase the high buildings near the bridge cannot always beconsidered as the highest obstruction angles Therefore avoxel based algorithm is developed to detect the location ofa view point in open area or under a bridge or a tunnel Weassume a voxelwith a size of 5times 5times 5metersWeput this voxelcentred at the view point and the bottom from2meters heightabove ground The points inside the voxel can be analysedaccording to the number and the density of the points Whenthe number and the density of the points are greater thanthe thresholds it is accepted as the bridge or tunnel points
Mobile Information Systems 5
Whole object (bridge or tunnel) can be detected by applyingregion grow method We analyse the neighbouring points ofeach candidate for the highest point If the number of pointsaround the candidate has an ignorable change in verticaldirection we consider it as an object hanging in the air and itis therefore removed Poles and wires can also be removed byother specific algorithms such as [25] for poles and [33] forwires
The highest points generated by the plantings have itsunique sparse pattern against the linear sky line generatedby regular buildings when we project it into the top view asFigure 12(c) presents It can be easily detected and removedwith a two-dimensional spatial filter
33 The Highest Point Extraction and the Highest ObstructionAngle Calculation After the noise and space hanging objectdetection and removal for each grid point the GNSS shadowmap of the scene can be evaluated by choosing the pointcloud within a radius of 25 meters 2D-distance from the gridpoint A low building close to the user might yield to largerelevation angle than a high building far away 25 meters is acompromise and empirical value between the computationalcomplexity and performance and the total number of pointcloud within the radius is approximate hundreds of millionbased on current system setup In a city canyon the heightsof buildings vary from 5 meters to over 100 meters Thethreshold for the 3D distance from grid point is usuallydifficult to be definedTherefore it is more accurate to definea scene by choosing a 2D distance from a grid point
We set each grid point as Grid 119875whereas the scene pointswith 25meters or less 2Ddistance fromGrid 119875 are designatedas Scene 119875 A grid point Grid 119875 stands for a pedestrianstanding in this positionwhereas the range of the scene pointsrepresents a visual area in the position of Grid 119875 Grid 119875is calculated based on trajectory data collected by NovAtelSPAN and about 14 meters from ground surface Figure 4gives an example of the relationship between a grid point andits visual area in the 3D view and in the top view In order todemonstrate the obstruction of a scene in terms of the highestpoints from a top view of the Scene 119875 the Scene 119875 is dividedinto 360 sectors from the grid point at Grid 119875 Each sector is1∘
After the highest points of the surrounding scene of eachgrid point have been obtained elevation angle of the highestpoint with respect to the vertical direction is calculatedFigure 5 shows the definitions of the vertical angle The reddot is the grid point while the green dot shows one highestpoint surrounding in a scene Grid 119875119894 is the 119894th grid pointScene 119875119894119895 presents the highest point of 119895th degree of azimuthof the surrounding scene of the 119894th grid point 120572 representsthe elevation angle of the point ldquoScene 119875119894119895rdquo with respect tothe vertical direction
The angles are calculated as follows
120572 = arcsin 119885scene 119875119894119895 minus 119885Grid 119875119894120588 (2)
where ldquo119885scene 119875119894119895rdquo and ldquo119885Grid 119875119894rdquo are the 119911-axis coordinates ofthe point ldquoScene 119875119894119895rdquo and the point ldquoGrid 119875119894rdquo respectively
ldquo120588rdquo stands for the 3D distance between the point ldquoScene 119875119894119895rdquoand the point ldquoGrid 119875119895rdquo
34 The GNSS Shadow Mask Based on the elevation angleof each azimuth the sky plot of GNSS shadow mask of eachgrid can be drawn Figure 6 presents one example of azimuth-elevation pairs in a sky plot in a test field where the red circlesstand for Space Vehiclersquos (SV)GNSS satellitesrsquo positionsbased on the ephemeris data and with corresponding satelliteID the blue line stands for the boundary of the GNSS shadowextracted from the MLS data with the above-mentionedASF applied GNSS satellites with elevation angles below thedetermined boundary were blocked by the buildings fromthe GNSS usersrsquo perspective Therefore the GNSS shadowmask of each grid extracted from the MLS became a usefulinformation for positioning Such spatial information couldbe utilized by the GNSS shadow matching methodology toenhance the positioning accuracy
35 Two Scenarios for Investigation In this research twospecial scenarios of the city canyon are investigated besidestypical scenario the first is scenario with hanging objectssuch as flags and cables as Figure 7(a) presents and Figure 7(b)presents the city canyonwith plantingswhichmight attenuatethe GNSS RF signal but not block it It is well knownthat the GNSS observability along the canyon direction isbetter than the cross direction due to the topography ofthe city canyon However if there are some hanging objectslike power cables hanging lights and flags that exist itmight be processed as the highest obstruction point in thealong canyon direction which might redefine in most casesnarrow down the boundary of the GNSS shadow maskThus an adaptive spatial filter needs to be designed to filterout the hanging objects in the point cloud We name suchhanging objects cases as ldquoCASE Irdquo in the following contextThe same consequence occurs if there are some plantingsexisting nearby as Figure 7(b) presents When the plantingsare close to the observing point the highest obstruction pointintroduced from the point cloud of the plantings might alsoredescribe the GNSS shadowmaskThus another ASF shouldbe designed to deal with the case Such scenario is named asldquoCASE IIrdquo in the following research
4 MLS Data Collection
MLS data used for the experiment were collected byROAMER mobile mapping system developed by the FinnishGeospatial Research Institute (FGI) as Figure 8 presents inTapiola shopping centre area Espoo Finland which is a 300-by-300-meter area with buildings of varying size and height[39] The MLS system can be applied to different platformsthat is car trolley and boat and also for personal backpack[40] The effective range of ROAMER was 78 meters and thescanning rate could reach approximate 1Ms With regard tothe experiment the system employed a trolley as a platformto collect data to enter also pedestrian alleys at speed of about1ms
6 Mobile Information Systems
Point could segment into 350 sectors
1-degree sectorUser location
MetersMeters
3781137811
378113781
3780937809
3780937808
times105
66736673
66736673
66736673
66736673
times106
30
40
50
Met
ers
(a)
Point could segment into 350 sectors
times105
6673
6673
6673
6673
6673
6673
6673
6673
Met
ers
Meters
3781
1
3781
1
3781
1
3781
3780
9
3780
9
3780
9
3780
8
1-degree sectorUser location
times106
(b)
Figure 4 Illustration of a visual area at a grid point (Grid 119875) and how the points are divided into 360 sectors (1∘ as one sector) in (a) 3D viewand (b) 119909-119910 plane view
X
Z
Y
Scene_Pij
Grid_Pi
120572
Figure 5 The vertical angle calculation
5 Results and Discussions
Figure 9 illustrates the effectiveness of the ASF for noisemitigation The red dots present the noise measurementswithin the MLS collected point cloud Most of the sparsenoise hanging in space has been filtered outwith the filterTheresulting filtered point cloud was used for the highest pointextraction
Figure 10 shows the detection of the highest points byremoving the cable-like objectsThe black dots are the highestpoints of each azimuth in one scene and the red point inthe figure stands for a grid point The colours in the figureindicate height From the figure it can be observed that allspace hanging objects in the scene are detected and removed
Figure 11 shows a comparison of the highest pointextraction with Figure 11(a) and without Figure 11(b) thespace hanging objects Without adapting the spatial filtermany of the extracted mask points are located on three
Sky plot
124
9
10
12
14
20
23
25
2931
Blocked SVVisible SV
Boundary
10∘50∘ 70∘
0∘
15∘
30∘
30∘
45∘
60∘75∘90∘105∘
120∘
135∘
150∘
165∘
180∘
195∘
210∘
225∘
240∘
255∘ 270∘ 285∘300∘
315∘
330∘
345∘
Figure 6 GNSS shadow mask sky plot
hanging cables between two buildings in the scene Cablesare detected and deleted with the ASF from the highestpoints list as Figure 11(b) shows The difference is moreobvious when we project all highest point to 119883119884 plane
Mobile Information Systems 7
S6S5
S4
S3
S2
(a)
S7S6S5
S4
S3
S2
S1
(b)
Figure 7 Two special scenarios investigated in this research (a) city canyon with hanging objects (b) city canyon with nearby plantings
Figure 8 ROAMER on data collecting in Tapiola Finland
as Figures 11(c) and 11(d) present Figure 11(e) shows thedifference of the two GNSS shadow masks The blue circleline depicts the boundary of shadow with the spatial filterwhich has much lower elevation angle in the cross canyon(north-south) direction in comparison to the red star linewhich is drawn based on the unfiltered data From the redstar line we can perceive that there are three cables existing
The highest points in the scene
55
50
45
40
35
30
25
MeterMeter
Met
er
66736673
66736673
66736673
66736673
times106times105
Highest pointsUser location
37817
37817
37816
37816
37815
37815
37814
37814
Figure 10The results of the highest points detection after the spacehanging object filter has been applied
in the observed area and there are two dents in the red circlebetween 50∘ to 55∘ and minus135∘ to minus140∘ it is identified to betwo lights hung on power cables for illustration in TapiolaWe can observe that the designASF can correctly filter out thehanging objects and generate the GNSS shadow mask whichis more precise in depicting the GNSS visibility in city canyonenvironments for CASE I scenario
Figure 12 presents the effectiveness of the design ASF forCASE II scenario in city canyon As Figures 12(a) and 12(c)shown all sparse distributed highest points introduced bythe plantings have been filtered out and a more clear GNSSmask is generated in Figures 12(b) and 12(d) By comparingthe GNSS shadow masks generated with the method withand without ASF some conclusions can be drawn (1) theproposed ASF can correctly filter out the highest pointgenerated by the nearby plantings (2) the signal attenuated
8 Mobile Information Systems
55
50
45
40
35
30
25
MetersMeters
Met
ers
66736673
66736673
6673
times106times105
Highest pointsUser location
3781737817
3781637816
37815
(a)
55
50
45
40
35
30
25
MetersMeters
Met
ers
66736673
66736673
6673
times106times105
Highest pointsUser location
3781737817
3781637816
37815
(b)
Highest pointsUser location
times106
times105
6673
6673
6673
6673
6673
6673
Met
ers
37815 37816 37816 37817 37817 3781837815
Meters
(c)
times106
times105
6673
6673
6673
6673
6673
6673
Met
ers
37815 37816 37816 37817 37817 3781837815
Meters
Highest pointsUser location
(d)
With spatial filterWithout spatial filter
Sky plot comparison of the shadow mask0∘
0∘
15∘
30∘
45∘
60∘
75∘
90∘
105∘
120∘
135∘
150∘
165∘
50∘
70∘
30∘
minus15∘
minus30∘
minus45∘
minus60∘
minus75∘
minus90∘
minus105∘
minus120∘
minus135∘
minus150∘
minus165∘ plusmn180∘
(e)
Figure 11 (a) Highest points extraction without ASF (b) highest points extraction with ASF (c) top view of the extracted highest points in119883119884 plane without ASF (d) top view of the extracted highest points in119883119884 plane with ASF GNSS and (e) shadow mask sky plot generated bythe methods with and without ASF in CASE I
Top view of the highest points with spatial filter
(d)
50∘
70∘
30∘
10∘
0∘15∘
30∘
45∘
60∘
75∘
90∘
105∘
120∘
135∘
150∘
165∘ 180∘ 195∘210∘
225∘
240∘
255∘
270∘
285∘
300∘
315∘330∘
345∘
With filterWithout filter
Sky plot comparison
(e)
Figure 12 (a) Highest points extraction without ASF (b) highest points extraction with ASF (c) top view of the extracted highest points in119883119884 plane without ASF (d) top view of the extracted highest points in 119883119884 plane with ASF GNSS and (e) shadow mask sky plots generatedby the methods with and without ASF in CASE II
10 Mobile Information Systems
by the planting can also be utilized as a special signal ofopportunity (SOP) for positioning to improve the locationaccuracy because the attenuation introduced by trunk orfoliage should be lower comparing the attenuation caused bybuildings resulting in lower SNR GNSS signal
6 Conclusion
By analysing theMLS point cloud data and by applying devel-opedASF it is concluded thatMLS data can be used to extractGNSS shadow masks after a series of appropriate processingsteps to filter out the hanging objects and the plantings Sincethe seamless MLS point cloud data has centimetre accuracythe extracted GNSS shadow mask is more precise comparedwith the ones generated from traditional 3D models wherethemodel error is several decimetres [1] or even higher Sincepoint cloud from city and roadside areas are collected bylarge geospatial data providerswithmobilemapping and laserscanning technology such as Nokia HERE and Google whoare also the major players in the fields of positioning andnavigation there are possibilities to implement the presentedmethods for the benefit of GNSS users in city environments
In future research we will generate a dense two-dimensional grid with 1-meter spacing GNSS shadow maskdatabase for testing GNSS shadow matching to enhancethe position accuracy in city canyons As far as we knowit would be the most detailed and dense database withcentimetre level accuracyMore specific field tests are plannedto be conducted in the test area to evaluate its improve-ment of pedestrian navigation applications by comparingthe performance between the MLS method and the 3D citymodels for the elevation mask determination We also aimto analyse the attenuation introduced by trunk and foliageon GNSS signals to investigate a more precise GNSS shadowmatching algorithm in city canyon environments that takesinto account city plants
Competing Interests
The authors declare that they have no competing interests
Acknowledgments
The research is financially supported by Academy of Finland(New Laser and Spectral Field Methods for In Situ Miningand Raw Material Investigations (292648)) and StrategicResearchCouncil at theAcademy of Finland is acknowledgedfor financial support (Project Decision no 293389) Addi-tionally Chinese Academy of Science (181811KYSB20130003181811KYSB20160113) China Ministry of Science and Tech-nology (2015DFA70930) andNationalNatural Science Foun-dation of China (41304004) are acknowledged
References
[1] L Wang P D Groves and M K Ziebart ldquoUrban positioningon a smartphone real-time shadow matching using GNSS and3D city modelsrdquo Inside GNSSMagazine vol 8 no 6 pp 44ndash562013
[2] C Tiberius and E Verbree ldquoGNSS positioning accuracy andavailability within Location Based Services the advantagesof combined GPS-Galileo positioningrdquo in Proceedings of theESAEstec Workshop on Satellite Navigation User EquipmentTechnologies G S Granados Ed pp 1ndash12 ESA PublicationsDivision Noordwijk The Netherland 2004
[3] P D Groves ldquoShadow matching a new GNSS positioningtechnique for urban canyonsrdquo Journal of Navigation vol 64 no3 pp 417ndash430 2011
[4] L Wang P D Groves and M K Ziebart ldquoGNSS shadowmatching improving urban positioning accuracy using a 3Dcity model with optimized visibility prediction scoringrdquo in Pro-ceedings of 25th International Technical Meeting of the SatelliteDivision of the Institute of Navigation (ION GNSS rsquo12) pp 423ndash437 Nashville Tenn USA 2012
[5] L Wang P D Groves and M K Ziebart ldquoMulti-constellationGNSS performance evaluation for urban canyons using largevirtual reality city modelsrdquo Journal of Navigation vol 65 no3 pp 459ndash476 2012
[6] MAdjrad andPDGroves ldquoIntelligent urban positioning usingshadow matching and GNSS ranging aided by 3D mappingrdquoin Proceedings of the 29th International Technical Meeting of theSatellite Division of the Institute of Navigation (ION GNSS rsquo16)Portland Ore USA September 2016
[7] M Adjrad and P D Groves ldquoEnhancing conventional GNSSpositioning with 3D mapping without accurate prior knowl-edgerdquo in Proceedings of the 28th International Technical Meetingof the Satellite Division of the Institute of Navigation (ION GNSSrsquo15) pp 2397ndash2409 Tampa Fla USA September 2015
[8] R Chen and J Liu ldquoMitigating GNSS positioning errors using3D spatial attributes of map datardquo Finnish Patent 20110073January 2011
[9] J T Isaacs A T Irish F Quitin U Madhow and J PHespanha ldquoBayesian localization and mapping using GNSSSNR measurementsrdquo in Proceedings of the IEEEION PositionLocation and Navigation Symposium (PLANS rsquo14) pp 445ndash451IEEE Monterey Calif USA May 2014
[10] J Bradbury ldquoPrediction of urban GNSS availability and signaldegradation using virtual reality city modelsrdquo in Proceedings ofthe 20th International Technical Meeting of the Satellite Divisionof The Institute of Navigation (ION GNSS rsquo07) pp 2696ndash2706Fort Worth Tex USA September 2007
[11] J T Isaacs A T Irish F Quitin U Madhow and J PHespanha ldquoBayesian localization and mapping using GNSSSNR measurementsrdquo in Proceedings of the IEEEION PositionLocation and Navigation Symposium (PLANS rsquo14) pp 445ndash451May 2014
[12] R Kumar and M G Petovello ldquoA novel GNSS positioningtechnique for improved accuracy in urban canyon scenariosusing 3D city modelrdquo in Proceedings of the 27th InternationalTechnical Meeting of the Satellite Division of the Institute ofNavigation (ION GNSS rsquo14) vol 812 pp 2139ndash2148 Tampa FlaUSA 2014
[13] J-YHan and P-H Li ldquoUtilizing 3-D topographical informationfor the quality assessment of a satellite surveyingrdquo AppliedGeomatics vol 2 no 1 pp 21ndash32 2010
[14] H Kaartinen J Hyyppa A Kukko A Jaakkola andHHyyppaldquoBenchmarking the performance of mobile laser scanningsystems using a permanent test fieldrdquo Sensors vol 12 no 9 pp12814ndash12835 2012
[15] M Rutzinger B Hofle S O Elberink and G VosselmanldquoFeasibility of facade footprint extraction from mobile laser
[16] C Frueh S Jain and A Zakhor ldquoData processing algorithmsfor generating textured 3D building facade meshes from laserscans and camera imagesrdquo International Journal of ComputerVision vol 61 no 2 pp 159ndash184 2005
[17] L Zhu J Hyyppa A Kukko H Kaartinen and R Chen ldquoPho-torealistic building reconstruction from mobile laser scanningdatardquo Remote Sensing vol 3 no 7 pp 1406ndash1426 2011
[18] H Zhao and R Shibasaki ldquoReconstructing a textured CADmodel of an urban environment using vehicle-borne laser rangescanners and line camerasrdquo Machine Vision and Applicationsvol 14 no 1 pp 35ndash41 2003
[19] D Manandhar and R Shibasaki ldquoAuto-extraction of urbanfeatures from vehicle-borne laser datardquo International Archivesof Photogrammetry Remote Sensing and Spatial InformationSciences vol 34 pp 433ndash438 2002
[20] M Rutzinger A K Pratihast S J Oude Elberink and GVosselman ldquoTree modelling from mobile laser scanning data-setsrdquo Photogrammetric Record vol 26 no 135 pp 361ndash372 2011
[21] S Pu M Rutzinger G Vosselman and S Oude ElberinkldquoRecognizing basic structures from mobile laser scanning datafor road inventory studiesrdquo ISPRS Journal of Photogrammetryand Remote Sensing vol 66 no 6 pp S28ndashS39 2011
[22] E Puttonen A Jaakkola P Litkey and J Hyyppa ldquoTree clas-sification with fused mobile laser scanning and hyperspectraldatardquo Sensors vol 11 no 5 pp 5158ndash5182 2011
[23] A Jaakkola J Hyyppa A Kukko et al ldquoA low-cost multi-sensoral mobile mapping system and its feasibility for treemeasurementsrdquo ISPRS Journal of Photogrammetry and RemoteSensing vol 65 no 6 pp 514ndash522 2010
[24] C Brenner ldquoExtraction of Features from mobile laser scanningdata for future driver assistance systemsrdquo in Advances inGIScience-Proceedings of the 12th AGILE Conference LectureNotes in Geoinformation andCartography pp 25ndash42 SpringerBerlin Germany 2009
[25] M Lehtomaki A Jaakkola J Hyyppa A Kukko and HKaartinen ldquoDetection of vertical pole-like objects in a roadenvironment using vehicle-based laser scanning datardquo RemoteSensing vol 2 no 3 pp 641ndash664 2010
[26] M Lehtomaki A Jaakkola J Hyyppa A Kukko andH Kaarti-nen ldquoPerformance analysis of a pole and tree trunk Detectionmethod for mobile laser scanning datardquo in Proceedings of theISPRS CalgaryWorkshop on Laser Scanning pp 197ndash202 ISPRSCalgary Canada August 2011
[27] A Golovinskiy V G Kim and T Funkhouser ldquoShape-basedrecognition of 3D point clouds in urban environmentsrdquo inProceedings of the 12th International Conference on ComputerVision (ICCV rsquo09) pp 2154ndash2161 October 2009
[28] H Yokoyama H Date S Kanai and H Takeda ldquoPole-likeobjects recognition from mobile laser scanning data usingsmoothing and principal component analysisrdquo InternationalArchives of the Photogrammetry Remote Sensing and SpatialInformation Sciences vol 38 pp 115ndash120 2011
[29] A Jaakkola J Hyyppa H Hyyppa and A Kukko ldquoRetrievalalgorithms for road surface modelling using laser-based mobilemappingrdquo Sensors vol 8 no 9 pp 5238ndash5249 2008
[30] S-J Yu S R Sukumar A F Koschan D L Page and M AAbidi ldquo3D reconstruction of road surfaces using an integratedmulti-sensory approachrdquo Optics and Lasers in Engineering vol45 no 7 pp 808ndash818 2007
[31] C McElhinney P Kumar C Cahalane and T McCarthyldquoInitial results from European Road Safety Inspection (EuRSI)mobile mapping projectrdquo International Archives of the Pho-togrammetry Remote Sensing and Spatial Information Sciencesvol 38 pp 440ndash445 2010
[32] M Vaaja J Hyyppa A Kukko H Kaartinen H Hyyppa andP Alho ldquoMapping topography changes and elevation accuraciesusing a mobile laser scannerrdquo Remote Sensing vol 3 no 3 pp587ndash600 2011
[33] P Axelsson ldquoProcessing of laser scanner datamdashalgorithms andapplicationsrdquo ISPRS Journal of Photogrammetry and RemoteSensing vol 54 no 2-3 pp 138ndash147 1999
[34] J Jutila K Kannas and A Visala ldquoTree measurement in forestby 2D laser scanningrdquo in Proceedings of the IEEE Interna-tional Symposium on Computational Intelligence in Robotics andAutomation (CIRA rsquo07) pp 491ndash496 Jacksonville Fla USAJune 2007
[35] J Tang Y Chen L Chen et al ldquoFast fingerprint databasemaintenance for indoor positioning based on UGV SLAMrdquoSensors vol 15 no 3 pp 5311ndash5330 2015
[36] Y Chen J Tang J Hyyppa et al ldquoAutomated stem mappingusing SLAM technology for plot-wise forest inventoryrdquo inProceedings of the Ubiquitous Positioning Indoor Navigation andLocation-Based Services (UPINLBS rsquo14) pp 130ndash134 CorpusChristi Tex USA November 2014
[37] O Ringdahl P Hohnloser T Hellstrom J Holmgren andO Lindroos ldquoEnhanced algorithms for estimating tree trunkdiameter using 2D laser scannerrdquo Remote Sensing vol 5 no 10pp 4839ndash4856 2013
[38] T Nuttens C Stal J Wisbecq G Deruyter and A DeWulf ldquoField comparison of pulse-based and phase-based laserscanners for civil engineering applicationsrdquo in Proceedings of the14th InternationalMultidisciplinary Scientific Geoconference andEXPO (SGEM rsquo14) pp 169ndash176 Sofia Bulgaria June 2014
[39] A Kukko C-O Andrei V-M Salminen et al ldquoRoad environ-ment mapping system of the Finnish Geodetic InstitutemdashFGIROAMERrdquo International Archives of Photogrammetry RemoteSensing and Spatial Information Sciences vol 36 no 3W52 pp241ndash247 2007
[40] X Liang A Kukko H Kaartinen et al ldquoPossibilities of a per-sonal laser scanning system for forest mapping and ecosystemservicesrdquo Sensors vol 14 no 1 pp 1228ndash1248 2014


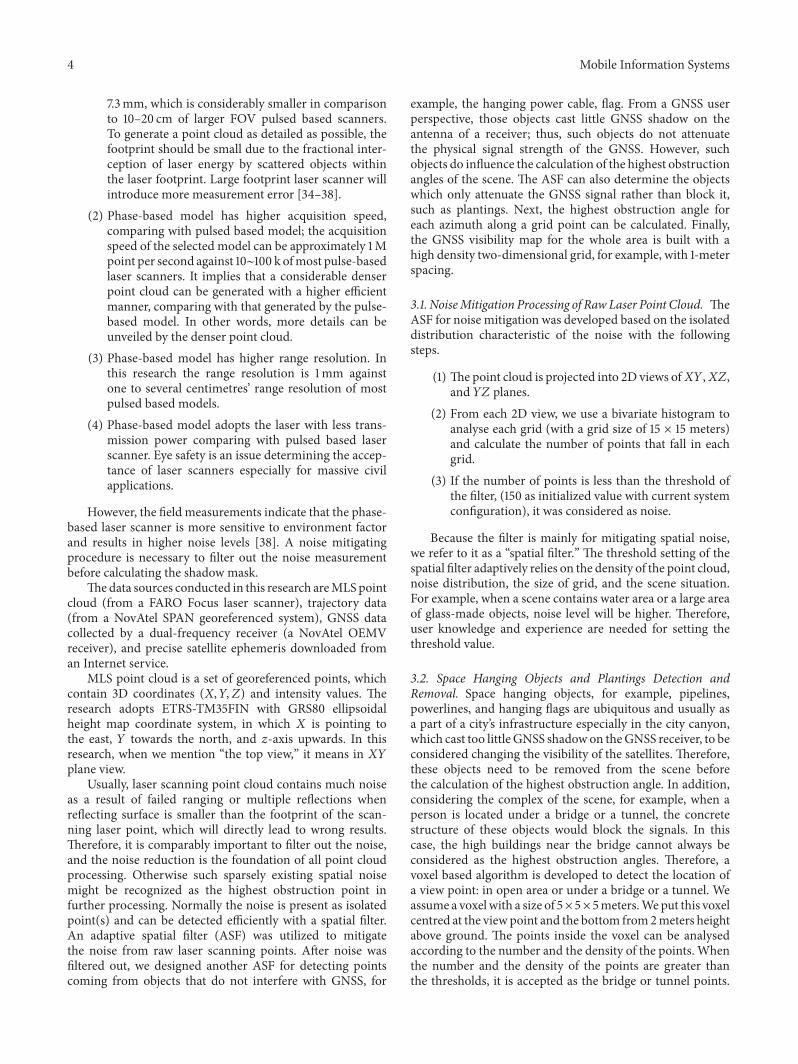


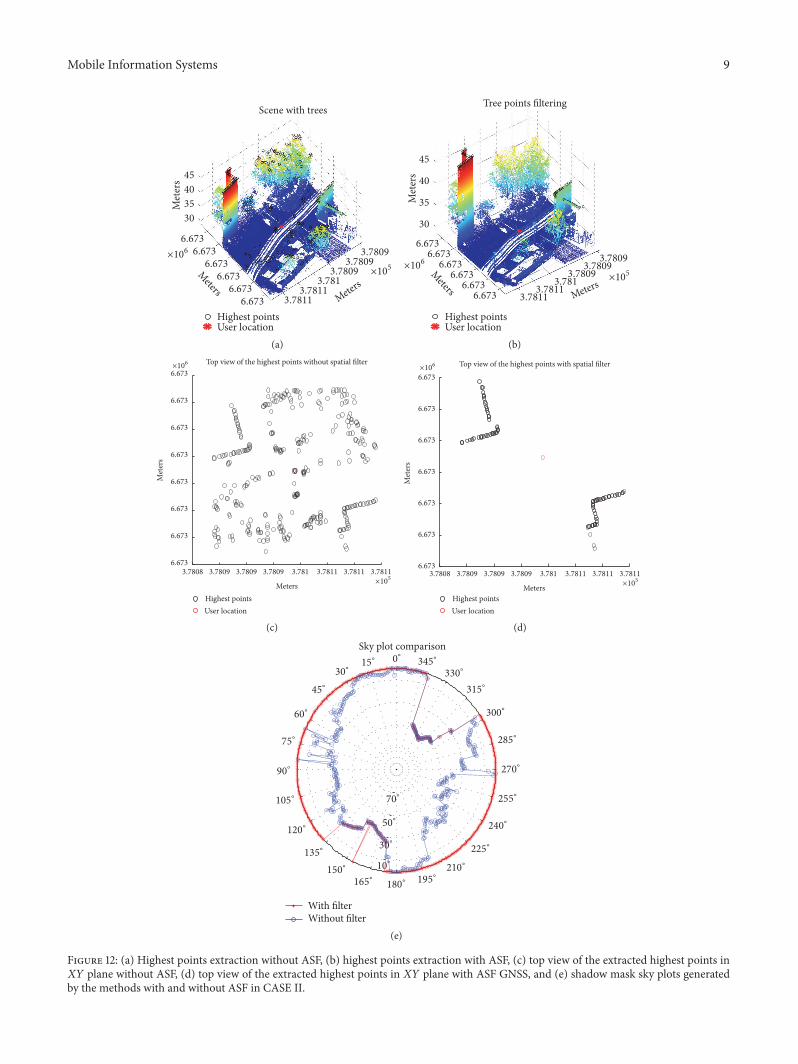


![Performance Evaluation of Distributed Mobility Management ...downloads.hindawi.com/journals/misy/2017/2568983.pdf · 2 MobileInformationSystems point of failure [5]. With these limitations,](https://static.documents.pub/doc/80x56/5f0f1c697e708231d4428b87/performance-evaluation-of-distributed-mobility-management-2-mobileinformationsystems.jpg)


