LOCATION 4965 N Hamilton Rd | Columbus, Ohio 4323 HIGHLIGHTS • 4,800 SF Restaurant Space - approximately 74’ x 65’ • Sublease until June 30, 2019, with one 5-year option • Signalized access • $39.00 psf + NNN • End-cap opportunity • Rare restaurant opportunity available at the Hamilton Rd & Morse Rd intersection TRAFFIC COUNTS N Hamilton Rd, North of Chilmark Dr = 22,509 VPD Morse Rd = 28,451 VPD CONTACT TORI NOOK [email protected] | 216.342.2550 CHRISTOPHER MCFARLAND [email protected] | 216.342.2559 24500 Chagrin Blvd., Suite 100 Beachwood, Ohio 44122 WWW.ANCHORCLEVELAND.COM • SUBLEASE OPPORTUNITY • 4,800 SF Available • Restaurant space Chestnut Hill II - Panera Bread Sublease 4965 N Hamilton Rd, Columbus, Ohio 43230 DEMOGRAPHICS 2016 Estimates 1 mile 3 mile 5 mile Population 14,154 71,577 164,333 Households 6,894 15,049 30,294 Average HH Income $93,963 $106,233 $89,952 Daytime Employees 6,202 35,259 95,022 MSA: COLUMBUS MSA LATITUDE: 40.057904 LONGITUDE: -82.864163
Transcript
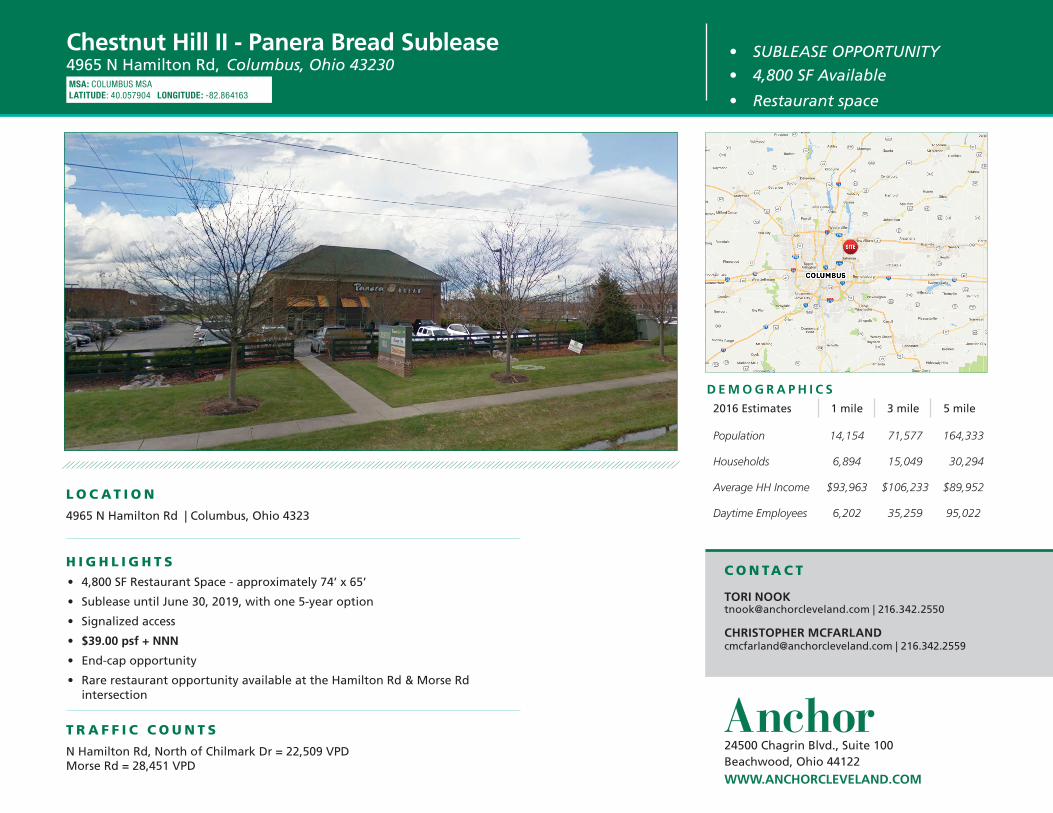
L O C AT I O N
4965 N Hamilton Rd | Columbus, Ohio 4323
H I G H L I G H T S• 4,800 SF Restaurant Space - approximately 74’ x 65’
• Sublease until June 30, 2019, with one 5-year option
• Signalized access
• $39.00 psf + NNN
• End-cap opportunity
• Rare restaurant opportunity available at the Hamilton Rd & Morse Rd intersection
T R A F F I C C O U N T S N Hamilton Rd, North of Chilmark Dr = 22,509 VPD Morse Rd = 28,451 VPD
Chestnut Hill II - Panera Bread Sublease 4965 N Hamilton Rd, Columbus, Ohio 43230
The information submitted herein is not guaranteed. Although obtained from reliable resources, it is subject to errors, omissions, prior sale and withdrawal from the market without notice. Anchor Cleveland, LLC, and its agents, associates and employees make no guarantee, warranty, or representation of the property. All images contained herein are the property of Anchor Cleveland, LLC and shall not be duplicated or reproduced without express written consent of Anchor Cleveland, LLC.
TORI NOOK - 216.342.2550 | CHRISTOPHER MCFARLAND - 216.342.2559
74’
65’
AnchorC L E V E L A N D
4,800 SF RESTAURANT FOR SUBLEASECHESTNUT HILL II | 4965 N Hamilton Rd | COLUMBUS, OH 43230
SITE PLAN
N
The information submitted herein is not guaranteed. Although obtained from reliable resources, it is subject to errors, omissions, prior sale and withdrawal from the market without notice. Broker has made no investigation and makes no representation of the property.24500 CHAGRIN BLVD #100 | BEACHWOOD, OH 44122 | 216-342-2523 | WWW.ANCHORCLEVELAND.COM
Chestnut Hill II - Panera Bread Sublease 4965 N Hamilton Rd, Columbus, Ohio 43230
The information submitted herein is not guaranteed. Although obtained from reliable resources, it is subject to errors, omissions, prior sale and withdrawal from the market without notice. Anchor Cleveland, LLC, and its agents, associates and employees make no guarantee, warranty, or representation of the property. All images contained herein are the property of Anchor Cleveland, LLC and shall not be duplicated or reproduced without express written consent of Anchor Cleveland, LLC.


![Panera Bread[1]](https://static.documents.pub/doc/80x56/577cc8151a28aba711a21499/panera-bread1.jpg)


