104
2020 annual report

2020 annual report
1149230_Annual_Report_v8.3_r2.indd 55-159 3/18/21 6:41 PM

A digital version of this report is available at www.chevron.com/annualreport2020
noble energy enhances chevron’s performance
The acquisition of Noble Energy, Inc. in October 2020 is expected to deliver strong financial benefits. Noble’s high-quality assets in the Denver-Julesburg (DJ) Basin, Permian Basin and Eagle Ford in the United States, along with those in the Eastern Mediterranean and West Africa, complement Chevron’s advantaged Upstream portfolio. The acquired low-cost resources strengthen our global portfolio, adding approximately 1.7 billion oil-equivalent barrels of proved reserves at year-end 2020. The transaction aligns with our goal of generating industry-leading returns from our existing portfolio by adding advantaged assets with a low breakeven point.
Photo: The DJ Basin is a large geological formation in northwestern Colorado and southeastern Wyoming. Our newest facilities enable us to eliminate more than 90 percent of greenhouse gas emissions and reduce our surface footprint by more than 95 percent by combining facility locations with innovative processes and the latest technology.
On the cover: An earth scientist in our reservoir modeling group in Houston, Texas, analyzes subsurface data in search of natural gas.
DJ basin
~330,000net acres
148,000average net barrels of
oil-equivalent production per day in 2020
90% less greenhouse
gas emissions with newest facilities
1149230_Annual_Report_v8.3_r3.indd 6243-6139 3/19/21 4:25 PM

1149230_Annual_Report_v8.3_r1.indd 11149230_Annual_Report_v8.3_r1.indd 1 3/12/21 11:58 AM3/12/21 11:58 AM
��������������������������������������������������������������
���������������������������������������
���������������������������������
higher returns in a lower-carbon future The way companies respond to challenging events tests the strength of their people, their culture and their plans. Faced with such conditions, some change their strategies, alter their priorities or revise their fnancial commitments to stockholders. At Chevron, we responded to the events of 2020 with resilience – afrming our strategy, maintaining our priorities and honoring our commitments.
We articulate our goal in four words – “higher returns, lower carbon” – a simple statement that captures our view of what it takes to succeed in the future of energy and our commitment to all stakeholders.
“Higher returns, lower carbon” starts with fnancial strength. This is underpinned by an advantaged portfolio, a strong balance sheet, strict capital discipline, a dividend that is our frst fnancial priority, and the transformation of our business to work more efciently and efectively. It recognizes the need to deliver value for our stockholders and to work with all stakeholders in a world moving toward a lower-carbon energy system. We embrace this future and are aligning our strategy to advance these goals.
Our approach to delivering higher returns in a lower-carbon world is grounded in a set of beliefs. We know afordable, reliable, ever-cleaner energy enables modern life, and we believe energy transitions must work for all. We set ambitions and favor results, striving for actions that deliver measurable progress. We believe in the power of people to deliver innovative solutions to the world’s biggest challenges. We support innovation, competitive markets, partnerships and smart, inclusive policy as the most efective ways to deliver the progress needed to achieve shared goals.
Our strategy also requires unwavering commitment to the values that have sustained us: being an industry leader in health, safety and environmental performance; continuing to build an inclusive workforce where diversity is valued and celebrated; and ensuring that our emphasis on performance, integrity and accountability guides everything we do.
We believe this is how leaders perform and how long-term value is generated – for stockholders, stakeholders and society as a whole.
Contents higher returns in a lower-carbon future ����������������������������������I
chairman’s letter ��������������������������������������������������������������������� II
higher returns, lower carbon ������������������������������������������������� VI
our beliefs �����������������������������������������������������������������������������VIII
lead director: one-on-one ����������������������������������������������������� IX
board of directors ������������������������������������������������������������������� X
corporate ofcers ������������������������������������������������������������������ XI
chevron at a glance XIII
chevron stock performance�������������������������������������������������XIV
fnancial and operating highlights XV
protecting people and the environment ����������������������������XVI
fnancials ������������������������������������������������������������������������������� 30
glossary of energy and fnancial terms ��������������������������������112
stockholder and investor information 113

1149230_Annual_Report_v8.3_r1.indd 21149230_Annual_Report_v8.3_r1.indd 2 3/12/21 10:29 AM3/12/21 10:29 AM
To our stockholders:
The COVID-19 pandemic and resulting disruption to world energy markets tested the resilience of Chevron and our strategies like never before. As we look toward economic recovery, we are grateful for our people and our partners. They have risen to the challenge, keeping global supply chains moving, powering manufacturing and transportation systems to deliver equipment and supplies to frontline workers, and ensuring essential products are available to those in need. The opportunity to leverage our assets and global relationships to give aid to others has been an honor for all of us at Chevron.

1149230_Annual_Report_v8.3.indd 31149230_Annual_Report_v8.3.indd 3 3/5/21 5:56 AM3/5/21 5:56 AM
building on strengths Even before COVID-19, we were preparing to lead in a future marked by change. Our actions were proactive and disciplined – simplifying and modernizing work; integrating teams, processes and value chains across business units and geographies; elevating leadership capabilities; advancing digital solutions; and empowering our workforce to make decisions quickly, safely and with greater accountability.
We leveraged our strengths to design a better company for the long term – one that can act deliberately, seize opportunity and generate stronger returns. And we remained true to our values, prepared to succeed in any environment, and adaptive in a dynamic world where disruption is routine.
Our fnancial priorities have not changed:
growing the dividend
While others are lowering dividends, we have maintained ours as we know it is a vital source of stockholder income. In 2020, we increased our payout 8 percent, the 33rd consecutive annual increase in per-share dividend payout.
maintaining a strong balance sheet
Financial strength – demonstrated by our industry-leading net debt ratio – gives us the fexibility to navigate uncertain market conditions and address emerging opportunities.
reinvesting to grow future cash fows
Improving capital efciency allows us to sustain our future at a lower reinvestment rate. The Noble Energy acquisition is expected to generate free cash fow and added $13 billion in enterprise value.
returning excess cash to stockholders
After meeting the frst three priorities, we return excess cash to stockholders through buybacks. We have repurchased shares in 13 of the last 17 years, including returning $1.75 billion to stockholders in 2020.
Our priorities anchor our commitment to deliver higher returns. They guide us in good times – and we stand by them in difcult times. They dictate a disciplined approach to capital allocation. They inform actions to strengthen our already advantaged portfolio through smart acquisitions and prudent divestments – focusing on assets that deliver higher returns. Our success in reliably delivering value for stockholders will be commemorated this year when we celebrate a full century on the New York Stock Exchange – one of only 29 companies to reach this milestone.
operating with resilience During 2020, global oil demand fell by some 9 percent, while natural gas demand fell by a more modest 3 percent. Stress in energy markets was compounded by intense competition for market share among the world’s key oil producers. These disruptions occurred against the backdrop of geopolitical uncertainty and growing economic distress.
We demonstrated both resilience and agility in adjusting to extreme market conditions, balancing short-term cash fow and long-term value. Our portfolio is anchored in businesses that are low cost, large scale and long-lived – from our royalty-advantaged position in the Permian and growing natural gas business in the Eastern Mediterranean to our feedstock-advantaged chemicals business and leading fuels brands on the U.S. West Coast. We expect to deliver results through the business cycle, creating greater value for our stockholders and stronger cash fow for decades.
When market conditions deteriorated in 2020, we swiftly reduced capital spending by 35 percent from 2019. We also reduced operating costs, refecting our commitment to
both capital and cost discipline. In the Permian Basin, we demonstrated our fexibility to cut short-cycle capital. At the same time, we redoubled internal transformation eforts to become more agile, cost efcient and streamlined.
In our Upstream business, the acquisition of Noble Energy added complementary high-quality assets in Texas’s Permian Basin, Colorado’s DJ Basin and the Eastern Mediterranean. Portfolio additions in 2020 included approximately 5.67 million net exploration acres. We added 832 million barrels of net oil-equivalent proved reserves in 2020, with the largest net additions coming from the Noble Energy acquisition.
Despite the challenges presented by the COVID-19 pandemic, we advanced construction of the Future Growth Project-Wellhead Pressure Management Project at Tengizchevroil in Kazakhstan. Over three years, we safely delivered by sea 408 modules, many of which weighed between 500 and 1,800 tons, to the Tengiz Field from fabrication sites in Italy, Kazakhstan and South Korea.
Chevron Corporation 2020 Annual Report III

1149230_Annual_Report_v8.3_r1.indd 41149230_Annual_Report_v8.3_r1.indd 4 3/12/21 10:37 AM3/12/21 10:37 AM
In our Downstream business, we completed the acquisition of Puma Energy (Australia) Holdings Pty Ltd., adding a network of more than 360 company- and retailer-owned service stations, a commercial and industrial fuels business, owned and leased seaboard import terminals and fuel distribution depots. And we made excellent progress on GS Caltex’s olefns mixed-feed cracker project at the Yeosu Refnery in South Korea.
In 2020, we also increased production of renewable products and investments in low-carbon technologies, consistent with our energy transition strategy to help advance a lower-carbon future. During the year, Chevron announced frst gas production at our CalBioGas renewable natural gas (RNG) joint venture in California, formed a new RNG partnership with Brightmark and announced frst production of renewable base oil through a joint venture with Novvi.
During a year of unprecedented challenges, we also delivered one of our safest years ever. This refects our commitment to protecting people and the environment – and our unwavering determination to keep getting better.
advancing a lower-carbon future Helping advance a lower-carbon future requires actions that drive measurable progress, demonstrating the improvements we are making today and our intention to do more tomorrow. Our energy transition strategy focuses on three action areas:
y We are reducing the carbon intensity of our operations and assets, prioritizing the projects that return the largest reduction in carbon emissions at the lowest cost to customers and society.
y We are increasing renewables and ofsets in support of our business.
y And we are investing in low-carbon technologies to enable commercial solutions while leveraging our capabilities and operations to advance technologies such as carbon capture and hydrogen.
These actions will help make energy and global supply chains more sustainable – so industries and customers who use our products can work toward building a lower-carbon world.
looking ahead We are coming out of a year like none other: a global pandemic; a historic lockdown of economic activity; and unprecedented disruption in energy markets.
Yet the greatest challenges can call forth the greatest responses.
Through the power of innovation, markets and partnership, scientists developed multiple COVID-19 vaccines in record time. The tide is beginning to turn, and the pandemic will eventually recede. This inspiring example points the way to meeting other
great challenges – eliminating poverty, creating prosperity for all and delivering the sustainable environment everyone desires. On this foundation of hope, optimism and confdence, we can work together to achieve an even brighter future.
At Chevron, our people are helping to build this future, providing the afordable, reliable, ever-cleaner energy that billions of people rely on every day. We take great pride in enabling human progress around the world. And we are deeply grateful to all our employees, partners and stockholders who make this work possible.
Thank you for your support and the trust you place in us.
Sincerely,
Michael K. Wirth Chairman of the Board and Chief Executive Ofcer
Chevron Corporation 2020 Annual Report IV

1149230_Annual_Report_v8.3_r1.indd 51149230_Annual_Report_v8.3_r1.indd 5 3/12/21 10:38 AM3/12/21 10:38 AM
Photo: An operator aboard the Agbami floating production, storage and offloading vessel at the deepwater field 70 miles off the coast of central Nigeria.
“During a year of unprecedented challenges, we also delivered one of
our safest years ever. This refects our commitment to protecting people and the environment – and our unwavering determination to keep getting better.”
– Mike Wirth
Chevron Corporation 2020 Annual Report V

higher returns, lower carbonWe are focused on earning higher returns in a lower-carbon future. We recognize the need both to deliver for our stockholders and to work with all stakeholders in a world moving toward a lower-carbon energy system.
higher returnsWe plan to deliver higher returns on capital employed and create superior value for our stockholders by maintaining capital and cost discipline and staying anchored to our four financial priorities:
growing the dividendmaintaining a
strong balance sheet
8% 22.7%Increased dividend 8% in 2020 Achieved industry-leading 22.7% net debt ratio
See page 46 for additional information
reinvesting in our business to grow future cash flows
returning excess cash to stockholders
$13billion
$1.75billion
Added $13 billion in enterprise value with Noble Energy acquisition
Repurchased shares in 13 of the last 17 years, including $1.75 billion in 2020
lower carbonHelping to advance a lower-carbon future means striving for actions that drive measurable progress. Our energy transition strategy focuses on three action areas:
lower carbon intensity
cost efficiently
We prioritize projects that return the largest reduction in carbon
emissions at the lowest cost, and we hold ourselves accountable
with transparent metrics.
invest in low‑carbon technologiesto enable commercial solutions
We identify promising technologies with the goal of bringing down
their cost and helping them compete effectively in the market
to achieve global scale.
increase renewables and offsets
in support of our business
We are increasing the use ofrenewables in a number of our
products, with the goal of reducinglife-cycle emissions, in an effort to help
our customers achieve their ownlower-carbon goals.
Chevron Corporation 2020 Annual ReportVI

1149230_Annual_Report_v8.3_r1.indd 71149230_Annual_Report_v8.3_r1.indd 7 3/12/21 12:13 PM3/12/21 12:13 PM
Photo: With our Australian headquarters in Perth, Chevron has been present in the country for more than 60 years. At Chevron, we believe our business succeeds best when the people we work with and the communities in which we operate succeed too.
“Helping advance a lower-carbon future requires actions that drive measurable progress, demonstrating the improvements we are making today and our intention to do more tomorrow.”
– Mike Wirth

our beliefs We strive to achieve results the right way. Our actions and investments are guided by a set of beliefs, which shape our culture and underpin our commitment to deliver for our stockholders, partners and all our stakeholders.
energy is essential to modern life
We work to provide the energy that enables human progress around the world. We live this purpose every day.
human ingenuity fuels innovation
The imagination and perseverance of people will deliver solutions to energy’s greatest challenges.
the future is lower carbon
Our actions will help make energy and global supply chains more sustainable – so industries and customers who use our
products can work toward building a lower-carbon world.
leadership carries great responsibility
Meeting rising stakeholder expectations demands performance and accountability at the highest
level. We aim to deliver industry-leading results.
Photo: Chevron’s joint venture CalBioGas LLC successfully achieved first renewable natural gas production from dairy farms in Kern County, California, in 2020. CalBio brings technology and operational experience to help capture dairy biomethane as a fuel for heavy-duty vehicles.
Chevron Corporation 2020 Annual Report VIII

lead director: one-on-one
Chevron’s lead independent Director, Ronald Sugar, talks with Director Enrique Hernandez Jr. about the link between strong fnancial results
and environmental, social and governance (ESG) performance.
Sugar: As the two longest-serving Directors on Chevron’s Board, we know strong ESG performance goes hand-in-hand with strong fnancial performance. The company’s resilient strategy and capital discipline enable us to continually strengthen our commitment to building a more sustainable future in any business environment.
Our role as Directors is to help position the company to achieve higher returns in a world transitioning to a lower-carbon economy. In this environment, delivering on our ESG commitments will increasingly defne our success as a company and earn support from stockholders and our other stakeholders.
Hernandez: That’s right, Ron. To maintain our fnancial strength and deliver on our ESG goals, we prioritize projects that we believe will return the largest reduction in carbon emissions at the lowest costs, and we hold ourselves accountable with transparent metrics. We also partner with those who have shared aspirations and where our combined strengths can have a tangible impact on advancing a lower-carbon future.
Sugar: You and I have both met with groups of Chevron stockholders over the years, and we hear their expectations directly, particularly on accountability for ESG matters. We are actively working to lower the carbon intensity of our assets and operations by investing in technologies like carbon capture, utilization and storage and increasing the use of renewables and ofsets in our operations. These actions help lower our operating costs, and they help us meet the increasing expectations of society.
For example, Chevron is co-developing up to 500 megawatts of renewable power to provide electricity to strategic assets across Chevron’s global portfolio. In 2020, Chevron also announced the frst production of 100 percent renewable base oil, and one of our joint ventures produced its frst renewable natural gas. Our goal is to help scale innovations like these both to use them across our global platform and to help our customers achieve their lower-carbon goals. These actions will make energy and global supply chains more sustainable. No company can do it alone, but we can all play our constructive part.
Hernandez: As a member of the Board’s Public Policy and Sustainability Committee, I know that smart, inclusive public policy is an important part of this efort. We are committed to engaging with governments and stakeholders to create incentives for market-based solutions like carbon pricing and other policies that support the innovations needed to build a lower-carbon economy. These tools are critical to achieving progress on a global basis.
Sugar: Rick, you mentioned metrics. You and I both serve on the Board’s Management Compensation Committee, where we set the metrics and monitor the company’s progress toward them. To hold ourselves accountable and allow stakeholders to measure our progress, Chevron has set equity greenhouse gas intensity reduction metrics that are communicated broadly and shared online. These metrics align with the Paris Agreement. To further build environmental progress into our company’s culture, we have tied our compensation plans for executives and employees directly to these metrics.
Hernandez: As Board members, we know that transparency is critical to all our ESG eforts, and we aim to be an industry leader on carbon emissions reporting. Our reporting aligns with the recommendations of the Financial Stability Board’s Task Force on Climate-related Financial Disclosures. Our 2020 Sustainability Report provides a detailed look at our performance on our ESG priorities such as global employee diversity, social investments in communities around the world, our stewardship on protecting the environments where we operate and strong governance.
Sugar: As you and I well know, Chevron is in a long-cycle, complex global business, which means the Board must think about the future beyond current business conditions. It’s our job, working with Chevron’s diverse and engaged Board, to review, test, debate and, where necessary, work with management to adjust the company’s business strategy. The goal: to most efectively deploy Chevron’s capital and human talent to meet rising stockholder and stakeholder expectations in a world where fnancial results and ESG performance are inextricably linked.
Learn more about our ESG eforts at www.chevron.com/sustainability
Chevron Corporation 2020 Annual Report IX

board of directors The Board of Directors of Chevron directs the affairs of the corporation and is committed to
sound principles of corporate governance. The Directors bring a proven track record of success across a broad range of experiences at the policymaking level.
Michael K� (Mike) Wirth, 60 Chairman of the Board and Chief Executive Officer since February 2018. Prior to his current role, Wirth served as vice chairman of the Board in 2017 and executive vice president of Midstream & Development from 2016 to 2018. In that role, he was responsible for supply and trading, shipping, pipeline, and power operating units; corporate strategy; business development; and policy, government and public affairs.
Wirth was executive vice president of Downstream & Chemicals from 2006 to 2015. Prior to that, he served as president of Global Supply and Trading from 2003 to 2006. In 2001, Wirth was named president of Marketing for Chevron’s Asia/Middle East/Africa business, based in Singapore. He also served on the board of directors for Caltex Australia Limited and GS Caltex Corporation in South Korea.
Wirth serves on the board of directors of Catalyst. He also serves on the board of directors and executive committee of the American Petroleum Institute and is a member of the National Petroleum Council, the Business Roundtable, the World Economic Forum International Business Council and the American Society of Corporate Executives. Wirth joined Chevron in 1982 as a design engineer. He earned a bachelor’s degree in chemical engineering from the University of Colorado in 1982.
Wanda M� Austin, 66 Director since 2016. She holds an adjunct Research Professor appointment at the University of Southern California’s Viterbi School’s Department of Industrial and Systems Engineering. She is a retired president and chief executive ofcer of The Aerospace Corporation, a leading architect for the United States’ national security space programs. She is a director of Amgen Inc. and Virgin Galactic Holdings, Inc. (2,4)
John B� Frank, 64 Director since 2017. He is vice chairman of Oaktree Capital Group LLC, a global investment management company with expertise in credit strategies. He is one of four members of Oaktree’s Executive Committee and was previously the frm’s principal executive ofcer. He is a director of Oaktree Capital Group LLC and its subsidiaries: Oaktree Acquisition Corporation II, Oaktree Acquisition Corporation III and Oaktree Specialty Lending Corporation. (1)
Alice P� Gast, 62 Director since 2012. She is president of Imperial College London, a public research university specializing in science, engineering, medicine and business. Previously, she was president of Lehigh University in Pennsylvania. Prior to that, she was vice president for Research, associate provost and Robert T. Haslam Chair in Chemical Engineering at the Massachusetts Institute of Technology. (2,4)
Enrique Hernandez Jr�, 65 Director since 2008. He is chairman and chief executive ofcer of Inter-Con Security Systems Inc., a global provider of security and facility support services to governments, utilities and industrial customers. He is chairman of the board of McDonald’s Corporation. (3,4)
Marillyn A� Hewson, 67 Director since 2021. She has been strategic advisor to the chief executive ofcer of Lockheed Martin Corporation, a security and aerospace company, since March 2021. Previously, she was executive chairman, chairman, president and chief executive ofcer of Lockheed Martin Corporation. She is a director of Johnson & Johnson. (1)
Jon M� Huntsman Jr�, 60 Director since 2020 and from 2014 to 2017 when he resigned to serve as the U.S. Ambassador to Russia. He served as U.S. Ambassador to China and was governor of Utah for two consecutive terms. He is a director of Ford Motor Company. (3,4)
Charles W� Moorman IV, 69 Director since 2012. He is a retired chairman of the board, chief executive ofcer and president of Norfolk Southern Corporation, a freight and transportation company. He is a senior advisor to Amtrak, a passenger rail service provider, having previously served as Amtrak’s president and chief executive ofcer. He is a director of Oracle Corporation. (1)
Dambisa F� Moyo, 52 Director since 2016. She is chief executive ofcer of Mildstorm LLC, focusing on the global economy and international afairs. Previously, she worked at Goldman Sachs in various roles and at the World Bank in Washington, D.C. She is the author of four New York Times bestsellers and is a director of 3M Company. (1)
Debra Reed-Klages, 64 Director since 2018. She is a retired chairman, chief executive ofcer and president of Sempra Energy, an energy services holding company. Previously, she was executive vice president of Sempra Energy and president and chief executive ofcer of San Diego Gas & Electric and Southern California Gas Co. She is a director of Caterpillar Inc. and Lockheed Martin Corporation. (1)
Ronald D� Sugar, 72 Lead Director since 2015 and a Director since 2005. He is an advisor and retired chairman and chief executive ofcer of Northrop Grumman Corporation, an aerospace and defense company. He is a senior advisor to Ares Management LLC; Bain & Company; Temasek Americas Advisory Panel, Singapore; G100 Network; and World 50. He is a director of Amgen Inc., Apple Inc. and Uber Technologies Inc. (2,3)
D� James Umpleby III, 63 Director since 2018. He is chairman and chief executive ofcer of Caterpillar Inc., a leading manufacturer of construction and mining equipment, diesel and natural gas engines, industrial gas turbines, and diesel-electric locomotives. Previously, he was group president of Caterpillar’s Energy and Transportation business segment. (2,3)
Committees of the Board 1)Audit: Charles W. Moorman IV, Chair 2)Nominating and Governance: Ronald D. Sugar, Chair 3)Management Compensation: Enrique Hernandez Jr., Chair 4) Public Policy and Sustainability: Wanda M. Austin, Chair
Chevron Corporation 2020 Annual Report X

corporate officers Paul R� Antebi, 49 Vice President since 2021 and General Tax Counsel since 2021. Responsible for directing Chevron’s worldwide tax activities. Previously, the company’s Deputy General Tax Counsel. Joined the company in 1998.
Pierre R� Breber, 56 Vice President and Chief Financial Officer since 2019. Responsible for controller, tax, treasury, audit and investor relations activities worldwide. Previously, Executive Vice President of Downstream and Chemicals. Joined the company in 1989.
Mary A� Francis, 56 Corporate Secretary and Chief Governance Officer since 2015. Responsible for providing advice and counsel to the Board of Directors and senior management on corporate governance matters, managing the company’s corporate governance function, and serving on the Law Function Executive Committee. Previously, Chief Corporate Counsel. Joined the company in 2002.
Joseph C� Geagea, 61 Executive Vice President, Technology, Projects and Services since 2015. Responsible for the Chevron Technical Center, including energy technology and innovation; capital projects delivery; IT; asset performance and process safety; and HSE. He is also responsible for environmental management; real estate; procurement; and talent selection. Previously Senior Vice President, Technology, Projects and Services. Joined the company in 1982.
David A� Inchausti, 57 Vice President and Controller since 2019. Responsible for corporatewide accounting, fnancial reporting and analysis, internal controls, accounting policy, and digital fnance. Previously, Deputy Comptroller and Upstream Comptroller. Prior to that, 20 years abroad in multiple business units. Joined the company in 1988.
James W� Johnson, 62 Executive Vice President, Upstream since 2015. Responsible for Chevron’s global exploration and production activities for crude oil and natural gas. Previously, Senior Vice President, Upstream; President, Chevron Europe, Eurasia and Middle East Exploration and Production Company; Managing Director, Eurasia Business Unit; and Managing Director, Australasia Business Unit. Joined the company in 1981.
Navin K� Mahajan, 54 Vice President and Treasurer since 2019. Responsible for Chevron’s banking, fnancing, cash management, insurance, pension investments, and credits and receivables activities. Previously, Vice President of Finance for Downstream & Chemicals, Assistant Treasurer of Operating Company Financing, and Chief Compliance Ofcer. Joined the company in 1996.
Rhonda J� Morris, 55 Vice President since 2016 and Chief Human Resources Officer since 2019. Responsible for human resources, diversity and inclusion, ombuds, and employee assistance/work life services. Previously, Vice President, Human Resources, Downstream & Chemicals. Joined the company in 1991.
Mark A� Nelson, 57 Executive Vice President, Downstream & Chemicals since 2019. Responsible for directing the company’s worldwide manufacturing, marketing, lubricants, chemicals and Oronite additives businesses. Also oversees Chevron’s joint venture Chevron Phillips Chemical Company. Previously, Vice President, Midstream, Strategy & Policy. Joined the company in 1985.
Bruce L� Niemeyer, 59 Vice President, Strategy & Sustainability since 2018. Responsible for guiding development of the company’s key strategies, including capital allocation and sustainability eforts. Previously, Vice President of Chevron’s Mid-Continent Business Unit; Vice President of the Appalachian/Michigan Business Unit; and General Manager of Strategy and Planning for Chevron North America Exploration & Production. Joined the company in 2000.
Colin E� Parftt, 57 Vice President, Midstream since 2019. Responsible for Chevron’s Midstream business, including supply and trading activities, shipping, pipeline, and power and energy management. Appointed Chairman of the Board, Noble Midstream Partners GP LLC, in October 2020. Previously, President, Supply and Trading. Joined the company in 1995.
R� Hewitt Pate, 58 Vice President and General Counsel since 2009. Responsible for directing the company’s worldwide legal afairs. Previously, Chair, Competition Practice, Hunton & Williams LLP, Washington, D.C., and Assistant Attorney General, Antitrust Division, U.S. Department of Justice. Joined the company in 2009.
J� David Payne, 60 Vice President, Health, Safety and Environment (HSE) since 2018. Responsible for HSE strategic planning and issues management, compliance assurance and emergency response. Previously, Vice President of Drilling and Completions. Prior to that, Drilling Manager in Thailand. Joined the company in 1981.
Jay R� Pryor, 63 Vice President, Business Development since 2006. Responsible for identifying and developing new, large-scale Upstream and Downstream business opportunities, including mergers and acquisitions. Previously, Managing Director, Chevron Nigeria Ltd., and Managing Director, Asia South Business Unit and Chevron Ofshore (Thailand) Ltd. Joined the company in 1979.
Albert J� Williams, 52 Vice President, Corporate Afairs since 2021. Responsible for overseeing government afairs, public afairs, social investment and performance, and the company’s worldwide eforts to protect and enhance its reputation. Previously, Managing Director of Chevron Australia and head of the Australasia business unit. Joined the company in 1991.
Retiring Ofcers Charles N� Macfarlane, retired efective February 2021; vice president, since 2013, and general tax counsel, since 2010; joined the company in 1986.
Dale A� Walsh, retires efective May 2021; vice president, Corporate Afairs, since 2019; joined the company in 1983.
Executive Committee Michael K. Wirth, Pierre R. Breber, Joseph C. Geagea, James W. Johnson, Mark A. Nelson, Colin E. Parfitt, R. Hewitt Pate and Rhonda J. Morris.
Chevron Corporation 2020 Annual Report XI

X-over .0001149230_Annual_Report_v8.3_r2.indd 121149230_Annual_Report_v8.3_r2.indd 12 3/18/21 7:05 PM3/18/21 7:05 PM
’
Photo: Workers at a drill site in the Permian Basin, where Chevron maintains one of the lowest venting and flaring rates of any company. Chevron s midcontinent business also has a dedicated water team, which implements strategies to reduce the amount of fresh water used for well completions.
Chevron Corporation 2020 Annual Report XII

-
chevron at a glance Chevron is one of the world’s leading integrated energy companies� We believe
afordable, reliable and ever-cleaner energy is essential to achieving a more prosperous and sustainable world� Chevron produces crude oil and natural gas;
manufactures transportation fuels, lubricants, petrochemicals and additives; and develops technologies that enhance our business and the industry� To advance a lower-carbon future, we are focused on cost efciently lowering our carbon intensity, increasing renewables and ofsets in support of our business, and
investing in low-carbon technologies that enable commercial solutions�
Our success is driven by a dedicated, diverse and highly skilled global workforce united by The Chevron Way, our enduring statement of culture and our commitment to delivering industry-leading results and superior stockholder value – in any operating environment.
We operate responsibly, applying advanced technologies and capturing high-return, lower-carbon opportunities that create stockholder value in a socially and environmentally responsible manner.
3.08 million barrels
net oil equivalent daily production1
11.1 billion barrels
net oil -equivalent proved reserves2, 3
$239.8 billion
total assets2
$94.5 billion sales and other
operating revenues1
1 Year ended December 31, 2020 2 At December 31, 2020 3 For defnition of “reserves,” see glossary of energy and fnancial terms, page 112
Chevron Corporation 2020 Annual Report XIII

chevron stock performance 2020 marked the 33rd consecutive year we increased
the annual per-share dividend payout
- - -
Indexed dividend growth Basis 2005 = 100
50 ˜°°˛ ˜°˜°
Chevron S&P 500 Peer group: BP p.l.c. (ADS), ExxonMobil, Royal Dutch Shell p.l.c. (ADS), Total S.A. (ADR). Dividends include both cash and scrip share distributions for European peers.
100
150
200
250
300
7.5% CVX compound
annual growth rate
Total stockholder returns*
(as of 12/31/2020)
ii
■
ii •• ii
1-year 5-year 10-year 20% 10% 10%
10% -25.7%
5%5% 3.1% 0% 3.2%
-10% 0%0%
-20%
-30% -5%-5%
-40%
-10% -50% -10%
Peer group: BP p.l.c. (ADS), ExxonMobil, Royal Dutch Shell p.l.c. (ADS), Total S.A. (ADR)
* Annualized total stockholder return (TSR) as of 12/31/2020. Includes stock price appreciation and reinvested dividends when paid. For TSR comparison purposes, ADR/ADS prices and dividends are used for non-U.S.-based companies. Dividends include both cash and scrip share distributions.
Performance graph The stock performance graph at right shows how an initial investment of $100 in Chevron stock would have compared with an equal investment in the S&P 500 Index or the Competitor Peer Group. The comparison covers a fve-year period beginning December 31, 2015, and ending December 31, 2020, and for the peer group is weighted by market capitalization as of the beginning of each year. It includes the reinvestment of all dividends that an investor would be entitled to receive and is adjusted for stock splits. The interim measurement points show the value of $100 invested on December 31, 2015, as of the end of each year between 2016 and 2020.
Five-year cumulative total returns (calendar years ended December 31)
... ... ...
$200
$175
$150
$125
$100
$75
$50
˜°˛˝ ˜°˛˙ ˜°˛ˆ ˜°˛ˇ ˜°˛˘ ˜°˜°
Chevron S&P 500 Peer group: BP p.l.c. (ADS), ExxonMobil, Royal Dutch Shell p.l.c. (ADS), Total S.A. (ADR)
$203
$116
$93
Chevron Corporation 2020 Annual Report XIV

financial and operating highlights Financial highlights1 2020 2019 2018
Net income (loss) attributable to Chevron Corporation $ (5,543) $ 2,924 $ 14,824 Sales and other operating revenues $ 94,471 $ 139,865 $ 158,902 Cash fow from operating activities $ 10,576 $ 27,314 $ 30,618 Capital and exploratory expenditures2 $ 13,499 $ 20,994 $ 20,106 Total assets at year-end $ 239,790 $ 237,428 $ 253,863 Total debt and fnance lease obligations $ 44,315 $ 26,973 $ 34,459
Chevron Corporation stockholders’ equity at year-end $ 131,688 $ 144,213 $ 154,554 Common shares outstanding at year-end (Thousands) 1,911,018 1,868,000 1,888,670
Per-share data Net income (loss) attributable to Chevron Corporation – diluted $ (2.96) $ 1.54 $ 7.74 Cash dividends $ 5.16 $ 4.76 $ 4.48 Chevron Corporation stockholders’ equity $ 68.91 $ 77.20 $ 81.83
Debt ratio3 25.2% 15.8% 18.2% Net debt ratio3 22.7% 12.8% 13.5% Return on stockholders’ equity3 (4.0)% 2.0% 9.8% Return on average capital employed3 (2.8)% 2.0% 8.2%
1 Millions of dollars, except per-share amounts 2 Includes equity in afliates 3 See pages 45-46 for additional information
Total capital and exploratory expenditures4
($ – Billions)
$50 ~$20�5 billion reduction
(2015–2020) $40
$30
$20
$10
$0
˜°˛ ˜˝˙ ˜˝°˜˝˝˜ˆˇ ˜°ˆ˘�
˘��� ˘��� ˘��� ˘��� ˘��� ˝˙˝˙
4 Includes expenditures by equity afliates. See our Annual Reports on Form 10-K for additional information.
Operating expense5
($ – Billions)
$35 ~$2 billion reduction
(2015–2020) $30
$25
$20
$15
$10 ˇ˘�� ˇ˘�� ˇ˘�� ˇ˘�� ˇ˘�� ˜°˜°
˛˜˝ ˛˜˙ ˛˜ˆ˛˜˙˛˜ˇ ˛˜˙
5 Includes operating expense, selling, general and administrative expense, and other components of net periodic beneft costs. See our Annual Reports on Form 10-K for additional information.
Operating highlights6 2020 2019 2018
Net production of crude oil, condensate, NGLs and synthetic oil7 (Thousands of barrels per day) 1,868 1,865 1,782 Net production of natural gas (Millions of cubic feet per day) 7,290 7,157 6,889 Total net oil-equivalent production (Thousands of oil-equivalent barrels per day) 3,083 3,058 2,930 Net proved reserves of crude oil, condensate, NGLs and synthetic oil7,8 (Millions of barrels) 6,147 6,521 6,790 Net proved reserves of natural gas8 (Billions of cubic feet) 29,922 29,457 31,576 Net proved oil-equivalent reserves8 (Millions of barrels) 11,134 11,431 12,053 Refinery input (Thousands of barrels per day) 1,377 1,564 1,608 Sales of refined products (Thousands of barrels per day) 2,224 2,577 2,655 Number of employees at year-end9 42,628 44,679 45,047
6 Includes equity in afliates, except number of employees 7 NGLs = natural gas liquids 8 At year-end 9 Excludes service station personnel
Chevron Corporation 2020 Annual Report XV

protecting people and the environment The Chevron Way’s emphasis on protecting people and the environment guides our
commitment to operating safely and reliably. Our leaders drive a culture of Operational Excellence (OE) at Chevron, managing risk and learning from one another. We maintain a system of efective safeguards to keep our workforce, communities and environment safe.
2020 was our second-best year ever in overall OE performance. In personal safety, we set record lows in serious injuries and motor vehicle crashes. Our Total Recordable Injury Rate is the best in the industry. In process safety, we recorded for the frst time ever no Severe Tier 1 Loss of Containment (LOC) incidents.
This success is due to the Operational Excellence Management System (OEMS), followed by our workforce since 2004 to manage health, safety and environmental risks. The OEMS enables us to assess risks, identify safeguards and implement programs to assure the efectiveness of those safeguards.
how we maintain safe operations comprehensive risk management based on data and science
Preventing high-consequence incidents and impacts starts with understanding and mitigating risks.
We manage risk across our six focus areas through a system of safeguards. Learn more
at www.chevron.com/oems
manage safeguards
assurance risk
verify assess
our COVID-19 pandemic response Our successful response to the COVID-19 pandemic has been enabled by our safety culture and tools, emphasizing “people frst and work second,” consistent with how we run our business using the OEMS.
Everything we do comes with some level of risk. We routinely assess risk in our business, develop safeguards to mitigate it, and create an assurance process to verify an efective layer of safeguards is in place and functioning.
COVID-19 posed a new risk, but one akin to occupational hygiene risks and potential exposures regularly addressed by our workforce. After adapting medical terminology to the language of our safety culture, we applied the same risk-based system to manage COVID-19, ensuring that both new and existing safeguards were not compromised by the pandemic. We remain consistent with the terms, principles and practices employed in our operations, continually looking at risk as we manage operations through the pandemic.
maintaining a sense of vulnerability Throughout the pandemic, we have relied on a key component of our process safety culture, the concept of maintaining a sense of vulnerability. To do this, we frst develop an awareness of the hazards inherent in our work. We then must remain vigilant for signs of complacency and indicators of weakness in our safeguards, including minor incidents that may foreshadow more serious consequences.
In 2020, we again led the industry in process safety. We reduced the frequency and severity of LOC incidents through disciplined adherence to process safety standards while also building fuency and competency across our workforce.
Despite a challenging business environment, we collaborated closely with industry partners to strengthen our approach to identifying and mitigating weaknesses in our process safety systems.
More on our safety performance at www.chevron.com/sustainability.
Chevron Corporation 2020 Annual Report XVI

30
Management’s Discussion and Analysis of Financial Condition and Results of Operations
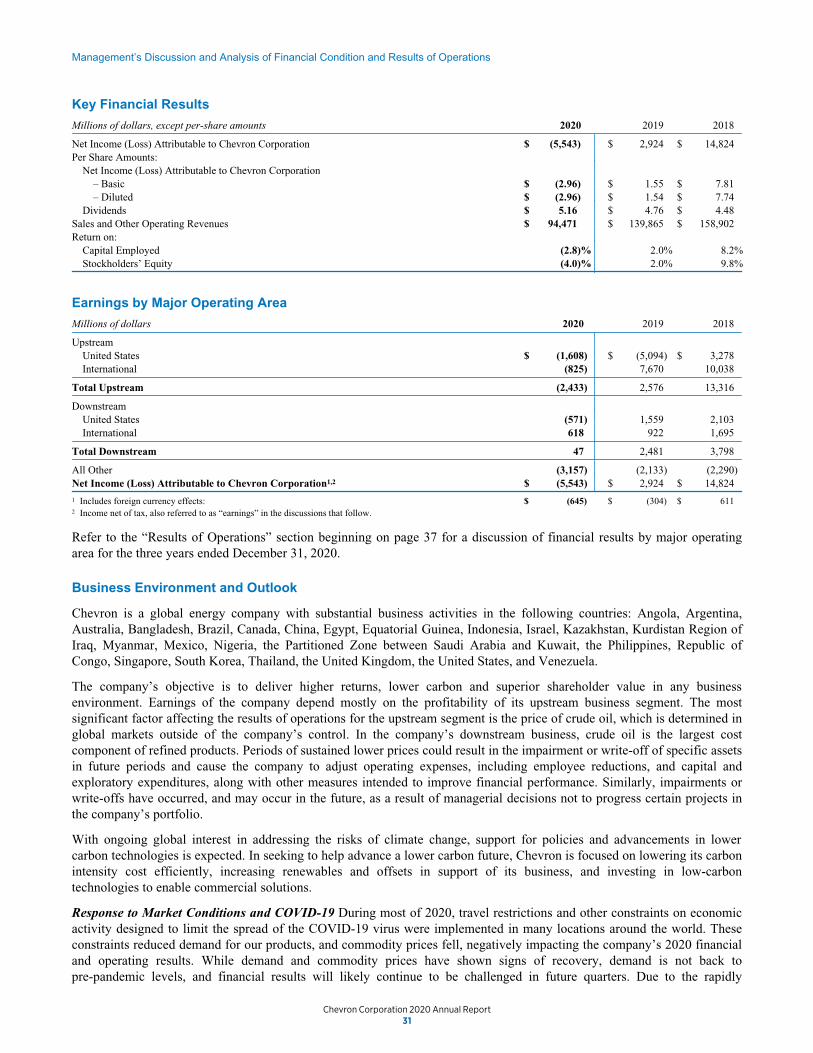
Key Financial Results
Millions of dollars, except per-share amounts 2020 2019 2018
Net Income (Loss) Attributable to Chevron Corporation $ (5,543) $ 2,924 $ 14,824Per Share Amounts:
Net Income (Loss) Attributable to Chevron Corporation– Basic $ (2.96) $ 1.55 $ 7.81– Diluted $ (2.96) $ 1.54 $ 7.74
Dividends $ 5.16 $ 4.76 $ 4.48Sales and Other Operating Revenues $ 94,471 $ 139,865 $ 158,902Return on:
Capital Employed (2.8)% 2.0% 8.2%Stockholders’ Equity (4.0)% 2.0% 9.8%
Earnings by Major Operating Area
Millions of dollars 2020 2019 2018
UpstreamUnited States $ (1,608) $ (5,094) $ 3,278International (825) 7,670 10,038
Total Upstream (2,433) 2,576 13,316
DownstreamUnited States (571) 1,559 2,103International 618 922 1,695
Total Downstream 47 2,481 3,798
All Other (3,157) (2,133) (2,290)Net Income (Loss) Attributable to Chevron Corporation1,2 $ (5,543) $ 2,924 $ 14,824
1 Includes foreign currency effects: $ (645) $ (304) $ 6112 Income net of tax, also referred to as “earnings” in the discussions that follow.
Refer to the “Results of Operations” section beginning on page 37 for a discussion of financial results by major operatingarea for the three years ended December 31, 2020.
Business Environment and Outlook
Chevron is a global energy company with substantial business activities in the following countries: Angola, Argentina,Australia, Bangladesh, Brazil, Canada, China, Egypt, Equatorial Guinea, Indonesia, Israel, Kazakhstan, Kurdistan Region ofIraq, Myanmar, Mexico, Nigeria, the Partitioned Zone between Saudi Arabia and Kuwait, the Philippines, Republic ofCongo, Singapore, South Korea, Thailand, the United Kingdom, the United States, and Venezuela.
The company’s objective is to deliver higher returns, lower carbon and superior shareholder value in any businessenvironment. Earnings of the company depend mostly on the profitability of its upstream business segment. The mostsignificant factor affecting the results of operations for the upstream segment is the price of crude oil, which is determined inglobal markets outside of the company’s control. In the company’s downstream business, crude oil is the largest costcomponent of refined products. Periods of sustained lower prices could result in the impairment or write-off of specific assetsin future periods and cause the company to adjust operating expenses, including employee reductions, and capital andexploratory expenditures, along with other measures intended to improve financial performance. Similarly, impairments orwrite-offs have occurred, and may occur in the future, as a result of managerial decisions not to progress certain projects inthe company’s portfolio.
With ongoing global interest in addressing the risks of climate change, support for policies and advancements in lowercarbon technologies is expected. In seeking to help advance a lower carbon future, Chevron is focused on lowering its carbonintensity cost efficiently, increasing renewables and offsets in support of its business, and investing in low-carbontechnologies to enable commercial solutions.
Response to Market Conditions and COVID-19 During most of 2020, travel restrictions and other constraints on economicactivity designed to limit the spread of the COVID-19 virus were implemented in many locations around the world. Theseconstraints reduced demand for our products, and commodity prices fell, negatively impacting the company’s 2020 financialand operating results. While demand and commodity prices have shown signs of recovery, demand is not back topre-pandemic levels, and financial results will likely continue to be challenged in future quarters. Due to the rapidly
31
173155_Annual_Report_10-K.indd 30173155_Annual_Report_10-K.indd 30 3/5/21 6:04 PM3/5/21 6:04 PM
Financial Table of Contents
Management’s Discussion and Analysis of Financial Condition and Results of Operations Key Financial Results . . . . . . . . . . . . . . . . . . . . . . . . . . . . . . . . . . . . . . . . .
. . . . . . . . . . . . . . . . . . . . . . . . . . . . . . .
. . . . . . . . . . . . . . . . . . . . . . . . . . . . . .
. . . . . . . . . . . . . . . . . . . . . . . . . . . . . . . . . . . . . . .
. . . . . . . . . . . . . . . . . . . . . . . . . . . . . . . . . . . . . . . . .
. . . . . . . . . . . . . . . . . . . . . . . . . . . . . .
. . . . . . . . . . . . . . . . . . . . . . . . . . . . . . . . . . . . . . .
. . . . . . . . . . . . . . . . . . . . . . . . . . . . . . . . .
. . . . . . . . . . . . . . . . . . . . . . . . . . . . . . . . . . . .
. . . . . . . .
. . . . . . . . . . . . . . . . . . .
. . . . . . . . . . . . . . . . . . . . . . . . . . . . . . .
. . . . . . . . . . . . . . . . . . . . . . . . . . . . . .
. . . . . . . . . . . . . . . . . . . . . . . . . . . . . . . . . . . . . . . . .
. . . . . . . . . . . . . . . . . . . .
. . . . . . . . . . . . . . . . . . . . . . . . . . . . . . . . . . . . .
. . . . . . . . . . . . . . . . . . . . . . . . . . . . . . . . . . . . . . . . . . . . .
. . . . . . . . . . . . . . . . . .
31
Earnings by Major Operating Area 31
Business Environment and Outlook 31
Operating Developments 36
Results of Operations 37
Consolidated Statement of Income 39
Selected Operating Data 41
Liquidity and Capital Resources 42
Financial Ratios and Metrics 45
Off-Balance-Sheet Arrangements, Contractual Obligations, Guarantees and Other Contingencies 47
Financial and Derivative Instrument Market Risk 47
Transactions With Related Parties 48
Litigation and Other Contingencies 48
Environmental Matters 49
Critical Accounting Estimates and Assumptions 49
New Accounting Standards 53
Quarterly Results 54
Consolidated Financial Statements Reports of Management . . . . . . . . . . . . . . . . . . . . . . . . . . . . . . . . . . . . . . .
. . . . . . . . . . .
. . . . . . . . . . . . . . . . . . . . . . . . . . . . . .
. . . . . . . . . . . . . . . . .
. . . . . . . . . . . . . . . . . . . . . . . . . . . . . . . . . . . .
. . . . . . . . . . . . . . . . . . . . . . . . . . .
. . . . . . . . . . . . . . . . . . . . . . . . . . . . . . .
55
Report of Independent Registered Public Accounting Firm 56
Consolidated Statement of Income 59
Consolidated Statement of Comprehensive Income 60
Consolidated Balance Sheet 61
Consolidated Statement of Cash Flows 62
Consolidated Statement of Equity 63
Notes to the Consolidated Financial Statements Note 1 Summary of Significant Accounting Policies . . . . . . . . . . . . . .
. . .
. . . . . . . . . . . . . . . . . . . . . . . . . . . . . . . . . . . . . . .
. . . . . . . . . . . . . . . . . . . . . . . . . . .
. . . . . . . . . . . . . . . . . . . . . . . . . . . . . . . . .
. . . . . . . .
. . . . . . . . . . . . . . . . . . . . . . . . . . . .
. . . . . . . . . . . . . . . . . . .
. . . . . . . . . . . . . . . . . . . . . . . . . . . . . . . . .
. . . . . . . . . . . . . . . . . . . . . . . . . . . . . . . . . . . . . . . . . . . . .
. . . . . . . . . . . . . . . . . . . . . . . . . . . . . . . . . .
. . . . . . . . . . . . . .
. . . . . . . . . . . . . . . . . . . . . . . . . . .
. . . . . . . . . . . . . . . . . . . . . . . . . . . . . . . . . . . . . . . . . . .
. . . . . . . . . . . . . . . . . . . . . . . . . . . . . . . . . . . . . . . . . . . . .
. . . . . . . . . . . . . . . . . . . . . . .
64
Note 2 Changes in Accumulated Other Comprehensive Losses 67
Note 3 Information Relating to the Consolidated Statement of Cash Flows 68
Note 4 New Accounting Standards 69
Note 5 Lease Commitments 69
Note 6 Summarized Financial Data – Chevron U.S.A. Inc. 71
Note 7 Fair Value Measurements 71
Note 8 Financial and Derivative Instruments 72
Note 9 Assets Held for Sale 74
Note 10 Equity 74
Note 11 Earnings Per Share 74
Note 12 Operating Segments and Geographic Data 74
Note 13 Investments and Advances 77
Note 14 Litigation 78
Note 15 Taxes 79
Note 16 Properties, Plant and Equipment 82
Note 17 Short-Term Debt . . . . . . . . . . . . . . . . . . . . . . . . . . . . . . . . . . . .
. . . . . . . . . . . . . . . . . . . . . . . . . . . . . . . . . . . .
. . . . . . . . . . . . .
. . . . .
. . . . . . . . . . . . . . . . . . . . . . . . . . . . . .
. . . . . . . . . . . . . . . . .
. . . . . . . . . . . . . . . . . . . . . . . . . .
83
Note 18 Long-Term Debt 84
Note 19 Accounting for Suspended Exploratory Wells 85
Note 20 Stock Options and Other Share-Based Compensation 86
Note 21 Employee Benefit Plans 87
Note 22 Other Contingencies and Commitments 92
Note 23 Asset Retirement Obligations 94
Note 24 Revenue . . . . . . . . . . . . . . . . . . . . . . . . . . . . . . . . . . . . . . . . . . .
. . . . . . . . . . . . . . . . . . . . . . . . . . .
. . . . . . . . . . . . . . . . . . . . . . . . . . . . . . . . . . . . .
. . . . . . . . . . . . . . . . .
. . . . . . . . . . . . . . . . . .
. . . . . . . . . . . . . . . . . . . . . . .
94
Note 25 Other Financial Information 95
Note 26 Summarized Financial Data – Chevron Phillips Chemical Company LLC 95
Note 27 Restructuring and Reorganization Costs 95
Note 28 Financial Instruments – Credit Losses 96
Note 29 Acquisition of Noble Energy, Inc. 96
Five-Year Financial Summary . . . . . . . . . . . . . . . . . . . . . . . . . . . . . . . . . . .
. . . . . . . .
98
Supplemental Information on Oil and Gas Producing Activities 99
CAUTIONARY STATEMENTS RELEVANT TO FORWARD-LOOKING INFORMATION FOR THE PURPOSE OF “SAFE HARBOR” PROVISIONS OF THE PRIVATE SECURITIES LITIGATION REFORM ACT OF 1995 This Annual Report of Chevron Corporation contains forward-looking statements relating to Chevron’s operations that are based on management’s current expectations, estimates and projections about the petroleum, chemicals and other energy-related industries. Words or phrases such as [“anticipates,” “expects,” “intends,” “plans,” “targets,” “forecasts,” “projects,” “believes,” “seeks,” “schedules,” “estimates,” “positions,” “pursues,” “may,” “could,” “should,” “will,” “budgets,” “outlook,” “trends,” “guidance,” “focus,” “on schedule,” “on track,” “is slated,” “goals,” “objectives,” “strategies,” “opportunities,” “poised,” “potential”] and similar expressions are intended to identify such forward-looking statements. These statements are not guarantees of future performance and are subject to certain risks, uncertainties and other factors, many of which are beyond the company’s control and are difficult to predict. Therefore, actual outcomes and results may differ materially from what is expressed or forecasted in such forward-looking statements. The reader should not place undue reliance on these forward-looking statements, which speak only as of the date of this report. Unless legally required, Chevron undertakes no obligation to update publicly any forward-looking statements, whether as a result of new information, future events or otherwise.
Among the important factors that could cause actual results to differ materially from those in the forward-looking statements are: changing crude oil and natural gas prices and demand for our products, and production curtailments due to market conditions; crude oil production quotas or other actions that might be imposed by the Organization of Petroleum Exporting Countries (OPEC) and other producing countries; public health crises, such as pandemics (including coronavirus (COVID-19)) and epidemics, and any related government policies and actions; changing economic, regulatory and political environments in the various countries in which the company operates; general domestic and international economic and political conditions; changing refining, marketing and chemicals margins; the company’s ability to realize anticipated cost savings, expenditure reductions and efficiencies associated with enterprise transformation initiatives; actions of competitors or regulators; timing of exploration expenses; timing of crude oil liftings; the competitiveness of alternate-energy sources or product substitutes; technological developments; the results of operations and financial condition of the company’s suppliers, vendors, partners and equity affiliates, particularly during extended periods of low prices for crude oil and natural gas during the COVID-19 pandemic; the inability or failure of the company’s joint-venture partners to fund their share of operations and development activities; the potential failure to achieve expected net production from existing and future crude oil and natural gas development projects; potential delays in the development, construction or start-up of planned projects; the potential disruption or interruption of the company’s operations due to war, accidents, political events, civil unrest, severe weather, cyber threats, terrorist acts, or other natural or human causes beyond the company’s control; the potential liability for remedial actions or assessments under existing or future environmental regulations and litigation; significant operational, investment or product changes required by existing or future environmental statutes and regulations, including international agreements and national or regional legislation and regulatory measures to limit or reduce greenhouse gas emissions; the potential liability resulting from pending or future litigation; the company’s ability to achieve the anticipated benefits from the acquisition of Noble Energy, Inc.; the company’s future acquisitions or dispositions of assets or shares or the delay or failure of such transactions to close based on required closing conditions; the potential for gains and losses from asset dispositions or impairments; government mandated sales, divestitures, recapitalizations, industry-specific taxes, tariffs, sanctions, changes in fiscal terms or restrictions on scope of company operations; foreign currency movements compared with the U.S. dollar; material reductions in corporate liquidity and access to debt markets; the receipt of required Board authorizations to pay future dividends; the effects of changed accounting rules under generally accepted accounting principles promulgated by rule-setting bodies; the company’s ability to identify and mitigate the risks and hazards inherent in operating in the global energy industry; and the factors set forth under the heading “Risk Factors” on pages 18 through 23 in the Annual Report on Form 10-K. Other unpredictable or unknown factors not discussed in this report could also have material adverse effects on forward-looking statements.
Chevron Corporation 2020 Annual Report 30
Management’s Discussion and Analysis of Financial Condition and Results of Operations
Key Financial Results
Millions of dollars, except per-share amounts 2020 2019 2018
Net Income (Loss) Attributable to Chevron Corporation $ (5,543) $ 2,924 $ 14,824 Per Share Amounts:
Net Income (Loss) Attributable to Chevron Corporation – Basic $ (2.96) $ 1.55 $ 7.81 – Diluted $ (2.96) $ 1.54 $ 7.74
Dividends $ 5.16 $ 4.76 $ 4.48 Sales and Other Operating Revenues $ 94,471 $ 139,865 $ 158,902 Return on:
Capital Employed (2.8)% 2.0% 8.2% Stockholders’ Equity (4.0)% 2.0% 9.8%
Earnings by Major Operating Area
Millions of dollars 2020 2019 2018
Upstream United States $ (1,608) $ (5,094) $ 3,278 International (825) 7,670 10,038
Total Upstream (2,433) 2,576 13,316
Downstream United States (571) 1,559 2,103 International 618 922 1,695
Total Downstream 47 2,481 3,798
All Other (3,157) (2,133) (2,290) Net Income (Loss) Attributable to Chevron Corporation1,2 $ (5,543) $ 2,924 $ 14,824
1 Includes foreign currency effects: $ (645) $ (304) $ 611 2 Income net of tax, also referred to as “earnings” in the discussions that follow.
Refer to the “Results of Operations” section beginning on page 37 for a discussion of financial results by major operating area for the three years ended December 31, 2020.
Business Environment and Outlook
Chevron is a global energy company with substantial business activities in the following countries: Angola, Argentina, Australia, Bangladesh, Brazil, Canada, China, Egypt, Equatorial Guinea, Indonesia, Israel, Kazakhstan, Kurdistan Region of Iraq, Myanmar, Mexico, Nigeria, the Partitioned Zone between Saudi Arabia and Kuwait, the Philippines, Republic of Congo, Singapore, South Korea, Thailand, the United Kingdom, the United States, and Venezuela.
The company’s objective is to deliver higher returns, lower carbon and superior shareholder value in any business environment. Earnings of the company depend mostly on the profitability of its upstream business segment. The most significant factor affecting the results of operations for the upstream segment is the price of crude oil, which is determined in global markets outside of the company’s control. In the company’s downstream business, crude oil is the largest cost component of refined products. Periods of sustained lower prices could result in the impairment or write-off of specific assets in future periods and cause the company to adjust operating expenses, including employee reductions, and capital and exploratory expenditures, along with other measures intended to improve financial performance. Similarly, impairments or write-offs have occurred, and may occur in the future, as a result of managerial decisions not to progress certain projects in the company’s portfolio.
With ongoing global interest in addressing the risks of climate change, support for policies and advancements in lower carbon technologies is expected. In seeking to help advance a lower carbon future, Chevron is focused on lowering its carbon intensity cost efficiently, increasing renewables and offsets in support of its business, and investing in low-carbon technologies to enable commercial solutions.
Response to Market Conditions and COVID-19 During most of 2020, travel restrictions and other constraints on economic activity designed to limit the spread of the COVID-19 virus were implemented in many locations around the world. These constraints reduced demand for our products, and commodity prices fell, negatively impacting the company’s 2020 financial and operating results. While demand and commodity prices have shown signs of recovery, demand is not back to pre-pandemic levels, and financial results will likely continue to be challenged in future quarters. Due to the rapidly
Chevron Corporation 2020 Annual Report 31

32
Management’s Discussion and Analysis of Financial Condition and Results of Operations
trajectory of any increase in the cost of materials and services going forward will depend on the extent of the oil and gasindustry recovery. Correlated with these initial signs of industry recovery and cost stabilization was a noticeableimprovement in the risk of default for key suppliers. To date, there have been no material impacts to operations due tosupplier defaults. Chevron is actively monitoring and engaging key suppliers to mitigate any potential business impacts.
Capital and exploratory expenditures and operating expenses could also be affected by damage to production facilities causedby severe weather or civil unrest, delays in construction, or other factors.
WTI Crude Oil, Brent Crude Oil and Henry Hub Natural Gas Spot Prices - Quarterly Average
0
45
90
60
75
30
15
0.00
7.50
15.00
12.50
10.00
5.00
2.50
1Q 2Q 3Q 4Q 1Q 1Q2Q 2Q3Q 3Q4Q 4Q
Oil$/bbl
HH$/mcf
2018 2019 2020
BrentWTI Henry Hub
The chart above shows the trend in benchmark prices for Brent crude oil, West Texas Intermediate (WTI) crude oil and U.S.Henry Hub natural gas. The Brent price averaged $42 per barrel for the full-year 2020, compared to $64 in 2019. As ofmid-February 2021, the Brent price was $64 per barrel. The WTI price averaged $39 per barrel for the full-year 2020,compared to $57 in 2019. As of mid-February 2021, the WTI price was $60 per barrel. The majority of the company’s equitycrude production is priced based on the Brent benchmark.
Crude prices sharply declined at the end of the first and into the second quarter 2020 due to surplus supply as demanddecreased following government-imposed travel restrictions and other constraints on economic activity. In the second half of2020, the supply/demand balance slowly improved, primarily due to production cuts and demand growth, allowing prices tosomewhat recover. The company’s average realization for U.S. crude oil and natural gas liquids in 2020 was $31 per barrel,down 37 percent from 2019. The company’s average realization for international crude oil and natural gas liquids in 2020was $36 per barrel, down 38 percent from 2019.
Prices for natural gas are more closely aligned with seasonal supply-and-demand and infrastructure conditions in localmarkets. In the United States, prices at Henry Hub averaged $1.98 per thousand cubic feet (MCF) during 2020, comparedwith $2.53 per MCF during 2019. As of mid-February 2021, the Henry Hub spot price increased to $6.00 per MCF amidfreezing temperatures across much of the United States.
Outside the United States, prices for natural gas depend on a wide range of supply, demand and regulatory circumstances.The company’s long-term contract prices for liquefied natural gas (LNG) are typically linked to crude oil prices. Most of theequity LNG offtake from the operated Australian LNG projects is committed under binding long-term contracts, with theremainder to be sold in the Asian spot LNG market. International natural gas realizations averaged $4.59 per MCF during2020, compared with $5.83 per MCF during 2019. (See page 41 for the company’s average natural gas realizations for theU.S. and international regions.)
The company’s worldwide net oil-equivalent production in 2020 averaged 3.083 million barrels per day. About 14 percent ofthe company’s net oil-equivalent production in 2020 occurred in the OPEC-member countries of Angola, Equatorial Guinea,Nigeria, the Partitioned Zone between Saudi Arabia and Kuwait, Republic of Congo and Venezuela.
The company estimates that net oil-equivalent production in 2021 will grow up to 3 percent compared to 2020, assuming aBrent crude oil price of $50 per barrel and excluding the impact of anticipated 2021 asset sales. This estimate is subject tomany factors and uncertainties, including quotas or other actions that may be imposed by OPEC+; price effects onentitlement volumes; changes in fiscal terms or restrictions on the scope of company operations; delays in construction;reservoir performance; greater-than-expected declines in production from mature fields; start-up or ramp-up of projects;fluctuations in demand for crude oil and natural gas in various markets; weather conditions that may shut in production; civilunrest; changing geopolitics; delays in completion of maintenance turnarounds; storage constraints or economic
33
173155_Annual_Report_10-K.indd 32173155_Annual_Report_10-K.indd 32 3/5/21 6:04 PM3/5/21 6:04 PM
Management’s Discussion and Analysis of Financial Condition and Results of Operations
changing environment, there continues to be uncertainty and unpredictability around the extent to which the COVID-19 pandemic will impact our future results, which could be material.
Chevron entered this crisis well positioned with a strong balance sheet, flexible capital program and low cash flow breakeven price. To protect its long-term health and value, the company took swift action, adjusting the items it can control. The company lowered its capital expenditures 35 percent and lowered its operating expense, excluding non-recurring severance costs, by $1.4 billion compared to 2019. The company completed an enterprise-wide transformation that is expected to capture additional cost efficiencies. Additionally, the company suspended its stock repurchase program in March 2020. Taken together, these actions are consistent with our financial priorities: to protect the dividend, to prioritize capital spend that drives long-term value, and to maintain a strong balance sheet. The company expects to continue to have sufficient liquidity and access to both commercial paper and debt capital markets due to its strong balance sheet and investment grade credit ratings. Additionally, the company has access to nearly $10 billion in committed credit facilities.
The effective tax rate for the company can change substantially during periods of significant earnings volatility. This is due to the mix effects that are impacted both by the absolute level of earnings or losses and whether they arise in higher or lower tax rate jurisdictions. As a result, a decline or increase in the effective income tax rate in one period may not be indicative of expected results in future periods. Note 15 provides the company’s effective income tax rate for the last three years.
Refer to the “Cautionary Statements Relevant to Forward-Looking Information” on page 2 and to “Risk Factors” in Part I, Item 1A, on pages 18 through 23 of the company’s Annual Report on Form 10-K for a discussion of some of the inherent risks that could materially impact the company’s results of operations or financial condition.
The company continually evaluates opportunities to dispose of assets that are not expected to provide sufficient long-term value or to acquire assets or operations complementary to its asset base to help augment the company’s financial performance and value growth. Asset dispositions and restructurings may result in significant gains or losses in future periods. The company’s asset sale program for 2018 through 2020 targeted before-tax proceeds of $5-10 billion. For the three year period ending December 31, 2020, assets sales proceeds totaled $7.7 billion, in the middle of the guidance range.
The company closely monitors developments in the financial and credit markets, the level of worldwide economic activity, and the implications for the company of movements in prices for crude oil and natural gas. Management takes these developments into account in the conduct of daily operations and for business planning.
Comments related to earnings trends for the company’s major business areas are as follows:
Upstream Earnings for the upstream segment are closely aligned with industry prices for crude oil and natural gas. Crude oil and natural gas prices are subject to external factors over which the company has no control, including product demand connected with global economic conditions, industry production and inventory levels, technology advancements, production quotas or other actions imposed by the Organization of Petroleum Exporting Countries (OPEC) or other producers, actions of regulators, weather-related damage and disruptions, competing fuel prices, natural and human causes beyond the company’s control such as the COVID-19 pandemic, and regional supply interruptions or fears thereof that may be caused by military conflicts, civil unrest or political uncertainty. Any of these factors could also inhibit the company’s production capacity in an affected region. The company closely monitors developments in the countries in which it operates and holds investments, and seeks to manage risks in operating its facilities and businesses. The longer-term trend in earnings for the upstream segment is also a function of other factors, including the company’s ability to find or acquire and efficiently produce crude oil and natural gas, changes in fiscal terms of contracts, and changes in tax and other applicable laws and regulations.
The company is actively managing its schedule of work, contracting, procurement, and supply chain activities to effectively manage costs and ensure supply chain resiliency and continuity in support of operational goals. Third party costs for capital, exploration, and operating expenses can be subject to external factors beyond the company’s control including, but not limited to: the general level of inflation, tariffs or other taxes imposed on goods or services, and market based prices charged by the industry’s material and service providers. Chevron utilizes contracts with various pricing mechanisms, so there may be a lag before the company’s costs reflect the changes in market trends.
The spot markets and some of the current cost indexes for many materials and services have stabilized. Crude oil and natural gas prices and demand have rebounded from lows of the early pandemic though demand still has not returned to pre-pandemic levels. Drilling activity in the U.S. has risen slowly but steadily through the end of the year. The timing and
Chevron Corporation 2020 Annual Report 32

Management’s Discussion and Analysis of Financial Condition and Results of Operations
changing environment, there continues to be uncertainty and unpredictability around the extent to which the COVID-19pandemic will impact our future results, which could be material.
Chevron entered this crisis well positioned with a strong balance sheet, flexible capital program and low cash flow breakevenprice. To protect its long-term health and value, the company took swift action, adjusting the items it can control. Thecompany lowered its capital expenditures 35 percent and lowered its operating expense, excluding non-recurring severancecosts, by $1.4 billion compared to 2019. The company completed an enterprise-wide transformation that is expected tocapture additional cost efficiencies. Additionally, the company suspended its stock repurchase program in March 2020.Taken together, these actions are consistent with our financial priorities: to protect the dividend, to prioritize capital spendthat drives long-term value, and to maintain a strong balance sheet. The company expects to continue to have sufficientliquidity and access to both commercial paper and debt capital markets due to its strong balance sheet and investment gradecredit ratings. Additionally, the company has access to nearly $10 billion in committed credit facilities.
The effective tax rate for the company can change substantially during periods of significant earnings volatility. This is dueto the mix effects that are impacted both by the absolute level of earnings or losses and whether they arise in higher or lowertax rate jurisdictions. As a result, a decline or increase in the effective income tax rate in one period may not be indicative ofexpected results in future periods. Note 15 provides the company’s effective income tax rate for the last three years.
Refer to the “Cautionary Statements Relevant to Forward-Looking Information” on page 2 and to “Risk Factors” in Part I,Item 1A, on pages 18 through 23 of the company’s Annual Report on Form 10-K for a discussion of some of the inherentrisks that could materially impact the company’s results of operations or financial condition.
The company continually evaluates opportunities to dispose of assets that are not expected to provide sufficient long-termvalue or to acquire assets or operations complementary to its asset base to help augment the company’s financialperformance and value growth. Asset dispositions and restructurings may result in significant gains or losses in futureperiods. The company’s asset sale program for 2018 through 2020 targeted before-tax proceeds of $5-10 billion. For thethree year period ending December 31, 2020, assets sales proceeds totaled $7.7 billion, in the middle of the guidance range.
The company closely monitors developments in the financial and credit markets, the level of worldwide economic activity,and the implications for the company of movements in prices for crude oil and natural gas. Management takes thesedevelopments into account in the conduct of daily operations and for business planning.
Comments related to earnings trends for the company’s major business areas are as follows:
Upstream Earnings for the upstream segment are closely aligned with industry prices for crude oil and natural gas. Crude oiland natural gas prices are subject to external factors over which the company has no control, including product demandconnected with global economic conditions, industry production and inventory levels, technology advancements, productionquotas or other actions imposed by the Organization of Petroleum Exporting Countries (OPEC) or other producers, actions ofregulators, weather-related damage and disruptions, competing fuel prices, natural and human causes beyond the company’scontrol such as the COVID-19 pandemic, and regional supply interruptions or fears thereof that may be caused by militaryconflicts, civil unrest or political uncertainty. Any of these factors could also inhibit the company’s production capacity in anaffected region. The company closely monitors developments in the countries in which it operates and holds investments, andseeks to manage risks in operating its facilities and businesses. The longer-term trend in earnings for the upstream segment isalso a function of other factors, including the company’s ability to find or acquire and efficiently produce crude oil andnatural gas, changes in fiscal terms of contracts, and changes in tax and other applicable laws and regulations.
The company is actively managing its schedule of work, contracting, procurement, and supply chain activities to effectivelymanage costs and ensure supply chain resiliency and continuity in support of operational goals. Third party costs for capital,exploration, and operating expenses can be subject to external factors beyond the company’s control including, but notlimited to: the general level of inflation, tariffs or other taxes imposed on goods or services, and market based prices chargedby the industry’s material and service providers. Chevron utilizes contracts with various pricing mechanisms, so there may bea lag before the company’s costs reflect the changes in market trends.
The spot markets and some of the current cost indexes for many materials and services have stabilized. Crude oil and naturalgas prices and demand have rebounded from lows of the early pandemic though demand still has not returned topre-pandemic levels. Drilling activity in the U.S. has risen slowly but steadily through the end of the year. The timing and
32 33
173155_Annual_Report_10-K.indd 33173155_Annual_Report_10-K.indd 33 3/5/21 6:04 PM3/5/21 6:04 PM
Management’s Discussion and Analysis of Financial Condition and Results of Operations
trajectory of any increase in the cost of materials and services going forward will depend on the extent of the oil and gas industry recovery. Correlated with these initial signs of industry recovery and cost stabilization was a noticeable improvement in the risk of default for key suppliers. To date, there have been no material impacts to operations due to supplier defaults. Chevron is actively monitoring and engaging key suppliers to mitigate any potential business impacts.
Capital and exploratory expenditures and operating expenses could also be affected by damage to production facilities caused by severe weather or civil unrest, delays in construction, or other factors.
WTI Crude Oil, Brent Crude Oil and Henry Hub Natural Gas Spot Prices - Quarterly Average
Oil $/bbl
90
75
60
45
30
15
0
Brent WTI Henry Hub
HH $/mcf
15.00
12.50
10.00
7.50
5.00
2.50
0.00
1Q 2Q 3Q 4Q 1Q 2Q 3Q 4Q 1Q 2Q 3Q 4Q
2018 2019 2020
The chart above shows the trend in benchmark prices for Brent crude oil, West Texas Intermediate (WTI) crude oil and U.S. Henry Hub natural gas. The Brent price averaged $42 per barrel for the full-year 2020, compared to $64 in 2019. As of mid-February 2021, the Brent price was $64 per barrel. The WTI price averaged $39 per barrel for the full-year 2020, compared to $57 in 2019. As of mid-February 2021, the WTI price was $60 per barrel. The majority of the company’s equity crude production is priced based on the Brent benchmark.
Crude prices sharply declined at the end of the first and into the second quarter 2020 due to surplus supply as demand decreased following government-imposed travel restrictions and other constraints on economic activity. In the second half of 2020, the supply/demand balance slowly improved, primarily due to production cuts and demand growth, allowing prices to somewhat recover. The company’s average realization for U.S. crude oil and natural gas liquids in 2020 was $31 per barrel, down 37 percent from 2019. The company’s average realization for international crude oil and natural gas liquids in 2020 was $36 per barrel, down 38 percent from 2019.
Prices for natural gas are more closely aligned with seasonal supply-and-demand and infrastructure conditions in local markets. In the United States, prices at Henry Hub averaged $1.98 per thousand cubic feet (MCF) during 2020, compared with $2.53 per MCF during 2019. As of mid-February 2021, the Henry Hub spot price increased to $6.00 per MCF amid freezing temperatures across much of the United States.
Outside the United States, prices for natural gas depend on a wide range of supply, demand and regulatory circumstances. The company’s long-term contract prices for liquefied natural gas (LNG) are typically linked to crude oil prices. Most of the equity LNG offtake from the operated Australian LNG projects is committed under binding long-term contracts, with the remainder to be sold in the Asian spot LNG market. International natural gas realizations averaged $4.59 per MCF during 2020, compared with $5.83 per MCF during 2019. (See page 41 for the company’s average natural gas realizations for the U.S. and international regions.)
The company’s worldwide net oil-equivalent production in 2020 averaged 3.083 million barrels per day. About 14 percent of the company’s net oil-equivalent production in 2020 occurred in the OPEC-member countries of Angola, Equatorial Guinea, Nigeria, the Partitioned Zone between Saudi Arabia and Kuwait, Republic of Congo and Venezuela.
The company estimates that net oil-equivalent production in 2021 will grow up to 3 percent compared to 2020, assuming a Brent crude oil price of $50 per barrel and excluding the impact of anticipated 2021 asset sales. This estimate is subject to many factors and uncertainties, including quotas or other actions that may be imposed by OPEC+; price effects on entitlement volumes; changes in fiscal terms or restrictions on the scope of company operations; delays in construction; reservoir performance; greater-than-expected declines in production from mature fields; start-up or ramp-up of projects; fluctuations in demand for crude oil and natural gas in various markets; weather conditions that may shut in production; civil unrest; changing geopolitics; delays in completion of maintenance turnarounds; storage constraints or economic
Chevron Corporation 2020 Annual Report 33

34
Management’s Discussion and Analysis of Financial Condition and Results of Operations
locations with high COVID-19 infection rates deferred non-essential work and demobilized non-essential personnel to reducethe COVID-19 exposure risk to our workforce.
Despite the challenges posed by the pandemic, progress continues on the FGP/WPMP project at Tengiz. In the secondquarter the project construction workforce was demobilized to 20 percent of planned levels, which slowed the overallconstruction pace. In the third quarter, the rate of infections in Kazakhstan slowed, allowing remobilization of the FGP/WPMP construction workforce to begin. In the fourth quarter, staffing levels at FGP/WPMP returned to 95 percent of desiredfourth quarter remobilization levels, however a worldwide resurgence of infections prevented the remaining 5 percent of theworkforce from returning to work and slowed progress on the project. Extended rotations, COVID testing and isolationprotocols are in place to minimize the spread of the virus. Given the uncertain timeline for remobilizing all personnel andsafely sustaining activity levels, it is too early to provide meaningful information regarding impacts on project cost andschedule.
Facility maintenance turnarounds are being adjusted and, in certain cases, deferred into 2021. In some cases, turnaroundshave been extended in duration and/or reduced in scope in response to the pandemic. As a result of the reduction in capitalexpenditures, new production is expected to be lower in the near term as drilling and completion activities are scaled back,most notably in the Permian Basin, Gulf of Mexico, and Argentina. Exploration activities and projects not yet in executionphase have been deferred, which may impact production in future years.
Production levels were curtailed in 2020 largely because of reductions imposed by OPEC+ nations in Kazakhstan, Nigeriaand Angola. In the fourth quarter, OPEC+ curtailments eased slightly relative to the third quarter. Production has also beencurtailed due to market conditions, most notably in Thailand. Additionally, operators of assets where the company hasnon-operated interests also curtailed production. Production curtailments of approximately 106 thousand barrels of oilequivalent per day were recorded in 2020. In the first quarter of 2021, we expect curtailments to be approximately40 thousand barrels of oil equivalent per day, predominately related to OPEC+ restrictions.
Decreased capital expenditures, lower activity levels, delays in future development timing, and lower commodity prices haveresulted in reductions to Chevron’s proved reserve quantities for 2020. For more information on reserves, refer to Table Vbeginning on page 103.
As some countries face a resurgence of the virus, regulatory and in-country conditions could impact logistics and materialmovement and pose a risk to business continuity. We are taking precautionary measures to reduce the risk of exposure to andspread of the COVID-19 virus through screening, testing and, when appropriate, quarantining workforce and visitors uponarrival to our operated facilities.
Refer to the “Results of Operations” section on pages 37 and 38 for additional discussion of the company’s upstreambusiness.
Downstream Earnings for the downstream segment are closely tied to margins on the refining, manufacturing and marketingof products that include gasoline, diesel, jet fuel, lubricants, fuel oil, fuel and lubricant additives, and petrochemicals.Industry margins are sometimes volatile and can be affected by the global and regional supply-and-demand balance forrefined products and petrochemicals, and by changes in the price of crude oil, other refinery and petrochemical feedstocks,and natural gas. Industry margins can also be influenced by inventory levels, geopolitical events, costs of materials andservices, refinery or chemical plant capacity utilization, maintenance programs, and disruptions at refineries or chemicalplants resulting from unplanned outages due to severe weather, fires or other operational events.
Other factors affecting profitability for downstream operations include the reliability and efficiency of the company’srefining, marketing and petrochemical assets, the effectiveness of its crude oil and product supply functions, and thevolatility of tanker-charter rates for the company’s shipping operations, which are driven by the industry’s demand for crudeoil and product tankers. Other factors beyond the company’s control include the general level of inflation and energy costs tooperate the company’s refining, marketing and petrochemical assets and changes in tax laws and regulations.
The company’s most significant marketing areas are the West Coast and Gulf Coast of the United States and Asia. Chevronoperates or has significant ownership interests in refineries in each of these areas.
Response to Market Conditions and COVID-19: Downstream Beginning in March 2020 and continuing into the first quarter2021, demand for refined products (primarily jet fuel and motor gasoline) has been below prior year levels as a result oftravel restrictions and other constraints on economic activity implemented in many countries to combat the spread of theCOVID-19 virus. Product prices also fell sharply, and although economic activity has somewhat rebounded from lowsexperienced in April, refining margins continued to be at or near historic lows due to lower demand and pressure from
35
173155_Annual_Report_10-K.indd 34173155_Annual_Report_10-K.indd 34 3/5/21 6:04 PM3/5/21 6:04 PM
Management’s Discussion and Analysis of Financial Condition and Results of Operations
conditions that could lead to shut-in production; or other disruptions to operations. The outlook for future production levels is also affected by the size and number of economic investment opportunities and the time lag between initial exploration and the beginning of production. The company has increased its investment emphasis on short-cycle projects, but these too are under pressure in the current market environment.
In the Partitioned Zone between Saudi Arabia and Kuwait, production was shut-in beginning in May 2015. In December 2019, the governments of Saudi Arabia and Kuwait signed a memorandum of understanding to allow production to restart in the Partitioned Zone. In mid-February 2020, pre-startup activities commenced, and production resumed in July 2020. The financial effects from the loss of production in 2019 and first half 2020 were not significant. During the fourth quarter 2020, oil equivalent production in the Partitioned Zone averaged 40 thousand barrels per day.
Chevron has interests in Venezuelan crude oil assets, including those operated by Petropiar, Petroboscan and Petroindependiente. While the operating environment in Venezuela has been deteriorating for some time, Petropiar, Petroboscan, and Petroindependiente have conducted activities consistent with the authorization provided pursuant to general licenses issued by the United States government. During the second quarter 2020, the company completed its evaluation of the carrying value of its Venezuelan investments in line with its accounting policies and concluded that given the current operating environment and overall outlook, which created significant uncertainties regarding the recovery of the company’s investment, an other than temporary loss of value had occurred, which resulted in a full impairment of its investment in the country totaling $2.6 billion and change in accounting treatment from equity method to non-equity method of accounting. As a result, the company also removed approximately 160 million barrels of proved reserves and stopped reporting production in the country effective July 2020. The company remains committed to its people, assets and operations in Venezuela.
Net proved reserves for consolidated companies and affiliated companies totaled 11.1 billion barrels of oil-equivalent at year-end 2020, a decrease of 3 percent from year-end 2019. The reserve replacement ratio in 2020 was 74 percent. The 5 and 10 year reserve replacement ratios were 99 percent and 106 percent, respectively. Refer to Table V beginning on page 103 for a tabulation of the company’s proved net oil and gas reserves by geographic area, at the beginning of 2018 and each year-end from 2018 through 2020, and an accompanying discussion of major changes to proved reserves by geographic area for the three-year period ending December 31, 2020.
Response to Market Conditions and COVID-19: Upstream Travel restrictions and other constraints on global economic activity in 2020 in response to COVID-19 caused a significant decrease in demand for oil and gas. This led to lower price realizations across all commodities. While critical asset integrity and reliability activities progressed throughout the year,
Chevron Corporation 2020 Annual Report 34

Management’s Discussion and Analysis of Financial Condition and Results of Operations
conditions that could lead to shut-in production; or other disruptions to operations. The outlook for future production levels isalso affected by the size and number of economic investment opportunities and the time lag between initial exploration andthe beginning of production. The company has increased its investment emphasis on short-cycle projects, but these too areunder pressure in the current market environment.
In the Partitioned Zone between Saudi Arabia and Kuwait, production was shut-in beginning in May 2015. In December2019, the governments of Saudi Arabia and Kuwait signed a memorandum of understanding to allow production to restart inthe Partitioned Zone. In mid-February 2020, pre-startup activities commenced, and production resumed in July 2020. Thefinancial effects from the loss of production in 2019 and first half 2020 were not significant. During the fourth quarter 2020,oil equivalent production in the Partitioned Zone averaged 40 thousand barrels per day.
Chevron has interests in Venezuelan crude oil assets, including those operated by Petropiar, Petroboscan andPetroindependiente. While the operating environment in Venezuela has been deteriorating for some time, Petropiar,Petroboscan, and Petroindependiente have conducted activities consistent with the authorization provided pursuant to generallicenses issued by the United States government. During the second quarter 2020, the company completed its evaluation ofthe carrying value of its Venezuelan investments in line with its accounting policies and concluded that given the currentoperating environment and overall outlook, which created significant uncertainties regarding the recovery of the company’sinvestment, an other than temporary loss of value had occurred, which resulted in a full impairment of its investment in thecountry totaling $2.6 billion and change in accounting treatment from equity method to non-equity method of accounting. Asa result, the company also removed approximately 160 million barrels of proved reserves and stopped reporting production inthe country effective July 2020. The company remains committed to its people, assets and operations in Venezuela.
Net proved reserves for consolidated companies and affiliated companies totaled 11.1 billion barrels of oil-equivalent atyear-end 2020, a decrease of 3 percent from year-end 2019. The reserve replacement ratio in 2020 was 74 percent. The 5 and10 year reserve replacement ratios were 99 percent and 106 percent, respectively. Refer to Table V beginning on page 103for a tabulation of the company’s proved net oil and gas reserves by geographic area, at the beginning of 2018 and eachyear-end from 2018 through 2020, and an accompanying discussion of major changes to proved reserves by geographic areafor the three-year period ending December 31, 2020.
Response to Market Conditions and COVID-19: Upstream Travel restrictions and other constraints on global economicactivity in 2020 in response to COVID-19 caused a significant decrease in demand for oil and gas. This led to lower pricerealizations across all commodities. While critical asset integrity and reliability activities progressed throughout the year,
34 35
173155_Annual_Report_10-K.indd 35173155_Annual_Report_10-K.indd 35 3/5/21 6:04 PM3/5/21 6:04 PM
Management’s Discussion and Analysis of Financial Condition and Results of Operations
locations with high COVID-19 infection rates deferred non-essential work and demobilized non-essential personnel to reduce the COVID-19 exposure risk to our workforce.
Despite the challenges posed by the pandemic, progress continues on the FGP/WPMP project at Tengiz. In the second quarter the project construction workforce was demobilized to 20 percent of planned levels, which slowed the overall construction pace. In the third quarter, the rate of infections in Kazakhstan slowed, allowing remobilization of the FGP/ WPMP construction workforce to begin. In the fourth quarter, staffing levels at FGP/WPMP returned to 95 percent of desired fourth quarter remobilization levels, however a worldwide resurgence of infections prevented the remaining 5 percent of the workforce from returning to work and slowed progress on the project. Extended rotations, COVID testing and isolation protocols are in place to minimize the spread of the virus. Given the uncertain timeline for remobilizing all personnel and safely sustaining activity levels, it is too early to provide meaningful information regarding impacts on project cost and schedule.
Facility maintenance turnarounds are being adjusted and, in certain cases, deferred into 2021. In some cases, turnarounds have been extended in duration and/or reduced in scope in response to the pandemic. As a result of the reduction in capital expenditures, new production is expected to be lower in the near term as drilling and completion activities are scaled back, most notably in the Permian Basin, Gulf of Mexico, and Argentina. Exploration activities and projects not yet in execution phase have been deferred, which may impact production in future years.
Production levels were curtailed in 2020 largely because of reductions imposed by OPEC+ nations in Kazakhstan, Nigeria and Angola. In the fourth quarter, OPEC+ curtailments eased slightly relative to the third quarter. Production has also been curtailed due to market conditions, most notably in Thailand. Additionally, operators of assets where the company has non-operated interests also curtailed production. Production curtailments of approximately 106 thousand barrels of oil equivalent per day were recorded in 2020. In the first quarter of 2021, we expect curtailments to be approximately 40 thousand barrels of oil equivalent per day, predominately related to OPEC+ restrictions.
Decreased capital expenditures, lower activity levels, delays in future development timing, and lower commodity prices have resulted in reductions to Chevron’s proved reserve quantities for 2020. For more information on reserves, refer to Table V beginning on page 103.
As some countries face a resurgence of the virus, regulatory and in-country conditions could impact logistics and material movement and pose a risk to business continuity. We are taking precautionary measures to reduce the risk of exposure to and spread of the COVID-19 virus through screening, testing and, when appropriate, quarantining workforce and visitors upon arrival to our operated facilities.
Refer to the “Results of Operations” section on pages 37 and 38 for additional discussion of the company’s upstream business.
Downstream Earnings for the downstream segment are closely tied to margins on the refining, manufacturing and marketing of products that include gasoline, diesel, jet fuel, lubricants, fuel oil, fuel and lubricant additives, and petrochemicals. Industry margins are sometimes volatile and can be affected by the global and regional supply-and-demand balance for refined products and petrochemicals, and by changes in the price of crude oil, other refinery and petrochemical feedstocks, and natural gas. Industry margins can also be influenced by inventory levels, geopolitical events, costs of materials and services, refinery or chemical plant capacity utilization, maintenance programs, and disruptions at refineries or chemical plants resulting from unplanned outages due to severe weather, fires or other operational events.
Other factors affecting profitability for downstream operations include the reliability and efficiency of the company’s refining, marketing and petrochemical assets, the effectiveness of its crude oil and product supply functions, and the volatility of tanker-charter rates for the company’s shipping operations, which are driven by the industry’s demand for crude oil and product tankers. Other factors beyond the company’s control include the general level of inflation and energy costs to operate the company’s refining, marketing and petrochemical assets and changes in tax laws and regulations.
The company’s most significant marketing areas are the West Coast and Gulf Coast of the United States and Asia. Chevron operates or has significant ownership interests in refineries in each of these areas.
Response to Market Conditions and COVID-19: Downstream Beginning in March 2020 and continuing into the first quarter 2021, demand for refined products (primarily jet fuel and motor gasoline) has been below prior year levels as a result of travel restrictions and other constraints on economic activity implemented in many countries to combat the spread of the COVID-19 virus. Product prices also fell sharply, and although economic activity has somewhat rebounded from lows experienced in April, refining margins continued to be at or near historic lows due to lower demand and pressure from
Chevron Corporation 2020 Annual Report 35

36
Management’s Discussion and Analysis of Financial Condition and Results of Operations
Results of Operations
The following section presents the results of operations and variances on an after-tax basis for the company’s businesssegments – Upstream and Downstream – as well as for “All Other.” Earnings are also presented for the U.S. and internationalgeographic areas of the Upstream and Downstream business segments. Refer to Note 12, beginning on page 74, for adiscussion of the company’s “reportable segments.” This section should also be read in conjunction with the discussion in“Business Environment and Outlook” on pages 31 through 36. Refer to the “Selected Operating Data” table on page 41 for athree-year comparison of production volumes, refined product sales volumes, and refinery inputs. A discussion of variancesbetween 2019 and 2018 can be found in the “Results of Operations” section on pages 33 through 34 of the company’s 2019Annual Report on Form 10-K filed with the SEC on February 22, 2020.
U.S. Upstream
Millions of dollars 2020 2019 2018
Earnings (Loss) $ (1,608) $ (5,094) $ 3,278
U.S. upstream reported a loss of $1.61 billion in 2020, compared with a loss of $5.09 billion in 2019. The smaller loss waslargely due to the absence of fourth quarter 2019 impairment charges of $8.17 billion, primarily associated with Appalachiashale and Big Foot, partially offset by lower crude oil realizations of $3.36 billion and second quarter 2020 impairments andwrite-offs of $1.20 billion.
The company’s average realization for U.S. crude oil and natural gas liquids in 2020 was $30.53 per barrel compared with$48.54 in 2019. The average natural gas realization was $0.98 per thousand cubic feet in 2020, compared with $1.09 in 2019.
Net oil-equivalent production in 2020 averaged 1.06 million barrels per day, up 14 percent from 2019. Production increasesfrom shale and tight properties in the Permian Basin and 58,000 barrels per day of production from the Noble acquisitionwere partially offset by normal field declines.
The net liquids component of oil-equivalent production for 2020 averaged 790,000 barrels per day, up 9 percent from 2019.Net natural gas production averaged 1.61 billion cubic feet per day in 2020, up 31 percent from 2019.
International Upstream
Millions of dollars 2020 2019 2018
Earnings (Loss)* $ (825) $ 7,670 $ 10,038
*Includes foreign currency effects: $ (285) $ (323) $ 545
International upstream reported a loss of $825 million in 2020, compared with earnings of $7.67 billion in 2019. Thedecrease was primarily due to lower crude oil and natural gas realizations of $4.6 billion and $1.2 billion, respectively,
37
173155_Annual_Report_10-K.indd 36173155_Annual_Report_10-K.indd 36 3/5/21 6:04 PM3/5/21 6:04 PM
Management’s Discussion and Analysis of Financial Condition and Results of Operations
a global oil product surplus. Chevron continued to take steps to maximize diesel production, given the decline in jet fuel and motor gasoline demand, to fuel transportation that keeps global supply chains moving. The company is actively monitoring supply and demand dynamics as every region is experiencing different recovery trends. The company is adjusting the schedule for planned maintenance activity across its refining network and idling certain processing units to adjust for lower demand, reduce costs, manage inventories and, most importantly, protect the safety of employees and contractors.
As of mid-February 2021, Chevron’s refining crude utilization was approximately 80 to 85 percent and sales were down year-over-year approximately 50 percent for jet fuel, approximately 5 percent for motor gasoline, while diesel sales were relatively flat. It is unclear how long these conditions will persist, but the company will continue to take actions necessary to protect the health and well-being of people, the environment and its operations as conditions evolve. Refer to the “Results of Operations” section on page 38 for additional discussion of the company’s downstream operations.
All Other consists of worldwide cash management and debt financing activities, corporate administrative functions, insurance operations, real estate activities and technology companies.
Operating Developments
Key operating developments and other events during 2020 and early 2021 included the following:
Upstream
Azerbaijan Completed the sale of the company’s interest in the Azeri-Chirag-Gunashli fields and Baku-Tbilisi-Ceyhan pipeline.
Colombia Completed the sale of the company’s interest in the offshore Chuchupa and onshore Ballena natural gas fields.
Philippines Completed the sale of the company’s interest in the Malampaya field in March.
United States Completed the acquisition of Noble Energy, Inc.
United States Completed the sale of the Appalachia natural gas business.
Downstream
Australia Completed the acquisition of Puma Energy (Australia) Holdings Pty Ltd.
Other
United States Chevron’s joint venture, CalBioGas LLC, successfully achieved first renewable natural gas production from dairy farms in California and marketed it as an alternative fuel for heavy-duty trucks and buses.
United States Announced the formation of a joint venture with Brightmark LLC to produce and market renewable natural gas.
United States Announced an investment in Zap Energy Inc., a start-up company developing a next-generation modular nuclear reactor.
United States Announced an investment in Blue Planet Systems Corporation, a startup that manufactures and develops carbonate aggregates and carbon capture technology intended to reduce the carbon intensity of industrial operations.
United States Announced an agreement with Algonquin Power & Utilities Corp. seeking to co-develop renewable power projects that will provide electricity to strategic assets across Chevron’s global portfolio. Under the four-year agreement, Chevron plans to generate more than 500 megawatts of its energy demand from renewable sources.
United States Announced a non-binding offer in February 2021 to acquire the outstanding common units of Noble Midstream Partners LP not already owned by Chevron.
Common Stock Dividends The 2020 annual dividend was $5.16 per share, making 2020 the 33rd consecutive year that the company increased its annual per share dividend payout. In January 2021, the company’s Board of Directors declared a quarterly dividend of $1.29 per share.
Common Stock Repurchase Program The company purchased $1.75 billion of its common stock in 2020 under its stock repurchase programs. The stock repurchase program was suspended in March 2020.
Chevron Corporation 2020 Annual Report 36
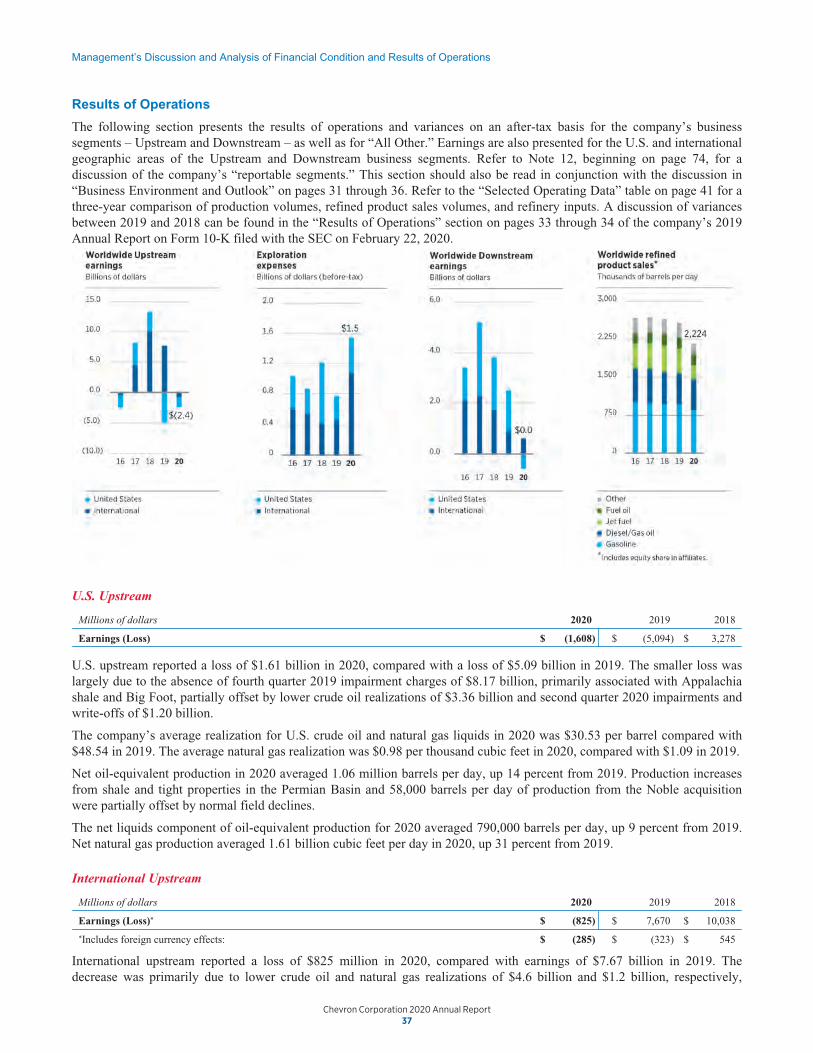
Management’s Discussion and Analysis of Financial Condition and Results of Operations
a global oil product surplus. Chevron continued to take steps to maximize diesel production, given the decline in jet fuel andmotor gasoline demand, to fuel transportation that keeps global supply chains moving. The company is actively monitoringsupply and demand dynamics as every region is experiencing different recovery trends. The company is adjusting theschedule for planned maintenance activity across its refining network and idling certain processing units to adjust for lowerdemand, reduce costs, manage inventories and, most importantly, protect the safety of employees and contractors.
As of mid-February 2021, Chevron’s refining crude utilization was approximately 80 to 85 percent and sales were downyear-over-year approximately 50 percent for jet fuel, approximately 5 percent for motor gasoline, while diesel sales wererelatively flat. It is unclear how long these conditions will persist, but the company will continue to take actions necessary toprotect the health and well-being of people, the environment and its operations as conditions evolve. Refer to the “Results ofOperations” section on page 38 for additional discussion of the company’s downstream operations.
All Other consists of worldwide cash management and debt financing activities, corporate administrative functions,insurance operations, real estate activities and technology companies.
Operating Developments
Key operating developments and other events during 2020 and early 2021 included the following:
Upstream
Azerbaijan Completed the sale of the company’s interest in the Azeri-Chirag-Gunashli fields and Baku-Tbilisi-Ceyhanpipeline.
Colombia Completed the sale of the company’s interest in the offshore Chuchupa and onshore Ballena natural gas fields.
Philippines Completed the sale of the company’s interest in the Malampaya field in March.
United States Completed the acquisition of Noble Energy, Inc.
United States Completed the sale of the Appalachia natural gas business.
Downstream
Australia Completed the acquisition of Puma Energy (Australia) Holdings Pty Ltd.
Other
United States Chevron’s joint venture, CalBioGas LLC, successfully achieved first renewable natural gas production fromdairy farms in California and marketed it as an alternative fuel for heavy-duty trucks and buses.
United States Announced the formation of a joint venture with Brightmark LLC to produce and market renewable naturalgas.
United States Announced an investment in Zap Energy Inc., a start-up company developing a next-generation modularnuclear reactor.
United States Announced an investment in Blue Planet Systems Corporation, a startup that manufactures and developscarbonate aggregates and carbon capture technology intended to reduce the carbon intensity of industrial operations.
United States Announced an agreement with Algonquin Power & Utilities Corp. seeking to co-develop renewable powerprojects that will provide electricity to strategic assets across Chevron’s global portfolio. Under the four-year agreement,Chevron plans to generate more than 500 megawatts of its energy demand from renewable sources.
United States Announced a non-binding offer in February 2021 to acquire the outstanding common units of NobleMidstream Partners LP not already owned by Chevron.
Common Stock Dividends The 2020 annual dividend was $5.16 per share, making 2020 the 33rd consecutive year that thecompany increased its annual per share dividend payout. In January 2021, the company’s Board of Directors declared aquarterly dividend of $1.29 per share.
Common Stock Repurchase Program The company purchased $1.75 billion of its common stock in 2020 under its stockrepurchase programs. The stock repurchase program was suspended in March 2020.
36 37
173155_Annual_Report_10-K.indd 37173155_Annual_Report_10-K.indd 37 3/5/21 6:04 PM3/5/21 6:04 PM
Management’s Discussion and Analysis of Financial Condition and Results of Operations
Results of Operations
The following section presents the results of operations and variances on an after-tax basis for the company’s business segments – Upstream and Downstream – as well as for “All Other.” Earnings are also presented for the U.S. and international geographic areas of the Upstream and Downstream business segments. Refer to Note 12, beginning on page 74, for a discussion of the company’s “reportable segments.” This section should also be read in conjunction with the discussion in “Business Environment and Outlook” on pages 31 through 36. Refer to the “Selected Operating Data” table on page 41 for a three-year comparison of production volumes, refined product sales volumes, and refinery inputs. A discussion of variances between 2019 and 2018 can be found in the “Results of Operations” section on pages 33 through 34 of the company’s 2019 Annual Report on Form 10-K filed with the SEC on February 22, 2020.
U.S. Upstream
Millions of dollars 2020 2019 2018
Earnings (Loss) $ (1,608) $ (5,094) $ 3,278
U.S. upstream reported a loss of $1.61 billion in 2020, compared with a loss of $5.09 billion in 2019. The smaller loss was largely due to the absence of fourth quarter 2019 impairment charges of $8.17 billion, primarily associated with Appalachia shale and Big Foot, partially offset by lower crude oil realizations of $3.36 billion and second quarter 2020 impairments and write-offs of $1.20 billion.
The company’s average realization for U.S. crude oil and natural gas liquids in 2020 was $30.53 per barrel compared with $48.54 in 2019. The average natural gas realization was $0.98 per thousand cubic feet in 2020, compared with $1.09 in 2019.
Net oil-equivalent production in 2020 averaged 1.06 million barrels per day, up 14 percent from 2019. Production increases from shale and tight properties in the Permian Basin and 58,000 barrels per day of production from the Noble acquisition were partially offset by normal field declines.
The net liquids component of oil-equivalent production for 2020 averaged 790,000 barrels per day, up 9 percent from 2019. Net natural gas production averaged 1.61 billion cubic feet per day in 2020, up 31 percent from 2019.
International Upstream
Earnings (Loss)* $ (825) $ 7,670 $ 10,038
*Includes foreign currency effects: $ (285) $ (323) $ 545
Millions of dollars 2020 2019 2018
International upstream reported a loss of $825 million in 2020, compared with earnings of $7.67 billion in 2019. The decrease was primarily due to lower crude oil and natural gas realizations of $4.6 billion and $1.2 billion, respectively,
Chevron Corporation 2020 Annual Report 37
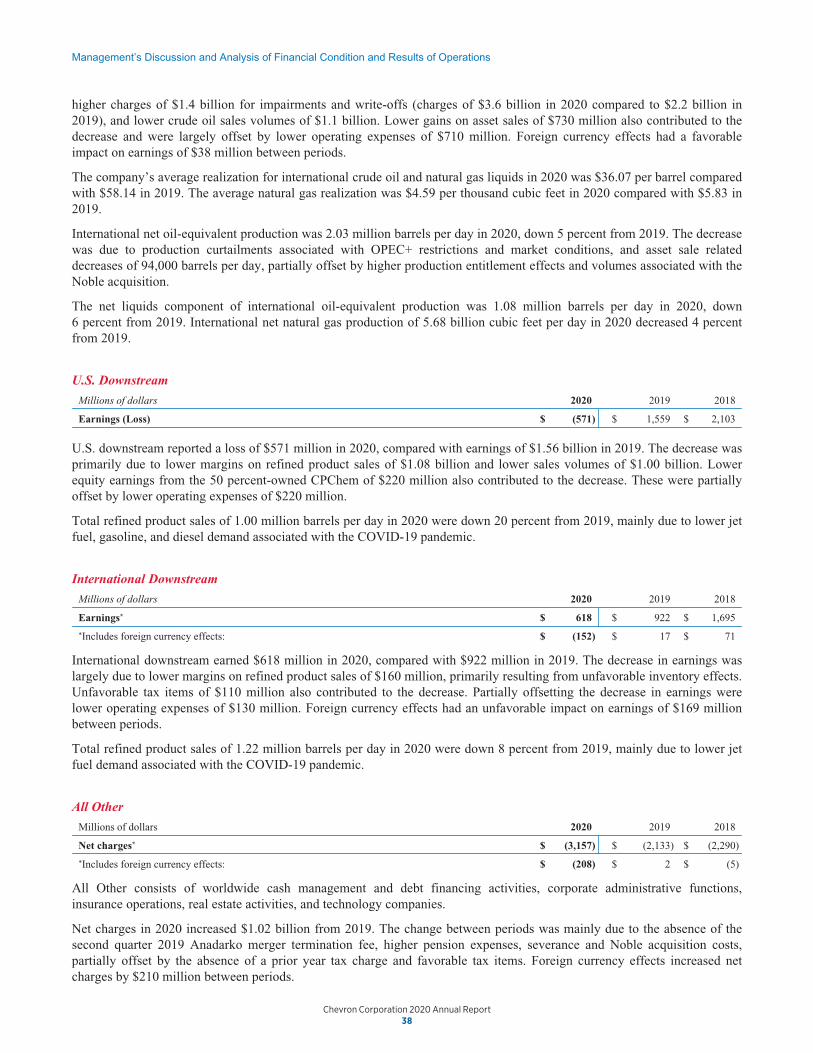
38
Management’s Discussion and Analysis of Financial Condition and Results of Operations
Consolidated Statement of Income
Comparative amounts for certain income statement categories are shown below. A discussion of variances between 2019 and2018 can be found in the “Consolidated Statement of Income” section on pages 34 through 36 of the company’s 2019 AnnualReport on Form 10-K.
Millions of dollars 2020 2019 2018
Sales and other operating revenues $ 94,471 $ 139,865 $ 158,902
Sales and other operating revenues decreased in 2020 mainly due to lower refined product, crude oil and natural gas prices,and lower refined product volumes.
Millions of dollars 2020 2019 2018
Income (loss) from equity affiliates $ (472) $ 3,968 $ 6,327
Income from equity affiliates decreased in 2020 mainly due to the full impairment of Petropiar and Petroboscan in Venezuelaand lower upstream-related earnings from Tengizchevroil in Kazakhstan.
Refer to Note 13, beginning on page 77, for a discussion of Chevron’s investments in affiliated companies.
Millions of dollars 2020 2019 2018
Other income $ 693 $ 2,683 $ 1,110
Other income decreased in 2020 mainly due to the absence of the receipt of the 2019 Anadarko merger termination fee, lowergains on asset sales and unfavorable swings in foreign currency effects.
Millions of dollars 2020 2019 2018
Purchased crude oil and products $ 50,488 $ 80,113 $ 94,578
Crude oil and product purchases decreased $29.6 billion in 2020, primarily due to lower crude oil and refined product pricesand lower refined product and crude oil volumes.
Millions of dollars 2020 2019 2018
Operating, selling, general and administrative expenses $ 24,536 $ 25,528 $ 24,382
Operating, selling, general and administrative expenses decreased $1.0 billion in 2020. The decrease is primarily due tolower services and fees, expenses for non-operated upstream properties, materials and supplies expense and lowertransportation expense, partially offset by higher severance costs.
Millions of dollars 2020 2019 2018
Exploration expense $ 1,537 $ 770 $ 1,210
Exploration expenses in 2020 increased primarily due to higher charges for well write-offs.
Millions of dollars 2020 2019 2018
Depreciation, depletion and amortization $ 19,508 $ 29,218 $ 19,419
Depreciation, depletion and amortization expenses decreased in 2020 primarily due to lower impairments.
Millions of dollars 2020 2019 2018
Taxes other than on income $ 4,499 $ 4,136 $ 4,867
Taxes other than on income increased in 2020 primarily due to higher regulatory expenses and property taxes, partially offsetby lower taxes on production, payroll tax and sales and use tax.
Millions of dollars 2020 2019 2018
Interest and debt expense $ 697 $ 798 $ 748
Interest and debt expenses decreased in 2020 mainly due to lower interest rates, partially offset by higher debt balances.
Millions of dollars 2020 2019 2018
Other components of net periodic benefit costs $ 880 $ 417 $ 560
Other components of net periodic benefit costs increased in 2020 primarily due to higher pension settlement costs.
39
173155_Annual_Report_10-K.indd 38173155_Annual_Report_10-K.indd 38 3/5/21 6:04 PM3/5/21 6:04 PM
Management’s Discussion and Analysis of Financial Condition and Results of Operations
higher charges of $1.4 billion for impairments and write-offs (charges of $3.6 billion in 2020 compared to $2.2 billion in 2019), and lower crude oil sales volumes of $1.1 billion. Lower gains on asset sales of $730 million also contributed to the decrease and were largely offset by lower operating expenses of $710 million. Foreign currency effects had a favorable impact on earnings of $38 million between periods.
The company’s average realization for international crude oil and natural gas liquids in 2020 was $36.07 per barrel compared with $58.14 in 2019. The average natural gas realization was $4.59 per thousand cubic feet in 2020 compared with $5.83 in 2019.
International net oil-equivalent production was 2.03 million barrels per day in 2020, down 5 percent from 2019. The decrease was due to production curtailments associated with OPEC+ restrictions and market conditions, and asset sale related decreases of 94,000 barrels per day, partially offset by higher production entitlement effects and volumes associated with the Noble acquisition.
The net liquids component of international oil-equivalent production was 1.08 million barrels per day in 2020, down 6 percent from 2019. International net natural gas production of 5.68 billion cubic feet per day in 2020 decreased 4 percent from 2019.
U.S. Downstream
Millions of dollars 2020 2019 2018
Earnings (Loss) $ (571) $ 1,559 $ 2,103
U.S. downstream reported a loss of $571 million in 2020, compared with earnings of $1.56 billion in 2019. The decrease was primarily due to lower margins on refined product sales of $1.08 billion and lower sales volumes of $1.00 billion. Lower equity earnings from the 50 percent-owned CPChem of $220 million also contributed to the decrease. These were partially offset by lower operating expenses of $220 million.
Total refined product sales of 1.00 million barrels per day in 2020 were down 20 percent from 2019, mainly due to lower jet fuel, gasoline, and diesel demand associated with the COVID-19 pandemic.
International Downstream
Millions of dollars 2020 2019 2018
Earnings* $ 618 $ 922 $ 1,695
*Includes foreign currency effects: $ (152) $ 17 $ 71
International downstream earned $618 million in 2020, compared with $922 million in 2019. The decrease in earnings was largely due to lower margins on refined product sales of $160 million, primarily resulting from unfavorable inventory effects. Unfavorable tax items of $110 million also contributed to the decrease. Partially offsetting the decrease in earnings were lower operating expenses of $130 million. Foreign currency effects had an unfavorable impact on earnings of $169 million between periods.
Total refined product sales of 1.22 million barrels per day in 2020 were down 8 percent from 2019, mainly due to lower jet fuel demand associated with the COVID-19 pandemic.
All Other
Millions of dollars 2020 2019 2018
Net charges* $ (3,157) $ (2,133) $ (2,290)
*Includes foreign currency effects: $ (208) $ 2 $ (5)
All Other consists of worldwide cash management and debt financing activities, corporate administrative functions, insurance operations, real estate activities, and technology companies.
Net charges in 2020 increased $1.02 billion from 2019. The change between periods was mainly due to the absence of the second quarter 2019 Anadarko merger termination fee, higher pension expenses, severance and Noble acquisition costs, partially offset by the absence of a prior year tax charge and favorable tax items. Foreign currency effects increased net charges by $210 million between periods.
Chevron Corporation 2020 Annual Report 38

Management’s Discussion and Analysis of Financial Condition and Results of Operations
higher charges of $1.4 billion for impairments and write-offs (charges of $3.6 billion in 2020 compared to $2.2 billion in2019), and lower crude oil sales volumes of $1.1 billion. Lower gains on asset sales of $730 million also contributed to thedecrease and were largely offset by lower operating expenses of $710 million. Foreign currency effects had a favorableimpact on earnings of $38 million between periods.
The company’s average realization for international crude oil and natural gas liquids in 2020 was $36.07 per barrel comparedwith $58.14 in 2019. The average natural gas realization was $4.59 per thousand cubic feet in 2020 compared with $5.83 in2019.
International net oil-equivalent production was 2.03 million barrels per day in 2020, down 5 percent from 2019. The decreasewas due to production curtailments associated with OPEC+ restrictions and market conditions, and asset sale relateddecreases of 94,000 barrels per day, partially offset by higher production entitlement effects and volumes associated with theNoble acquisition.
The net liquids component of international oil-equivalent production was 1.08 million barrels per day in 2020, down6 percent from 2019. International net natural gas production of 5.68 billion cubic feet per day in 2020 decreased 4 percentfrom 2019.
U.S. Downstream
Millions of dollars 2020 2019 2018
Earnings (Loss) $ (571) $ 1,559 $ 2,103
U.S. downstream reported a loss of $571 million in 2020, compared with earnings of $1.56 billion in 2019. The decrease wasprimarily due to lower margins on refined product sales of $1.08 billion and lower sales volumes of $1.00 billion. Lowerequity earnings from the 50 percent-owned CPChem of $220 million also contributed to the decrease. These were partiallyoffset by lower operating expenses of $220 million.
Total refined product sales of 1.00 million barrels per day in 2020 were down 20 percent from 2019, mainly due to lower jetfuel, gasoline, and diesel demand associated with the COVID-19 pandemic.
International Downstream
Millions of dollars 2020 2019 2018
Earnings* $ 618 $ 922 $ 1,695
*Includes foreign currency effects: $ (152) $ 17 $ 71
International downstream earned $618 million in 2020, compared with $922 million in 2019. The decrease in earnings waslargely due to lower margins on refined product sales of $160 million, primarily resulting from unfavorable inventory effects.Unfavorable tax items of $110 million also contributed to the decrease. Partially offsetting the decrease in earnings werelower operating expenses of $130 million. Foreign currency effects had an unfavorable impact on earnings of $169 millionbetween periods.
Total refined product sales of 1.22 million barrels per day in 2020 were down 8 percent from 2019, mainly due to lower jetfuel demand associated with the COVID-19 pandemic.
All Other
Millions of dollars 2020 2019 2018
Net charges* $ (3,157) $ (2,133) $ (2,290)
*Includes foreign currency effects: $ (208) $ 2 $ (5)
All Other consists of worldwide cash management and debt financing activities, corporate administrative functions,insurance operations, real estate activities, and technology companies.
Net charges in 2020 increased $1.02 billion from 2019. The change between periods was mainly due to the absence of thesecond quarter 2019 Anadarko merger termination fee, higher pension expenses, severance and Noble acquisition costs,partially offset by the absence of a prior year tax charge and favorable tax items. Foreign currency effects increased netcharges by $210 million between periods.
38 39
173155_Annual_Report_10-K.indd 39173155_Annual_Report_10-K.indd 39 3/5/21 6:04 PM3/5/21 6:04 PM
Management’s Discussion and Analysis of Financial Condition and Results of Operations
Consolidated Statement of Income
Comparative amounts for certain income statement categories are shown below. A discussion of variances between 2019 and 2018 can be found in the “Consolidated Statement of Income” section on pages 34 through 36 of the company’s 2019 Annual Report on Form 10-K.
Millions of dollars 2020 2019 2018
Sales and other operating revenues $ 94,471 $ 139,865 $ 158,902
Sales and other operating revenues decreased in 2020 mainly due to lower refined product, crude oil and natural gas prices, and lower refined product volumes.
Millions of dollars 2020 2019 2018
Income (loss) from equity affiliates $ (472) $ 3,968 $ 6,327
Income from equity affiliates decreased in 2020 mainly due to the full impairment of Petropiar and Petroboscan in Venezuela and lower upstream-related earnings from Tengizchevroil in Kazakhstan.
Refer to Note 13, beginning on page 77, for a discussion of Chevron’s investments in affiliated companies.
Millions of dollars 2020 2019 2018
Other income $ 693 $ 2,683 $ 1,110
Other income decreased in 2020 mainly due to the absence of the receipt of the 2019 Anadarko merger termination fee, lower gains on asset sales and unfavorable swings in foreign currency effects.
Millions of dollars 2020 2019 2018
Purchased crude oil and products $ 50,488 $ 80,113 $ 94,578
Crude oil and product purchases decreased $29.6 billion in 2020, primarily due to lower crude oil and refined product prices and lower refined product and crude oil volumes.
Millions of dollars 2020 2019 2018
Operating, selling, general and administrative expenses $ 24,536 $ 25,528 $ 24,382
Operating, selling, general and administrative expenses decreased $1.0 billion in 2020. The decrease is primarily due to lower services and fees, expenses for non-operated upstream properties, materials and supplies expense and lower transportation expense, partially offset by higher severance costs.
Millions of dollars 2020 2019 2018
Exploration expense $ 1,537 $ 770 $ 1,210
Exploration expenses in 2020 increased primarily due to higher charges for well write-offs.
Millions of dollars 2020 2019 2018
Depreciation, depletion and amortization $ 19,508 $ 29,218 $ 19,419
Depreciation, depletion and amortization expenses decreased in 2020 primarily due to lower impairments.
Millions of dollars 2020 2019 2018
Taxes other than on income $ 4,499 $ 4,136 $ 4,867
Taxes other than on income increased in 2020 primarily due to higher regulatory expenses and property taxes, partially offset by lower taxes on production, payroll tax and sales and use tax.
Millions of dollars 2020 2019 2018
Interest and debt expense $ 697 $ 798 $ 748
Interest and debt expenses decreased in 2020 mainly due to lower interest rates, partially offset by higher debt balances.
Millions of dollars 2020 2019 2018
Other components of net periodic benefit costs $ 880 $ 417 $ 560
Other components of net periodic benefit costs increased in 2020 primarily due to higher pension settlement costs.
Chevron Corporation 2020 Annual Report 39

40
Management’s Discussion and Analysis of Financial Condition and Results of Operations
Selected Operating Data1,2
2020 2019 2018
U.S. UpstreamNet Crude Oil and Natural Gas Liquids Production (MBPD) 790 724 618Net Natural Gas Production (MMCFPD)3 1,607 1,225 1,034Net Oil-Equivalent Production (MBOEPD) 1,058 929 791Sales of Natural Gas (MMCFPD) 3,894 4,016 3,481Sales of Natural Gas Liquids (MBPD) 208 130 110Revenues from Net Production
Liquids ($/Bbl) $ 30.53 $ 48.54 $ 58.17Natural Gas ($/MCF) $ 0.98 $ 1.09 $ 1.86
International UpstreamNet Crude Oil and Natural Gas Liquids Production (MBPD)4 1,078 1,141 1,164Net Natural Gas Production (MMCFPD)3 5,683 5,932 5,855Net Oil-Equivalent Production (MBOEPD)4 2,025 2,129 2,139Sales of Natural Gas (MMCFPD) 5,634 5,869 5,604Sales of Natural Gas Liquids (MBPD) 46 34 34Revenues from Liftings
Liquids ($/Bbl) $ 36.07 $ 58.14 $ 64.25Natural Gas ($/MCF) $ 4.59 $ 5.83 $ 6.29
Worldwide UpstreamNet Oil-Equivalent Production (MBOEPD)4
United States 1,058 929 791International 2,025 2,129 2,139
Total 3,083 3,058 2,930U.S. DownstreamGasoline Sales (MBPD)5 581 667 627Other Refined Product Sales (MBPD) 422 583 591
Total Refined Product Sales (MBPD) 1,003 1,250 1,218Sales of Natural Gas Liquids (MBPD) 25 101 74Refinery Input (MBPD)6 793 947 905International DownstreamGasoline Sales (MBPD)5 264 289 336Other Refined Product Sales (MBPD) 957 1,038 1,101
Total Refined Product Sales (MBPD)7 1,221 1,327 1,437Sales of Natural Gas Liquids (MBPD) 74 72 62Refinery Input (MBPD)8 584 617 706
1 Includes company share of equity affiliates.2 MBPD – thousands of barrels per day; MMCFPD – millions of cubic feet per day; MBOEPD – thousands of barrels of oil-equivalents per day; Bbl – barrel; MCF –
thousands of cubic feet. Oil-equivalent gas (OEG) conversion ratio is 6,000 cubic feet of natural gas = 1 barrel of crude oil.3 Includes natural gas consumed in operations (MMCFPD):
United States 37 36 35International 566 602 584
4 Includes net production of synthetic oil:Canada 54 53 53Venezuela affiliate — 3 24
5 Includes branded and unbranded gasoline.6 In May 2019, the company acquired the Pasadena Refinery in Pasadena, Texas, which has an operable capacity of
110,000 barrels per day.7 Includes sales of affiliates (MBPD): 348 379 3738 In September 2018, the company sold its interest in the Cape Town Refinery in Cape Town, South Africa, which had an operable capacity of 110,000 barrels per day.
41
173155_Annual_Report_10-K.indd 40173155_Annual_Report_10-K.indd 40 3/5/21 6:04 PM3/5/21 6:04 PM
Management’s Discussion and Analysis of Financial Condition and Results of Operations
Millions of dollars 2020 2019 2018
Income tax expense (benefit) $ (1,892) $ 2,691 $ 5,715
The decrease in income tax expense in 2020 of $4.58 billion is due to the decrease in total income before tax for the company of $12.99 billion. The decrease in income before taxes for the company is primarily the result of lower crude oil prices partially offset by lower impairments and project write off charges.
U.S. income before tax decreased from a loss of $5.48 billion in 2019 to a loss of $5.70 billion in 2020. This decrease in earnings before tax was primarily driven by the effect of lower crude oil prices in the U.S. and the absence of the Anadarko merger fee, partially offset by lower impairment charges and higher production. The U.S. tax benefit increased from $1.17 billion in 2019 to $1.58 billion in 2020 primarily due to the increase in before-tax loss.
International income before tax decreased from $11.02 billion in 2019 to a loss of $1.75 billion in 2020. This decrease was primarily driven by the effect of lower crude oil and natural gas prices, lower production, higher impairments and other charges. The lower before-tax income primarily drove the $4.17 billion decrease in international income tax expense, from a charge of $3.86 billion in 2019 to a benefit of $308 million in 2020.
Refer also to the discussion of the effective income tax rate in Note 15 beginning on page 79.
Chevron Corporation 2020 Annual Report 40

Management’s Discussion and Analysis of Financial Condition and Results of Operations
Millions of dollars 2020 2019 2018
Income tax expense (benefit) $ (1,892) $ 2,691 $ 5,715
The decrease in income tax expense in 2020 of $4.58 billion is due to the decrease in total income before tax for the companyof $12.99 billion. The decrease in income before taxes for the company is primarily the result of lower crude oil pricespartially offset by lower impairments and project write off charges.
U.S. income before tax decreased from a loss of $5.48 billion in 2019 to a loss of $5.70 billion in 2020. This decrease inearnings before tax was primarily driven by the effect of lower crude oil prices in the U.S. and the absence of the Anadarkomerger fee, partially offset by lower impairment charges and higher production. The U.S. tax benefit increased from$1.17 billion in 2019 to $1.58 billion in 2020 primarily due to the increase in before-tax loss.
International income before tax decreased from $11.02 billion in 2019 to a loss of $1.75 billion in 2020. This decrease wasprimarily driven by the effect of lower crude oil and natural gas prices, lower production, higher impairments and othercharges. The lower before-tax income primarily drove the $4.17 billion decrease in international income tax expense, from acharge of $3.86 billion in 2019 to a benefit of $308 million in 2020.
Refer also to the discussion of the effective income tax rate in Note 15 beginning on page 79.
40 41
173155_Annual_Report_10-K.indd 41173155_Annual_Report_10-K.indd 41 3/5/21 6:04 PM3/5/21 6:04 PM
Management’s Discussion and Analysis of Financial Condition and Results of Operations
Selected Operating Data1,2
2020 2019 2018
U.S. Upstream Net Crude Oil and Natural Gas Liquids Production (MBPD) 790 724 618 Net Natural Gas Production (MMCFPD)3 1,607 1,225 1,034 Net Oil-Equivalent Production (MBOEPD) 1,058 929 791 Sales of Natural Gas (MMCFPD) 3,894 4,016 3,481 Sales of Natural Gas Liquids (MBPD) 208 130 110 Revenues from Net Production
Liquids ($/Bbl) $ 30.53 $ 48.54 $ 58.17 Natural Gas ($/MCF) $ 0.98 $ 1.09 $ 1.86
International Upstream Net Crude Oil and Natural Gas Liquids Production (MBPD)4 1,078 1,141 1,164 Net Natural Gas Production (MMCFPD)3 5,683 5,932 5,855 Net Oil-Equivalent Production (MBOEPD)4 2,025 2,129 2,139 Sales of Natural Gas (MMCFPD) 5,634 5,869 5,604 Sales of Natural Gas Liquids (MBPD) 46 34 34 Revenues from Liftings
Liquids ($/Bbl) $ 36.07 $ 58.14 $ 64.25 Natural Gas ($/MCF) $ 4.59 $ 5.83 $ 6.29
Worldwide Upstream Net Oil-Equivalent Production (MBOEPD)4
United States 1,058 929 791 International 2,025 2,129 2,139
Total 3,083 3,058 2,930 U.S. Downstream Gasoline Sales (MBPD)5 581 667 627 Other Refined Product Sales (MBPD) 422 583 591
Total Refined Product Sales (MBPD) 1,003 1,250 1,218 Sales of Natural Gas Liquids (MBPD) 25 101 74 Refinery Input (MBPD)6 793 947 905 International Downstream Gasoline Sales (MBPD)5 264 289 336 Other Refined Product Sales (MBPD) 957 1,038 1,101
Total Refined Product Sales (MBPD)7 1,221 1,327 1,437 Sales of Natural Gas Liquids (MBPD) 74 72 62 Refinery Input (MBPD)8 584 617 706
1 Includes company share of equity affiliates. 2 MBPD – thousands of barrels per day; MMCFPD – millions of cubic feet per day; MBOEPD – thousands of barrels of oil-equivalents per day; Bbl – barrel; MCF –
thousands of cubic feet. Oil-equivalent gas (OEG) conversion ratio is 6,000 cubic feet of natural gas = 1 barrel of crude oil. 3 Includes natural gas consumed in operations (MMCFPD):
United States 37 36 35 International 566 602 584
4 Includes net production of synthetic oil: Canada 54 53 53 Venezuela affiliate — 3 24
5 Includes branded and unbranded gasoline. 6 In May 2019, the company acquired the Pasadena Refinery in Pasadena, Texas, which has an operable capacity of
110,000 barrels per day. 7 Includes sales of affiliates (MBPD): 348 379 373 8 In September 2018, the company sold its interest in the Cape Town Refinery in Cape Town, South Africa, which had an operable capacity of 110,000 barrels per day.
Chevron Corporation 2020 Annual Report 41

42
Management’s Discussion and Analysis of Financial Condition and Results of Operations
The major debt rating agencies routinely evaluate the company’s debt, and the company’s cost of borrowing can increase ordecrease depending on these debt ratings. The company has outstanding public bonds issued by Chevron Corporation,CUSA, Noble and Texaco Capital Inc. Most of these securities are the obligations of, or guaranteed by, Chevron Corporationand are rated AA- by Standard and Poor’s Corporation and Aa2 by Moody’s Investors Service. The company’s U.S.commercial paper is rated A-1+ by Standard and Poor’s and P-1 by Moody’s. All of these ratings denote high-quality,investment-grade securities.
The company’s future debt level is dependent primarily on results of operations, cash that may be generated from assetdispositions, the capital program, lending commitments to affiliates and shareholder distributions. Based on its high-qualitydebt ratings, the company believes that it has substantial borrowing capacity to meet unanticipated cash requirements. Duringextended periods of low prices for crude oil and natural gas and narrow margins for refined products and commoditychemicals, the company has the flexibility to modify capital spending plans and discontinue or curtail the stock repurchaseprogram to provide flexibility to continue paying the common stock dividend and also remain committed to retaining thecompany’s high-quality debt ratings.
Committed Credit Facilities Information related to committed credit facilities is included in Note 17, Short-Term Debt, onpage 83.
Summarized Financial Information for Guarantee of Securities of Subsidiaries In August 2020, long-term public bondswere issued by CUSA and fully and unconditionally guaranteed on an unsecured basis by Chevron Corporation (together the“Obligor Group”). In March 2020, the U.S. Securities and Exchange Commission (SEC) issued a final rule that amended thedisclosure requirements with respect to certain guaranteed securities registered or being registered in Rule 3-10 of RegulationS-X and adopted new Rule 13-01 of Regulation S-X. These amendments were effective January 4, 2021. Accordingly, asdisclosed in the tables below, summary financial information is presented for Chevron Corporation, as Guarantor, excludingits consolidated subsidiaries, and CUSA, as the issuer, excluding its consolidated subsidiaries. The summary financialinformation of the Obligor Group is presented on a combined basis and transactions between the combined entities have beeneliminated. Financial information for non-guarantor entities has been excluded.
Year EndedDecember 31, 2020
Year EndedDecember 31, 2019
(Millions of dollars) (unaudited)
Sales and other operating revenues $ 49,636 $ 82,206Sales and other operating revenues – related party 17,044 24,336Total costs and other deductions 57,575 87,287Total costs and other deductions – related party 14,052 22,632Net income (loss) $ (1,610) $ 2,173
At December 31,2020
At December 31,2019
(Millions of dollars) (unaudited)
Current assets $ 9,196 $ 10,180Current assets – related party 5,719 952Other assets 48,993 50,595Current liabilities 20,965 25,187Current liabilities – related party 55,273 46,237Other liabilities 34,983 25,622
Total net equity (deficit) $ (47,313) $ (35,319)
Common Stock Repurchase Program On February 1, 2019, the company announced that the Board of Directors authorized anew stock repurchase program with a maximum dollar limit of $25 billion and no set term limits. As of December 31, 2020,the company had purchased a total of 48.6 million shares for $5.5 billion, resulting in $19.5 billion remaining under theprogram authorized in February 2019. On March 24, 2020, the company announced the suspension of the stock repurchaseprogram in response to depressed market conditions following the global outbreak of the COVID-19 pandemic. No shareswere purchased under the program after this announcement.
Repurchases may be made from time to time in the open market, by block purchases, in privately negotiated transactions orin such other manner as determined by the company. The timing of the repurchases and the actual amount repurchased willdepend on a variety of factors, including the market price of the company’s shares, general market and economic
43
173155_Annual_Report_10-K.indd 42173155_Annual_Report_10-K.indd 42 3/5/21 6:04 PM3/5/21 6:04 PM
Management’s Discussion and Analysis of Financial Condition and Results of Operations
Liquidity and Capital Resources
Sources and uses of cash
The strength of the company’s balance sheet enabled it to fund any timing differences throughout the year between cash inflows and outflows.
Cash, Cash Equivalents, Marketable Securities and Time Deposits Total balances were $5.6 billion and $5.7 billion at December 31, 2020 and 2019, respectively. Cash provided by operating activities in 2020 was $10.6 billion, compared to $27.3 billion in 2019, primarily due to lower crude oil prices. Cash provided by operating activities was net of contributions to employee pension plans of approximately $1.2 billion in 2020 and $1.4 billion in 2019. Cash provided by investing activities included proceeds and deposits related to asset sales of $2.9 billion in 2020 and $2.8 billion in 2019.
Restricted cash of $1.1 billion and $1.2 billion at December 31, 2020 and 2019, respectively, was held in cash and short-term marketable securities and recorded as “Deferred charges and other assets” and “Prepaid expenses and other current assets” on the Consolidated Balance Sheet. These amounts are generally associated with upstream decommissioning activities, tax payments, funds held in escrow for tax-deferred exchanges and refundable deposits related to pending asset sales.
Dividends Dividends paid to common stockholders were $9.7 billion in 2020 and $9.0 billion in 2019.
Debt and Finance Lease Liabilities Total debt and finance lease liabilities were $44.3 billion at December 31, 2020, up from $27.0 billion at year-end 2019.
The $17.3 billion increase in total debt and finance lease liabilities during 2020 was primarily due to the company’s issuance of long-term public bonds of $8.0 billion in May 2020 and $4.0 billion in August 2020, and the assumption of debt with a fair value of $9.4 billion as part of the transaction to acquire Noble in October 2020. In January 2021, Chevron U.S.A. Inc. (CUSA) issued bonds, guaranteed by Chevron Corporation, in exchange for the Noble debt. More information on bond issuances is included in Note 18 on page 84. These amounts were partially offset by repayment of long-term notes that matured in 2020. The company’s debt and finance lease liabilities due within one year, consisting primarily of commercial paper, redeemable long-term obligations and the current portion of long-term debt, totaled $11.4 billion at December 31, 2020, compared with $13.0 billion at year-end 2019. Of these amounts, $9.825 billion and $9.75 billion were reclassified to long-term debt at the end of 2020 and 2019, respectively.
At year-end 2020, settlement of these obligations was not expected to require the use of working capital in 2021, as the company had the intent and the ability, as evidenced by committed credit facilities, to refinance them on a long-term basis.
The company has an automatic shelf registration statement that expires in August 2023 for an unspecified amount of nonconvertible debt securities issued by Chevron Corporation or CUSA.
Chevron Corporation 2020 Annual Report 42
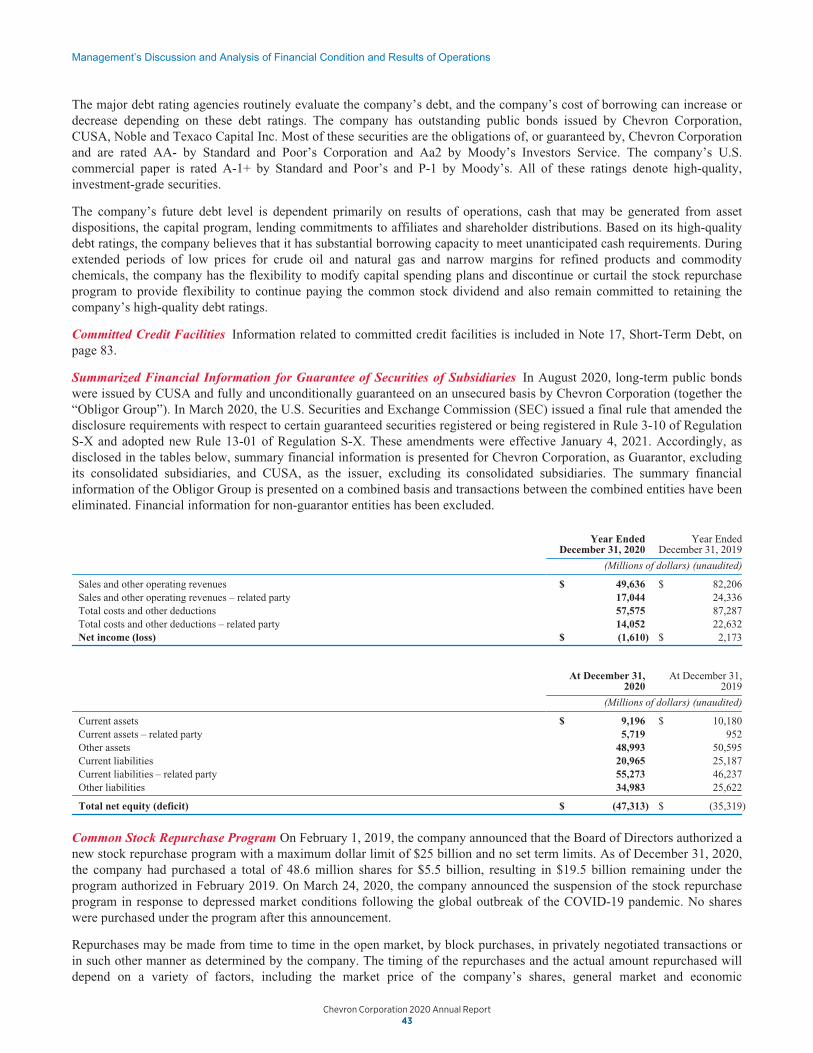
Management’s Discussion and Analysis of Financial Condition and Results of Operations
Liquidity and Capital Resources
Sources and uses of cash
The strength of the company’s balance sheet enabled it to fund any timing differences throughout the year between cashinflows and outflows.
Cash, Cash Equivalents, Marketable Securities and Time Deposits Total balances were $5.6 billion and $5.7 billion atDecember 31, 2020 and 2019, respectively. Cash provided by operating activities in 2020 was $10.6 billion, compared to$27.3 billion in 2019, primarily due to lower crude oil prices. Cash provided by operating activities was net of contributionsto employee pension plans of approximately $1.2 billion in 2020 and $1.4 billion in 2019. Cash provided by investingactivities included proceeds and deposits related to asset sales of $2.9 billion in 2020 and $2.8 billion in 2019.
Restricted cash of $1.1 billion and $1.2 billion at December 31, 2020 and 2019, respectively, was held in cash and short-termmarketable securities and recorded as “Deferred charges and other assets” and “Prepaid expenses and other current assets” onthe Consolidated Balance Sheet. These amounts are generally associated with upstream decommissioning activities, taxpayments, funds held in escrow for tax-deferred exchanges and refundable deposits related to pending asset sales.
Dividends Dividends paid to common stockholders were $9.7 billion in 2020 and $9.0 billion in 2019.
Debt and Finance Lease Liabilities Total debt and finance lease liabilities were $44.3 billion at December 31, 2020, upfrom $27.0 billion at year-end 2019.
The $17.3 billion increase in total debt and finance lease liabilities during 2020 was primarily due to the company’s issuanceof long-term public bonds of $8.0 billion in May 2020 and $4.0 billion in August 2020, and the assumption of debt with afair value of $9.4 billion as part of the transaction to acquire Noble in October 2020. In January 2021, Chevron U.S.A. Inc.(CUSA) issued bonds, guaranteed by Chevron Corporation, in exchange for the Noble debt. More information on bondissuances is included in Note 18 on page 84. These amounts were partially offset by repayment of long-term notes thatmatured in 2020. The company’s debt and finance lease liabilities due within one year, consisting primarily of commercialpaper, redeemable long-term obligations and the current portion of long-term debt, totaled $11.4 billion at December 31,2020, compared with $13.0 billion at year-end 2019. Of these amounts, $9.825 billion and $9.75 billion were reclassified tolong-term debt at the end of 2020 and 2019, respectively.
At year-end 2020, settlement of these obligations was not expected to require the use of working capital in 2021, as thecompany had the intent and the ability, as evidenced by committed credit facilities, to refinance them on a long-term basis.
The company has an automatic shelf registration statement that expires in August 2023 for an unspecified amount ofnonconvertible debt securities issued by Chevron Corporation or CUSA.
42 43
173155_Annual_Report_10-K.indd 43173155_Annual_Report_10-K.indd 43 3/5/21 6:04 PM3/5/21 6:04 PM
Management’s Discussion and Analysis of Financial Condition and Results of Operations
The major debt rating agencies routinely evaluate the company’s debt, and the company’s cost of borrowing can increase or decrease depending on these debt ratings. The company has outstanding public bonds issued by Chevron Corporation, CUSA, Noble and Texaco Capital Inc. Most of these securities are the obligations of, or guaranteed by, Chevron Corporation and are rated AA- by Standard and Poor’s Corporation and Aa2 by Moody’s Investors Service. The company’s U.S. commercial paper is rated A-1+ by Standard and Poor’s and P-1 by Moody’s. All of these ratings denote high-quality, investment-grade securities.
The company’s future debt level is dependent primarily on results of operations, cash that may be generated from asset dispositions, the capital program, lending commitments to affiliates and shareholder distributions. Based on its high-quality debt ratings, the company believes that it has substantial borrowing capacity to meet unanticipated cash requirements. During extended periods of low prices for crude oil and natural gas and narrow margins for refined products and commodity chemicals, the company has the flexibility to modify capital spending plans and discontinue or curtail the stock repurchase program to provide flexibility to continue paying the common stock dividend and also remain committed to retaining the company’s high-quality debt ratings.
Committed Credit Facilities Information related to committed credit facilities is included in Note 17, Short-Term Debt, on page 83.
Summarized Financial Information for Guarantee of Securities of Subsidiaries In August 2020, long-term public bonds were issued by CUSA and fully and unconditionally guaranteed on an unsecured basis by Chevron Corporation (together the “Obligor Group”). In March 2020, the U.S. Securities and Exchange Commission (SEC) issued a final rule that amended the disclosure requirements with respect to certain guaranteed securities registered or being registered in Rule 3-10 of Regulation S-X and adopted new Rule 13-01 of Regulation S-X. These amendments were effective January 4, 2021. Accordingly, as disclosed in the tables below, summary financial information is presented for Chevron Corporation, as Guarantor, excluding its consolidated subsidiaries, and CUSA, as the issuer, excluding its consolidated subsidiaries. The summary financial information of the Obligor Group is presented on a combined basis and transactions between the combined entities have been eliminated. Financial information for non-guarantor entities has been excluded.
Year Ended December 31, 2020
Year Ended December 31, 2019
(Millions of dollars) (unaudited)
Sales and other operating revenues $ 49,636 $ 82,206 Sales and other operating revenues – related party 17,044 24,336 Total costs and other deductions 57,575 87,287 Total costs and other deductions – related party 14,052 22,632 Net income (loss) $ (1,610) $ 2,173
At December 31, 2020
At December 31, 2019
(Millions of dollars) (unaudited)
Current assets $ 9,196 $ 10,180 Current assets – related party 5,719 952 Other assets 48,993 50,595 Current liabilities 20,965 25,187 Current liabilities – related party 55,273 46,237 Other liabilities 34,983 25,622
Total net equity (deficit) $ (47,313) $ (35,319)
Common Stock Repurchase Program On February 1, 2019, the company announced that the Board of Directors authorized a new stock repurchase program with a maximum dollar limit of $25 billion and no set term limits. As of December 31, 2020, the company had purchased a total of 48.6 million shares for $5.5 billion, resulting in $19.5 billion remaining under the program authorized in February 2019. On March 24, 2020, the company announced the suspension of the stock repurchase program in response to depressed market conditions following the global outbreak of the COVID-19 pandemic. No shares were purchased under the program after this announcement.
Repurchases may be made from time to time in the open market, by block purchases, in privately negotiated transactions or in such other manner as determined by the company. The timing of the repurchases and the actual amount repurchased will depend on a variety of factors, including the market price of the company’s shares, general market and economic
Chevron Corporation 2020 Annual Report 43

44
Management’s Discussion and Analysis of Financial Condition and Results of Operations
Financial Ratios and Metrics
The following represent several metrics the company believes are useful measures to monitor the financial health of thecompany and its performance over time:
Current Ratio Current assets divided by current liabilities, which indicates the company’s ability to repay its short-termliabilities with short-term assets. The current ratio in all periods was adversely affected by the fact that Chevron’s inventoriesare valued on a last-in, first-out basis. At year-end 2020, the book value of inventory was lower than replacement costs,based on average acquisition costs during the year, by approximately $2.7 billion.
At December 31
Millions of dollars 2020 2019 2018
Current assets $ 26,078 $ 28,329 $ 34,021
Current liabilities 22,183 26,530 27,171
Current Ratio 1.2 1.1 1.3
Interest Coverage Ratio Income before income tax expense, plus interest and debt expense and amortization of capitalizedinterest, less net income attributable to noncontrolling interests, divided by before-tax interest costs. This ratio indicates thecompany’s ability to pay interest on outstanding debt. The company’s interest coverage ratio in 2020 was lower than 2019due to lower income.
Year ended December 31
Millions of dollars 2020 2019 2018
Income (Loss) Before Income Tax Expense $ (7,453) $ 5,536 $ 20,575
Plus: Interest and debt expense 697 798 748
Plus: Before-tax amortization of capitalized interest 205 240 280
Less: Net income attributable to noncontrolling interests (18) (79) 36
Subtotal for calculation (6,533) 6,653 21,567
Total financing interest and debt costs $ 735 $ 817 $ 921
Interest Coverage Ratio (8.9) 8.1 23.4
Free Cash Flow The cash provided by operating activities less cash capital expenditures, which represents the cash availableto creditors and investors after investing in the business.
Year ended December 31
Millions of dollars 2020 2019 2018
Net cash provided by operating activities $ 10,577 $ 27,314 $ 30,618
Less: Capital expenditures 8,922 14,116 13,792
Free Cash Flow $ 1,655 $ 13,198 $ 16,826
Debt Ratio Total debt as a percentage of total debt plus Chevron Corporation Stockholders’ Equity, which indicates thecompany’s leverage. The company’s debt ratio was 25.2 percent at year-end 2020, compared with 15.8 percent at year-end2019.
At December 31
Millions of dollars 2020 2019 2018
Short-term debt $ 1,548 $ 3,282 $ 5,726
Long-term debt 42,767 23,691 28,733
Total debt 44,315 26,973 34,459
Total Chevron Corporation Stockholders’ Equity 131,688 144,213 154,554
Total debt plus total Chevron Corporation Stockholders’ Equity $ 176,003 $ 171,186 $ 189,013
Debt Ratio 25.2 % 15.8 % 18.2 %
45
173155_Annual_Report_10-K.indd 44173155_Annual_Report_10-K.indd 44 3/5/21 6:04 PM3/5/21 6:04 PM
Management’s Discussion and Analysis of Financial Condition and Results of Operations
conditions, and other factors. The stock repurchase program does not obligate the company to acquire any particular amount of common stock, and it may be suspended or discontinued at any time.
Capital and Exploratory Expenditures
Capital and exploratory expenditures by business segment for 2020, 2019 and 2018 are as follows:
2020 2019 2018
Millions of dollars U.S. Int’l. Total U.S. Int’l. Total U.S. Int’l. Total
Upstream $ 5,130 $ 5,784 $10,914 $ 8,197 $ 9,627 $17,824 $ 7,128 $ 10,529 $ 17,657 Downstream 1,021 1,325 2,346 1,868 920 2,788 1,582 611 2,193 All Other 226 13 239 365 17 382 243 13 256
Total $ 6,377 $ 7,122 $13,499 $ 10,430 $ 10,564 $20,994 $ 8,953 $ 11,153 $ 20,106
Total, Excluding Equity in Affiliates $ 6,053 $ 3,464 $ 9,517 $ 10,062 $ 4,820 $14,882 $ 8,651 $ 5,739 $ 14,390
Total reported expenditures for 2020 were $13.5 billion, including $4.0 billion for the company’s share of equity-affiliate expenditures, which did not require cash outlays by the company. The acquisition of Noble is not included in the company’s capital and exploratory expenditures. For more information on the Noble acquisition, see page 96 in Note 29. In 2019, expenditures were $21.0 billion, including the company’s share of affiliates’ expenditures of $6.1 billion.
Of the $13.5 billion of expenditures in 2020, 81 percent, or $10.9 billion, related to upstream activities. Approximately 85 percent was expended for upstream operations in 2019. International upstream accounted for 53 percent of the worldwide upstream investment in 2020 and 54 percent in 2019.
The company estimates that 2021 organic capital and exploratory expenditures will be $14 billion, including $4.2 billion of spending by affiliates. This is in line with 2020 expenditures, and reflects a robust portfolio of upstream and downstream investments, highlighted by the FGP/WPMP project at the Tengiz field in Kazakhstan and the company’s Permian Basin position. In the upstream business, approximately $6.5 billion is allocated to currently producing assets, including about $2.0 billion for Permian unconventional development. Approximately $3.5 billion of the upstream program is planned for major capital projects underway, of which about 75 percent is associated with FGP/WPMP at the Tengiz field in Kazakhstan. Additionally, $1.5 billion is allocated to exploration, early stage development projects, and midstream activities. The company monitors crude oil market conditions and is able to adjust future capital outlays should oil price conditions deteriorate.
Worldwide downstream spending in 2021 is estimated to be $2.1 billion, with $1.2 billion estimated for projects in the United States.
Investments in technology businesses and other corporate operations in 2021 are budgeted at $0.4 billion.
Noncontrolling Interests The company had noncontrolling interests of $1.0 billion at December 31, 2020 and $1.0 billion at December 31, 2019. Distributions to noncontrolling interests totaled $24 million and $18 million in 2020 and 2019, respectively. Included within noncontrolling interests for 2020 is $120 million of redeemable noncontrolling interest associated with Noble Midstream.
Pension Obligations Information related to pension plan contributions is included beginning on page 87 in Note 21, Employee Benefit Plans, under the heading “Cash Contributions and Benefit Payments.”
Chevron Corporation 2020 Annual Report 44

Management’s Discussion and Analysis of Financial Condition and Results of Operations
conditions, and other factors. The stock repurchase program does not obligate the company to acquire any particular amountof common stock, and it may be suspended or discontinued at any time.
Capital and Exploratory Expenditures
Capital and exploratory expenditures by business segment for 2020, 2019 and 2018 are as follows:
2020 2019 2018
Millions of dollars U.S. Int’l. Total U.S. Int’l. Total U.S. Int’l. Total
Upstream $ 5,130 $ 5,784 $10,914 $ 8,197 $ 9,627 $17,824 $ 7,128 $ 10,529 $17,657Downstream 1,021 1,325 2,346 1,868 920 2,788 1,582 611 2,193All Other 226 13 239 365 17 382 243 13 256
Total $ 6,377 $ 7,122 $13,499 $ 10,430 $ 10,564 $20,994 $ 8,953 $ 11,153 $20,106
Total, Excluding Equity in Affiliates $ 6,053 $ 3,464 $ 9,517 $ 10,062 $ 4,820 $14,882 $ 8,651 $ 5,739 $14,390
Total reported expenditures for 2020 were $13.5 billion, including $4.0 billion for the company’s share of equity-affiliateexpenditures, which did not require cash outlays by the company. The acquisition of Noble is not included in the company’scapital and exploratory expenditures. For more information on the Noble acquisition, see page 96 in Note 29. In 2019,expenditures were $21.0 billion, including the company’s share of affiliates’ expenditures of $6.1 billion.
Of the $13.5 billion of expenditures in 2020, 81 percent, or $10.9 billion, related to upstream activities. Approximately85 percent was expended for upstream operations in 2019. International upstream accounted for 53 percent of the worldwideupstream investment in 2020 and 54 percent in 2019.
The company estimates that 2021 organic capital and exploratory expenditures will be $14 billion, including $4.2 billion ofspending by affiliates. This is in line with 2020 expenditures, and reflects a robust portfolio of upstream and downstreaminvestments, highlighted by the FGP/WPMP project at the Tengiz field in Kazakhstan and the company’s Permian Basinposition. In the upstream business, approximately $6.5 billion is allocated to currently producing assets, including about$2.0 billion for Permian unconventional development. Approximately $3.5 billion of the upstream program is planned formajor capital projects underway, of which about 75 percent is associated with FGP/WPMP at the Tengiz field in Kazakhstan.Additionally, $1.5 billion is allocated to exploration, early stage development projects, and midstream activities. Thecompany monitors crude oil market conditions and is able to adjust future capital outlays should oil price conditionsdeteriorate.
Worldwide downstream spending in 2021 is estimated to be $2.1 billion, with $1.2 billion estimated for projects in theUnited States.
Investments in technology businesses and other corporate operations in 2021 are budgeted at $0.4 billion.
Noncontrolling Interests The company had noncontrolling interests of $1.0 billion at December 31, 2020 and $1.0 billion atDecember 31, 2019. Distributions to noncontrolling interests totaled $24 million and $18 million in 2020 and 2019,respectively. Included within noncontrolling interests for 2020 is $120 million of redeemable noncontrolling interestassociated with Noble Midstream.
Pension Obligations Information related to pension plan contributions is included beginning on page 87 in Note 21,Employee Benefit Plans, under the heading “Cash Contributions and Benefit Payments.”
44 45
173155_Annual_Report_10-K.indd 45173155_Annual_Report_10-K.indd 45 3/5/21 6:04 PM3/5/21 6:04 PM
Management’s Discussion and Analysis of Financial Condition and Results of Operations
Financial Ratios and Metrics
The following represent several metrics the company believes are useful measures to monitor the financial health of the company and its performance over time:
Current Ratio Current assets divided by current liabilities, which indicates the company’s ability to repay its short-term liabilities with short-term assets. The current ratio in all periods was adversely affected by the fact that Chevron’s inventories are valued on a last-in, first-out basis. At year-end 2020, the book value of inventory was lower than replacement costs, based on average acquisition costs during the year, by approximately $2.7 billion.
At December 31
Millions of dollars 2020 2019 2018
Current assets $ 26,078 $ 28,329 $ 34,021
Current liabilities 22,183 26,530 27,171
Current Ratio 1.2 1.1 1.3
Interest Coverage Ratio Income before income tax expense, plus interest and debt expense and amortization of capitalized interest, less net income attributable to noncontrolling interests, divided by before-tax interest costs. This ratio indicates the company’s ability to pay interest on outstanding debt. The company’s interest coverage ratio in 2020 was lower than 2019 due to lower income.
Year ended December 31
Millions of dollars 2020 2019 2018
Income (Loss) Before Income Tax Expense $ (7,453) $ 5,536 $ 20,575
Plus: Interest and debt expense 697 798 748
Plus: Before-tax amortization of capitalized interest 205 240 280
Less: Net income attributable to noncontrolling interests (18) (79) 36
Subtotal for calculation (6,533) 6,653 21,567
Total financing interest and debt costs $ 735 $ 817 $ 921
Interest Coverage Ratio (8.9) 8.1 23.4
Free Cash Flow The cash provided by operating activities less cash capital expenditures, which represents the cash available to creditors and investors after investing in the business.
Year ended December 31
Millions of dollars 2020 2019 2018
Net cash provided by operating activities $ 10,577 $ 27,314 $ 30,618
Less: Capital expenditures 8,922 14,116 13,792
Free Cash Flow $ 1,655 $ 13,198 $ 16,826
Debt Ratio Total debt as a percentage of total debt plus Chevron Corporation Stockholders’ Equity, which indicates the company’s leverage. The company’s debt ratio was 25.2 percent at year-end 2020, compared with 15.8 percent at year-end 2019.
At December 31
Millions of dollars 2020 2019 2018
Short-term debt $ 1,548 $ 3,282 $ 5,726
Long-term debt 42,767 23,691 28,733
Total debt 44,315 26,973 34,459
Total Chevron Corporation Stockholders’ Equity 131,688 144,213 154,554
Total debt plus total Chevron Corporation Stockholders’ Equity $ 176,003 $ 171,186 $ 189,013
Debt Ratio 25.2 % 15.8 % 18.2 %
Chevron Corporation 2020 Annual Report 45

46
Management’s Discussion and Analysis of Financial Condition and Results of Operations
Off-Balance-Sheet Arrangements, Contractual Obligations, Guarantees and Other Contingencies
Long-Term Unconditional Purchase Obligations and Commitments, Including Throughput and Take-or-PayAgreements Information related to these matters is included on page 92 in Note 22, Other Contingencies and Commitments.
The following table summarizes the company’s significant contractual obligations:
Payments Due by Period
Millions of dollars Total1 2021 2022-2023 2024-2025 After 2025
On Balance Sheet:2
Short-Term Debt3, 4 $ 1,362 $ 1,362 $ — $ — $ —
Long-Term Debt3, 4 40,732 — 21,848 5,650 13,234
Leases 5,119 1,580 1,394 702 1,443
Interest4 9,357 866 1,469 1,105 5,917
Off Balance Sheet:
Throughput and Take-or-Pay Agreements5 13,186 817 2,045 2,236 8,088
Other Unconditional Purchase Obligations5 1,464 211 468 489 296
1. Excludes contributions for pensions and other postretirement benefit plans and ARO. Information on employee benefit plans is contained in Note 21 beginning on page 87.Information on ARO’s is contained in Note 23 beginning on page 94
2. Does not include amounts related to the company’s income tax liabilities associated with uncertain tax positions. The company is unable to make reasonable estimates of theperiods in which such liabilities may become payable. The company does not expect settlement of such liabilities to have a material effect on its consolidated financial positionor liquidity in any single period.
3. $9.825 billion of short-term debt that the company expects to refinance is included in long-term debt. The repayment schedule above reflects the projected repayment of theentire amounts in the 2022–2023 period. The amounts represent only the principal balance.
4. Excludes finance lease liabilities.5. Does not include commodity purchase obligations that are not fixed or determinable. These obligations are generally monetized in a relatively short period of time through
sales transactions or similar agreements with third parties. Examples include obligations to purchase LNG, regasified natural gas and refinery products at indexed prices.
Direct Guarantees
Commitment Expiration by Period
Millions of dollars Total 2021 2022-2023 2024-2025 After 2025
Guarantee of nonconsolidated affiliate or joint-venture obligations $ 391 $ 176 $ 77 $ 78 $ 60
Additional information related to guarantees is included on page 92 in Note 22, Other Contingencies and Commitments.
Indemnifications Information related to indemnifications is included on page 92 in Note 22, Other Contingencies andCommitments.
Financial and Derivative Instrument Market Risk
The market risk associated with the company’s portfolio of financial and derivative instruments is discussed below. Theestimates of financial exposure to market risk do not represent the company’s projection of future market changes. The actualimpact of future market changes could differ materially due to factors discussed elsewhere in this report, including those setforth under the heading “Risk Factors” in Part I, Item 1A of the company’s Annual Report on Form 10-K.
Derivative Commodity Instruments Chevron is exposed to market risks related to the price volatility of crude oil, refinedproducts, natural gas, natural gas liquids, liquefied natural gas and refinery feedstocks. The company uses derivativecommodity instruments to manage these exposures on a portion of its activity, including firm commitments and anticipatedtransactions for the purchase, sale and storage of crude oil, refined products, natural gas, natural gas liquids, liquefied naturalgas and feedstock for company refineries. The company also uses derivative commodity instruments for limited tradingpurposes. The results of these activities were not material to the company’s financial position, results of operations or cashflows in 2020.
The company’s market exposure positions are monitored on a daily basis by an internal Risk Control group in accordancewith the company’s risk management policies. The company’s risk management practices and its compliance with policiesare reviewed by the Audit Committee of the company’s Board of Directors.
Derivatives beyond those designated as normal purchase and normal sale contracts are recorded at fair value on theConsolidated Balance Sheet with resulting gains and losses reflected in income. Fair values are derived principally frompublished market quotes and other independent third-party quotes. The change in fair value of Chevron’s derivativecommodity instruments in 2020 was not material to the company’s results of operations.
47
173155_Annual_Report_10-K.indd 46173155_Annual_Report_10-K.indd 46 3/5/21 6:04 PM3/5/21 6:04 PM
Management’s Discussion and Analysis of Financial Condition and Results of Operations
Net Debt Ratio Total debt less cash and cash equivalents, time deposits, and marketable securities as a percentage of total debt less cash and cash equivalents, time deposits, and marketable securities, plus Chevron Corporation Stockholders’ Equity, which indicates the company’s leverage, net of its cash balances.
At December 31
Millions of dollars 2020 2019 2018
Short-term debt $ 1,548 $ 3,282 $ 5,726
Long-term debt 42,767 23,691 28,733
Total Debt 44,315 26,973 34,459
Less: Cash and cash equivalents 5,596 5,686 9,342
Less: Time deposits — — 950
Less: Marketable securities 31 63 53
Total adjusted debt 38,688 21,224 24,114
Total Chevron Corporation Stockholders’ Equity 131,688 144,213 154,554
Total adjusted debt plus total Chevron Corporation Stockholders’ Equity $ 170,376 $ 165,437 $ 178,668
Net Debt Ratio 22.7 % 12.8 % 13.5 %
Capital Employed The sum of Chevron Corporation Stockholders’ Equity, total debt and noncontrolling interests, which represents the net investment in the business.
Millions of dollars 2020 2019 2018
Chevron Corporation Stockholders’ Equity $ 131,688 $ 144,213 $ 154,554
Plus: Short-term debt 1,548 3,282 5,726
Plus: Long-term debt 42,767 23,691 28,733
Plus: Noncontrolling interest 1,038 995 1,088
Capital Employed at December 31 $ 177,041 $ 172,181 $ 190,101
At December 31
Return on Average Capital Employed (ROCE) Net income attributable to Chevron (adjusted for after-tax interest expense and noncontrolling interest) divided by average capital employed. Average capital employed is computed by averaging the sum of capital employed at the beginning and end of the year. ROCE is a ratio intended to measure annual earnings as a percentage of historical investments in the business.
Year ended December 31
Millions of dollars 2020 2019 2018
Net income attributable to Chevron $ (5,543) $ 2,924 $ 14,824
Plus: After-tax interest and debt expense 658 761 713
Plus: Noncontrolling interest (18) (79) 36
Net income after adjustments (4,903) 3,606 15,573
Average capital employed $ 174,611 $ 181,141 $ 189,092
Return on Average Capital Employed (2.8) % 2.0 % 8.2 %
Return on Stockholders’ Equity (ROSE) Net income attributable to Chevron divided by average Chevron Corporation Stockholders’ Equity. Average stockholder’s equity is computed by averaging the sum of stockholder’s equity at the beginning and end of the year. ROSE is a ratio intended to measure earnings as a percentage of shareholder investments.
Year ended December 31
Millions of dollars 2020 2019 2018
Net income attributable to Chevron $ (5,543) $ 2,924 $ 14,824
Chevron Corporation Stockholders’ Equity at December 31 131,688 144,213 154,554
Average Chevron Corporation Stockholders’ Equity 137,951 149,384 151,339
Return on Average Stockholders’ Equity (4.0) % 2.0 % 9.8 %
Chevron Corporation 2020 Annual Report 46
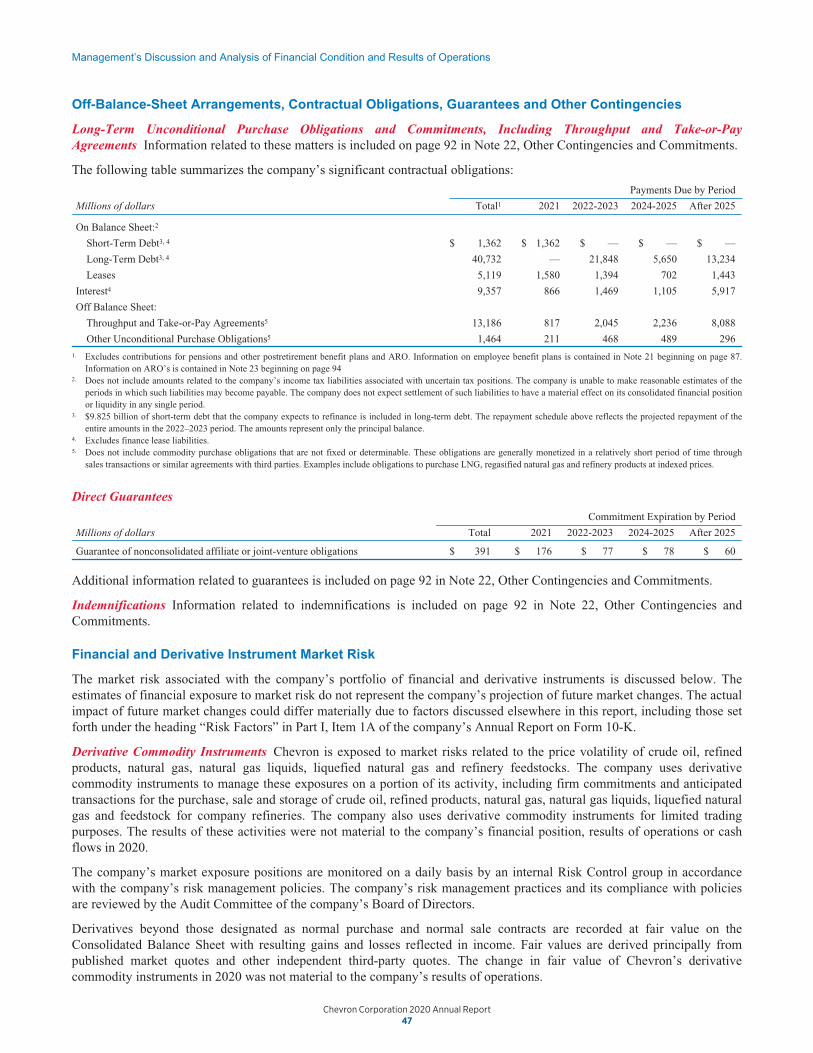
Management’s Discussion and Analysis of Financial Condition and Results of Operations
Net Debt Ratio Total debt less cash and cash equivalents, time deposits, and marketable securities as a percentage of totaldebt less cash and cash equivalents, time deposits, and marketable securities, plus Chevron Corporation Stockholders’Equity, which indicates the company’s leverage, net of its cash balances.
At December 31
Millions of dollars 2020 2019 2018
Short-term debt $ 1,548 $ 3,282 $ 5,726
Long-term debt 42,767 23,691 28,733
Total Debt 44,315 26,973 34,459
Less: Cash and cash equivalents 5,596 5,686 9,342
Less: Time deposits — — 950
Less: Marketable securities 31 63 53
Total adjusted debt 38,688 21,224 24,114
Total Chevron Corporation Stockholders’ Equity 131,688 144,213 154,554
Total adjusted debt plus total Chevron Corporation Stockholders’ Equity $ 170,376 $ 165,437 $ 178,668
Net Debt Ratio 22.7 % 12.8 % 13.5 %
Capital Employed The sum of Chevron Corporation Stockholders’ Equity, total debt and noncontrolling interests, whichrepresents the net investment in the business.
At December 31
Millions of dollars 2020 2019 2018
Chevron Corporation Stockholders’ Equity $ 131,688 $ 144,213 $ 154,554
Plus: Short-term debt 1,548 3,282 5,726
Plus: Long-term debt 42,767 23,691 28,733
Plus: Noncontrolling interest 1,038 995 1,088
Capital Employed at December 31 $ 177,041 $ 172,181 $ 190,101
Return on Average Capital Employed (ROCE) Net income attributable to Chevron (adjusted for after-tax interest expenseand noncontrolling interest) divided by average capital employed. Average capital employed is computed by averaging thesum of capital employed at the beginning and end of the year. ROCE is a ratio intended to measure annual earnings as apercentage of historical investments in the business.
Year ended December 31
Millions of dollars 2020 2019 2018
Net income attributable to Chevron $ (5,543) $ 2,924 $ 14,824
Plus: After-tax interest and debt expense 658 761 713
Plus: Noncontrolling interest (18) (79) 36
Net income after adjustments (4,903) 3,606 15,573
Average capital employed $ 174,611 $ 181,141 $ 189,092
Return on Average Capital Employed (2.8) % 2.0 % 8.2 %
Return on Stockholders’ Equity (ROSE) Net income attributable to Chevron divided by average Chevron CorporationStockholders’ Equity. Average stockholder’s equity is computed by averaging the sum of stockholder’s equity at thebeginning and end of the year. ROSE is a ratio intended to measure earnings as a percentage of shareholder investments.
Year ended December 31
Millions of dollars 2020 2019 2018
Net income attributable to Chevron $ (5,543) $ 2,924 $ 14,824
Chevron Corporation Stockholders’ Equity at December 31 131,688 144,213 154,554
Average Chevron Corporation Stockholders’ Equity 137,951 149,384 151,339
Return on Average Stockholders’ Equity (4.0) % 2.0 % 9.8 %
46 47
173155_Annual_Report_10-K.indd 47173155_Annual_Report_10-K.indd 47 3/5/21 6:04 PM3/5/21 6:04 PM
Management’s Discussion and Analysis of Financial Condition and Results of Operations
Off-Balance-Sheet Arrangements, Contractual Obligations, Guarantees and Other Contingencies
Long-Term Unconditional Purchase Obligations and Commitments, Including Throughput and Take-or-Pay Agreements Information related to these matters is included on page 92 in Note 22, Other Contingencies and Commitments.
The following table summarizes the company’s significant contractual obligations:
Payments Due by Period
Millions of dollars Total1 2021 2022-2023 2024-2025 After 2025
On Balance Sheet:2
Short-Term Debt3, 4 $ 1,362 $ 1,362 $ — $ — $ —
Long-Term Debt3, 4 40,732 — 21,848 5,650 13,234
Leases 5,119 1,580 1,394 702 1,443
Interest4 9,357 866 1,469 1,105 5,917
Off Balance Sheet:
Throughput and Take-or-Pay Agreements5 13,186 817 2,045 2,236 8,088
Other Unconditional Purchase Obligations5 1,464 211 468 489 296
1. Excludes contributions for pensions and other postretirement benefit plans and ARO. Information on employee benefit plans is contained in Note 21 beginning on page 87. Information on ARO’s is contained in Note 23 beginning on page 94
2. Does not include amounts related to the company’s income tax liabilities associated with uncertain tax positions. The company is unable to make reasonable estimates of the periods in which such liabilities may become payable. The company does not expect settlement of such liabilities to have a material effect on its consolidated financial position or liquidity in any single period.
3. $9.825 billion of short-term debt that the company expects to refinance is included in long-term debt. The repayment schedule above reflects the projected repayment of the entire amounts in the 2022–2023 period. The amounts represent only the principal balance.
4. Excludes finance lease liabilities. 5. Does not include commodity purchase obligations that are not fixed or determinable. These obligations are generally monetized in a relatively short period of time through
sales transactions or similar agreements with third parties. Examples include obligations to purchase LNG, regasified natural gas and refinery products at indexed prices.
Direct Guarantees
Commitment Expiration by Period
Millions of dollars Total 2021 2022-2023 2024-2025 After 2025
Guarantee of nonconsolidated affiliate or joint-venture obligations $ 391 $ 176 $ 77 $ 78 $ 60
Additional information related to guarantees is included on page 92 in Note 22, Other Contingencies and Commitments.
Indemnifications Information related to indemnifications is included on page 92 in Note 22, Other Contingencies and Commitments.
Financial and Derivative Instrument Market Risk
The market risk associated with the company’s portfolio of financial and derivative instruments is discussed below. The estimates of financial exposure to market risk do not represent the company’s projection of future market changes. The actual impact of future market changes could differ materially due to factors discussed elsewhere in this report, including those set forth under the heading “Risk Factors” in Part I, Item 1A of the company’s Annual Report on Form 10-K.
Derivative Commodity Instruments Chevron is exposed to market risks related to the price volatility of crude oil, refined products, natural gas, natural gas liquids, liquefied natural gas and refinery feedstocks. The company uses derivative commodity instruments to manage these exposures on a portion of its activity, including firm commitments and anticipated transactions for the purchase, sale and storage of crude oil, refined products, natural gas, natural gas liquids, liquefied natural gas and feedstock for company refineries. The company also uses derivative commodity instruments for limited trading purposes. The results of these activities were not material to the company’s financial position, results of operations or cash flows in 2020.
The company’s market exposure positions are monitored on a daily basis by an internal Risk Control group in accordance with the company’s risk management policies. The company’s risk management practices and its compliance with policies are reviewed by the Audit Committee of the company’s Board of Directors.
Derivatives beyond those designated as normal purchase and normal sale contracts are recorded at fair value on the Consolidated Balance Sheet with resulting gains and losses reflected in income. Fair values are derived principally from published market quotes and other independent third-party quotes. The change in fair value of Chevron’s derivative commodity instruments in 2020 was not material to the company’s results of operations.
Chevron Corporation 2020 Annual Report 47

48
Management’s Discussion and Analysis of Financial Condition and Results of Operations
Other Contingencies Information related to other contingencies is included on page 93 in Note 22 to the ConsolidatedFinancial Statements under the heading “Other Contingencies.”
Environmental Matters
The company is subject to various international, federal, state and local environmental, health and safety laws, regulationsand market-based programs. These laws, regulations and programs continue to evolve and are expected to increase in bothnumber and complexity over time and govern not only the manner in which the company conducts its operations, but also theproducts it sells. For example, international agreements and national, regional, and state legislation and regulatory measuresthat aim to limit or reduce greenhouse gas (GHG) emissions are currently in various stages of implementation. Considerationof GHG issues and the responses to those issues through international agreements and national, regional or state legislation orregulations are integrated into the company’s strategy and planning, capital investment reviews and risk management toolsand processes, where applicable. They are also factored into the company’s long-range supply, demand and energy priceforecasts. These forecasts reflect long-range effects from renewable fuel penetration, energy efficiency standards, climate-related policy actions, and demand response to oil and natural gas prices. In addition, legislation and regulations intended toaddress hydraulic fracturing also continue to evolve at the national, state and local levels. Refer to “Risk Factors” in Part I,Item 1A, on pages 18 through 23 of the company’s Annual Report on Form 10-K for a discussion of some of the inherentrisks of increasingly restrictive environmental and other regulation that could materially impact the company’s results ofoperations or financial condition.
Most of the costs of complying with existing laws and regulations pertaining to company operations and products areembedded in the normal costs of doing business. However, it is not possible to predict with certainty the amount of additionalinvestments in new or existing technology or facilities or the amounts of increased operating costs to be incurred in the futureto: prevent, control, reduce or eliminate releases of hazardous materials or other pollutants into the environment; remediateand restore areas damaged by prior releases of hazardous materials; or comply with new environmental laws or regulations.Although these costs may be significant to the results of operations in any single period, the company does not presentlyexpect them to have a material adverse effect on the company’s liquidity or financial position.
Accidental leaks and spills requiring cleanup may occur in the ordinary course of business. The company may incur expensesfor corrective actions at various owned and previously owned facilities and at third-party-owned waste disposal sites used bythe company. An obligation may arise when operations are closed or sold or at non-Chevron sites where company productshave been handled or disposed of. Most of the expenditures to fulfill these obligations relate to facilities and sites where pastoperations followed practices and procedures that were considered acceptable at the time but now require investigative orremedial work or both to meet current standards.
Using definitions and guidelines established by the American Petroleum Institute, Chevron estimated its worldwideenvironmental spending in 2020 at approximately $2.0 billion for its consolidated companies. Included in these expenditureswere approximately $0.5 billion of environmental capital expenditures and $1.5 billion of costs associated with theprevention, control, abatement or elimination of hazardous substances and pollutants from operating, closed or divested sites,and the decommissioning and restoration of sites.
For 2021, total worldwide environmental capital expenditures are estimated at $0.5 billion. These capital costs are in additionto the ongoing costs of complying with environmental regulations and the costs to remediate previously contaminated sites.
Critical Accounting Estimates and Assumptions
Management makes many estimates and assumptions in the application of accounting principles generally accepted in theUnited States of America (GAAP) that may have a material impact on the company’s consolidated financial statements andrelated disclosures and on the comparability of such information over different reporting periods. Such estimates andassumptions affect reported amounts of assets, liabilities, revenues and expenses, as well as disclosures of contingent assetsand liabilities. Estimates and assumptions are based on management’s experience and other information available prior to theissuance of the financial statements. Materially different results can occur as circumstances change and additionalinformation becomes known.
The discussion in this section of “critical” accounting estimates and assumptions is according to the disclosure guidelines ofthe Securities and Exchange Commission (SEC), wherein:
49
173155_Annual_Report_10-K.indd 48173155_Annual_Report_10-K.indd 48 3/5/21 6:04 PM3/5/21 6:04 PM
Management’s Discussion and Analysis of Financial Condition and Results of Operations
The company uses the Monte Carlo simulation method as its Value-at-Risk (VaR) model to estimate the maximum potential loss in fair value, at the 95 percent confidence level with a one-day holding period, from the effect of adverse changes in market conditions on derivative commodity instruments held or issued. Based on these inputs, the VaR for the company’s primary risk exposures in the area of derivative commodity instruments at December 31, 2020 and 2019 was not material to the company’s cash flows or results of operations.
Foreign Currency The company may enter into foreign currency derivative contracts to manage some of its foreign currency exposures. These exposures include revenue and anticipated purchase transactions, including foreign currency capital expenditures and lease commitments. The foreign currency derivative contracts, if any, are recorded at fair value on the balance sheet with resulting gains and losses reflected in income. There were no material open foreign currency derivative contracts at December 31, 2020.
Interest Rates The company may enter into interest rate swaps from time to time as part of its overall strategy to manage the interest rate risk on its debt. Interest rate swaps, if any, are recorded at fair value on the balance sheet with resulting gains and losses reflected in income. At year-end 2020, the company had no interest rate swaps.
Transactions With Related Parties
Chevron enters into a number of business arrangements with related parties, principally its equity affiliates. These arrangements include long-term supply or offtake agreements and long-term purchase agreements. Refer to “Other Information” on page 77, in Note 13, Investments and Advances, for further discussion. Management believes these agreements have been negotiated on terms consistent with those that would have been negotiated with an unrelated party.
Litigation and Other Contingencies
MTBE Information related to methyl tertiary butyl ether (MTBE) matters is included on page 78 in Note 14 under the heading “MTBE.”
Ecuador Information related to Ecuador matters is included in Note 14 under the heading “Ecuador,” beginning on page 78.
Environmental The following table displays the annual changes to the company’s before-tax environmental remediation reserves, including those for U.S. federal Superfund sites and analogous sites under state laws.
Millions of dollars 2020 2019 2018
Balance at January 1 $ 1,234 $ 1,327 $ 1,429 Net Additions 179 200 197 Expenditures (274) (293) (299)
Balance at December 31 $ 1,139 $ 1,234 $ 1,327
The company records asset retirement obligations when there is a legal obligation associated with the retirement of long-lived assets and the liability can be reasonably estimated. These asset retirement obligations include costs related to environmental issues. The liability balance of approximately $13.6 billion for asset retirement obligations at year-end 2020 related primarily to upstream properties.
For the company’s other ongoing operating assets, such as refineries and chemicals facilities, no provisions are made for exit or cleanup costs that may be required when such assets reach the end of their useful lives unless a decision to sell or otherwise decommission the facility has been made, as the indeterminate settlement dates for the asset retirements prevent estimation of the fair value of the asset retirement obligation.
Refer to the discussion below for additional information on environmental matters and their impact on Chevron, and on the company’s 2020 environmental expenditures. Refer to Note 22 on page 93 for additional discussion of environmental remediation provisions and year-end reserves. Refer also to Note 23 on page 94 for additional discussion of the company’s asset retirement obligations.
Suspended Wells Information related to suspended wells is included in Note 19, Accounting for Suspended Exploratory Wells, beginning on page 85.
Income Taxes Information related to income tax contingencies is included on pages 79 through 82 in Note 15 and page 92 in Note 22 under the heading “Income Taxes.”
Chevron Corporation 2020 Annual Report 48

Management’s Discussion and Analysis of Financial Condition and Results of Operations
The company uses the Monte Carlo simulation method as its Value-at-Risk (VaR) model to estimate the maximum potentialloss in fair value, at the 95 percent confidence level with a one-day holding period, from the effect of adverse changes inmarket conditions on derivative commodity instruments held or issued. Based on these inputs, the VaR for the company’sprimary risk exposures in the area of derivative commodity instruments at December 31, 2020 and 2019 was not material tothe company’s cash flows or results of operations.
Foreign Currency The company may enter into foreign currency derivative contracts to manage some of its foreigncurrency exposures. These exposures include revenue and anticipated purchase transactions, including foreign currencycapital expenditures and lease commitments. The foreign currency derivative contracts, if any, are recorded at fair value onthe balance sheet with resulting gains and losses reflected in income. There were no material open foreign currencyderivative contracts at December 31, 2020.
Interest Rates The company may enter into interest rate swaps from time to time as part of its overall strategy to manage theinterest rate risk on its debt. Interest rate swaps, if any, are recorded at fair value on the balance sheet with resulting gains andlosses reflected in income. At year-end 2020, the company had no interest rate swaps.
Transactions With Related Parties
Chevron enters into a number of business arrangements with related parties, principally its equity affiliates. Thesearrangements include long-term supply or offtake agreements and long-term purchase agreements. Refer to “OtherInformation” on page 77, in Note 13, Investments and Advances, for further discussion. Management believes theseagreements have been negotiated on terms consistent with those that would have been negotiated with an unrelated party.
Litigation and Other Contingencies
MTBE Information related to methyl tertiary butyl ether (MTBE) matters is included on page 78 in Note 14 under theheading “MTBE.”
Ecuador Information related to Ecuador matters is included in Note 14 under the heading “Ecuador,” beginning on page 78.
Environmental The following table displays the annual changes to the company’s before-tax environmental remediationreserves, including those for U.S. federal Superfund sites and analogous sites under state laws.
Millions of dollars 2020 2019 2018
Balance at January 1 $ 1,234 $ 1,327 $ 1,429Net Additions 179 200 197Expenditures (274) (293) (299)
Balance at December 31 $ 1,139 $ 1,234 $ 1,327
The company records asset retirement obligations when there is a legal obligation associated with the retirement of long-lived assets and the liability can be reasonably estimated. These asset retirement obligations include costs related toenvironmental issues. The liability balance of approximately $13.6 billion for asset retirement obligations at year-end 2020related primarily to upstream properties.
For the company’s other ongoing operating assets, such as refineries and chemicals facilities, no provisions are made for exitor cleanup costs that may be required when such assets reach the end of their useful lives unless a decision to sell orotherwise decommission the facility has been made, as the indeterminate settlement dates for the asset retirements preventestimation of the fair value of the asset retirement obligation.
Refer to the discussion below for additional information on environmental matters and their impact on Chevron, and on thecompany’s 2020 environmental expenditures. Refer to Note 22 on page 93 for additional discussion of environmentalremediation provisions and year-end reserves. Refer also to Note 23 on page 94 for additional discussion of the company’sasset retirement obligations.
Suspended Wells Information related to suspended wells is included in Note 19, Accounting for Suspended ExploratoryWells, beginning on page 85.
Income Taxes Information related to income tax contingencies is included on pages 79 through 82 in Note 15 and page 92 inNote 22 under the heading “Income Taxes.”
48 49
173155_Annual_Report_10-K.indd 49173155_Annual_Report_10-K.indd 49 3/5/21 6:04 PM3/5/21 6:04 PM
Management’s Discussion and Analysis of Financial Condition and Results of Operations
Other Contingencies Information related to other contingencies is included on page 93 in Note 22 to the Consolidated Financial Statements under the heading “Other Contingencies.”
Environmental Matters
The company is subject to various international, federal, state and local environmental, health and safety laws, regulations and market-based programs. These laws, regulations and programs continue to evolve and are expected to increase in both number and complexity over time and govern not only the manner in which the company conducts its operations, but also the products it sells. For example, international agreements and national, regional, and state legislation and regulatory measures that aim to limit or reduce greenhouse gas (GHG) emissions are currently in various stages of implementation. Consideration of GHG issues and the responses to those issues through international agreements and national, regional or state legislation or regulations are integrated into the company’s strategy and planning, capital investment reviews and risk management tools and processes, where applicable. They are also factored into the company’s long-range supply, demand and energy price forecasts. These forecasts reflect long-range effects from renewable fuel penetration, energy efficiency standards, climate-related policy actions, and demand response to oil and natural gas prices. In addition, legislation and regulations intended to address hydraulic fracturing also continue to evolve at the national, state and local levels. Refer to “Risk Factors” in Part I, Item 1A, on pages 18 through 23 of the company’s Annual Report on Form 10-K for a discussion of some of the inherent risks of increasingly restrictive environmental and other regulation that could materially impact the company’s results of operations or financial condition.
Most of the costs of complying with existing laws and regulations pertaining to company operations and products are embedded in the normal costs of doing business. However, it is not possible to predict with certainty the amount of additional investments in new or existing technology or facilities or the amounts of increased operating costs to be incurred in the future to: prevent, control, reduce or eliminate releases of hazardous materials or other pollutants into the environment; remediate and restore areas damaged by prior releases of hazardous materials; or comply with new environmental laws or regulations. Although these costs may be significant to the results of operations in any single period, the company does not presently expect them to have a material adverse effect on the company’s liquidity or financial position.
Accidental leaks and spills requiring cleanup may occur in the ordinary course of business. The company may incur expenses for corrective actions at various owned and previously owned facilities and at third-party-owned waste disposal sites used by the company. An obligation may arise when operations are closed or sold or at non-Chevron sites where company products have been handled or disposed of. Most of the expenditures to fulfill these obligations relate to facilities and sites where past operations followed practices and procedures that were considered acceptable at the time but now require investigative or remedial work or both to meet current standards.
Using definitions and guidelines established by the American Petroleum Institute, Chevron estimated its worldwide environmental spending in 2020 at approximately $2.0 billion for its consolidated companies. Included in these expenditures were approximately $0.5 billion of environmental capital expenditures and $1.5 billion of costs associated with the prevention, control, abatement or elimination of hazardous substances and pollutants from operating, closed or divested sites, and the decommissioning and restoration of sites.
For 2021, total worldwide environmental capital expenditures are estimated at $0.5 billion. These capital costs are in addition to the ongoing costs of complying with environmental regulations and the costs to remediate previously contaminated sites.
Critical Accounting Estimates and Assumptions
Management makes many estimates and assumptions in the application of accounting principles generally accepted in the United States of America (GAAP) that may have a material impact on the company’s consolidated financial statements and related disclosures and on the comparability of such information over different reporting periods. Such estimates and assumptions affect reported amounts of assets, liabilities, revenues and expenses, as well as disclosures of contingent assets and liabilities. Estimates and assumptions are based on management’s experience and other information available prior to the issuance of the financial statements. Materially different results can occur as circumstances change and additional information becomes known.
The discussion in this section of “critical” accounting estimates and assumptions is according to the disclosure guidelines of the Securities and Exchange Commission (SEC), wherein:
Chevron Corporation 2020 Annual Report 49

50
Management’s Discussion and Analysis of Financial Condition and Results of Operations
The company performs impairment assessments when triggering events arise to determine whether any write-down in thecarrying value of an asset or asset group is required. For example, when significant downward revisions to crude oil andnatural gas reserves are made for any single field or concession, an impairment review is performed to determine if thecarrying value of the asset remains recoverable. Similarly, a significant downward revision in the company’s crude oil ornatural gas price outlook would trigger impairment reviews for impacted upstream assets. In addition, impairments couldoccur due to changes in national, state or local environmental regulations or laws, including those designed to stop or impedethe development or production of oil and gas. Also, if the expectation of sale of a particular asset or asset group in any periodhas been deemed more likely than not, an impairment review is performed, and if the estimated net proceeds exceed thecarrying value of the asset or asset group, no impairment charge is required. Such calculations are reviewed each period untilthe asset or asset group is disposed. Assets that are not impaired on a held-and-used basis could possibly become impaired ifa decision is made to sell such assets. That is, the assets would be impaired if they are classified as held-for-sale and theestimated proceeds from the sale, less costs to sell, are less than the assets’ associated carrying values.
Investments in common stock of affiliates that are accounted for under the equity method, as well as investments in othersecurities of these equity investees, are reviewed for impairment when the fair value of the investment falls below thecompany’s carrying value. When this occurs, a determination must be made as to whether this loss is other-than-temporary,in which case the investment is impaired. Because of the number of differing assumptions potentially affecting whether aninvestment is impaired in any period or the amount of the impairment, a sensitivity analysis is not practicable.
In 2020, the company recorded impairments and write-offs for certain oil and gas properties primarily due to downwardrevisions to its oil and gas price outlook. In addition, the company fully impaired its investments in Petropiar andPetroboscan after completing an evaluation of the carrying value of its Venezuelan investments in line with its accountingpolicies and concluding that given the current operating environment and overall outlook, which create significantuncertainties regarding the recovery of the company’s investment, an other than temporary loss of value had occurred.
In 2019, the company recorded impairments and write-offs for certain oil and gas properties following the review andapproval of its business plan and capital expenditure program. As a result of the company’s disciplined approach to capitalallocation and a downward revision in its longer-term commodity price outlook, the company reduced funding to variousnatural gas-related upstream opportunities including Appalachia shale, Kitimat LNG and other international projects. Inaddition, the revised long-term oil price outlook resulted in an impairment of Big Foot.
A sensitivity analysis of the impact on earnings for these periods if other assumptions had been used in impairment reviewsand impairment calculations is not practicable, given the broad range of the company’s PP&E and the number of assumptionsinvolved in the estimates. That is, favorable changes to some assumptions might have avoided the need to impair any assetsin these periods, whereas unfavorable changes might have caused an additional unknown number of other assets to becomeimpaired, or resulted in larger impacts on impaired assets.
Asset Retirement Obligations In the determination of fair value for an asset retirement obligation (ARO), the company usesvarious assumptions and judgments, including such factors as the existence of a legal obligation, estimated amounts andtiming of settlements, discount and inflation rates, and the expected impact of advances in technology and processimprovements. A sensitivity analysis of the ARO impact on earnings for 2020 is not practicable, given the broad range of thecompany’s long-lived assets and the number of assumptions involved in the estimates. That is, favorable changes to someassumptions would have reduced estimated future obligations, thereby lowering accretion expense and amortization costs,whereas unfavorable changes would have the opposite effect. Refer to Note 23 on page 94 for additional discussions on assetretirement obligations.
Pension and Other Postretirement Benefit Plans Note 21, beginning on page 87, includes information on the funded statusof the company’s pension and other postretirement benefit (OPEB) plans reflected on the Consolidated Balance Sheet; thecomponents of pension and OPEB expense reflected on the Consolidated Statement of Income; and the related underlyingassumptions.
The determination of pension plan expense and obligations is based on a number of actuarial assumptions. Two criticalassumptions are the expected long-term rate of return on plan assets and the discount rate applied to pension plan obligations.Critical assumptions in determining expense and obligations for OPEB plans, which provide for certain health care and lifeinsurance benefits for qualifying retired employees and which are not funded, are the discount rate and the assumed healthcare cost-trend rates. Information related to the company’s processes to develop these assumptions is included on page 89 inNote 21 under the relevant headings. Actual rates may vary significantly from estimates because of unanticipated changesbeyond the company’s control.
51
173155_Annual_Report_10-K.indd 50173155_Annual_Report_10-K.indd 50 3/5/21 6:04 PM3/5/21 6:04 PM
Management’s Discussion and Analysis of Financial Condition and Results of Operations
1. the nature of the estimates and assumptions is material due to the levels of subjectivity and judgment necessary to account for highly uncertain matters, or the susceptibility of such matters to change; and
2. the impact of the estimates and assumptions on the company’s financial condition or operating performance is material.
The development and selection of accounting estimates and assumptions, including those deemed “critical,” and the associated disclosures in this discussion have been discussed by management with the Audit Committee of the Board of Directors. The areas of accounting and the associated “critical” estimates and assumptions made by the company are as follows:
Oil and Gas Reserves Crude oil and natural gas reserves are estimates of future production that impact certain asset and expense accounts included in the Consolidated Financial Statements. Proved reserves are the estimated quantities of oil and gas that geoscience and engineering data demonstrate with reasonable certainty to be economically producible in the future under existing economic conditions, operating methods and government regulations. Proved reserves include both developed and undeveloped volumes. Proved developed reserves represent volumes expected to be recovered through existing wells with existing equipment and operating methods. Proved undeveloped reserves are volumes expected to be recovered from new wells on undrilled proved acreage, or from existing wells where a relatively major expenditure is required for recompletion. Variables impacting Chevron’s estimated volumes of crude oil and natural gas reserves include field performance, available technology, commodity prices, and development and production costs.
The estimates of crude oil and natural gas reserves are important to the timing of expense recognition for costs incurred and to the valuation of certain oil and gas producing assets. Impacts of oil and gas reserves on Chevron’s Consolidated Financial Statements, using the successful efforts method of accounting, include the following:
1. Amortization – Capitalized exploratory drilling and development costs are depreciated on a unit-of-production (UOP) basis using proved developed reserves. Acquisition costs of proved properties are amortized on a UOP basis using total proved reserves. During 2020, Chevron’s UOP Depreciation, Depletion and Amortization (DD&A) for oil and gas properties was $13.0 billion, and proved developed reserves at the beginning of 2020 were 6.4 billion barrels for consolidated companies. If the estimates of proved reserves used in the UOP calculations for consolidated operations had been lower by 5 percent across all oil and gas properties, UOP DD&A in 2020 would have increased by approximately $700 million.
2. Impairment – Oil and gas reserves are used in assessing oil and gas producing properties for impairment. A significant reduction in the estimated reserves of a property would trigger an impairment review. Proved reserves (and, in some cases, a portion of unproved resources) are used to estimate future production volumes in the cash flow model. For a further discussion of estimates and assumptions used in impairment assessments, see Impairment of Properties, Plant and Equipment and Investments in Affiliates below.
Refer to Table V, “Reserve Quantity Information,” beginning on page 103, for the changes in proved reserve estimates for the three years ended December 31, 2020, and to Table VII, “Changes in the Standardized Measure of Discounted Future Net Cash Flows From Proved Reserves” on page 111 for estimates of proved reserve values for each of the three years ended December 31, 2020.
This Oil and Gas Reserves commentary should be read in conjunction with the Properties, Plant and Equipment section of Note 1, beginning on page 64, which includes a description of the “successful efforts” method of accounting for oil and gas exploration and production activities.
Impairment of Properties, Plant and Equipment and Investments in Affiliates The company assesses its properties, plant and equipment (PP&E) for possible impairment whenever events or changes in circumstances indicate that the carrying value of the assets may not be recoverable. If the carrying value of an asset exceeds the future undiscounted cash flows expected from the asset, an impairment charge is recorded for the excess of carrying value of the asset over its estimated fair value.
Determination as to whether and how much an asset is impaired involves management estimates on highly uncertain matters, such as future commodity prices, operating expenses, production profiles, and the outlook for global or regional market supply-and-demand conditions for crude oil, natural gas, commodity chemicals and refined products. However, the impairment reviews and calculations are based on assumptions that are generally consistent with the company’s business plans and long-term investment decisions. Refer also to the discussion of impairments of properties, plant and equipment in Note 16 on page 82 and to the section on Properties, Plant and Equipment in Note 1, “Summary of Significant Accounting Policies,” beginning on page 64.
Chevron Corporation 2020 Annual Report 50
Management’s Discussion and Analysis of Financial Condition and Results of Operations
1. the nature of the estimates and assumptions is material due to the levels of subjectivity and judgmentnecessary to account for highly uncertain matters, or the susceptibility of such matters to change; and
2. the impact of the estimates and assumptions on the company’s financial condition or operating performance ismaterial.
The development and selection of accounting estimates and assumptions, including those deemed “critical,” and theassociated disclosures in this discussion have been discussed by management with the Audit Committee of the Board ofDirectors. The areas of accounting and the associated “critical” estimates and assumptions made by the company are asfollows:
Oil and Gas Reserves Crude oil and natural gas reserves are estimates of future production that impact certain asset andexpense accounts included in the Consolidated Financial Statements. Proved reserves are the estimated quantities of oil andgas that geoscience and engineering data demonstrate with reasonable certainty to be economically producible in the futureunder existing economic conditions, operating methods and government regulations. Proved reserves include both developedand undeveloped volumes. Proved developed reserves represent volumes expected to be recovered through existing wellswith existing equipment and operating methods. Proved undeveloped reserves are volumes expected to be recovered fromnew wells on undrilled proved acreage, or from existing wells where a relatively major expenditure is required forrecompletion. Variables impacting Chevron’s estimated volumes of crude oil and natural gas reserves include fieldperformance, available technology, commodity prices, and development and production costs.
The estimates of crude oil and natural gas reserves are important to the timing of expense recognition for costs incurred andto the valuation of certain oil and gas producing assets. Impacts of oil and gas reserves on Chevron’s Consolidated FinancialStatements, using the successful efforts method of accounting, include the following:
1. Amortization – Capitalized exploratory drilling and development costs are depreciated on a unit-of-production(UOP) basis using proved developed reserves. Acquisition costs of proved properties are amortized on a UOPbasis using total proved reserves. During 2020, Chevron’s UOP Depreciation, Depletion and Amortization(DD&A) for oil and gas properties was $13.0 billion, and proved developed reserves at the beginning of 2020were 6.4 billion barrels for consolidated companies. If the estimates of proved reserves used in the UOPcalculations for consolidated operations had been lower by 5 percent across all oil and gas properties, UOPDD&A in 2020 would have increased by approximately $700 million.
2. Impairment – Oil and gas reserves are used in assessing oil and gas producing properties for impairment. Asignificant reduction in the estimated reserves of a property would trigger an impairment review. Provedreserves (and, in some cases, a portion of unproved resources) are used to estimate future production volumesin the cash flow model. For a further discussion of estimates and assumptions used in impairmentassessments, see Impairment of Properties, Plant and Equipment and Investments in Affiliates below.
Refer to Table V, “Reserve Quantity Information,” beginning on page 103, for the changes in proved reserve estimates forthe three years ended December 31, 2020, and to Table VII, “Changes in the Standardized Measure of Discounted Future NetCash Flows From Proved Reserves” on page 111 for estimates of proved reserve values for each of the three years endedDecember 31, 2020.
This Oil and Gas Reserves commentary should be read in conjunction with the Properties, Plant and Equipment section ofNote 1, beginning on page 64, which includes a description of the “successful efforts” method of accounting for oil and gasexploration and production activities.
Impairment of Properties, Plant and Equipment and Investments in Affiliates The company assesses its properties, plantand equipment (PP&E) for possible impairment whenever events or changes in circumstances indicate that the carrying valueof the assets may not be recoverable. If the carrying value of an asset exceeds the future undiscounted cash flows expectedfrom the asset, an impairment charge is recorded for the excess of carrying value of the asset over its estimated fair value.
Determination as to whether and how much an asset is impaired involves management estimates on highly uncertain matters,such as future commodity prices, operating expenses, production profiles, and the outlook for global or regional marketsupply-and-demand conditions for crude oil, natural gas, commodity chemicals and refined products. However, theimpairment reviews and calculations are based on assumptions that are generally consistent with the company’s businessplans and long-term investment decisions. Refer also to the discussion of impairments of properties, plant and equipment inNote 16 on page 82 and to the section on Properties, Plant and Equipment in Note 1, “Summary of Significant AccountingPolicies,” beginning on page 64.
50 51
173155_Annual_Report_10-K.indd 51173155_Annual_Report_10-K.indd 51 3/5/21 6:04 PM3/5/21 6:04 PM
Management’s Discussion and Analysis of Financial Condition and Results of Operations
The company performs impairment assessments when triggering events arise to determine whether any write-down in the carrying value of an asset or asset group is required. For example, when significant downward revisions to crude oil and natural gas reserves are made for any single field or concession, an impairment review is performed to determine if the carrying value of the asset remains recoverable. Similarly, a significant downward revision in the company’s crude oil or natural gas price outlook would trigger impairment reviews for impacted upstream assets. In addition, impairments could occur due to changes in national, state or local environmental regulations or laws, including those designed to stop or impede the development or production of oil and gas. Also, if the expectation of sale of a particular asset or asset group in any period has been deemed more likely than not, an impairment review is performed, and if the estimated net proceeds exceed the carrying value of the asset or asset group, no impairment charge is required. Such calculations are reviewed each period until the asset or asset group is disposed. Assets that are not impaired on a held-and-used basis could possibly become impaired if a decision is made to sell such assets. That is, the assets would be impaired if they are classified as held-for-sale and the estimated proceeds from the sale, less costs to sell, are less than the assets’ associated carrying values.
Investments in common stock of affiliates that are accounted for under the equity method, as well as investments in other securities of these equity investees, are reviewed for impairment when the fair value of the investment falls below the company’s carrying value. When this occurs, a determination must be made as to whether this loss is other-than-temporary, in which case the investment is impaired. Because of the number of differing assumptions potentially affecting whether an investment is impaired in any period or the amount of the impairment, a sensitivity analysis is not practicable.
In 2020, the company recorded impairments and write-offs for certain oil and gas properties primarily due to downward revisions to its oil and gas price outlook. In addition, the company fully impaired its investments in Petropiar and Petroboscan after completing an evaluation of the carrying value of its Venezuelan investments in line with its accounting policies and concluding that given the current operating environment and overall outlook, which create significant uncertainties regarding the recovery of the company’s investment, an other than temporary loss of value had occurred.
In 2019, the company recorded impairments and write-offs for certain oil and gas properties following the review and approval of its business plan and capital expenditure program. As a result of the company’s disciplined approach to capital allocation and a downward revision in its longer-term commodity price outlook, the company reduced funding to various natural gas-related upstream opportunities including Appalachia shale, Kitimat LNG and other international projects. In addition, the revised long-term oil price outlook resulted in an impairment of Big Foot.
A sensitivity analysis of the impact on earnings for these periods if other assumptions had been used in impairment reviews and impairment calculations is not practicable, given the broad range of the company’s PP&E and the number of assumptions involved in the estimates. That is, favorable changes to some assumptions might have avoided the need to impair any assets in these periods, whereas unfavorable changes might have caused an additional unknown number of other assets to become impaired, or resulted in larger impacts on impaired assets.
Asset Retirement Obligations In the determination of fair value for an asset retirement obligation (ARO), the company uses various assumptions and judgments, including such factors as the existence of a legal obligation, estimated amounts and timing of settlements, discount and inflation rates, and the expected impact of advances in technology and process improvements. A sensitivity analysis of the ARO impact on earnings for 2020 is not practicable, given the broad range of the company’s long-lived assets and the number of assumptions involved in the estimates. That is, favorable changes to some assumptions would have reduced estimated future obligations, thereby lowering accretion expense and amortization costs, whereas unfavorable changes would have the opposite effect. Refer to Note 23 on page 94 for additional discussions on asset retirement obligations.
Pension and Other Postretirement Benefit Plans Note 21, beginning on page 87, includes information on the funded status of the company’s pension and other postretirement benefit (OPEB) plans reflected on the Consolidated Balance Sheet; the components of pension and OPEB expense reflected on the Consolidated Statement of Income; and the related underlying assumptions.
The determination of pension plan expense and obligations is based on a number of actuarial assumptions. Two critical assumptions are the expected long-term rate of return on plan assets and the discount rate applied to pension plan obligations. Critical assumptions in determining expense and obligations for OPEB plans, which provide for certain health care and life insurance benefits for qualifying retired employees and which are not funded, are the discount rate and the assumed health care cost-trend rates. Information related to the company’s processes to develop these assumptions is included on page 89 in Note 21 under the relevant headings. Actual rates may vary significantly from estimates because of unanticipated changes beyond the company’s control.
Chevron Corporation 2020 Annual Report 51

52
Management’s Discussion and Analysis of Financial Condition and Results of Operations
impact on the company’s consolidated financial statements and financial or operational performance in any given period” in“Risk Factors” in Part I, Item 1A, on page 23 of the company’s Annual Report on Form 10-K.
New Accounting Standards
Refer to Note 4 beginning on page 69 for information regarding new accounting standards.
53
173155_Annual_Report_10-K.indd 52173155_Annual_Report_10-K.indd 52 3/5/21 6:04 PM3/5/21 6:04 PM
Management’s Discussion and Analysis of Financial Condition and Results of Operations
For 2020, the company used an expected long-term rate of return of 6.5 percent and a discount rate for service costs of 3.3 percent and a discount rate for interest cost of 2.6 percent for the primary U.S. pension plan. The actual return for 2020 was 9.4 percent. For the 10 years ended December 31, 2020, actual asset returns averaged 7.9 percent for this plan. Additionally, with the exception of three years within this 10-year period, actual asset returns for this plan equaled or exceeded 6.5 percent during each year.
Total pension expense for 2020 was $1.5 billion. An increase in the expected long-term return on plan assets or the discount rate would reduce pension plan expense, and vice versa. As an indication of the sensitivity of pension expense to the long-term rate of return assumption, a 1 percent increase in this assumption for the company’s primary U.S. pension plan, which accounted for about 67 percent of companywide pension expense, would have reduced total pension plan expense for 2020 by approximately $88 million. A 1 percent increase in the discount rates for this same plan would have reduced pension expense for 2020 by approximately $269 million.
The aggregate funded status recognized at December 31, 2020, was a net liability of approximately $6.2 billion. An increase in the discount rate would decrease the pension obligation, thus changing the funded status of a plan. At December 31, 2020, the company used a discount rate of 2.4 percent to measure the obligations for the primary U.S. pension plan. As an indication of the sensitivity of pension liabilities to the discount rate assumption, a 0.25 percent increase in the discount rate applied to the company’s primary U.S. pension plan, which accounted for about 61 percent of the companywide pension obligation, would have reduced the plan obligation by approximately $475 million, and would have decreased the plan’s underfunded status from approximately $3.2 billion to $2.8 billion.
For the company’s OPEB plans, expense for 2020 was $57 million, and the total liability, all unfunded at the end of 2020, was $2.7 billion. For the primary U.S. OPEB plan, the company used a discount rate for service cost of 3.4 percent and a discount rate for interest cost of 2.7 percent to measure expense in 2020, and a 2.4 percent discount rate to measure the benefit obligations at December 31, 2020. Discount rate changes, similar to those used in the pension sensitivity analysis, resulted in an immaterial impact on 2020 OPEB expense and OPEB liabilities at the end of 2020.
Differences between the various assumptions used to determine expense and the funded status of each plan and actual experience are included in actuarial gain/loss. Refer to page 88 in Note 21 for more information on the $7.4 billion of before-tax actuarial losses recorded by the company as of December 31, 2020, In addition, information related to company contributions is included on page 91 in Note 21 under the heading “Cash Contributions and Benefit Payments.”
Business Combinations – Purchase-Price Allocation Accounting for business combinations requires the allocation of the company’s purchase price to the various assets and liabilities of the acquired business at their respective fair values. The company uses all available information to make these fair value determinations. Determining the fair values of assets acquired generally involves assumptions regarding the amounts and timing of future revenues and expenditures, as well as discount rates. For additional discussion of purchase price allocations, refer to Note 29 beginning on page 96.
Contingent Losses Management also makes judgments and estimates in recording liabilities for claims, litigation, tax matters and environmental remediation. Actual costs can frequently vary from estimates for a variety of reasons. For example, the costs for settlement of claims and litigation can vary from estimates based on differing interpretations of laws, opinions on culpability and assessments on the amount of damages. Similarly, liabilities for environmental remediation are subject to change because of changes in laws, regulations and their interpretation, the determination of additional information on the extent and nature of site contamination, and improvements in technology.
Under the accounting rules, a liability is generally recorded for these types of contingencies if management determines the loss to be both probable and estimable. The company generally reports these losses as “Operating expenses” or “Selling, general and administrative expenses” on the Consolidated Statement of Income. An exception to this handling is for income tax matters, for which benefits are recognized only if management determines the tax position is “more likely than not” (i.e., likelihood greater than 50 percent) to be allowed by the tax jurisdiction. For additional discussion of income tax uncertainties, refer to Note 22 beginning on page 92. Refer also to the business segment discussions elsewhere in this section for the effect on earnings from losses associated with certain litigation, environmental remediation and tax matters for the three years ended December 31, 2020.
An estimate as to the sensitivity to earnings for these periods if other assumptions had been used in recording these liabilities is not practicable because of the number of contingencies that must be assessed, the number of underlying assumptions and the wide range of reasonably possible outcomes, both in terms of the probability of loss and the estimates of such loss. For further information, refer to “Changes in management’s estimates and assumptions may have a material
Chevron Corporation 2020 Annual Report 52

Management’s Discussion and Analysis of Financial Condition and Results of Operations
For 2020, the company used an expected long-term rate of return of 6.5 percent and a discount rate for service costs of3.3 percent and a discount rate for interest cost of 2.6 percent for the primary U.S. pension plan. The actual return for 2020was 9.4 percent. For the 10 years ended December 31, 2020, actual asset returns averaged 7.9 percent for this plan.Additionally, with the exception of three years within this 10-year period, actual asset returns for this plan equaled orexceeded 6.5 percent during each year.
Total pension expense for 2020 was $1.5 billion. An increase in the expected long-term return on plan assets or the discountrate would reduce pension plan expense, and vice versa. As an indication of the sensitivity of pension expense to the long-term rate of return assumption, a 1 percent increase in this assumption for the company’s primary U.S. pension plan, whichaccounted for about 67 percent of companywide pension expense, would have reduced total pension plan expense for 2020by approximately $88 million. A 1 percent increase in the discount rates for this same plan would have reduced pensionexpense for 2020 by approximately $269 million.
The aggregate funded status recognized at December 31, 2020, was a net liability of approximately $6.2 billion. An increasein the discount rate would decrease the pension obligation, thus changing the funded status of a plan. At December 31, 2020,the company used a discount rate of 2.4 percent to measure the obligations for the primary U.S. pension plan. As anindication of the sensitivity of pension liabilities to the discount rate assumption, a 0.25 percent increase in the discount rateapplied to the company’s primary U.S. pension plan, which accounted for about 61 percent of the companywide pensionobligation, would have reduced the plan obligation by approximately $475 million, and would have decreased the plan’sunderfunded status from approximately $3.2 billion to $2.8 billion.
For the company’s OPEB plans, expense for 2020 was $57 million, and the total liability, all unfunded at the end of 2020,was $2.7 billion. For the primary U.S. OPEB plan, the company used a discount rate for service cost of 3.4 percent and adiscount rate for interest cost of 2.7 percent to measure expense in 2020, and a 2.4 percent discount rate to measure thebenefit obligations at December 31, 2020. Discount rate changes, similar to those used in the pension sensitivity analysis,resulted in an immaterial impact on 2020 OPEB expense and OPEB liabilities at the end of 2020.
Differences between the various assumptions used to determine expense and the funded status of each plan and actualexperience are included in actuarial gain/loss. Refer to page 88 in Note 21 for more information on the $7.4 billion ofbefore-tax actuarial losses recorded by the company as of December 31, 2020, In addition, information related to companycontributions is included on page 91 in Note 21 under the heading “Cash Contributions and Benefit Payments.”
Business Combinations – Purchase-Price Allocation Accounting for business combinations requires the allocation of thecompany’s purchase price to the various assets and liabilities of the acquired business at their respective fair values. Thecompany uses all available information to make these fair value determinations. Determining the fair values of assetsacquired generally involves assumptions regarding the amounts and timing of future revenues and expenditures, as well asdiscount rates. For additional discussion of purchase price allocations, refer to Note 29 beginning on page 96.
Contingent Losses Management also makes judgments and estimates in recording liabilities for claims, litigation, taxmatters and environmental remediation. Actual costs can frequently vary from estimates for a variety of reasons. Forexample, the costs for settlement of claims and litigation can vary from estimates based on differing interpretations of laws,opinions on culpability and assessments on the amount of damages. Similarly, liabilities for environmental remediation aresubject to change because of changes in laws, regulations and their interpretation, the determination of additional informationon the extent and nature of site contamination, and improvements in technology.
Under the accounting rules, a liability is generally recorded for these types of contingencies if management determines theloss to be both probable and estimable. The company generally reports these losses as “Operating expenses” or “Selling,general and administrative expenses” on the Consolidated Statement of Income. An exception to this handling is for incometax matters, for which benefits are recognized only if management determines the tax position is “more likely than not” (i.e.,likelihood greater than 50 percent) to be allowed by the tax jurisdiction. For additional discussion of income taxuncertainties, refer to Note 22 beginning on page 92. Refer also to the business segment discussions elsewhere in this sectionfor the effect on earnings from losses associated with certain litigation, environmental remediation and tax matters for thethree years ended December 31, 2020.
An estimate as to the sensitivity to earnings for these periods if other assumptions had been used in recording these liabilitiesis not practicable because of the number of contingencies that must be assessed, the number of underlying assumptions andthe wide range of reasonably possible outcomes, both in terms of the probability of loss and the estimates of such loss. Forfurther information, refer to “Changes in management’s estimates and assumptions may have a material
52 53
173155_Annual_Report_10-K.indd 53173155_Annual_Report_10-K.indd 53 3/5/21 6:04 PM3/5/21 6:04 PM
Management’s Discussion and Analysis of Financial Condition and Results of Operations
impact on the company’s consolidated financial statements and financial or operational performance in any given period” in “Risk Factors” in Part I, Item 1A, on page 23 of the company’s Annual Report on Form 10-K.
New Accounting Standards
Refer to Note 4 beginning on page 69 for information regarding new accounting standards.
Chevron Corporation 2020 Annual Report 53

54
Management’s Responsibility for Financial Statements
To the Stockholders of Chevron Corporation
Management of Chevron Corporation is responsible for preparing the accompanying consolidated financial statements andthe related information appearing in this report. The statements were prepared in accordance with accounting principlesgenerally accepted in the United States of America and fairly represent the transactions and financial position of thecompany. The financial statements include amounts that are based on management’s best estimates and judgments.
As stated in its report included herein, the independent registered public accounting firm of PricewaterhouseCoopers LLPhas audited the company’s consolidated financial statements in accordance with the standards of the Public CompanyAccounting Oversight Board (United States).
The Board of Directors of Chevron has an Audit Committee composed of directors who are not officers or employees ofthe company. The Audit Committee meets regularly with members of management, the internal auditors and theindependent registered public accounting firm to review accounting, internal control, auditing and financial reportingmatters. Both the internal auditors and the independent registered public accounting firm have free and direct access to theAudit Committee without the presence of management.
The company’s management has evaluated, with the participation of the Chief Executive Officer and Chief FinancialOfficer, the effectiveness of the company’s disclosure controls and procedures (as defined in the Exchange Act Rules13a-15(e) and 15d-15(e)) as of December 31, 2020. Based on that evaluation, management concluded that the company’sdisclosure controls are effective in ensuring that information required to be recorded, processed, summarized andreported, are done within the time periods specified in the U.S. Securities and Exchange Commission’s rules and forms.
Management’s Report on Internal Control Over Financial Reporting
The company’s management is responsible for establishing and maintaining adequate internal control over financialreporting, as defined in the Exchange Act Rules 13a-15(f) and 15d-15(f). The company’s management, including theChief Executive Officer and Chief Financial Officer, conducted an evaluation of the effectiveness of the company’sinternal control over financial reporting based on the Internal Control – Integrated Framework (2013) issued by theCommittee of Sponsoring Organizations of the Treadway Commission (COSO). Based on the results of this evaluation,the company’s management concluded that internal control over financial reporting was effective as of December 31,2020.
The company excluded Noble from our assessment of internal control over financial reporting as of December 31, 2020because it was acquired by the company in a business combination during 2020. Total assets and total revenues of Noble,a wholly-owned subsidiary, represent eight percent and one percent, respectively, of the related consolidated financialstatement amounts as of and for the year ended December 31, 2020.
The effectiveness of the company’s internal control over financial reporting as of December 31, 2020, has been audited byPricewaterhouseCoopers LLP, an independent registered public accounting firm, as stated in its report included herein.
Michael K. Wirth Pierre R. Breber David A. InchaustiChairman of the Board Vice President Vice Presidentand Chief Executive Officer and Chief Financial Officer and Controller
February 25, 2021
55
173155_Annual_Report_10-K.indd 54173155_Annual_Report_10-K.indd 54 3/5/21 6:04 PM3/5/21 6:04 PM
Quarterly Results Unaudited
2020 2019
Millions of dollars, except per-share amounts 4th Q 3rd Q 2nd Q 1st Q 4th Q 3rd Q 2nd Q 1st Q
Revenues and Other Income
Sales and other operating revenues $ 24,843 $ 23,997 $ 15,926 $ 29,705 $ 34,574 $ 34,779 $ 36,323 $ 34,189
Income from equity affiliates 568 510 (2,515) 965 538 1,172 1,196 1,062
Other income (165) (56) 83 831 1,238 165 1,331 (51)
Total Revenues and Other Income 25,246 24,451 13,494 31,501 36,350 36,116 38,850 35,200
Costs and Other Deductions
Purchased crude oil and products 13,387 13,448 8,144 15,509 19,693 19,882 20,835 19,703
Operating expenses 4,898 4,604 5,530 5,291 5,987 5,325 5,187 4,886
Selling, general and administrative expenses 1,129 832 1,569 683 1,129 954 1,076 984
Exploration expenses 367 117 895 158 272 168 141 189
Depreciation, depletion and amortization 4,486 4,017 6,717 4,288 16,429 4,361 4,334 4,094
Taxes other than on income 1,276 1,091 965 1,167 969 1,059 1,047 1,061
Interest and debt expense 199 164 172 162 178 197 198 225
Other components of net periodic benefit costs 461 222 99 98 98 121 97 101
Total Costs and Other Deductions 26,203 24,495 24,091 27,356 44,755 32,067 32,915 31,243
Income (Loss) Before Income Tax Expense (957) (44) (10,597) 4,145 (8,405) 4,049 5,935 3,957 Income Tax Expense (Benefit) (301) 165 (2,320) 564 (1,738) 1,469 1,645 1,315
Net Income (Loss) $ (656) $ (209) $ (8,277) $ 3,581 $ (6,667) $ 2,580 $ 4,290 $ 2,642
Less: Net income attributable to noncontrolling interests 9 (2) (7) (18) (57) — (15) (7)
Net Income (Loss) Attributable to Chevron Corporation $ (665) $ (207) $ (8,270) $ 3,599 $ (6,610) $ 2,580 $ 4,305 $ 2,649
Per Share of Common Stock Net Income (Loss) Attributable to Chevron
Corporation – Basic $ (0.33) $ (0.12) $ (4.44) $ 1.93 $ (3.51) $ 1.38 $ 2.28 $ 1.40 – Diluted $ (0.33) $ (0.12) $ (4.44) $ 1.93 $ (3.51) $ 1.36 $ 2.27 $ 1.39
Dividends per share $ 1.29 $ 1.29 $ 1.29 $ 1.29 $ 1.19 $ 1.19 $ 1.19 $ 1.19
Chevron Corporation 2020 Annual Report 54

Quarterly ResultsUnaudited
2020 2019
Millions of dollars, except per-share amounts 4th Q 3rd Q 2nd Q 1st Q 4th Q 3rd Q 2nd Q 1st Q
Revenues and Other Income
Sales and other operating revenues $ 24,843 $ 23,997 $ 15,926 $ 29,705 $ 34,574 $ 34,779 $ 36,323 $ 34,189
Income from equity affiliates 568 510 (2,515) 965 538 1,172 1,196 1,062
Other income (165) (56) 83 831 1,238 165 1,331 (51)
Total Revenues and Other Income 25,246 24,451 13,494 31,501 36,350 36,116 38,850 35,200
Costs and Other Deductions
Purchased crude oil and products 13,387 13,448 8,144 15,509 19,693 19,882 20,835 19,703
Operating expenses 4,898 4,604 5,530 5,291 5,987 5,325 5,187 4,886
Selling, general and administrative expenses 1,129 832 1,569 683 1,129 954 1,076 984
Exploration expenses 367 117 895 158 272 168 141 189
Depreciation, depletion and amortization 4,486 4,017 6,717 4,288 16,429 4,361 4,334 4,094
Taxes other than on income 1,276 1,091 965 1,167 969 1,059 1,047 1,061
Interest and debt expense 199 164 172 162 178 197 198 225
Other components of net periodic benefit costs 461 222 99 98 98 121 97 101
Total Costs and Other Deductions 26,203 24,495 24,091 27,356 44,755 32,067 32,915 31,243
Income (Loss) Before Income Tax Expense (957) (44) (10,597) 4,145 (8,405) 4,049 5,935 3,957Income Tax Expense (Benefit) (301) 165 (2,320) 564 (1,738) 1,469 1,645 1,315
Net Income (Loss) $ (656) $ (209) $ (8,277) $ 3,581 $ (6,667) $ 2,580 $ 4,290 $ 2,642
Less: Net income attributable to noncontrolling interests 9 (2) (7) (18) (57) — (15) (7)
Net Income (Loss) Attributable to Chevron Corporation $ (665) $ (207) $ (8,270) $ 3,599 $ (6,610) $ 2,580 $ 4,305 $ 2,649
Per Share of Common StockNet Income (Loss) Attributable to Chevron
Corporation– Basic $ (0.33) $ (0.12) $ (4.44) $ 1.93 $ (3.51) $ 1.38 $ 2.28 $ 1.40
– Diluted $ (0.33) $ (0.12) $ (4.44) $ 1.93 $ (3.51) $ 1.36 $ 2.27 $ 1.39
Dividends per share $ 1.29 $ 1.29 $ 1.29 $ 1.29 $ 1.19 $ 1.19 $ 1.19 $ 1.19
54 55
173155_Annual_Report_10-K.r1.indd 55173155_Annual_Report_10-K.r1.indd 55 3/12/21 4:55 PM3/12/21 4:55 PM
Management’s Responsibility for Financial Statements
To the Stockholders of Chevron Corporation
Management of Chevron Corporation is responsible for preparing the accompanying consolidated financial statements and the related information appearing in this report. The statements were prepared in accordance with accounting principles generally accepted in the United States of America and fairly represent the transactions and financial position of the company. The financial statements include amounts that are based on management’s best estimates and judgments.
As stated in its report included herein, the independent registered public accounting firm of PricewaterhouseCoopers LLP has audited the company’s consolidated financial statements in accordance with the standards of the Public Company Accounting Oversight Board (United States).
The Board of Directors of Chevron has an Audit Committee composed of directors who are not officers or employees of the company. The Audit Committee meets regularly with members of management, the internal auditors and the independent registered public accounting firm to review accounting, internal control, auditing and financial reporting matters. Both the internal auditors and the independent registered public accounting firm have free and direct access to the Audit Committee without the presence of management.
The company’s management has evaluated, with the participation of the Chief Executive Officer and Chief Financial Officer, the effectiveness of the company’s disclosure controls and procedures (as defined in the Exchange Act Rules 13a-15(e) and 15d-15(e)) as of December 31, 2020. Based on that evaluation, management concluded that the company’s disclosure controls are effective in ensuring that information required to be recorded, processed, summarized and reported, are done within the time periods specified in the U.S. Securities and Exchange Commission’s rules and forms.
Management’s Report on Internal Control Over Financial Reporting
The company’s management is responsible for establishing and maintaining adequate internal control over financial reporting, as defined in the Exchange Act Rules 13a-15(f) and 15d-15(f). The company’s management, including the Chief Executive Officer and Chief Financial Officer, conducted an evaluation of the effectiveness of the company’s internal control over financial reporting based on the Internal Control – Integrated Framework (2013) issued by the Committee of Sponsoring Organizations of the Treadway Commission (COSO). Based on the results of this evaluation, the company’s management concluded that internal control over financial reporting was effective as of December 31, 2020.
The company excluded Noble from our assessment of internal control over financial reporting as of December 31, 2020 because it was acquired by the company in a business combination during 2020. Total assets and total revenues of Noble, a wholly-owned subsidiary, represent eight percent and one percent, respectively, of the related consolidated financial statement amounts as of and for the year ended December 31, 2020.
The effectiveness of the company’s internal control over financial reporting as of December 31, 2020, has been audited by PricewaterhouseCoopers LLP, an independent registered public accounting firm, as stated in its report included herein.
Michael K. Wirth Chairman of the Board and Chief Executive Officer
Pierre R. Breber Vice President and Chief Financial Officer
David A. Inchausti Vice President and Controller
February 25, 2021
Chevron Corporation 2020 Annual Report 55

56
detection of unauthorized acquisition, use, or disposition of the company’s assets that could have a material effect on thefinancial statements.
Because of its inherent limitations, internal control over financial reporting may not prevent or detect misstatements. Also,projections of any evaluation of effectiveness to future periods are subject to the risk that controls may become inadequatebecause of changes in conditions, or that the degree of compliance with the policies or procedures may deteriorate.
Critical Audit Matters
The critical audit matters communicated below are matters arising from the current period audit of the consolidatedfinancial statements that were communicated or required to be communicated to the audit committee and that (i) relate toaccounts or disclosures that are material to the consolidated financial statements and (ii) involved our especiallychallenging, subjective, or complex judgments. The communication of critical audit matters does not alter in any way ouropinion on the consolidated financial statements, taken as a whole, and we are not, by communicating the critical auditmatters below, providing separate opinions on the critical audit matters or on the accounts or disclosures to which theyrelate.
The Impact of Proved Crude Oil and Natural Gas Reserves on Upstream Property, Plant, and Equipment, Net
As described in Notes 1 and 16 to the consolidated financial statements, the Company’s upstream property, plant andequipment, net balance was $140.2 billion as of December 31, 2020, and depreciation, depletion and amortization expensewas $18.0 billion, including impairments of $2.8 billion for the year ended December 31, 2020. The Company follows thesuccessful efforts method of accounting for crude oil and natural gas exploration and production activities. Depreciationand depletion of all capitalized costs of proved crude oil and natural gas producing properties, except mineral interests, areexpensed using the unit-of-production method, generally by individual field, as the proved developed reserves areproduced. Depletion expenses for capitalized costs of proved mineral interests are recognized using the unit-of-productionmethod by individual field as the related proved reserves are produced. As disclosed by management, variables impactingthe Company’s estimated volumes of crude oil and natural gas reserves include field performance, available technology,commodity prices, and development and production costs. Reserves are estimated by Company asset teams composed ofearth scientists and engineers. As part of the internal control process related to reserves estimation, the Companymaintains a Reserves Advisory Committee (RAC) (the Company’s earth scientists, engineers and RAC are collectivelyreferred to as “management’s specialists”).
The principal considerations for our determination that performing procedures relating to the impact of proved crude oiland natural gas reserves on upstream property, plant, and equipment, net is a critical audit matter are (i) the significantjudgment by management, including the use of management’s specialists, when developing the estimates of proved crudeoil and natural gas reserves, which in turn led to (ii) a high degree of auditor judgment, subjectivity, and effort inperforming procedures and evaluating audit evidence obtained related to the data, methods and assumptions used bymanagement and its specialists in developing the estimates of crude oil and natural gas reserve volumes.
Addressing the matter involved performing procedures and evaluating audit evidence in connection with forming ouroverall opinion on the consolidated financial statements. These procedures included testing the effectiveness of controlsrelating to management’s estimates of proved crude oil and natural gas reserves. The work of management’s specialistswas used in performing the procedures to evaluate the reasonableness of the proved crude oil and natural gas reservevolumes. As a basis for using this work, the specialists’ qualifications were understood and the Company’s relationshipwith the specialists was assessed. The procedures performed also included evaluation of the methods and assumptionsused by the specialists, tests of the data used by the specialists and an evaluation of the specialists’ findings.
Acquisition of Noble Energy, Inc.—Valuation of Crude Oil and Natural Gas Properties
As described in Note 29 to the consolidated financial statements, the Company acquired Noble Energy, Inc. (“Noble”) inan acquisition accounted for as a business combination, which required assets acquired and liabilities assumed to bemeasured at their acquisition date fair values, including approximately $15 billion related to the fair values of acquired oiland gas properties. Management applied significant judgment in estimating the fair value of properties acquired, whichinvolved use of a discounted cash flow approach that incorporated internally generated price assumptions and productionprofiles, and operating cost and development cost assumptions.
The principal considerations for our determination that performing procedures relating to the valuation of crude oil andnatural gas properties from the acquisition of Noble is a critical audit matter are (i) the significant judgment bymanagement, including the use of management’s specialists as defined in the previous Critical Audit Matter, whendeveloping the fair value measurement of acquired crude oil and natural gas properties; (ii) a high degree of auditorjudgment, subjectivity, and effort in performing procedures and evaluating significant assumptions used in the discountedcash flow approach related to price, production profiles and discount rates; and (iii) the audit effort involved the use ofprofessionals with specialized skill and knowledge.
57
173155_Annual_Report_10-K.indd 56173155_Annual_Report_10-K.indd 56 3/5/21 6:04 PM3/5/21 6:04 PM
Report of Independent Registered Public Accounting Firm
To the Board of Directors and Shareholders of Chevron Corporation:
Opinions on the Financial Statements and Internal Control over Financial Reporting
We have audited the accompanying consolidated balance sheet of Chevron Corporation and its subsidiaries (the “Company”) as of December 31, 2020 and 2019, and the related consolidated statements of income, of comprehensive income, of equity and of cash flows for each of the three years in the period ended December 31, 2020, including the related notes (collectively referred to as the “consolidated financial statements”). We also have audited the Company’s internal control over financial reporting as of December 31, 2020, based on criteria established in Internal Control— Integrated Framework (2013) issued by the Committee of Sponsoring Organizations of the Treadway Commission (COSO).
In our opinion, the consolidated financial statements referred to above present fairly, in all material respects, the financial position of the Company as of December 31, 2020 and 2019, and the results of its operations and its cash flows for each of the three years in the period ended December 31, 2020 in conformity with accounting principles generally accepted in the United States of America. Also in our opinion, the Company maintained, in all material respects, effective internal control over financial reporting as of December 31, 2020, based on criteria established in Internal Control—Integrated Framework (2013) issued by the COSO.
Basis for Opinions
The Company’s management is responsible for these consolidated financial statements, for maintaining effective internal control over financial reporting, and for its assessment of the effectiveness of internal control over financial reporting, included in the accompanying Management’s Report on Internal Control Over Financial Reporting. Our responsibility is to express opinions on the Company’s consolidated financial statements and on the Company’s internal control over financial reporting based on our audits. We are a public accounting firm registered with the Public Company Accounting Oversight Board (United States) (PCAOB) and are required to be independent with respect to the Company in accordance with the U.S. federal securities laws and the applicable rules and regulations of the Securities and Exchange Commission and the PCAOB.
We conducted our audits in accordance with the standards of the PCAOB. Those standards require that we plan and perform the audits to obtain reasonable assurance about whether the consolidated financial statements are free of material misstatement, whether due to error or fraud, and whether effective internal control over financial reporting was maintained in all material respects.
Our audits of the consolidated financial statements included performing procedures to assess the risks of material misstatement of the consolidated financial statements, whether due to error or fraud, and performing procedures that respond to those risks. Such procedures included examining, on a test basis, evidence regarding the amounts and disclosures in the consolidated financial statements. Our audits also included evaluating the accounting principles used and significant estimates made by management, as well as evaluating the overall presentation of the consolidated financial statements. Our audit of internal control over financial reporting included obtaining an understanding of internal control over financial reporting, assessing the risk that a material weakness exists, and testing and evaluating the design and operating effectiveness of internal control based on the assessed risk. Our audits also included performing such other procedures as we considered necessary in the circumstances. We believe that our audits provide a reasonable basis for our opinions.
As described in Management’s Report on Internal Control Over Financial Reporting, management has excluded Noble Energy, Inc. from its assessment of internal control over financial reporting as of December 31, 2020 because it was acquired by the Company in a purchase business combination during 2020. We have also excluded Noble Energy, Inc. from our audit of internal control over financial reporting. Noble Energy, Inc. is a wholly-owned subsidiary whose total assets and total revenues excluded from management’s assessment and our audit of internal control over financial reporting represent eight percent and one percent, respectively, of the related consolidated financial statement amounts as of and for the year ended December 31, 2020.
Definition and Limitations of Internal Control over Financial Reporting
A company’s internal control over financial reporting is a process designed to provide reasonable assurance regarding the reliability of financial reporting and the preparation of financial statements for external purposes in accordance with generally accepted accounting principles. A company’s internal control over financial reporting includes those policies and procedures that (i) pertain to the maintenance of records that, in reasonable detail, accurately and fairly reflect the transactions and dispositions of the assets of the company; (ii) provide reasonable assurance that transactions are recorded as necessary to permit preparation of financial statements in accordance with generally accepted accounting principles, and that receipts and expenditures of the company are being made only in accordance with authorizations of management and directors of the company; and (iii) provide reasonable assurance regarding prevention or timely
Chevron Corporation 2020 Annual Report 56

Report of Independent Registered Public Accounting Firm
To the Board of Directors and Shareholders of Chevron Corporation:
Opinions on the Financial Statements and Internal Control over Financial Reporting
We have audited the accompanying consolidated balance sheet of Chevron Corporation and its subsidiaries (the“Company”) as of December 31, 2020 and 2019, and the related consolidated statements of income, of comprehensiveincome, of equity and of cash flows for each of the three years in the period ended December 31, 2020, including therelated notes (collectively referred to as the “consolidated financial statements”). We also have audited the Company’sinternal control over financial reporting as of December 31, 2020, based on criteria established in Internal Control—Integrated Framework (2013) issued by the Committee of Sponsoring Organizations of the Treadway Commission(COSO).
In our opinion, the consolidated financial statements referred to above present fairly, in all material respects, the financialposition of the Company as of December 31, 2020 and 2019, and the results of its operations and its cash flows for each ofthe three years in the period ended December 31, 2020 in conformity with accounting principles generally accepted in theUnited States of America. Also in our opinion, the Company maintained, in all material respects, effective internal controlover financial reporting as of December 31, 2020, based on criteria established in Internal Control—IntegratedFramework (2013) issued by the COSO.
Basis for Opinions
The Company’s management is responsible for these consolidated financial statements, for maintaining effective internalcontrol over financial reporting, and for its assessment of the effectiveness of internal control over financial reporting,included in the accompanying Management’s Report on Internal Control Over Financial Reporting. Our responsibility isto express opinions on the Company’s consolidated financial statements and on the Company’s internal control overfinancial reporting based on our audits. We are a public accounting firm registered with the Public Company AccountingOversight Board (United States) (PCAOB) and are required to be independent with respect to the Company in accordancewith the U.S. federal securities laws and the applicable rules and regulations of the Securities and Exchange Commissionand the PCAOB.
We conducted our audits in accordance with the standards of the PCAOB. Those standards require that we plan andperform the audits to obtain reasonable assurance about whether the consolidated financial statements are free of materialmisstatement, whether due to error or fraud, and whether effective internal control over financial reporting wasmaintained in all material respects.
Our audits of the consolidated financial statements included performing procedures to assess the risks of materialmisstatement of the consolidated financial statements, whether due to error or fraud, and performing procedures thatrespond to those risks. Such procedures included examining, on a test basis, evidence regarding the amounts anddisclosures in the consolidated financial statements. Our audits also included evaluating the accounting principles usedand significant estimates made by management, as well as evaluating the overall presentation of the consolidated financialstatements. Our audit of internal control over financial reporting included obtaining an understanding of internal controlover financial reporting, assessing the risk that a material weakness exists, and testing and evaluating the design andoperating effectiveness of internal control based on the assessed risk. Our audits also included performing such otherprocedures as we considered necessary in the circumstances. We believe that our audits provide a reasonable basis for ouropinions.
As described in Management’s Report on Internal Control Over Financial Reporting, management has excluded NobleEnergy, Inc. from its assessment of internal control over financial reporting as of December 31, 2020 because it wasacquired by the Company in a purchase business combination during 2020. We have also excluded Noble Energy, Inc.from our audit of internal control over financial reporting. Noble Energy, Inc. is a wholly-owned subsidiary whose totalassets and total revenues excluded from management’s assessment and our audit of internal control over financialreporting represent eight percent and one percent, respectively, of the related consolidated financial statement amounts asof and for the year ended December 31, 2020.
Definition and Limitations of Internal Control over Financial Reporting
A company’s internal control over financial reporting is a process designed to provide reasonable assurance regarding thereliability of financial reporting and the preparation of financial statements for external purposes in accordance withgenerally accepted accounting principles. A company’s internal control over financial reporting includes those policiesand procedures that (i) pertain to the maintenance of records that, in reasonable detail, accurately and fairly reflect thetransactions and dispositions of the assets of the company; (ii) provide reasonable assurance that transactions are recordedas necessary to permit preparation of financial statements in accordance with generally accepted accounting principles,and that receipts and expenditures of the company are being made only in accordance with authorizations of managementand directors of the company; and (iii) provide reasonable assurance regarding prevention or timely
56 57
173155_Annual_Report_10-K.indd 57173155_Annual_Report_10-K.indd 57 3/5/21 6:04 PM3/5/21 6:04 PM
detection of unauthorized acquisition, use, or disposition of the company’s assets that could have a material effect on the financial statements.
Because of its inherent limitations, internal control over financial reporting may not prevent or detect misstatements. Also, projections of any evaluation of effectiveness to future periods are subject to the risk that controls may become inadequate because of changes in conditions, or that the degree of compliance with the policies or procedures may deteriorate.
Critical Audit Matters
The critical audit matters communicated below are matters arising from the current period audit of the consolidated financial statements that were communicated or required to be communicated to the audit committee and that (i) relate to accounts or disclosures that are material to the consolidated financial statements and (ii) involved our especially challenging, subjective, or complex judgments. The communication of critical audit matters does not alter in any way our opinion on the consolidated financial statements, taken as a whole, and we are not, by communicating the critical audit matters below, providing separate opinions on the critical audit matters or on the accounts or disclosures to which they relate.
The Impact of Proved Crude Oil and Natural Gas Reserves on Upstream Property, Plant, and Equipment, Net
As described in Notes 1 and 16 to the consolidated financial statements, the Company’s upstream property, plant and equipment, net balance was $140.2 billion as of December 31, 2020, and depreciation, depletion and amortization expense was $18.0 billion, including impairments of $2.8 billion for the year ended December 31, 2020. The Company follows the successful efforts method of accounting for crude oil and natural gas exploration and production activities. Depreciation and depletion of all capitalized costs of proved crude oil and natural gas producing properties, except mineral interests, are expensed using the unit-of-production method, generally by individual field, as the proved developed reserves are produced. Depletion expenses for capitalized costs of proved mineral interests are recognized using the unit-of-production method by individual field as the related proved reserves are produced. As disclosed by management, variables impacting the Company’s estimated volumes of crude oil and natural gas reserves include field performance, available technology, commodity prices, and development and production costs. Reserves are estimated by Company asset teams composed of earth scientists and engineers. As part of the internal control process related to reserves estimation, the Company maintains a Reserves Advisory Committee (RAC) (the Company’s earth scientists, engineers and RAC are collectively referred to as “management’s specialists”).
The principal considerations for our determination that performing procedures relating to the impact of proved crude oil and natural gas reserves on upstream property, plant, and equipment, net is a critical audit matter are (i) the significant judgment by management, including the use of management’s specialists, when developing the estimates of proved crude oil and natural gas reserves, which in turn led to (ii) a high degree of auditor judgment, subjectivity, and effort in performing procedures and evaluating audit evidence obtained related to the data, methods and assumptions used by management and its specialists in developing the estimates of crude oil and natural gas reserve volumes.
Addressing the matter involved performing procedures and evaluating audit evidence in connection with forming our overall opinion on the consolidated financial statements. These procedures included testing the effectiveness of controls relating to management’s estimates of proved crude oil and natural gas reserves. The work of management’s specialists was used in performing the procedures to evaluate the reasonableness of the proved crude oil and natural gas reserve volumes. As a basis for using this work, the specialists’ qualifications were understood and the Company’s relationship with the specialists was assessed. The procedures performed also included evaluation of the methods and assumptions used by the specialists, tests of the data used by the specialists and an evaluation of the specialists’ findings.
Acquisition of Noble Energy, Inc.—Valuation of Crude Oil and Natural Gas Properties
As described in Note 29 to the consolidated financial statements, the Company acquired Noble Energy, Inc. (“Noble”) in an acquisition accounted for as a business combination, which required assets acquired and liabilities assumed to be measured at their acquisition date fair values, including approximately $15 billion related to the fair values of acquired oil and gas properties. Management applied significant judgment in estimating the fair value of properties acquired, which involved use of a discounted cash flow approach that incorporated internally generated price assumptions and production profiles, and operating cost and development cost assumptions.
The principal considerations for our determination that performing procedures relating to the valuation of crude oil and natural gas properties from the acquisition of Noble is a critical audit matter are (i) the significant judgment by management, including the use of management’s specialists as defined in the previous Critical Audit Matter, when developing the fair value measurement of acquired crude oil and natural gas properties; (ii) a high degree of auditor judgment, subjectivity, and effort in performing procedures and evaluating significant assumptions used in the discounted cash flow approach related to price, production profiles and discount rates; and (iii) the audit effort involved the use of professionals with specialized skill and knowledge.
Chevron Corporation 2020 Annual Report 57

58
Consolidated Statement of IncomeMillions of dollars, except per-share amounts
Year ended December 31
2020 2019 2018
Revenues and Other IncomeSales and other operating revenues $ 94,471 $ 139,865 $ 158,902Income (loss) from equity affiliates (472) 3,968 6,327Other income 693 2,683 1,110
Total Revenues and Other Income 94,692 146,516 166,339
Costs and Other DeductionsPurchased crude oil and products 50,488 80,113 94,578Operating expenses 20,323 21,385 20,544Selling, general and administrative expenses 4,213 4,143 3,838Exploration expenses 1,537 770 1,210Depreciation, depletion and amortization 19,508 29,218 19,419Taxes other than on income 4,499 4,136 4,867Interest and debt expense 697 798 748Other components of net periodic benefit costs 880 417 560
Total Costs and Other Deductions 102,145 140,980 145,764
Income (Loss) Before Income Tax Expense (7,453) 5,536 20,575Income Tax Expense (Benefit) (1,892) 2,691 5,715
Net Income (Loss) (5,561) 2,845 14,860Less: Net income (loss) attributable to noncontrolling interests (18) (79) 36
Net Income (Loss) Attributable to Chevron Corporation $ (5,543) $ 2,924 $ 14,824
Per Share of Common StockNet Income (Loss) Attributable to Chevron Corporation
- Basic $ (2.96) $ 1.55 $ 7.81- Diluted $ (2.96) $ 1.54 $ 7.74
See accompanying Notes to the Consolidated Financial Statements.
59
173155_Annual_Report_10-K.indd 58173155_Annual_Report_10-K.indd 58 3/5/21 6:04 PM3/5/21 6:04 PM
Addressing the matter involved performing procedures and evaluating audit evidence in connection with forming our overall opinion on the consolidated financial statements. These procedures included testing the effectiveness of controls relating to the valuation of acquired crude oil and natural gas properties. These procedures also included, among others, (i) testing management’s process for developing the fair value measurement of the acquired crude oil and natural gas properties; (ii) evaluating the appropriateness of the discounted cash flow approach; (iii) testing the completeness and accuracy of underlying data used in the discounted cash flow approach; and (iv) evaluating the reasonableness of significant assumptions used by management related to price, production profiles and discount rates. Evaluating production profile assumptions involved evaluating the reasonableness of the assumptions as compared to historical results of Noble, as well as third party data. Evaluating price assumptions involved comparing the prices to third party data and underlying contracts. Professionals with specialized skill and knowledge were used to assist in the evaluation of the discounted cash flow approach and discount rates used. The work of management’s specialists was used in performing the procedures to evaluate the reasonableness of the proved crude oil and natural gas reserve volumes included in production profile assumptions as stated in the Critical Audit Matter titled “The Impact of Proved Crude Oil and Natural Gas Reserves on Upstream Property, Plant, and Equipment, Net”. As a basis for using this work, the specialists’ qualifications were understood, and the Company’s relationship with the specialists was assessed. The procedures performed also included evaluation of the methods and assumptions used by the specialists, tests of the data used by the specialists, and an evaluation of the specialists’ findings.
San Francisco, California
February 25, 2021
We have served as the Company’s auditor since 1935.
Chevron Corporation 2020 Annual Report 58

Addressing the matter involved performing procedures and evaluating audit evidence in connection with forming ouroverall opinion on the consolidated financial statements. These procedures included testing the effectiveness of controlsrelating to the valuation of acquired crude oil and natural gas properties. These procedures also included, among others,(i) testing management’s process for developing the fair value measurement of the acquired crude oil and natural gasproperties; (ii) evaluating the appropriateness of the discounted cash flow approach; (iii) testing the completeness andaccuracy of underlying data used in the discounted cash flow approach; and (iv) evaluating the reasonableness ofsignificant assumptions used by management related to price, production profiles and discount rates. Evaluatingproduction profile assumptions involved evaluating the reasonableness of the assumptions as compared to historicalresults of Noble, as well as third party data. Evaluating price assumptions involved comparing the prices to third partydata and underlying contracts. Professionals with specialized skill and knowledge were used to assist in the evaluation ofthe discounted cash flow approach and discount rates used. The work of management’s specialists was used in performingthe procedures to evaluate the reasonableness of the proved crude oil and natural gas reserve volumes included inproduction profile assumptions as stated in the Critical Audit Matter titled “The Impact of Proved Crude Oil and NaturalGas Reserves on Upstream Property, Plant, and Equipment, Net”. As a basis for using this work, the specialists’qualifications were understood, and the Company’s relationship with the specialists was assessed. The proceduresperformed also included evaluation of the methods and assumptions used by the specialists, tests of the data used by thespecialists, and an evaluation of the specialists’ findings.
San Francisco, California
February 25, 2021
We have served as the Company’s auditor since 1935.
58 59
173155_Annual_Report_10-K.indd 59173155_Annual_Report_10-K.indd 59 3/5/21 6:04 PM3/5/21 6:04 PM
Consolidated Statement of Income Millions of dollars, except per-share amounts
Year ended December 31
2020 2019 2018
Revenues and Other Income Sales and other operating revenues $ 94,471 $ 139,865 $ 158,902 Income (loss) from equity affiliates (472) 3,968 6,327 Other income 693 2,683 1,110
Total Revenues and Other Income 94,692 146,516 166,339
Costs and Other Deductions Purchased crude oil and products 50,488 80,113 94,578 Operating expenses 20,323 21,385 20,544 Selling, general and administrative expenses 4,213 4,143 3,838 Exploration expenses 1,537 770 1,210 Depreciation, depletion and amortization 19,508 29,218 19,419 Taxes other than on income 4,499 4,136 4,867 Interest and debt expense 697 798 748 Other components of net periodic benefit costs 880 417 560
Total Costs and Other Deductions 102,145 140,980 145,764
Income (Loss) Before Income Tax Expense (7,453) 5,536 20,575 Income Tax Expense (Benefit) (1,892) 2,691 5,715
Net Income (Loss) (5,561) 2,845 14,860 Less: Net income (loss) attributable to noncontrolling interests (18) (79) 36
Net Income (Loss) Attributable to Chevron Corporation $ (5,543) $ 2,924 $ 14,824
Per Share of Common Stock Net Income (Loss) Attributable to Chevron Corporation
- Basic $ (2.96) $ 1.55 $ 7.81 - Diluted $ (2.96) $ 1.54 $ 7.74
See accompanying Notes to the Consolidated Financial Statements.
Chevron Corporation 2020 Annual Report 59

60
Consolidated Balance SheetMillions of dollars, except per-share amounts
At December 31
2020 2019
AssetsCash and cash equivalents $ 5,596 $ 5,686Marketable securities 31 63Accounts and notes receivable (less allowance: 2020 - $284; 2019 - $746) 11,471 13,325Inventories:
Crude oil and petroleum products 3,576 3,722Chemicals 457 492Materials, supplies and other 1,643 1,634
Total inventories 5,676 5,848Prepaid expenses and other current assets 3,304 3,407
Total Current Assets 26,078 28,329Long-term receivables, net 589 1,511Investments and advances 39,052 38,688Properties, plant and equipment, at cost 345,232 326,722Less: Accumulated depreciation, depletion and amortization 188,614 176,228
Properties, plant and equipment, net 156,618 150,494Deferred charges and other assets 11,950 10,532Goodwill 4,402 4,463Assets held for sale 1,101 3,411
Total Assets $ 239,790 $ 237,428
Liabilities and EquityShort-term debt $ 1,548 $ 3,282Accounts payable 10,950 14,103Accrued liabilities 7,812 6,589Federal and other taxes on income 921 1,554Other taxes payable 952 1,002
Total Current Liabilities 22,183 26,530Long-term debt1 42,767 23,691Deferred credits and other noncurrent obligations 20,328 20,445Noncurrent deferred income taxes 12,569 13,688Noncurrent employee benefit plans 9,217 7,866
Total Liabilities2 $ 107,064 $ 92,220
Preferred stock (authorized 100,000,000 shares; $1.00 par value; none issued) — —Common stock (authorized 6,000,000,000 shares; $0.75 par value; 2,442,676,580 shares
issued at December 31, 2020 and 2019) 1,832 1,832Capital in excess of par value 16,829 17,265Retained earnings 160,377 174,945Accumulated other comprehensive losses (5,612) (4,990)Deferred compensation and benefit plan trust (240) (240)Treasury stock, at cost (2020 - 517,490,263 shares; 2019 - 560,508,479 shares) (41,498) (44,599)
Total Chevron Corporation Stockholders’ Equity 131,688 144,213
Noncontrolling interests (2020 includes $120 redeemable noncontrolling interest) 1,038 995
Total Equity 132,726 145,208
Total Liabilities and Equity $ 239,790 $ 237,428
1 Includes finance lease liabilities of $447 and $282 at December 31, 2020 and 2019, respectively.2 Refer to Note 22, “Other Contingencies and Commitments” beginning on page 92.
See accompanying Notes to the Consolidated Financial Statements.
61
173155_Annual_Report_10-K.indd 60173155_Annual_Report_10-K.indd 60 3/5/21 6:04 PM3/5/21 6:04 PM
Consolidated Statement of Comprehensive Income Millions of dollars
Year ended December 31
2020 2019 2018
Net Income (Loss) $ (5,561) $ 2,845 $ 14,860
Currency translation adjustment Unrealized net change arising during period 35 (18) (19)
Unrealized holding gain (loss) on securities Net gain (loss) arising during period (2) 2 (5)
Derivatives Net derivatives loss on hedge transactions — (1) — Income taxes on derivatives transactions — 3 —
Total — 2 —
Defined benefit plans Actuarial gain (loss)
Amortization to net income of net actuarial loss and settlements 1,107 519 792 Actuarial gain (loss) arising during period
Prior service credits (cost) (2,004) (2,404) 85
Amortization to net income of net prior service costs and curtailments (23) 4 (13) Prior service (costs) credits arising during period — (28) (26)
Defined benefit plans sponsored by equity affiliates - benefit (cost) (104) (33) 23 Income tax benefit (cost) on defined benefit plans 369 510 (230)
Total (655) (1,432) 631
Other Comprehensive Gain (Loss), Net of Tax (622) (1,446) 607
Comprehensive Income (6,183) 1,399 15,467
Comprehensive loss (income) attributable to noncontrolling interests 18 79 (36)
Comprehensive Income (Loss) Attributable to Chevron Corporation $ (6,165) $ 1,478 $ 15,431
See accompanying Notes to the Consolidated Financial Statements.
Chevron Corporation 2020 Annual Report 60

Consolidated Statement of Comprehensive IncomeMillions of dollars
Year ended December 31
2020 2019 2018
Net Income (Loss) $ (5,561) $ 2,845 $ 14,860
Currency translation adjustmentUnrealized net change arising during period 35 (18) (19)
Unrealized holding gain (loss) on securitiesNet gain (loss) arising during period (2) 2 (5)
DerivativesNet derivatives loss on hedge transactions — (1) —Income taxes on derivatives transactions — 3 —
Total — 2 —
Defined benefit plansActuarial gain (loss)
Amortization to net income of net actuarial loss and settlements 1,107 519 792Actuarial gain (loss) arising during period (2,004) (2,404) 85
Prior service credits (cost)Amortization to net income of net prior service costs and curtailments (23) 4 (13)Prior service (costs) credits arising during period — (28) (26)
Defined benefit plans sponsored by equity affiliates - benefit (cost) (104) (33) 23Income tax benefit (cost) on defined benefit plans 369 510 (230)
Total (655) (1,432) 631
Other Comprehensive Gain (Loss), Net of Tax (622) (1,446) 607
Comprehensive Income (6,183) 1,399 15,467
Comprehensive loss (income) attributable to noncontrolling interests 18 79 (36)
Comprehensive Income (Loss) Attributable to Chevron Corporation $ (6,165) $ 1,478 $ 15,431
See accompanying Notes to the Consolidated Financial Statements.
60 61
173155_Annual_Report_10-K.indd 61173155_Annual_Report_10-K.indd 61 3/5/21 6:04 PM3/5/21 6:04 PM
Consolidated Balance Sheet Millions of dollars, except per-share amounts
At December 31
2020 2019
Assets Cash and cash equivalents $ 5,596 $ 5,686 Marketable securities 31 63 Accounts and notes receivable (less allowance: 2020 - $284; 2019 - $746) 11,471 13,325 Inventories:
Crude oil and petroleum products 3,576 3,722 Chemicals 457 492 Materials, supplies and other 1,643 1,634
Total inventories 5,676 5,848 Prepaid expenses and other current assets 3,304 3,407
Total Current Assets 26,078 28,329 Long-term receivables, net 589 1,511 Investments and advances 39,052 38,688 Properties, plant and equipment, at cost 345,232 326,722 Less: Accumulated depreciation, depletion and amortization 188,614 176,228
Properties, plant and equipment, net 156,618 150,494 Deferred charges and other assets 11,950 10,532 Goodwill 4,402 4,463 Assets held for sale 1,101 3,411
Total Assets $ 239,790 $ 237,428
Liabilities and Equity Short-term debt $ 1,548 $ 3,282 Accounts payable 10,950 14,103 Accrued liabilities 7,812 6,589 Federal and other taxes on income 921 1,554 Other taxes payable 952 1,002
Total Current Liabilities 22,183 26,530 Long-term debt1 42,767 23,691 Deferred credits and other noncurrent obligations 20,328 20,445 Noncurrent deferred income taxes 12,569 13,688 Noncurrent employee benefit plans 9,217 7,866
Total Liabilities2 $ 107,064 $ 92,220
Preferred stock (authorized 100,000,000 shares; $1.00 par value; none issued) — — Common stock (authorized 6,000,000,000 shares; $0.75 par value; 2,442,676,580 shares
issued at December 31, 2020 and 2019) 1,832 1,832 Capital in excess of par value 16,829 17,265 Retained earnings 160,377 174,945 Accumulated other comprehensive losses (5,612) (4,990) Deferred compensation and benefit plan trust (240) (240) Treasury stock, at cost (2020 - 517,490,263 shares; 2019 - 560,508,479 shares) (41,498) (44,599)
Total Chevron Corporation Stockholders’ Equity 131,688 144,213
Noncontrolling interests (2020 includes $120 redeemable noncontrolling interest) 1,038 995
Total Equity 132,726 145,208
Total Liabilities and Equity $ 239,790 $ 237,428
1 Includes finance lease liabilities of $447 and $282 at December 31, 2020 and 2019, respectively. 2 Refer to Note 22, “Other Contingencies and Commitments” beginning on page 92.
See accompanying Notes to the Consolidated Financial Statements.
Chevron Corporation 2020 Annual Report 61

62
Consolidated Statement of EquityAmounts in millions of dollars
CommonStock1
RetainedEarnings
Acc. OtherComprehensive
Income (Loss)
TreasuryStock
(at cost)
Chevron Corp.Stockholders’
EquityNoncontrolling
InterestsTotal
Equity
Balance at December 31, 2017 $ 18,440 $ 174,106 $ (3,589) $ (40,833) $ 148,124 $ 1,195 $ 149,319
Treasury stock transactions 264 — — — 264 — 264Net income (loss) — 14,824 — — 14,824 36 14,860Cash dividends — (8,502) — — (8,502) (91) (8,593)Stock dividends — (3) — — (3) — (3)Other comprehensive income — — 607 — 607 — 607Purchases of treasury shares — — — (1,751) (1,751) — (1,751)Issuances of treasury shares — — — 991 991 — 991Other changes, net — 562 (562) — — (52) (52)
Balance at December 31, 2018 $ 18,704 $ 180,987 $ (3,544) $ (41,593) $ 154,554 $ 1,088 $ 155,642
Treasury stock transactions 153 — — — 153 — 153Net income (loss) — 2,924 — — 2,924 (79) 2,845Cash dividends — (8,959) — — (8,959) (18) (8,977)Stock dividends — (3) — — (3) — (3)Other comprehensive income — — (1,446) — (1,446) — (1,446)Purchases of treasury shares — — — (4,039) (4,039) — (4,039)Issuances of treasury shares — — — 1,033 1,033 — 1,033Other changes, net — (4) — — (4) 4 —
Balance at December 31, 2019 $ 18,857 $ 174,945 $ (4,990) $ (44,599) $ 144,213 $ 995 $ 145,208
Treasury stock transactions 84 — — — 84 — 84Noble Acquisition3 (520) — — 4,629 4,109 779 4,888Net income (loss) — (5,543) — — (5,543) (18) (5,561)Cash dividends — (9,651) — — (9,651) (24) (9,675)Stock dividends — (5) — — (5) — (5)Other comprehensive income — — (622) — (622) — (622)Purchases of treasury shares — — — (1,757) (1,757) — (1,757)Issuances of treasury shares — — — 229 229 — 229Other changes, net — 631 — — 631 (694) (63)
Balance at December 31, 2020 $ 18,421 $ 160,377 $ (5,612) $ (41,498) $ 131,688 $ 1,038 $ 132,726
Common Stock Share Activity
Issued2 Treasury Outstanding
Balance at December 31, 2017 2,442,676,580 (537,974,695) 1,904,701,885
Purchases — (14,912,039) (14,912,039)Issuances — 13,047,844 13,047,844
Balance at December 31, 2018 2,442,676,580 (539,838,890) 1,902,837,690
Purchases — (33,955,300) (33,955,300)Issuances — 13,285,711 13,285,711
Balance at December 31, 2019 2,442,676,580 (560,508,479) 1,882,168,101
Purchases — (17,577,457) (17,577,457)Issuances — 60,595,673 60,595,673
Balance at December 31, 2020 2,442,676,580 (517,490,263) 1,925,186,317
1 Beginning and ending balances for all periods include capital in excess of par, common stock issued at par for $1,832, and $(240) associated with Chevron’s BenefitPlan Trust. Changes reflect capital in excess of par.
2 Beginning and ending total issued share balances include 14,168,000 shares associated with Chevron’s Benefit Plan Trust.3 Includes $120 redeemable noncontrolling interest.
See accompanying Notes to the Consolidated Financial Statements.
63
173155_Annual_Report_10-K.indd 62173155_Annual_Report_10-K.indd 62 3/5/21 6:04 PM3/5/21 6:04 PM
Consolidated Statement of Cash Flows Millions of dollars
Year ended December 31
2020 2019 2018
Operating Activities Net Income (Loss) $ (5,561) $ 2,845 $ 14,860 Adjustments
Depreciation, depletion and amortization 19,508 29,218 19,419 Dry hole expense 1,036 172 687 Distributions more (less) than income from equity affiliates 2,015 (2,073) (3,580) Net before-tax gains on asset retirements and sales (760) (1,367) (619) Net foreign currency effects 619 272 123 Deferred income tax provision (3,604) (1,966) 1,050 Net decrease (increase) in operating working capital (1,652) 1,494 (718) Decrease (increase) in long-term receivables 296 502 418 Net decrease (increase) in other deferred charges (248) (69) — Cash contributions to employee pension plans (1,213) (1,362) (1,035) Other 141 (352) 13
Net Cash Provided by Operating Activities 10,577 27,314 30,618
Investing Activities Cash acquired from Noble Energy, Inc. 373 — — Capital expenditures (8,922) (14,116) (13,792) Proceeds and deposits related to asset sales and returns of investment 2,968 2,951 2,392 Net maturities of (investments in) time deposits — 950 (950) Net sales (purchases) of marketable securities 35 2 (51) Net repayment (borrowing) of loans by equity affiliates (1,419) (1,245) 111
Net Cash Used for Investing Activities (6,965) (11,458) (12,290)
Financing Activities Net borrowings (repayments) of short-term obligations 651 (2,821) 2,021 Proceeds from issuances of long-term debt 12,308 — 218 Repayments of long-term debt and other financing obligations (5,489) (5,025) (6,741) Cash dividends - common stock (9,651) (8,959) (8,502) Distributions to noncontrolling interests (24) (18) (91) Net sales (purchases) of treasury shares (1,531) (2,935) (604)
Net Cash Provided by (Used for) Financing Activities (3,736) (19,758) (13,699)
Effect of Exchange Rate Changes on Cash, Cash Equivalents and Restricted Cash (50) 332 (91)
Net Change in Cash, Cash Equivalents and Restricted Cash (174) (3,570) 4,538 Cash, Cash Equivalents and Restricted Cash at January 1 6,911 10,481 5,943
Cash, Cash Equivalents and Restricted Cash at December 31 $ 6,737 $ 6,911 $ 10,481
See accompanying Notes to the Consolidated Financial Statements.
Chevron Corporation 2020 Annual Report 62

Consolidated Statement of Cash FlowsMillions of dollars
Year ended December 31
2020 2019 2018
Operating ActivitiesNet Income (Loss) $ (5,561) $ 2,845 $ 14,860Adjustments
Depreciation, depletion and amortization 19,508 29,218 19,419Dry hole expense 1,036 172 687Distributions more (less) than income from equity affiliates 2,015 (2,073) (3,580)Net before-tax gains on asset retirements and sales (760) (1,367) (619)Net foreign currency effects 619 272 123Deferred income tax provision (3,604) (1,966) 1,050Net decrease (increase) in operating working capital (1,652) 1,494 (718)Decrease (increase) in long-term receivables 296 502 418Net decrease (increase) in other deferred charges (248) (69) —Cash contributions to employee pension plans (1,213) (1,362) (1,035)Other 141 (352) 13
Net Cash Provided by Operating Activities 10,577 27,314 30,618
Investing ActivitiesCash acquired from Noble Energy, Inc. 373 — —Capital expenditures (8,922) (14,116) (13,792)Proceeds and deposits related to asset sales and returns of investment 2,968 2,951 2,392Net maturities of (investments in) time deposits — 950 (950)Net sales (purchases) of marketable securities 35 2 (51)Net repayment (borrowing) of loans by equity affiliates (1,419) (1,245) 111
Net Cash Used for Investing Activities (6,965) (11,458) (12,290)
Financing ActivitiesNet borrowings (repayments) of short-term obligations 651 (2,821) 2,021Proceeds from issuances of long-term debt 12,308 — 218Repayments of long-term debt and other financing obligations (5,489) (5,025) (6,741)Cash dividends - common stock (9,651) (8,959) (8,502)Distributions to noncontrolling interests (24) (18) (91)Net sales (purchases) of treasury shares (1,531) (2,935) (604)
Net Cash Provided by (Used for) Financing Activities (3,736) (19,758) (13,699)
Effect of Exchange Rate Changes on Cash, Cash Equivalents and Restricted Cash (50) 332 (91)
Net Change in Cash, Cash Equivalents and Restricted Cash (174) (3,570) 4,538Cash, Cash Equivalents and Restricted Cash at January 1 6,911 10,481 5,943
Cash, Cash Equivalents and Restricted Cash at December 31 $ 6,737 $ 6,911 $ 10,481
See accompanying Notes to the Consolidated Financial Statements.
62 63
173155_Annual_Report_10-K.indd 63173155_Annual_Report_10-K.indd 63 3/5/21 6:04 PM3/5/21 6:04 PM
Consolidated Statement of Equity Amounts in millions of dollars
Common Stock1
Retained Earnings
Acc. Other Comprehensive
Income (Loss)
Treasury Stock
(at cost)
Chevron Corp. Stockholders’
Equity Noncontrolling
Interests Total
Equity
Balance at December 31, 2017 $ 18,440 $ 174,106 $ (3,589) $ (40,833) $ 148,124 $ 1,195 $ 149,319
Treasury stock transactions 264 — — — 264 — 264 Net income (loss) — 14,824 — — 14,824 36 14,860 Cash dividends — (8,502) — — (8,502) (91) (8,593) Stock dividends — (3) — — (3) — (3) Other comprehensive income — — 607 — 607 — 607 Purchases of treasury shares — — — (1,751) (1,751) — (1,751) Issuances of treasury shares — — — 991 991 — 991 Other changes, net — 562 (562) — — (52) (52)
Balance at December 31, 2018 $ 18,704 $ 180,987 $ (3,544) $ (41,593) $ 154,554 $ 1,088 $ 155,642
Treasury stock transactions 153 — — — 153 — 153 Net income (loss) — 2,924 — — 2,924 (79) 2,845 Cash dividends — (8,959) — — (8,959) (18) (8,977) Stock dividends — (3) — — (3) — (3) Other comprehensive income — — (1,446) — (1,446) — (1,446) Purchases of treasury shares — — — (4,039) (4,039) — (4,039) Issuances of treasury shares — — — 1,033 1,033 — 1,033 Other changes, net — (4) — — (4) 4 —
Balance at December 31, 2019 $ 18,857 $ 174,945 $ (4,990) $ (44,599) $ 144,213 $ 995 $ 145,208
Treasury stock transactions 84 — — — 84 — 84 Noble Acquisition3 (520) — — 4,629 4,109 779 4,888 Net income (loss) — (5,543) — — (5,543) (18) (5,561) Cash dividends — (9,651) — — (9,651) (24) (9,675) Stock dividends — (5) — — (5) — (5) Other comprehensive income — — (622) — (622) — (622) Purchases of treasury shares — — — (1,757) (1,757) — (1,757) Issuances of treasury shares — — — 229 229 — 229 Other changes, net — 631 — — 631 (694) (63)
Balance at December 31, 2020 $ 18,421 $ 160,377 $ (5,612) $ (41,498) $ 131,688 $ 1,038 $ 132,726
Common Stock Share Activity
Issued2 Treasury Outstanding
Balance at December 31, 2017 2,442,676,580 (537,974,695) 1,904,701,885
Purchases — (14,912,039) (14,912,039) Issuances — 13,047,844 13,047,844
Balance at December 31, 2018 2,442,676,580 (539,838,890) 1,902,837,690
Purchases — (33,955,300) (33,955,300) Issuances — 13,285,711 13,285,711
Balance at December 31, 2019 2,442,676,580 (560,508,479) 1,882,168,101
Purchases — (17,577,457) (17,577,457) Issuances — 60,595,673 60,595,673
Balance at December 31, 2020 2,442,676,580 (517,490,263) 1,925,186,317
1 Beginning and ending balances for all periods include capital in excess of par, common stock issued at par for $1,832, and $(240) associated with Chevron’s Benefit Plan Trust. Changes reflect capital in excess of par.
2 Beginning and ending total issued share balances include 14,168,000 shares associated with Chevron’s Benefit Plan Trust. 3 Includes $120 redeemable noncontrolling interest.
See accompanying Notes to the Consolidated Financial Statements.
Chevron Corporation 2020 Annual Report 63

64
Notes to the Consolidated Financial StatementsMillions of dollars, except per-share amounts
Properties, Plant and Equipment The successful efforts method is used for crude oil and natural gas exploration andproduction activities. All costs for development wells, related plant and equipment, proved mineral interests in crude oil andnatural gas properties, and related asset retirement obligation (ARO) assets are capitalized. Costs of exploratory wells arecapitalized pending determination of whether the wells found proved reserves. Costs of wells that are assigned provedreserves remain capitalized. Costs also are capitalized for exploratory wells that have found crude oil and natural gas reserveseven if the reserves cannot be classified as proved when the drilling is completed, provided the exploratory well has found asufficient quantity of reserves to justify its completion as a producing well and the company is making sufficient progressassessing the reserves and the economic and operating viability of the project. All other exploratory wells and costs areexpensed. Refer to Note 19, beginning on page 85, for additional discussion of accounting for suspended exploratory wellcosts.
Long-lived assets to be held and used, including proved crude oil and natural gas properties, are assessed for possibleimpairment by comparing their carrying values with their associated undiscounted, future net cash flows. Events that cantrigger assessments for possible impairments include write-downs of proved reserves based on field performance, significantdecreases in the market value of an asset (including changes to the commodity price forecast), significant change in theextent or manner of use of or a physical change in an asset, and a more-likely-than-not expectation that a long-lived asset orasset group will be sold or otherwise disposed of significantly sooner than the end of its previously estimated useful life.Impaired assets are written down to their estimated fair values, generally their discounted, future net cash flows. For provedcrude oil and natural gas properties, the company performs impairment reviews on a country, concession, PSC, developmentarea or field basis, as appropriate. In Downstream, impairment reviews are performed on the basis of a refinery, a plant, amarketing/lubricants area or distribution area, as appropriate. Impairment amounts are recorded as incremental“Depreciation, depletion and amortization” expense.
Long-lived assets that are held for sale are evaluated for possible impairment by comparing the carrying value of the assetwith its fair value less the cost to sell. If the net book value exceeds the fair value less cost to sell, the asset is consideredimpaired and adjusted to the lower value. Refer to Note 7, beginning on page 71, relating to fair value measurements. Thefair value of a liability for an ARO is recorded as an asset and a liability when there is a legal obligation associated with theretirement of a long-lived asset and the amount can be reasonably estimated. Refer also to Note 23, on page 94, relating toAROs.
Depreciation and depletion of all capitalized costs of proved crude oil and natural gas producing properties, except mineralinterests, are expensed using the unit-of-production method, generally by individual field, as the proved developed reservesare produced. Depletion expenses for capitalized costs of proved mineral interests are recognized using theunit-of-production method by individual field as the related proved reserves are produced. Impairments of capitalized costsof unproved mineral interests are expensed.
The capitalized costs of all other plant and equipment are depreciated or amortized over their estimated useful lives. Ingeneral, the declining-balance method is used to depreciate plant and equipment in the United States; the straight-line methodis generally used to depreciate international plant and equipment and to amortize finance lease right-of-use assets.
Gains or losses are not recognized for normal retirements of properties, plant and equipment subject to composite groupamortization or depreciation. Gains or losses from abnormal retirements are recorded as expenses, and from sales as “Otherincome.”
Expenditures for maintenance (including those for planned major maintenance projects), repairs and minor renewals tomaintain facilities in operating condition are generally expensed as incurred. Major replacements and renewals arecapitalized.
Leases Leases are classified as operating or finance leases. Both operating and finance leases recognize lease liabilities andassociated right-of-use assets. The company has elected the short-term lease exception and therefore only recognizesright-of-use assets and lease liabilities for leases with a term greater than one year. The company has elected the practicalexpedient to not separate non-lease components from lease components for most asset classes except for certain asset classesthat have significant non-lease (i.e., service) components.
Where leases are used in joint ventures, the company recognizes 100 percent of the right-of-use assets and lease liabilitieswhen the company is the sole signatory for the lease (in most cases, where the company is the operator of a joint venture).Lease costs reflect only the costs associated with the operator’s working interest share. The lease term includes thecommitted lease term identified in the contract, taking into account renewal and termination options that management is
65
173155_Annual_Report_10-K.indd 64173155_Annual_Report_10-K.indd 64 3/5/21 6:04 PM3/5/21 6:04 PM
Notes to the Consolidated Financial Statements Millions of dollars, except per-share amounts
Note 1 Summary of Significant Accounting Policies General The company’s Consolidated Financial Statements are prepared in accordance with accounting principles generally accepted in the United States of America. These require the use of estimates and assumptions that affect the assets, liabilities, revenues and expenses reported in the financial statements, as well as amounts included in the notes thereto, including discussion and disclosure of contingent liabilities. Although the company uses its best estimates and judgments, actual results could differ from these estimates as circumstances change and additional information becomes known.
Subsidiary and Affiliated Companies The Consolidated Financial Statements include the accounts of controlled subsidiary companies more than 50 percent-owned and any variable interest entities in which the company is the primary beneficiary. Undivided interests in oil and gas joint ventures and certain other assets are consolidated on a proportionate basis. Investments in and advances to affiliates in which the company has a substantial ownership interest of approximately 20 percent to 50 percent, or for which the company exercises significant influence but not control over policy decisions, are accounted for by the equity method.
Investments in affiliates are assessed for possible impairment when events indicate that the fair value of the investment may be below the company’s carrying value. When such a condition is deemed to be other than temporary, the carrying value of the investment is written down to its fair value, and the amount of the write-down is included in net income. In making the determination as to whether a decline is other than temporary, the company considers such factors as the duration and extent of the decline, the investee’s financial performance, and the company’s ability and intention to retain its investment for a period that will be sufficient to allow for any anticipated recovery in the investment’s market value. The new cost basis of investments in these equity investees is not changed for subsequent recoveries in fair value.
Differences between the company’s carrying value of an equity investment and its underlying equity in the net assets of the affiliate are assigned to the extent practicable to specific assets and liabilities based on the company’s analysis of the various factors giving rise to the difference. When appropriate, the company’s share of the affiliate’s reported earnings is adjusted quarterly to reflect the difference between these allocated values and the affiliate’s historical book values.
Noncontrolling Interests Ownership interests in the company’s subsidiaries held by parties other than the parent are presented separately from the parent’s equity on the Consolidated Balance Sheet. The amount of consolidated net income attributable to the parent and the noncontrolling interests are both presented on the face of the Consolidated Statement of Income and Consolidated Statement of Equity. Included within noncontrolling interest is redeemable noncontrolling interest.
Fair Value Measurements The three levels of the fair value hierarchy of inputs the company uses to measure the fair value of an asset or a liability are as follows. Level 1 inputs are quoted prices in active markets for identical assets or liabilities. Level 2 inputs are inputs other than quoted prices included within Level 1 that are directly or indirectly observable for the asset or liability. Level 3 inputs are inputs that are not observable in the market.
Derivatives The majority of the company’s activity in derivative commodity instruments is intended to manage the financial risk posed by physical transactions. For some of this derivative activity, generally limited to large, discrete or infrequently occurring transactions, the company may elect to apply fair value or cash flow hedge accounting. For other similar derivative instruments, generally because of the short-term nature of the contracts or their limited use, the company does not apply hedge accounting, and changes in the fair value of those contracts are reflected in current income. For the company’s commodity trading activity, gains and losses from derivative instruments are reported in current income. The company may enter into interest rate swaps from time to time as part of its overall strategy to manage the interest rate risk on its debt. Interest rate swaps related to a portion of the company’s fixed-rate debt, if any, may be accounted for as fair value hedges. Interest rate swaps related to floating-rate debt, if any, are recorded at fair value on the balance sheet with resulting gains and losses reflected in income. Where Chevron is a party to master netting arrangements, fair value receivable and payable amounts recognized for derivative instruments executed with the same counterparty are generally offset on the balance sheet.
Inventories Crude oil, petroleum products and chemicals inventories are generally stated at cost, using a last-in, first-out method. In the aggregate, these costs are below market. “Materials, supplies and other” inventories are primarily stated at cost or net realizable value.
Chevron Corporation 2020 Annual Report 64

Notes to the Consolidated Financial StatementsMillions of dollars, except per-share amounts
Note 1Summary of Significant Accounting PoliciesGeneral The company’s Consolidated Financial Statements are prepared in accordance with accounting principles generallyaccepted in the United States of America. These require the use of estimates and assumptions that affect the assets, liabilities,revenues and expenses reported in the financial statements, as well as amounts included in the notes thereto, includingdiscussion and disclosure of contingent liabilities. Although the company uses its best estimates and judgments, actual resultscould differ from these estimates as circumstances change and additional information becomes known.
Subsidiary and Affiliated Companies The Consolidated Financial Statements include the accounts of controlled subsidiarycompanies more than 50 percent-owned and any variable interest entities in which the company is the primary beneficiary.Undivided interests in oil and gas joint ventures and certain other assets are consolidated on a proportionate basis.Investments in and advances to affiliates in which the company has a substantial ownership interest of approximately20 percent to 50 percent, or for which the company exercises significant influence but not control over policy decisions, areaccounted for by the equity method.
Investments in affiliates are assessed for possible impairment when events indicate that the fair value of the investment maybe below the company’s carrying value. When such a condition is deemed to be other than temporary, the carrying value ofthe investment is written down to its fair value, and the amount of the write-down is included in net income. In making thedetermination as to whether a decline is other than temporary, the company considers such factors as the duration and extentof the decline, the investee’s financial performance, and the company’s ability and intention to retain its investment for aperiod that will be sufficient to allow for any anticipated recovery in the investment’s market value. The new cost basis ofinvestments in these equity investees is not changed for subsequent recoveries in fair value.
Differences between the company’s carrying value of an equity investment and its underlying equity in the net assets of theaffiliate are assigned to the extent practicable to specific assets and liabilities based on the company’s analysis of the variousfactors giving rise to the difference. When appropriate, the company’s share of the affiliate’s reported earnings is adjustedquarterly to reflect the difference between these allocated values and the affiliate’s historical book values.
Noncontrolling Interests Ownership interests in the company’s subsidiaries held by parties other than the parent arepresented separately from the parent’s equity on the Consolidated Balance Sheet. The amount of consolidated net incomeattributable to the parent and the noncontrolling interests are both presented on the face of the Consolidated Statement ofIncome and Consolidated Statement of Equity. Included within noncontrolling interest is redeemable noncontrolling interest.
Fair Value Measurements The three levels of the fair value hierarchy of inputs the company uses to measure the fair valueof an asset or a liability are as follows. Level 1 inputs are quoted prices in active markets for identical assets or liabilities.Level 2 inputs are inputs other than quoted prices included within Level 1 that are directly or indirectly observable for theasset or liability. Level 3 inputs are inputs that are not observable in the market.
Derivatives The majority of the company’s activity in derivative commodity instruments is intended to manage the financialrisk posed by physical transactions. For some of this derivative activity, generally limited to large, discrete or infrequentlyoccurring transactions, the company may elect to apply fair value or cash flow hedge accounting. For other similar derivativeinstruments, generally because of the short-term nature of the contracts or their limited use, the company does not applyhedge accounting, and changes in the fair value of those contracts are reflected in current income. For the company’scommodity trading activity, gains and losses from derivative instruments are reported in current income. The company mayenter into interest rate swaps from time to time as part of its overall strategy to manage the interest rate risk on its debt.Interest rate swaps related to a portion of the company’s fixed-rate debt, if any, may be accounted for as fair value hedges.Interest rate swaps related to floating-rate debt, if any, are recorded at fair value on the balance sheet with resulting gains andlosses reflected in income. Where Chevron is a party to master netting arrangements, fair value receivable and payableamounts recognized for derivative instruments executed with the same counterparty are generally offset on the balance sheet.
Inventories Crude oil, petroleum products and chemicals inventories are generally stated at cost, using a last-in, first-outmethod. In the aggregate, these costs are below market. “Materials, supplies and other” inventories are primarily stated atcost or net realizable value.
64 65
173155_Annual_Report_10-K.indd 65173155_Annual_Report_10-K.indd 65 3/5/21 6:04 PM3/5/21 6:04 PM
Notes to the Consolidated Financial Statements Millions of dollars, except per-share amounts
Properties, Plant and Equipment The successful efforts method is used for crude oil and natural gas exploration and production activities. All costs for development wells, related plant and equipment, proved mineral interests in crude oil and natural gas properties, and related asset retirement obligation (ARO) assets are capitalized. Costs of exploratory wells are capitalized pending determination of whether the wells found proved reserves. Costs of wells that are assigned proved reserves remain capitalized. Costs also are capitalized for exploratory wells that have found crude oil and natural gas reserves even if the reserves cannot be classified as proved when the drilling is completed, provided the exploratory well has found a sufficient quantity of reserves to justify its completion as a producing well and the company is making sufficient progress assessing the reserves and the economic and operating viability of the project. All other exploratory wells and costs are expensed. Refer to Note 19, beginning on page 85, for additional discussion of accounting for suspended exploratory well costs.
Long-lived assets to be held and used, including proved crude oil and natural gas properties, are assessed for possible impairment by comparing their carrying values with their associated undiscounted, future net cash flows. Events that can trigger assessments for possible impairments include write-downs of proved reserves based on field performance, significant decreases in the market value of an asset (including changes to the commodity price forecast), significant change in the extent or manner of use of or a physical change in an asset, and a more-likely-than-not expectation that a long-lived asset or asset group will be sold or otherwise disposed of significantly sooner than the end of its previously estimated useful life. Impaired assets are written down to their estimated fair values, generally their discounted, future net cash flows. For proved crude oil and natural gas properties, the company performs impairment reviews on a country, concession, PSC, development area or field basis, as appropriate. In Downstream, impairment reviews are performed on the basis of a refinery, a plant, a marketing/lubricants area or distribution area, as appropriate. Impairment amounts are recorded as incremental “Depreciation, depletion and amortization” expense.
Long-lived assets that are held for sale are evaluated for possible impairment by comparing the carrying value of the asset with its fair value less the cost to sell. If the net book value exceeds the fair value less cost to sell, the asset is considered impaired and adjusted to the lower value. Refer to Note 7, beginning on page 71, relating to fair value measurements. The fair value of a liability for an ARO is recorded as an asset and a liability when there is a legal obligation associated with the retirement of a long-lived asset and the amount can be reasonably estimated. Refer also to Note 23, on page 94, relating to AROs.
Depreciation and depletion of all capitalized costs of proved crude oil and natural gas producing properties, except mineral interests, are expensed using the unit-of-production method, generally by individual field, as the proved developed reserves are produced. Depletion expenses for capitalized costs of proved mineral interests are recognized using the unit-of-production method by individual field as the related proved reserves are produced. Impairments of capitalized costs of unproved mineral interests are expensed.
The capitalized costs of all other plant and equipment are depreciated or amortized over their estimated useful lives. In general, the declining-balance method is used to depreciate plant and equipment in the United States; the straight-line method is generally used to depreciate international plant and equipment and to amortize finance lease right-of-use assets.
Gains or losses are not recognized for normal retirements of properties, plant and equipment subject to composite group amortization or depreciation. Gains or losses from abnormal retirements are recorded as expenses, and from sales as “Other income.”
Expenditures for maintenance (including those for planned major maintenance projects), repairs and minor renewals to maintain facilities in operating condition are generally expensed as incurred. Major replacements and renewals are capitalized.
Leases Leases are classified as operating or finance leases. Both operating and finance leases recognize lease liabilities and associated right-of-use assets. The company has elected the short-term lease exception and therefore only recognizes right-of-use assets and lease liabilities for leases with a term greater than one year. The company has elected the practical expedient to not separate non-lease components from lease components for most asset classes except for certain asset classes that have significant non-lease (i.e., service) components.
Where leases are used in joint ventures, the company recognizes 100 percent of the right-of-use assets and lease liabilities when the company is the sole signatory for the lease (in most cases, where the company is the operator of a joint venture). Lease costs reflect only the costs associated with the operator’s working interest share. The lease term includes the committed lease term identified in the contract, taking into account renewal and termination options that management is
Chevron Corporation 2020 Annual Report 65

66
Notes to the Consolidated Financial StatementsMillions of dollars, except per-share amounts
Note 2Changes in Accumulated Other Comprehensive LossesThe change in Accumulated Other Comprehensive Losses (AOCL) presented on the Consolidated Balance Sheet and theimpact of significant amounts reclassified from AOCL on information presented in the Consolidated Statement of Income forthe year ended December 31, 2020, are reflected in the table below.
CurrencyTranslation
Adjustments
UnrealizedHolding Gains
(Losses) onSecurities Derivatives
DefinedBenefit Plans Total
Balance at December 31, 2017 $ (105) $ (5) $ (2) $ (3,477) $ (3,589)
Components of Other Comprehensive Income (Loss)1:Before Reclassifications (19) (5) — 28 4Reclassifications2 — — — 603 603
Net Other Comprehensive Income (Loss) (19) (5) — 631 607Stranded Tax Reclassification to Retained Earnings3 — — — (562) (562)
Balance at December 31, 2018 $ (124) $ (10) $ (2) $ (3,408) $ (3,544)
Components of Other Comprehensive Income (Loss)1:Before Reclassifications (18) 2 (1) (1,838) (1,855)Reclassifications2 — — 3 406 409
Net Other Comprehensive Income (Loss) (18) 2 2 (1,432) (1,446)
Balance at December 31, 2019 $ (142) $ (8) $ — $ (4,840) $ (4,990)
Components of Other Comprehensive Income (Loss)1:Before Reclassifications 35 (2) — (1,487) (1,454)Reclassifications2 — — — 832 832
Net Other Comprehensive Income (Loss) 35 (2) — (655) (622)
Balance at December 31, 2020 $ (107) $ (10) $ — $ (5,495) $ (5,612)
1 All amounts are net of tax.2 Refer to Note 21 beginning on page 87, for reclassified components totaling $1,084 that are included in employee benefit costs for the year ended December 31, 2020. Related
income taxes for the same period, totaling $252, are reflected in Income Tax Expense on the Consolidated Statement of Income. All other reclassified amounts wereinsignificant.
3 Stranded tax reclassification to retained earnings per ASU 2018-02.
67
173155_Annual_Report_10-K.indd 66173155_Annual_Report_10-K.indd 66 3/5/21 6:04 PM3/5/21 6:04 PM
Notes to the Consolidated Financial Statements Millions of dollars, except per-share amounts
reasonably certain to exercise. The company uses its incremental borrowing rate as a proxy for the discount rate based on the term of the lease unless the implicit rate is available.
Goodwill Goodwill resulting from a business combination is not subject to amortization. The company tests such goodwill at the reporting unit level for impairment annually at December 31, or more frequently if an event occurs or circumstances change that would more likely than not reduce the fair value of the reporting unit below its carrying amount.
Environmental Expenditures Environmental expenditures that relate to ongoing operations or to conditions caused by past operations are expensed. Expenditures that create future benefits or contribute to future revenue generation are capitalized.
Liabilities related to future remediation costs are recorded when environmental assessments or cleanups or both are probable and the costs can be reasonably estimated. For crude oil, natural gas and mineral-producing properties, a liability for an ARO is made in accordance with accounting standards for asset retirement and environmental obligations. Refer to Note 23, on page 94, for a discussion of the company’s AROs.
For federal Superfund sites and analogous sites under state laws, the company records a liability for its designated share of the probable and estimable costs, and probable amounts for other potentially responsible parties when mandated by the regulatory agencies because the other parties are not able to pay their respective shares. The gross amount of environmental liabilities is based on the company’s best estimate of future costs using currently available technology and applying current regulations and the company’s own internal environmental policies. Future amounts are not discounted. Recoveries or reimbursements are recorded as assets when receipt is reasonably assured.
Currency Translation The U.S. dollar is the functional currency for substantially all of the company’s consolidated operations and those of its equity affiliates. For those operations, all gains and losses from currency remeasurement are included in current period income. The cumulative translation effects for those few entities, both consolidated and affiliated, using functional currencies other than the U.S. dollar are included in “Currency translation adjustment” on the Consolidated Statement of Equity.
Revenue Recognition The company accounts for each delivery order of crude oil, natural gas, petroleum and chemical products as a separate performance obligation. Revenue is recognized when the performance obligation is satisfied, which typically occurs at the point in time when control of the product transfers to the customer. Payment is generally due within 30 days of delivery. The company accounts for delivery transportation as a fulfillment cost, not a separate performance obligation, and recognizes these costs as an operating expense in the period when revenue for the related commodity is recognized.
Revenue is measured as the amount the company expects to receive in exchange for transferring commodities to the customer. The company’s commodity sales are typically based on prevailing market-based prices and may include discounts and allowances. Until market prices become known under terms of the company’s contracts, the transaction price included in revenue is based on the company’s estimate of the most likely outcome.
Discounts and allowances are estimated using a combination of historical and recent data trends. When deliveries contain multiple products, an observable standalone selling price is generally used to measure revenue for each product. The company includes estimates in the transaction price only to the extent that a significant reversal of revenue is not probable in subsequent periods.
Stock Options and Other Share-Based Compensation The company issues stock options and other share-based compensation to certain employees. For equity awards, such as stock options, total compensation cost is based on the grant date fair value, and for liability awards, such as stock appreciation rights, total compensation cost is based on the settlement value. The company recognizes stock-based compensation expense for all awards over the service period required to earn the award, which is the shorter of the vesting period or the time period in which an employee becomes eligible to retain the award at retirement. The company’s Long-Term Incentive Plan (LTIP) awards include stock options and stock appreciation rights, which have graded vesting provisions by which one-third of each award vests on each of the first, second and third anniversaries of the date of grant. In addition, performance shares granted under the company’s LTIP will vest at the end of the three-year performance period. For awards granted under the company’s LTIP beginning in 2017, stock options and stock appreciation rights have graded vesting by which one third of each award vests annually on each January 31 on or after the first anniversary of the grant date. Standard restricted stock unit awards have cliff vesting by which the total award will vest on January 31 on or after the fifth anniversary of the grant date, subject to adjustment upon termination pursuant to the satisfaction of certain criteria. The company amortizes these awards on a straight-line basis.
Chevron Corporation 2020 Annual Report 66
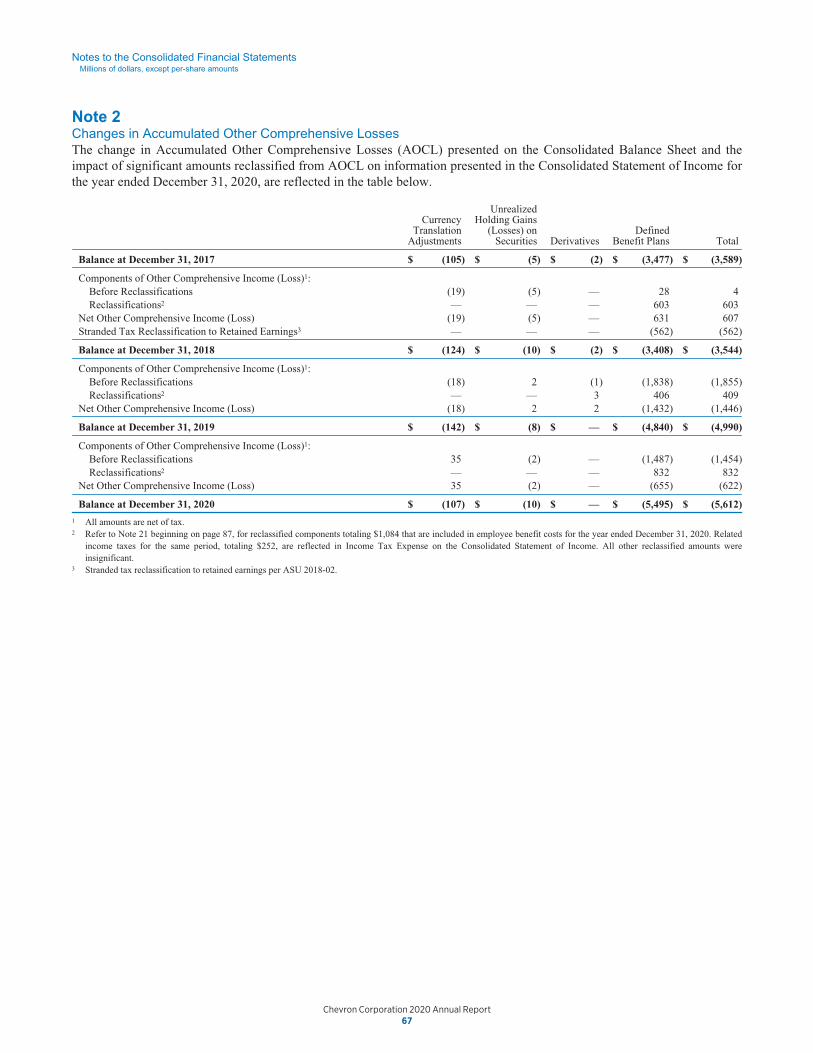
Notes to the Consolidated Financial StatementsMillions of dollars, except per-share amounts
reasonably certain to exercise. The company uses its incremental borrowing rate as a proxy for the discount rate based on theterm of the lease unless the implicit rate is available.
Goodwill Goodwill resulting from a business combination is not subject to amortization. The company tests such goodwill atthe reporting unit level for impairment annually at December 31, or more frequently if an event occurs or circumstanceschange that would more likely than not reduce the fair value of the reporting unit below its carrying amount.
Environmental Expenditures Environmental expenditures that relate to ongoing operations or to conditions caused by pastoperations are expensed. Expenditures that create future benefits or contribute to future revenue generation are capitalized.
Liabilities related to future remediation costs are recorded when environmental assessments or cleanups or both are probableand the costs can be reasonably estimated. For crude oil, natural gas and mineral-producing properties, a liability for an AROis made in accordance with accounting standards for asset retirement and environmental obligations. Refer to Note 23, onpage 94, for a discussion of the company’s AROs.
For federal Superfund sites and analogous sites under state laws, the company records a liability for its designated share ofthe probable and estimable costs, and probable amounts for other potentially responsible parties when mandated by theregulatory agencies because the other parties are not able to pay their respective shares. The gross amount of environmentalliabilities is based on the company’s best estimate of future costs using currently available technology and applying currentregulations and the company’s own internal environmental policies. Future amounts are not discounted. Recoveries orreimbursements are recorded as assets when receipt is reasonably assured.
Currency Translation The U.S. dollar is the functional currency for substantially all of the company’s consolidatedoperations and those of its equity affiliates. For those operations, all gains and losses from currency remeasurement areincluded in current period income. The cumulative translation effects for those few entities, both consolidated and affiliated,using functional currencies other than the U.S. dollar are included in “Currency translation adjustment” on the ConsolidatedStatement of Equity.
Revenue Recognition The company accounts for each delivery order of crude oil, natural gas, petroleum and chemicalproducts as a separate performance obligation. Revenue is recognized when the performance obligation is satisfied, whichtypically occurs at the point in time when control of the product transfers to the customer. Payment is generally due within 30days of delivery. The company accounts for delivery transportation as a fulfillment cost, not a separate performanceobligation, and recognizes these costs as an operating expense in the period when revenue for the related commodity isrecognized.
Revenue is measured as the amount the company expects to receive in exchange for transferring commodities to thecustomer. The company’s commodity sales are typically based on prevailing market-based prices and may include discountsand allowances. Until market prices become known under terms of the company’s contracts, the transaction price included inrevenue is based on the company’s estimate of the most likely outcome.
Discounts and allowances are estimated using a combination of historical and recent data trends. When deliveries containmultiple products, an observable standalone selling price is generally used to measure revenue for each product. Thecompany includes estimates in the transaction price only to the extent that a significant reversal of revenue is not probable insubsequent periods.
Stock Options and Other Share-Based Compensation The company issues stock options and other share-basedcompensation to certain employees. For equity awards, such as stock options, total compensation cost is based on the grantdate fair value, and for liability awards, such as stock appreciation rights, total compensation cost is based on the settlementvalue. The company recognizes stock-based compensation expense for all awards over the service period required to earn theaward, which is the shorter of the vesting period or the time period in which an employee becomes eligible to retain theaward at retirement. The company’s Long-Term Incentive Plan (LTIP) awards include stock options and stock appreciationrights, which have graded vesting provisions by which one-third of each award vests on each of the first, second and thirdanniversaries of the date of grant. In addition, performance shares granted under the company’s LTIP will vest at the end ofthe three-year performance period. For awards granted under the company’s LTIP beginning in 2017, stock options and stockappreciation rights have graded vesting by which one third of each award vests annually on each January 31 on or after thefirst anniversary of the grant date. Standard restricted stock unit awards have cliff vesting by which the total award will veston January 31 on or after the fifth anniversary of the grant date, subject to adjustment upon termination pursuant to thesatisfaction of certain criteria. The company amortizes these awards on a straight-line basis.
66 67
173155_Annual_Report_10-K.indd 67173155_Annual_Report_10-K.indd 67 3/5/21 6:04 PM3/5/21 6:04 PM
Notes to the Consolidated Financial Statements Millions of dollars, except per-share amounts
Note 2 Changes in Accumulated Other Comprehensive Losses The change in Accumulated Other Comprehensive Losses (AOCL) presented on the Consolidated Balance Sheet and the impact of significant amounts reclassified from AOCL on information presented in the Consolidated Statement of Income for the year ended December 31, 2020, are reflected in the table below.
Currency Translation
Adjustments
Unrealized Holding Gains
(Losses) on Securities Derivatives
DefinedBenefit Plans Total
Balance at December 31, 2017 $ (105) $ (5) $ (2) $ (3,477) $ (3,589)
Components of Other Comprehensive Income (Loss)1: Before Reclassifications (19) (5) — 28 4 Reclassifications2 — — — 603 603
Net Other Comprehensive Income (Loss) (19) (5) — 631 607 Stranded Tax Reclassification to Retained Earnings3 — — — (562) (562)
Balance at December 31, 2018 $ (124) $ (10) $ (2) $ (3,408) $ (3,544)
Components of Other Comprehensive Income (Loss)1: Before Reclassifications (18) 2 (1) (1,838) (1,855) Reclassifications2 — — 3 406 409
Net Other Comprehensive Income (Loss) (18) 2 2 (1,432) (1,446)
Balance at December 31, 2019 $ (142) $ (8) $ — $ (4,840) $ (4,990)
Components of Other Comprehensive Income (Loss)1: Before Reclassifications 35 (2) — (1,487) (1,454) Reclassifications2 — — — 832 832
Net Other Comprehensive Income (Loss) 35 (2) — (655) (622)
Balance at December 31, 2020 $ (107) $ (10) $ — $ (5,495) $ (5,612)
1 All amounts are net of tax. 2 Refer to Note 21 beginning on page 87, for reclassified components totaling $1,084 that are included in employee benefit costs for the year ended December 31, 2020. Related
income taxes for the same period, totaling $252, are reflected in Income Tax Expense on the Consolidated Statement of Income. All other reclassified amounts were insignificant.
3 Stranded tax reclassification to retained earnings per ASU 2018-02.
Chevron Corporation 2020 Annual Report 67

68
Notes to the Consolidated Financial StatementsMillions of dollars, except per-share amounts
Refer also to Note 29 on page 96 for a discussion of the all-stock acquisition of Noble. The cash received as a result of theacquisition is reflected on the Consolidated Statement of Cash Flows as “Cash acquired from Noble Energy, Inc.” Otherchanges to the Consolidated Balance Sheet resulting from the acquisition that did not affect cash are not reflected on theConsolidated Statement of Cash Flows.
The major components of “Capital expenditures” and the reconciliation of this amount to the reported capital and exploratoryexpenditures, including equity affiliates, are presented in the following table.
Year ended December 31
2020 2019 2018
Additions to properties, plant and equipment * $ 8,492 $ 13,839 $ 13,384Additions to investments 136 140 65Current-year dry hole expenditures 327 124 344Payments for other assets and liabilities, net (33) 13 (1)
Capital expenditures 8,922 14,116 13,792Expensed exploration expenditures 500 598 523Assets acquired through finance leases and other obligations 53 181 75Payments for other assets and liabilities, net 42 (13) —
Capital and exploratory expenditures, excluding equity affiliates 9,517 14,882 14,390Company’s share of expenditures by equity affiliates 3,982 6,112 5,716
Capital and exploratory expenditures, including equity affiliates $ 13,499 $ 20,994 $ 20,106
* Excludes non-cash movements of $816 in 2020, $(239) in 2019 and $25 in 2018.
The table below quantifies the beginning and ending balances of restricted cash and restricted cash equivalents in theConsolidated Balance Sheet:
Year ended December 31
2020 2019 2018
Cash and cash equivalents $ 5,596 $ 5,686 $ 9,342Restricted cash included in “Prepaid expenses and other current assets” 365 452 341Restricted cash included in “Deferred charges and other assets” 776 773 798
Total cash, cash equivalents and restricted cash $ 6,737 $ 6,911 $ 10,481
Note 4New Accounting StandardsFinancial Instruments—Credit Losses (Topic 326) Effective January 1, 2020, Chevron adopted Accounting StandardsUpdate (ASU) 2016-13 and its related amendments. For additional information on the company’s expected credit losses,refer to Note 28 on page 96.
Note 5Lease CommitmentsThe company enters into leasing arrangements as a lessee; any lessor arrangements are not significant. Operating leasearrangements mainly involve land, bareboat charters, terminals, drill ships, drilling rigs, time chartered vessels, officebuildings and warehouses, and exploration and production equipment. Finance leases primarily include facilities, vessels,office buildings, and production equipment.
Details of the right-of-use assets and lease liabilities for operating and finance leases, including the balance sheetpresentation, are as follows:
69
173155_Annual_Report_10-K.indd 68173155_Annual_Report_10-K.indd 68 3/5/21 6:04 PM3/5/21 6:04 PM
Notes to the Consolidated Financial Statements Millions of dollars, except per-share amounts
Note 3 Information Relating to the Consolidated Statement of Cash Flows
Year ended December 31
2020 2019 2018
Distributions more (less) than income from equity affiliates includes the following: Distributions from equity affiliates $ 1,543 $ 1,895 $ 2,747 (Income) loss from equity affiliates 472 (3,968) (6,327)
Distributions more (less) than income from equity affiliates $ 2,015 $ (2,073) $ (3,580)
Net decrease (increase) in operating working capital was composed of the following: Decrease (increase) in accounts and notes receivable $ 2,423 $ 1,852 $ 437 Decrease (increase) in inventories 284 7 (424) Decrease (increase) in prepaid expenses and other current assets (87) (323) (149) Increase (decrease) in accounts payable and accrued liabilities (3,576) (109) (494) Increase (decrease) in income and other taxes payable (696) 67 (88)
Net decrease (increase) in operating working capital $ (1,652) $ 1,494 $ (718)
Net cash provided by operating activities includes the following cash payments: Interest on debt (net of capitalized interest) $ 720 $ 810 $ 736 Income taxes 2,987 4,817 4,748
Proceeds and deposits related to asset sales and returns of investment consisted of the following gross amounts:
Proceeds and deposits related to asset sales $ 2,891 $ 2,809 $ 2,000 Returns of investment from equity affiliates 77 142 392
Proceeds and deposits related to asset sales and returns of investment $ 2,968 $ 2,951 $ 2,392
Net maturities (investments) of time deposits consisted of the following gross amounts: Investments in time deposits $ — $ — $ (950) Maturities of time deposits — 950 —
Net maturities of (investments in) time deposits $ — $ 950 $ (950)
Net sales (purchases) of marketable securities consisted of the following gross amounts: Marketable securities purchased $ — $ (1) $ (51) Marketable securities sold 35 3 —
Net sales (purchases) of marketable securities $ 35 $ 2 $ (51)
Net repayment (borrowing) of loans by equity affiliates: Borrowing of loans by equity affiliates $ (3,925) $ (1,350) $ — Repayment of loans by equity affiliates 2,506 105 111
Net repayment (borrowing) of loans by equity affiliates $ (1,419) $ (1,245) $ 111
Net borrowings (repayments) of short-term obligations consisted of the following gross and net amounts:
Proceeds from issuances of short-term obligations $ 10,846 $ 2,586 $ 2,486 Repayments of short-term obligations (9,771) (1,430) (4,136) Net borrowings (repayments) of short-term obligations with three months or less maturity (424) (3,977) 3,671
Net borrowings (repayments) of short-term obligations $ 651 $ (2,821) $ 2,021
Net sales (purchases) of treasury shares consists of the following gross and net amounts: Shares issued for share-based compensation plans $ 226 $ 1,104 $ 1,147 Shares purchased under share repurchase and deferred compensation plans (1,757) (4,039) (1,751)
Net sales (purchases) of treasury shares $ (1,531) $ (2,935) $ (604)
The “Other” line in the Operating Activities section includes changes in postretirement benefits obligations and other long-term liabilities.
The Consolidated Statement of Cash Flows excludes changes to the Consolidated Balance Sheet that did not affect cash. “Distributions more (less) than income from equity affiliates,” “Depreciation, depletion and amortization,” “Deferred income tax provision,” “Dry hole expense,” and “Net decrease (increase) in operating working capital” collectively include approximately $4.8 billion in non-cash reductions in 2020 relating to impairments and other non-cash charges. “Depreciation, depletion and amortization,” “Deferred income tax provision,” and “Dry hole expense” collectively include approximately $9.3 billion in non-cash reductions recorded in 2019 relating to impairments and other non-cash charges.
Refer also to Note 23, on page 94, for a discussion of revisions to the company’s AROs that also did not involve cash receipts or payments for the three years ending December 31, 2020.
Chevron Corporation 2020 Annual Report 68
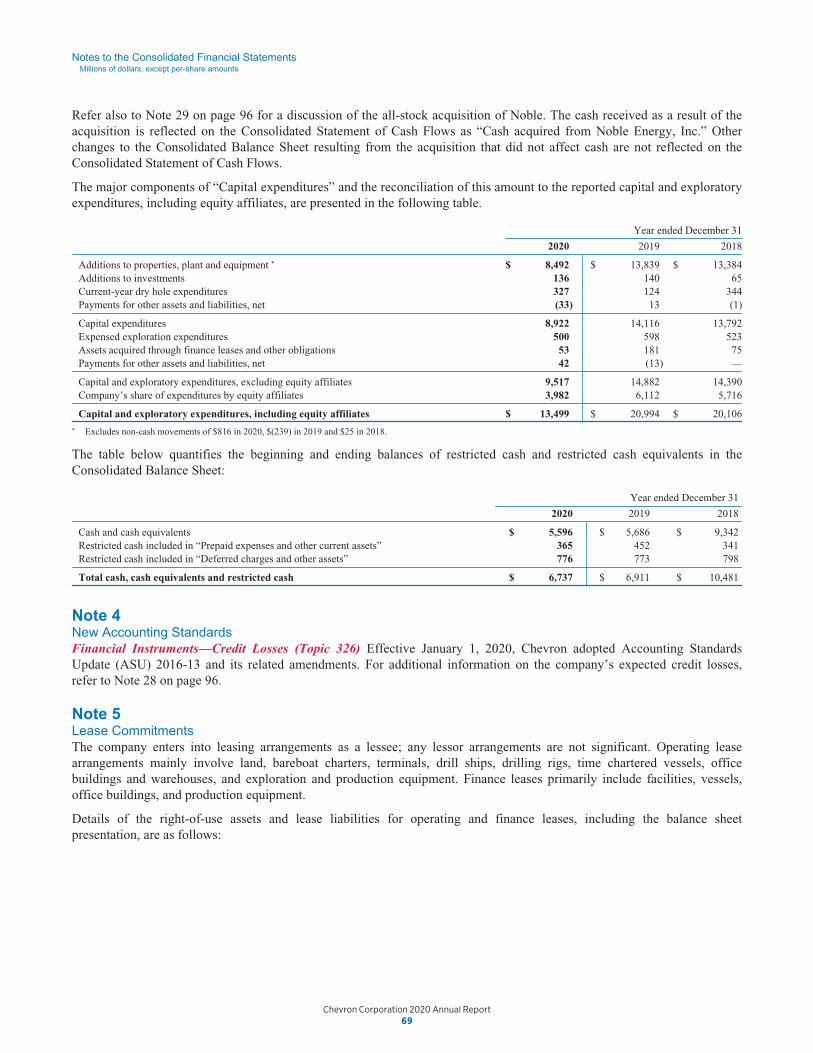
Notes to the Consolidated Financial StatementsMillions of dollars, except per-share amounts
Note 3Information Relating to the Consolidated Statement of Cash Flows
Year ended December 31
2020 2019 2018
Distributions more (less) than income from equity affiliates includes the following:Distributions from equity affiliates $ 1,543 $ 1,895 $ 2,747(Income) loss from equity affiliates 472 (3,968) (6,327)
Distributions more (less) than income from equity affiliates $ 2,015 $ (2,073) $ (3,580)
Net decrease (increase) in operating working capital was composed of the following:Decrease (increase) in accounts and notes receivable $ 2,423 $ 1,852 $ 437Decrease (increase) in inventories 284 7 (424)Decrease (increase) in prepaid expenses and other current assets (87) (323) (149)Increase (decrease) in accounts payable and accrued liabilities (3,576) (109) (494)Increase (decrease) in income and other taxes payable (696) 67 (88)
Net decrease (increase) in operating working capital $ (1,652) $ 1,494 $ (718)
Net cash provided by operating activities includes the following cash payments:Interest on debt (net of capitalized interest) $ 720 $ 810 $ 736Income taxes 2,987 4,817 4,748
Proceeds and deposits related to asset sales and returns of investment consisted of the following grossamounts:
Proceeds and deposits related to asset sales $ 2,891 $ 2,809 $ 2,000Returns of investment from equity affiliates 77 142 392
Proceeds and deposits related to asset sales and returns of investment $ 2,968 $ 2,951 $ 2,392
Net maturities (investments) of time deposits consisted of the following gross amounts:Investments in time deposits $ — $ — $ (950)Maturities of time deposits — 950 —
Net maturities of (investments in) time deposits $ — $ 950 $ (950)
Net sales (purchases) of marketable securities consisted of the following gross amounts:Marketable securities purchased $ — $ (1) $ (51)Marketable securities sold 35 3 —
Net sales (purchases) of marketable securities $ 35 $ 2 $ (51)
Net repayment (borrowing) of loans by equity affiliates:Borrowing of loans by equity affiliates $ (3,925) $ (1,350) $ —Repayment of loans by equity affiliates 2,506 105 111
Net repayment (borrowing) of loans by equity affiliates $ (1,419) $ (1,245) $ 111
Net borrowings (repayments) of short-term obligations consisted of the following gross and netamounts:
Proceeds from issuances of short-term obligations $ 10,846 $ 2,586 $ 2,486Repayments of short-term obligations (9,771) (1,430) (4,136)Net borrowings (repayments) of short-term obligations with three months or less maturity (424) (3,977) 3,671
Net borrowings (repayments) of short-term obligations $ 651 $ (2,821) $ 2,021
Net sales (purchases) of treasury shares consists of the following gross and net amounts:Shares issued for share-based compensation plans $ 226 $ 1,104 $ 1,147Shares purchased under share repurchase and deferred compensation plans (1,757) (4,039) (1,751)
Net sales (purchases) of treasury shares $ (1,531) $ (2,935) $ (604)
The “Other” line in the Operating Activities section includes changes in postretirement benefits obligations and other long-term liabilities.
The Consolidated Statement of Cash Flows excludes changes to the Consolidated Balance Sheet that did not affect cash.“Distributions more (less) than income from equity affiliates,” “Depreciation, depletion and amortization,” “Deferred incometax provision,” “Dry hole expense,” and “Net decrease (increase) in operating working capital” collectively includeapproximately $4.8 billion in non-cash reductions in 2020 relating to impairments and other non-cash charges.“Depreciation, depletion and amortization,” “Deferred income tax provision,” and “Dry hole expense” collectively includeapproximately $9.3 billion in non-cash reductions recorded in 2019 relating to impairments and other non-cash charges.
Refer also to Note 23, on page 94, for a discussion of revisions to the company’s AROs that also did not involve cashreceipts or payments for the three years ending December 31, 2020.
68 69
173155_Annual_Report_10-K.indd 69173155_Annual_Report_10-K.indd 69 3/5/21 6:04 PM3/5/21 6:04 PM
Notes to the Consolidated Financial Statements Millions of dollars, except per-share amounts
Refer also to Note 29 on page 96 for a discussion of the all-stock acquisition of Noble. The cash received as a result of the acquisition is reflected on the Consolidated Statement of Cash Flows as “Cash acquired from Noble Energy, Inc.” Other changes to the Consolidated Balance Sheet resulting from the acquisition that did not affect cash are not reflected on the Consolidated Statement of Cash Flows.
The major components of “Capital expenditures” and the reconciliation of this amount to the reported capital and exploratory expenditures, including equity affiliates, are presented in the following table.
Year ended December 31
2020 2019 2018
Additions to properties, plant and equipment * $ 8,492 $ 13,839 $ 13,384 Additions to investments 136 140 65 Current-year dry hole expenditures 327 124 344 Payments for other assets and liabilities, net (33) 13 (1)
Capital expenditures 8,922 14,116 13,792 Expensed exploration expenditures 500 598 523 Assets acquired through finance leases and other obligations 53 181 75 Payments for other assets and liabilities, net 42 (13) —
Capital and exploratory expenditures, excluding equity affiliates 9,517 14,882 14,390 Company’s share of expenditures by equity affiliates 3,982 6,112 5,716
Capital and exploratory expenditures, including equity affiliates $ 13,499 $ 20,994 $ 20,106
* Excludes non-cash movements of $816 in 2020, $(239) in 2019 and $25 in 2018.
The table below quantifies the beginning and ending balances of restricted cash and restricted cash equivalents in the Consolidated Balance Sheet:
Year ended December 31
2020 2019 2018
Cash and cash equivalents $ 5,596 $ 5,686 $ 9,342 Restricted cash included in “Prepaid expenses and other current assets” 365 452 341 Restricted cash included in “Deferred charges and other assets” 776 773 798
Total cash, cash equivalents and restricted cash $ 6,737 $ 6,911 $ 10,481
Note 4 New Accounting Standards Financial Instruments—Credit Losses (Topic 326) Effective January 1, 2020, Chevron adopted Accounting Standards Update (ASU) 2016-13 and its related amendments. For additional information on the company’s expected credit losses, refer to Note 28 on page 96.
Note 5 Lease Commitments The company enters into leasing arrangements as a lessee; any lessor arrangements are not significant. Operating lease arrangements mainly involve land, bareboat charters, terminals, drill ships, drilling rigs, time chartered vessels, office buildings and warehouses, and exploration and production equipment. Finance leases primarily include facilities, vessels, office buildings, and production equipment.
Details of the right-of-use assets and lease liabilities for operating and finance leases, including the balance sheet presentation, are as follows:
Chevron Corporation 2020 Annual Report 69

70
Notes to the Consolidated Financial StatementsMillions of dollars, except per-share amounts
Note 6Summarized Financial Data – Chevron U.S.A. Inc.Chevron U.S.A. Inc. (CUSA) is a major subsidiary of Chevron Corporation. CUSA and its subsidiaries manage and operatemost of Chevron’s U.S. businesses. Assets include those related to the exploration and production of crude oil, natural gasand natural gas liquids and those associated with the refining, marketing, supply and distribution of products derived frompetroleum, excluding most of the regulated pipeline operations of Chevron. CUSA also holds the company’s investment inthe Chevron Phillips Chemical Company LLC joint venture, which is accounted for using the equity method. Thesummarized financial information for CUSA and its consolidated subsidiaries is as follows:
Year ended December 31
2020 2019 2018
Sales and other operating revenues $ 67,950 $ 109,314 $ 125,076Total costs and other deductions 72,575 116,365 121,351Net income (loss) attributable to CUSA (2,676) (5,061) 4,334
At December 31
2020 2019
Current assets $ 10,555 $ 13,059Other assets 48,054 50,796Current liabilities 12,403 18,291Other liabilities 14,102 12,565
Total CUSA net equity $ 32,104 $ 32,999
Memo: Total debt $ 7,133 $ 3,222
Note 7Fair Value MeasurementsThe tables on the next page show the fair value hierarchy for assets and liabilities measured at fair value on a recurring andnonrecurring basis at December 31, 2020 and December 31, 2019.
Marketable Securities The company calculates fair value for its marketable securities based on quoted market prices foridentical assets. The fair values reflect the cash that would have been received if the instruments were sold at December 31,2020.
Derivatives The company records its derivative instruments – other than any commodity derivative contracts that aredesignated as normal purchase and normal sale – on the Consolidated Balance Sheet at fair value, with the offsetting amountto the Consolidated Statement of Income. Derivatives classified as Level 1 include futures, swaps and options contractstraded in active markets such as the New York Mercantile Exchange. Derivatives classified as Level 2 include swaps, optionsand forward contracts principally with financial institutions and other oil and gas companies, the fair values of which areobtained from third-party broker quotes, industry pricing services and exchanges. The company obtains multiple sources ofpricing information for the Level 2 instruments. Since this pricing information is generated from observable market data, ithas historically been very consistent. The company does not materially adjust this information.
Properties, Plant and Equipment The company reported impairments for certain upstream properties during 2020 primarilydue to downward revisions to its oil and gas price outlook. The impact of these impairments is included in “Depreciation,depletion and amortization” on the Consolidated Statement of Income. The company reported impairments for certainupstream properties in 2019 primarily due to capital allocation decisions and a lower long-term commodity price outlook.
Investments and Advances In 2020, the company fully impaired its investments in Petropiar and Petroboscan in Venezuela.The impact of these impairments is included in “Income (loss) from equity affiliates” on the Consolidated Statement ofIncome. The company reported impairments for certain upstream equity companies in 2019 primarily due to capitalallocation decisions and lower long-term commodity price outlook.
71
173155_Annual_Report_10-K.indd 70173155_Annual_Report_10-K.indd 70 3/5/21 6:04 PM3/5/21 6:04 PM
Notes to the Consolidated Financial Statements Millions of dollars, except per-share amounts
At December 31, 2020 At December 31, 2019
Operating Leases
Finance Leases
Operating Leases
Finance Leases
Deferred charges and other assets $ 3,949 $ — $ 4,074 $ — Properties, plant and equipment, net — 455 — 329
Right-of-use assets1 $ 3,949 $ 455 $ 4,074 $ 329
Accrued Liabilities $ 1,291 $ — $ 1,277 $ — Short-term Debt — 186 — 18
Current lease liabilities 1,291 186 1,277 18
Deferred credits and other noncurrent obligations 2,615 — 2,608 — Long-term Debt — 447 — 282
Noncurrent lease liabilities 2,615 447 2,608 282
Total lease liabilities $ 3,906 $ 633 $ 3,885 $ 300
Weighted-average remaining lease term (in years) 7.2 10.4 5.2 16.0 Weighted-average discount rate 2.8% 3.9% 3.2% 4.7%
1 Includes non-cash additions of $1,353 and $164 in 2020, and $1,201 and $184 in 2019 for right-of-use assets obtained in exchange for new and modified lease liabilities for operating and finance leases, respectively. 2020 includes $566 in operating lease right-of-use assets and $566 lease liabilities associated with the Puma acquisition. 2020 also includes $124 in operating lease right-of-use assets and $148 lease liabilities, and $112 in finance lease right-of-use assets and $309 lease liabilities associated with the Noble acquisition.
Total lease costs consist of both amounts recognized in the Consolidated Statement of Income during the period and amounts capitalized as part of the cost of another asset. Total lease costs incurred for operating and finance leases were as follows:
Year-ended December 31
2020 2019
Operating lease costs1, 2 $ 2,551 $ 2,621 Finance lease costs 45 66
Total lease costs $ 2,596 $ 2,687
1 Net rental expense of $816 for 2018. 2 Includes variable and short-term lease costs.
Cash paid for amounts included in the measurement of lease liabilities was as follows:
Year-ended December 31
2020 2019
Operating cash flows from operating leases $ 1,744 $ 1,574 Investing cash flows from operating leases 762 1,047 Operating cash flows from finance leases 14 13 Financing cash flows from finance leases 34 24
At December 31, 2020, the estimated future undiscounted cash flows for operating and finance leases were as follows:
At December 31, 2020
Operating Leases Finance Leases
Year 2021 $ 1,376 $ 204 2022 779 60 2023 497 58 2024 338 56 2025 255 53 Thereafter 1,112 331
Total $ 4,357 $ 762
Less: Amounts representing interest 451 129
Total lease liabilities $ 3,906 $ 633
Additionally, the company has $907 in future undiscounted cash flows for operating leases not yet commenced. These leases are primarily for a drill ship and drilling rigs. For those leasing arrangements where the underlying asset is not yet constructed, the lessor is primarily involved in the design and construction of the asset.
Chevron Corporation 2020 Annual Report 70

Notes to the Consolidated Financial StatementsMillions of dollars, except per-share amounts
At December 31, 2020 At December 31, 2019
OperatingLeases
FinanceLeases
OperatingLeases
FinanceLeases
Deferred charges and other assets $ 3,949 $ — $ 4,074 $ —Properties, plant and equipment, net — 455 — 329
Right-of-use assets1 $ 3,949 $ 455 $ 4,074 $ 329
Accrued Liabilities $ 1,291 $ — $ 1,277 $ —Short-term Debt — 186 — 18
Current lease liabilities 1,291 186 1,277 18
Deferred credits and other noncurrent obligations 2,615 — 2,608 —Long-term Debt — 447 — 282
Noncurrent lease liabilities 2,615 447 2,608 282
Total lease liabilities $ 3,906 $ 633 $ 3,885 $ 300
Weighted-average remaining lease term (in years) 7.2 10.4 5.2 16.0Weighted-average discount rate 2.8% 3.9% 3.2% 4.7%
1 Includes non-cash additions of $1,353 and $164 in 2020, and $1,201 and $184 in 2019 for right-of-use assets obtained in exchange for new and modified lease liabilities foroperating and finance leases, respectively. 2020 includes $566 in operating lease right-of-use assets and $566 lease liabilities associated with the Puma acquisition. 2020 alsoincludes $124 in operating lease right-of-use assets and $148 lease liabilities, and $112 in finance lease right-of-use assets and $309 lease liabilities associated with the Nobleacquisition.
Total lease costs consist of both amounts recognized in the Consolidated Statement of Income during the period and amountscapitalized as part of the cost of another asset. Total lease costs incurred for operating and finance leases were as follows:
Year-ended December 31
2020 2019
Operating lease costs1, 2 $ 2,551 $ 2,621Finance lease costs 45 66
Total lease costs $ 2,596 $ 2,687
1 Net rental expense of $816 for 2018.2 Includes variable and short-term lease costs.
Cash paid for amounts included in the measurement of lease liabilities was as follows:
Year-ended December 31
2020 2019
Operating cash flows from operating leases $ 1,744 $ 1,574Investing cash flows from operating leases 762 1,047Operating cash flows from finance leases 14 13Financing cash flows from finance leases 34 24
At December 31, 2020, the estimated future undiscounted cash flows for operating and finance leases were as follows:
At December 31, 2020
Operating Leases Finance Leases
Year 2021 $ 1,376 $ 2042022 779 602023 497 582024 338 562025 255 53Thereafter 1,112 331
Total $ 4,357 $ 762
Less: Amounts representing interest 451 129
Total lease liabilities $ 3,906 $ 633
Additionally, the company has $907 in future undiscounted cash flows for operating leases not yet commenced. These leasesare primarily for a drill ship and drilling rigs. For those leasing arrangements where the underlying asset is not yetconstructed, the lessor is primarily involved in the design and construction of the asset.
70 71
173155_Annual_Report_10-K.indd 71173155_Annual_Report_10-K.indd 71 3/5/21 6:04 PM3/5/21 6:04 PM
Notes to the Consolidated Financial Statements Millions of dollars, except per-share amounts
Note 6 Summarized Financial Data – Chevron U.S.A. Inc. Chevron U.S.A. Inc. (CUSA) is a major subsidiary of Chevron Corporation. CUSA and its subsidiaries manage and operate most of Chevron’s U.S. businesses. Assets include those related to the exploration and production of crude oil, natural gas and natural gas liquids and those associated with the refining, marketing, supply and distribution of products derived from petroleum, excluding most of the regulated pipeline operations of Chevron. CUSA also holds the company’s investment in the Chevron Phillips Chemical Company LLC joint venture, which is accounted for using the equity method. The summarized financial information for CUSA and its consolidated subsidiaries is as follows:
Year ended December 31
2020 2019 2018
Sales and other operating revenues $ 67,950 $ 109,314 $ 125,076 Total costs and other deductions 72,575 116,365 121,351 Net income (loss) attributable to CUSA (2,676) (5,061) 4,334
At December 31 2020 2019
Current assets $ 10,555 $ 13,059 Other assets 48,054 50,796 Current liabilities 12,403 18,291 Other liabilities 14,102 12,565
Total CUSA net equity $ 32,104 $ 32,999
Memo: Total debt $ 7,133 $ 3,222
Note 7 Fair Value Measurements The tables on the next page show the fair value hierarchy for assets and liabilities measured at fair value on a recurring and nonrecurring basis at December 31, 2020 and December 31, 2019.
Marketable Securities The company calculates fair value for its marketable securities based on quoted market prices for identical assets. The fair values reflect the cash that would have been received if the instruments were sold at December 31, 2020.
Derivatives The company records its derivative instruments – other than any commodity derivative contracts that are designated as normal purchase and normal sale – on the Consolidated Balance Sheet at fair value, with the offsetting amount to the Consolidated Statement of Income. Derivatives classified as Level 1 include futures, swaps and options contracts traded in active markets such as the New York Mercantile Exchange. Derivatives classified as Level 2 include swaps, options and forward contracts principally with financial institutions and other oil and gas companies, the fair values of which are obtained from third-party broker quotes, industry pricing services and exchanges. The company obtains multiple sources of pricing information for the Level 2 instruments. Since this pricing information is generated from observable market data, it has historically been very consistent. The company does not materially adjust this information.
Properties, Plant and Equipment The company reported impairments for certain upstream properties during 2020 primarily due to downward revisions to its oil and gas price outlook. The impact of these impairments is included in “Depreciation, depletion and amortization” on the Consolidated Statement of Income. The company reported impairments for certain upstream properties in 2019 primarily due to capital allocation decisions and a lower long-term commodity price outlook.
Investments and Advances In 2020, the company fully impaired its investments in Petropiar and Petroboscan in Venezuela. The impact of these impairments is included in “Income (loss) from equity affiliates” on the Consolidated Statement of Income. The company reported impairments for certain upstream equity companies in 2019 primarily due to capital allocation decisions and lower long-term commodity price outlook.
Chevron Corporation 2020 Annual Report 71

72
Notes to the Consolidated Financial StatementsMillions of dollars, except per-share amounts
The company uses derivative commodity instruments traded on the New York Mercantile Exchange and on electronicplatforms of the Inter-Continental Exchange and Chicago Mercantile Exchange. In addition, the company enters into swapcontracts and option contracts principally with major financial institutions and other oil and gas companies in the“over-the-counter” markets, which are governed by International Swaps and Derivatives Association agreements and othermaster netting arrangements. Depending on the nature of the derivative transactions, bilateral collateral arrangements mayalso be required.
Derivative instruments measured at fair value at December 31, 2020, December 31, 2019, and December 31, 2018, and theirclassification on the Consolidated Balance Sheet and Consolidated Statement of Income are below:
Consolidated Balance Sheet: Fair Value of Derivatives Not Designated as Hedging Instruments
At December 31
Type of Contract Balance Sheet Classification 2020 2019
Commodity Accounts and notes receivable, net $ 73 $ 11Commodity Long-term receivables, net 1 —
Total assets at fair value $ 74 $ 11
Commodity Accounts payable $ 172 $ 74Commodity Deferred credits and other noncurrent obligations 1 —
Total liabilities at fair value $ 173 $ 74
Consolidated Statement of Income: The Effect of Derivatives Not Designated as Hedging Instruments
Type of Derivative Statement ofGain/(Loss)
Year ended December 31
Contract Income Classification 2020 2019 2018
Commodity Sales and other operating revenues $ 69 $ (291) $ 135Commodity Purchased crude oil and products (36) (17) (33)Commodity Other income 7 (2) 3
$ 40 $ (310) $ 105
The table below represents gross and net derivative assets and liabilities subject to netting agreements on the ConsolidatedBalance Sheet at December 31, 2020 and December 31, 2019.
Consolidated Balance Sheet: The Effect of Netting Derivative Assets and Liabilities
At December 31, 2020Gross Amounts
RecognizedGross Amounts
OffsetNet Amounts
PresentedGross Amounts
Not Offset Net Amounts
Derivative Assets $ 818 $ 744 $ 74 $ — $ 74Derivative Liabilities $ 917 $ 744 $ 173 $ — $ 173
At December 31, 2019Derivative Assets $ 656 $ 645 $ 11 $ — $ 11Derivative Liabilities $ 719 $ 645 $ 74 $ — $ 74
Derivative assets and liabilities are classified on the Consolidated Balance Sheet as accounts and notes receivable, long-termreceivables, accounts payable, and deferred credits and other noncurrent obligations. Amounts not offset on the ConsolidatedBalance Sheet represent positions that do not meet all the conditions for “a right of offset.”
Concentrations of Credit Risk The company’s financial instruments that are exposed to concentrations of credit risk consistprimarily of its cash equivalents, time deposits, marketable securities, derivative financial instruments and trade receivables.The company’s short-term investments are placed with a wide array of financial institutions with high credit ratings.Company investment policies limit the company’s exposure both to credit risk and to concentrations of credit risk. Similarpolicies on diversification and creditworthiness are applied to the company’s counterparties in derivative instruments.
The trade receivable balances, reflecting the company’s diversified sources of revenue, are dispersed among the company’sbroad customer base worldwide. As a result, the company believes concentrations of credit risk are limited. The companyroutinely assesses the financial strength of its customers. When the financial strength of a customer is not consideredsufficient, alternative risk mitigation measures may be deployed, including requiring pre-payments, letters of credit or otheracceptable collateral instruments to support sales to customers.
73
173155_Annual_Report_10-K.indd 72173155_Annual_Report_10-K.indd 72 3/5/21 6:04 PM3/5/21 6:04 PM
Notes to the Consolidated Financial Statements Millions of dollars, except per-share amounts
Assets and Liabilities Measured at Fair Value on a Recurring Basis
At December 31, 2020 At December 31, 2019
Total Level 1 Level 2 Level 3 Total Level 1 Level 2 Level 3
Marketable securities $ 31 $ 31 $ — $ — $ 63 $ 63 $ — $ — Derivatives 74 37 37 — 11 1 10 —
Total assets at fair value $ 105 $ 68 $ 37 $ — $ 74 $ 64 $ 10 $ —
Derivatives 173 58 115 — 74 26 48 —
Total liabilities at fair value $ 173 $ 58 $ 115 $ — $ 74 $ 26 $ 48 $ —
Assets and Liabilities Measured at Fair Value on a Nonrecurring Basis
At December 31 At December 31
Total Level 1 Level 2 Level 3 Before-Tax Loss
Year 2020 Total Level 1 Level 2 Level 3 Before-Tax Loss
Year 2019
Properties, plant and equipment, net (held and used) $ 2,443 $ — $ 20 $ 2,423 $ 2,599 $ 2,177 $ — $ — $ 2,177 $ 2,095
Properties, plant and equipment, net (held for sale) 1,418 — 1,418 — 193 1,412 — 1,412 — 8,702
Investments and advances 28 — — 28 2,555 52 — 30 22 594
Total nonrecurring assets at fair value $ 3,889 $ — $ 1,438 $ 2,451 $ 5,347 $ 3,641 $ — $ 1,442 $ 2,199 $ 11,391
At year-end 2020, the company had assets measured at fair value Level 3 using unobservable inputs of $2,451. The carrying value of these assets were written down to fair value based on estimates derived from internal discounted cash flow models. Cash flows were determined using estimates of future production, an outlook of future price based on published prices and a discount rate believed to be consistent with those used by principal market participants. The significant Level 3 inputs were attributed to two assets, one in an international location where volumes and price were primarily based on natural gas, and the second was in a U.S. location where volumes and price were primarily based on crude.
Assets and Liabilities Not Required to Be Measured at Fair Value The company holds cash equivalents and time deposits in U.S. and non-U.S. portfolios. The instruments classified as cash equivalents are primarily bank time deposits with maturities of 90 days or less and money market funds. “Cash and cash equivalents” had carrying/fair values of $5,596 and $5,686 at December 31, 2020, and December 31, 2019, respectively. The fair values of cash, cash equivalents and bank time deposits are classified as Level 1 and reflect the cash that would have been received if the instruments were settled at December 31, 2020.
“Cash and cash equivalents” do not include investments with a carrying/fair value of $1,141 and $1,225 at December 31, 2020, and December 31, 2019, respectively. At December 31, 2020, these investments are classified as Level 1 and include restricted funds related to certain upstream decommissioning activities, tax payments and a financing program, which are reported in “Deferred charges and other assets” on the Consolidated Balance Sheet. Long-term debt, excluding finance lease liabilities, of $30,805 and $13,659 at December 31, 2020, and December 31, 2019, respectively, had estimated fair values of $34,390 and $14,326, respectively. Long-term debt primarily includes corporate issued bonds. The fair value of corporate bonds is $32,123 and classified as Level 1. The fair value of other long-term debt is $2,267 and classified as Level 2.
The carrying values of short-term financial assets and liabilities on the Consolidated Balance Sheet approximate their fair values. Fair value remeasurements of other financial instruments at December 31, 2020 and 2019, were not material.
Note 8 Financial and Derivative Instruments Derivative Commodity Instruments The company’s derivative commodity instruments principally include crude oil, natural gas and refined product futures, swaps, options, and forward contracts. None of the company’s derivative instruments is designated as a hedging instrument, although certain of the company’s affiliates make such designation. The company’s derivatives are not material to the company’s financial position, results of operations or liquidity. The company believes it has no material market or credit risks to its operations, financial position or liquidity as a result of its commodity derivative activities.
Chevron Corporation 2020 Annual Report 72

Notes to the Consolidated Financial StatementsMillions of dollars, except per-share amounts
Assets and Liabilities Measured at Fair Value on a Recurring Basis
At December 31, 2020 At December 31, 2019
Total Level 1 Level 2 Level 3 Total Level 1 Level 2 Level 3
Marketable securities $ 31 $ 31 $ — $ — $ 63 $ 63 $ — $ —Derivatives 74 37 37 — 11 1 10 —
Total assets at fair value $ 105 $ 68 $ 37 $ — $ 74 $ 64 $ 10 $ —
Derivatives 173 58 115 — 74 26 48 —
Total liabilities at fair value $ 173 $ 58 $ 115 $ — $ 74 $ 26 $ 48 $ —
Assets and Liabilities Measured at Fair Value on a Nonrecurring Basis
At December 31 At December 31
Total Level 1 Level 2 Level 3Before-Tax Loss
Year 2020 Total Level 1 Level 2 Level 3Before-Tax Loss
Year 2019
Properties, plant and equipment, net (heldand used) $ 2,443 $ — $ 20 $ 2,423 $ 2,599 $ 2,177 $ — $ — $ 2,177 $ 2,095
Properties, plant and equipment, net (heldfor sale) 1,418 — 1,418 — 193 1,412 — 1,412 — 8,702
Investments and advances 28 — — 28 2,555 52 — 30 22 594
Total nonrecurring assets at fair value $ 3,889 $ — $ 1,438 $ 2,451 $ 5,347 $ 3,641 $ — $ 1,442 $ 2,199 $ 11,391
At year-end 2020, the company had assets measured at fair value Level 3 using unobservable inputs of $2,451. The carryingvalue of these assets were written down to fair value based on estimates derived from internal discounted cash flow models.Cash flows were determined using estimates of future production, an outlook of future price based on published prices and adiscount rate believed to be consistent with those used by principal market participants. The significant Level 3 inputs wereattributed to two assets, one in an international location where volumes and price were primarily based on natural gas, andthe second was in a U.S. location where volumes and price were primarily based on crude.
Assets and Liabilities Not Required to Be Measured at Fair Value The company holds cash equivalents and time deposits inU.S. and non-U.S. portfolios. The instruments classified as cash equivalents are primarily bank time deposits with maturitiesof 90 days or less and money market funds. “Cash and cash equivalents” had carrying/fair values of $5,596 and $5,686 atDecember 31, 2020, and December 31, 2019, respectively. The fair values of cash, cash equivalents and bank time depositsare classified as Level 1 and reflect the cash that would have been received if the instruments were settled at December 31,2020.
“Cash and cash equivalents” do not include investments with a carrying/fair value of $1,141 and $1,225 at December 31,2020, and December 31, 2019, respectively. At December 31, 2020, these investments are classified as Level 1 and includerestricted funds related to certain upstream decommissioning activities, tax payments and a financing program, which arereported in “Deferred charges and other assets” on the Consolidated Balance Sheet. Long-term debt, excluding finance leaseliabilities, of $30,805 and $13,659 at December 31, 2020, and December 31, 2019, respectively, had estimated fair values of$34,390 and $14,326, respectively. Long-term debt primarily includes corporate issued bonds. The fair value of corporatebonds is $32,123 and classified as Level 1. The fair value of other long-term debt is $2,267 and classified as Level 2.
The carrying values of short-term financial assets and liabilities on the Consolidated Balance Sheet approximate their fairvalues. Fair value remeasurements of other financial instruments at December 31, 2020 and 2019, were not material.
Note 8Financial and Derivative InstrumentsDerivative Commodity Instruments The company’s derivative commodity instruments principally include crude oil, naturalgas and refined product futures, swaps, options, and forward contracts. None of the company’s derivative instruments isdesignated as a hedging instrument, although certain of the company’s affiliates make such designation. The company’sderivatives are not material to the company’s financial position, results of operations or liquidity. The company believes ithas no material market or credit risks to its operations, financial position or liquidity as a result of its commodity derivativeactivities.
72 73
173155_Annual_Report_10-K.indd 73173155_Annual_Report_10-K.indd 73 3/5/21 6:04 PM3/5/21 6:04 PM
Notes to the Consolidated Financial Statements Millions of dollars, except per-share amounts
The company uses derivative commodity instruments traded on the New York Mercantile Exchange and on electronic platforms of the Inter-Continental Exchange and Chicago Mercantile Exchange. In addition, the company enters into swap contracts and option contracts principally with major financial institutions and other oil and gas companies in the “over-the-counter” markets, which are governed by International Swaps and Derivatives Association agreements and other master netting arrangements. Depending on the nature of the derivative transactions, bilateral collateral arrangements may also be required.
Derivative instruments measured at fair value at December 31, 2020, December 31, 2019, and December 31, 2018, and their classification on the Consolidated Balance Sheet and Consolidated Statement of Income are below:
Consolidated Balance Sheet: Fair Value of Derivatives Not Designated as Hedging Instruments
At December 31
Type of Contract Balance Sheet Classification 2020 2019
Commodity Accounts and notes receivable, net $ 73 $ 11 Commodity Long-term receivables, net 1 —
Total assets at fair value $ 74 $ 11
Commodity Accounts payable $ 172 $ 74 Commodity Deferred credits and other noncurrent obligations 1 —
Total liabilities at fair value $ 173 $ 74
Consolidated Statement of Income: The Effect of Derivatives Not Designated as Hedging Instruments
Gain/(Loss) Year ended December 31 Type of Derivative
Contract
Statement of
Income Classification 2020 2019 2018
Commodity Sales and other operating revenues $ 69 $ (291) $ 135 Commodity Purchased crude oil and products (36) (17) (33) Commodity Other income 7 (2) 3
$ 40 $ (310) $ 105
The table below represents gross and net derivative assets and liabilities subject to netting agreements on the Consolidated Balance Sheet at December 31, 2020 and December 31, 2019.
Consolidated Balance Sheet: The Effect of Netting Derivative Assets and Liabilities
At December 31, 2020 Gross Amounts
Recognized Gross Amounts
Offset Net Amounts
Presented Gross Amounts
Not Offset Net Amounts
Derivative Assets $ 818 $ 744 $ 74 $ — $ 74 Derivative Liabilities $ 917 $ 744 $ 173 $ — $ 173
At December 31, 2019 Derivative Assets $ 656 $ 645 $ 11 $ — $ 11 Derivative Liabilities $ 719 $ 645 $ 74 $ — $ 74
Derivative assets and liabilities are classified on the Consolidated Balance Sheet as accounts and notes receivable, long-term receivables, accounts payable, and deferred credits and other noncurrent obligations. Amounts not offset on the Consolidated Balance Sheet represent positions that do not meet all the conditions for “a right of offset.”
Concentrations of Credit Risk The company’s financial instruments that are exposed to concentrations of credit risk consist primarily of its cash equivalents, time deposits, marketable securities, derivative financial instruments and trade receivables. The company’s short-term investments are placed with a wide array of financial institutions with high credit ratings. Company investment policies limit the company’s exposure both to credit risk and to concentrations of credit risk. Similar policies on diversification and creditworthiness are applied to the company’s counterparties in derivative instruments.
The trade receivable balances, reflecting the company’s diversified sources of revenue, are dispersed among the company’s broad customer base worldwide. As a result, the company believes concentrations of credit risk are limited. The company routinely assesses the financial strength of its customers. When the financial strength of a customer is not considered sufficient, alternative risk mitigation measures may be deployed, including requiring pre-payments, letters of credit or other acceptable collateral instruments to support sales to customers.
Chevron Corporation 2020 Annual Report 73

74
Notes to the Consolidated Financial StatementsMillions of dollars, except per-share amounts
The company’s segments are managed by “segment managers” who report to the “chief operating decision maker” (CODM).The segments represent components of the company that engage in activities (a) from which revenues are earned andexpenses are incurred; (b) whose operating results are regularly reviewed by the CODM, which makes decisions aboutresources to be allocated to the segments and assesses their performance; and (c) for which discrete financial information isavailable.
The company’s primary country of operation is the United States of America, its country of domicile. Other components ofthe company’s operations are reported as “International” (outside the United States).
Segment Earnings The company evaluates the performance of its operating segments on an after-tax basis, withoutconsidering the effects of debt financing interest expense or investment interest income, both of which are managed by thecompany on a worldwide basis. Corporate administrative costs are not allocated to the operating segments. However,operating segments are billed for the direct use of corporate services. Non billable costs remain at the corporate level in “AllOther.” Earnings by major operating area are presented in the following table:
Year ended December 31
2020 2019 2018
UpstreamUnited States $ (1,608) $ (5,094) $ 3,278International (825) 7,670 10,038
Total Upstream (2,433) 2,576 13,316
DownstreamUnited States (571) 1,559 2,103International 618 922 1,695
Total Downstream 47 2,481 3,798
Total Segment Earnings (2,386) 5,057 17,114All Other
Interest expense (658) (761) (713)Interest income 52 181 137Other (2,551) (1,553) (1,714)
Net Income (Loss) Attributable to Chevron Corporation $ (5,543) $ 2,924 $ 14,824
Segment Assets Segment assets do not include intercompany investments or receivables. Assets at year-end 2020 and 2019are as follows:
At December 31
2020 2019
UpstreamUnited States $ 42,431 $ 35,926International 144,476 145,648Goodwill 4,402 4,463
Total Upstream 191,309 186,037
DownstreamUnited States 23,490 25,197International 16,096 16,955
Total Downstream 39,586 42,152
Total Segment Assets 230,895 228,189
All OtherUnited States 4,017 3,475International 4,878 5,764
Total All Other 8,895 9,239
Total Assets – United States 69,938 64,598Total Assets – International 165,450 168,367Goodwill 4,402 4,463
Total Assets $ 239,790 $ 237,428
Segment Sales and Other Operating Revenues Operating segment sales and other operating revenues, including internaltransfers, for the years 2020, 2019 and 2018, are presented in the table on the next page. Products are transferred betweenoperating segments at internal product values that approximate market prices.
75
173155_Annual_Report_10-K.indd 74173155_Annual_Report_10-K.indd 74 3/5/21 6:04 PM3/5/21 6:04 PM
Notes to the Consolidated Financial Statements Millions of dollars, except per-share amounts
Note 9 Assets Held for Sale At December 31, 2020, the company classified $1,101 of net properties, plant and equipment as “Assets held for sale” on the Consolidated Balance Sheet. These assets are associated with upstream operations that are anticipated to be sold in the next 12 months. The revenues and earnings contributions of these assets in 2020 were not material.
Note 10 Equity Retained earnings at December 31, 2020 and 2019, included $26,532 and $25,319, respectively, for the company’s share of undistributed earnings of equity affiliates.
At December 31, 2020, about 67 million shares of Chevron’s common stock remained available for issuance from the 260 million shares that were reserved for issuance under the Chevron Long-Term Incentive Plan. In addition, 644,376 shares remain available for issuance from the 1,600,000 shares of the company’s common stock that were reserved for awards under the Chevron Corporation Non-Employee Directors’ Equity Compensation and Deferral Plan.
Note 11 Earnings Per Share Basic earnings per share (EPS) is based upon “Net Income (Loss) Attributable to Chevron Corporation” (“earnings”) and includes the effects of deferrals of salary and other compensation awards that are invested in Chevron stock units by certain officers and employees of the company. Diluted EPS includes the effects of these items as well as the dilutive effects of outstanding stock options awarded under the company’s stock option programs (refer to Note 20, “Stock Options and Other Share-Based Compensation,” beginning on page 86). The table below sets forth the computation of basic and diluted EPS:
Year ended December 31
2020 2019 2018
Basic EPS Calculation
Earnings available to common stockholders - Basic1 $ (5,543) $ 2,924 $ 14,824
Weighted-average number of common shares outstanding2 1,870 1,882 1,897 Add: Deferred awards held as stock units — — 1
Total weighted-average number of common shares outstanding 1,870 1,882 1,898
Earnings per share of common stock - Basic $ (2.96) $ 1.55 $ 7.81
Diluted EPS Calculation
Earnings available to common stockholders - Diluted1 $ (5,543) $ 2,924 $ 14,824
Weighted-average number of common shares outstanding2 1,870 1,882 1,897 Add: Deferred awards held as stock units — — 1 Add: Dilutive effect of employee stock-based awards — 13 16
Total weighted-average number of common shares outstanding 1,870 1,895 1,914
Earnings per share of common stock - Diluted $ (2.96) $ 1.54 $ 7.74
1 There was no effect of dividend equivalents paid on stock units or dilutive impact of employee stock-based awards on earnings. 2 Millions of shares; 1 million shares of employee-based awards were not included in the 2020 diluted EPS calculation as the result would be anti-dilutive.
Note 12 Operating Segments and Geographic Data Although each subsidiary of Chevron is responsible for its own affairs, Chevron Corporation manages its investments in these subsidiaries and their affiliates. The investments are grouped into two business segments, Upstream and Downstream, representing the company’s “reportable segments” and “operating segments.” Upstream operations consist primarily of exploring for, developing, producing and transporting crude oil and natural gas; liquefaction, transportation and regasification associated with liquefied natural gas (LNG); transporting crude oil by major international oil export pipelines; processing, transporting, storage and marketing of natural gas; and a gas-to-liquids plant. Downstream operations consist primarily of refining of crude oil into petroleum products; marketing of crude oil, refined products and lubricants; transporting of crude oil and refined products by pipeline, marine vessel, motor equipment and rail car; and manufacturing and marketing of commodity petrochemicals, plastics for industrial uses, and fuel and lubricant additives. All Other activities of the company include worldwide cash management and debt financing activities, corporate administrative functions, insurance operations, real estate activities, and technology activities.
Chevron Corporation 2020 Annual Report 74

Notes to the Consolidated Financial StatementsMillions of dollars, except per-share amounts
Note 9Assets Held for SaleAt December 31, 2020, the company classified $1,101 of net properties, plant and equipment as “Assets held for sale” on theConsolidated Balance Sheet. These assets are associated with upstream operations that are anticipated to be sold in the next12 months. The revenues and earnings contributions of these assets in 2020 were not material.
Note 10EquityRetained earnings at December 31, 2020 and 2019, included $26,532 and $25,319, respectively, for the company’s share ofundistributed earnings of equity affiliates.
At December 31, 2020, about 67 million shares of Chevron’s common stock remained available for issuance from the260 million shares that were reserved for issuance under the Chevron Long-Term Incentive Plan. In addition, 644,376 sharesremain available for issuance from the 1,600,000 shares of the company’s common stock that were reserved for awards underthe Chevron Corporation Non-Employee Directors’ Equity Compensation and Deferral Plan.
Note 11Earnings Per ShareBasic earnings per share (EPS) is based upon “Net Income (Loss) Attributable to Chevron Corporation” (“earnings”) andincludes the effects of deferrals of salary and other compensation awards that are invested in Chevron stock units by certainofficers and employees of the company. Diluted EPS includes the effects of these items as well as the dilutive effects ofoutstanding stock options awarded under the company’s stock option programs (refer to Note 20, “Stock Options and OtherShare-Based Compensation,” beginning on page 86). The table below sets forth the computation of basic and diluted EPS:
Year ended December 31
2020 2019 2018
Basic EPS Calculation
Earnings available to common stockholders - Basic1 $ (5,543) $ 2,924 $ 14,824
Weighted-average number of common shares outstanding2 1,870 1,882 1,897Add: Deferred awards held as stock units — — 1
Total weighted-average number of common shares outstanding 1,870 1,882 1,898
Earnings per share of common stock - Basic $ (2.96) $ 1.55 $ 7.81
Diluted EPS Calculation
Earnings available to common stockholders - Diluted1 $ (5,543) $ 2,924 $ 14,824
Weighted-average number of common shares outstanding2 1,870 1,882 1,897Add: Deferred awards held as stock units — — 1Add: Dilutive effect of employee stock-based awards — 13 16
Total weighted-average number of common shares outstanding 1,870 1,895 1,914
Earnings per share of common stock - Diluted $ (2.96) $ 1.54 $ 7.74
1 There was no effect of dividend equivalents paid on stock units or dilutive impact of employee stock-based awards on earnings.2 Millions of shares; 1 million shares of employee-based awards were not included in the 2020 diluted EPS calculation as the result would be anti-dilutive.
Note 12Operating Segments and Geographic DataAlthough each subsidiary of Chevron is responsible for its own affairs, Chevron Corporation manages its investments inthese subsidiaries and their affiliates. The investments are grouped into two business segments, Upstream and Downstream,representing the company’s “reportable segments” and “operating segments.” Upstream operations consist primarily ofexploring for, developing, producing and transporting crude oil and natural gas; liquefaction, transportation andregasification associated with liquefied natural gas (LNG); transporting crude oil by major international oil export pipelines;processing, transporting, storage and marketing of natural gas; and a gas-to-liquids plant. Downstream operations consistprimarily of refining of crude oil into petroleum products; marketing of crude oil, refined products and lubricants;transporting of crude oil and refined products by pipeline, marine vessel, motor equipment and rail car; and manufacturingand marketing of commodity petrochemicals, plastics for industrial uses, and fuel and lubricant additives. All Other activitiesof the company include worldwide cash management and debt financing activities, corporate administrative functions,insurance operations, real estate activities, and technology activities.
74 75
173155_Annual_Report_10-K.indd 75173155_Annual_Report_10-K.indd 75 3/5/21 6:04 PM3/5/21 6:04 PM
Notes to the Consolidated Financial Statements Millions of dollars, except per-share amounts
The company’s segments are managed by “segment managers” who report to the “chief operating decision maker” (CODM). The segments represent components of the company that engage in activities (a) from which revenues are earned and expenses are incurred; (b) whose operating results are regularly reviewed by the CODM, which makes decisions about resources to be allocated to the segments and assesses their performance; and (c) for which discrete financial information is available.
The company’s primary country of operation is the United States of America, its country of domicile. Other components of the company’s operations are reported as “International” (outside the United States).
Segment Earnings The company evaluates the performance of its operating segments on an after-tax basis, without considering the effects of debt financing interest expense or investment interest income, both of which are managed by the company on a worldwide basis. Corporate administrative costs are not allocated to the operating segments. However, operating segments are billed for the direct use of corporate services. Non billable costs remain at the corporate level in “All Other.” Earnings by major operating area are presented in the following table:
Year ended December 31
2020 2019 2018
Upstream United States $ (1,608) $ (5,094) $ 3,278 International (825) 7,670 10,038
Total Upstream (2,433) 2,576 13,316
Downstream United States (571) 1,559 2,103 International 618 922 1,695
Total Downstream 47 2,481 3,798
Total Segment Earnings (2,386) 5,057 17,114 All Other
Interest expense (658) (761) (713) Interest income 52 181 137 Other (2,551) (1,553) (1,714)
Net Income (Loss) Attributable to Chevron Corporation $ (5,543) $ 2,924 $ 14,824
Segment Assets Segment assets do not include intercompany investments or receivables. Assets at year-end 2020 and 2019 are as follows:
At December 31
2020 2019
Upstream United States $ 42,431 $ 35,926 International 144,476 145,648 Goodwill 4,402 4,463
Total Upstream 191,309 186,037
Downstream United States 23,490 25,197 International 16,096 16,955
Total Downstream 39,586 42,152
Total Segment Assets 230,895 228,189
All Other United States 4,017 3,475 International 4,878 5,764
Total All Other 8,895 9,239
Total Assets – United States 69,938 64,598 Total Assets – International 165,450 168,367 Goodwill 4,402 4,463
Total Assets $ 239,790 $ 237,428
Segment Sales and Other Operating Revenues Operating segment sales and other operating revenues, including internal transfers, for the years 2020, 2019 and 2018, are presented in the table on the next page. Products are transferred between operating segments at internal product values that approximate market prices.
Chevron Corporation 2020 Annual Report 75

76
Notes to the Consolidated Financial StatementsMillions of dollars, except per-share amounts
Note 13Investments and AdvancesEquity in earnings, together with investments in and advances to companies accounted for using the equity method and otherinvestments accounted for at or below cost, is shown in the following table. For certain equity affiliates, Chevron pays itsshare of some income taxes directly. For such affiliates, the equity in earnings does not include these taxes, which arereported on the Consolidated Statement of Income as “Income tax expense.”
Investments and AdvancesAt December 31
Equity in EarningsYear ended December 31
2020 2019 2020 2019 2018
UpstreamTengizchevroil $ 22,685 $ 20,214 $ 1,238 $ 3,067 $ 3,614Petropiar — 1,396 (1,396) 80 317Petroboscan — 1,139 (1,112) (11) 357Caspian Pipeline Consortium 835 883 159 155 170Angola LNG Limited 2,258 2,423 (166) (26) 172Noble Midstream equity affiliates 895 — (9) — —Other 980 881 146 (478) 19
Total Upstream 27,653 26,936 (1,140) 2,787 4,649
DownstreamChevron Phillips Chemical Company LLC 6,181 6,241 630 880 1,034GS Caltex Corporation 3,547 3,796 (185) 13 373Other 1,389 1,443 223 288 273
Total Downstream 11,117 11,480 668 1,181 1,680
All OtherOther (14) (14) — — (2)
Total equity method $ 38,756 $ 38,402 $ (472) $ 3,968 $ 6,327Other non-equity method investments 296 286
Total investments and advances $ 39,052 $ 38,688
Total United States $ 7,978 $ 7,203 $ 709 $ 641 $ 1,033Total International $ 31,074 $ 31,485 $ (1,181) $ 3,327 $ 5,294
Descriptions of major affiliates and non-equity investments, including significant differences between the company’scarrying value of its investments and its underlying equity in the net assets of the affiliates, are as follows:
Tengizchevroil Chevron has a 50 percent equity ownership interest in Tengizchevroil (TCO), which operates the Tengiz andKorolev crude oil fields in Kazakhstan. At December 31, 2020, the company’s carrying value of its investment in TCO wasabout $100 higher than the amount of underlying equity in TCO’s net assets. This difference results from Chevron acquiringa portion of its interest in TCO at a value greater than the underlying book value for that portion of TCO’s net assets.Included in the investment is a loan to TCO to fund the development of the Future Growth and Wellhead PressureManagement Project with a balance of $4,825.
Petropiar Chevron has a 30 percent interest in Petropiar, a joint stock company which operates the heavy oil Huyapari Fieldand upgrading project in Venezuela’s Orinoco Belt. In 2020, the company fully impaired its investments in the Petropiaraffiliate and, effective July 1, 2020, began accounting for this venture as a non-equity method investment. At December 31,2020, the underlying equity in Petropiar’s net assets was approximately $1,500.
Petroboscan Chevron has a 39.2 percent interest in Petroboscan, a joint stock company which operates the Boscan Field inVenezuela. In 2020, the company fully impaired its investments in the Petroboscan affiliate and, effective July 1, 2020,began accounting for this venture as a non-equity method investment. At December 31, 2020, the underlying equity inPetroboscan’s net assets was approximately $1,100. The company also has an outstanding long-term loan to Petroboscan of$560 at year-end 2020.
Caspian Pipeline Consortium Chevron has a 15 percent interest in the Caspian Pipeline Consortium, which provides thecritical export route for crude oil from both TCO and Karachaganak.
Angola LNG Limited Chevron has a 36.4 percent interest in Angola LNG Limited, which processes and liquefies natural gasproduced in Angola for delivery to international markets.
Noble Midstream Equity Affiliates Noble Midstream, a fully consolidated subsidiary of Chevron, has equity investments inentities which operate midstream assets in the United States. At December 31, 2020, equity investments included
77
173155_Annual_Report_10-K.indd 76173155_Annual_Report_10-K.indd 76 3/5/21 6:04 PM3/5/21 6:04 PM
Notes to the Consolidated Financial Statements Millions of dollars, except per-share amounts
Revenues for the upstream segment are derived primarily from the production and sale of crude oil and natural gas, as well as the sale of third-party production of natural gas. Revenues for the downstream segment are derived from the refining and marketing of petroleum products such as gasoline, jet fuel, gas oils, lubricants, residual fuel oils and other products derived from crude oil. This segment also generates revenues from the manufacture and sale of fuel and lubricant additives and the transportation and trading of refined products and crude oil. “All Other” activities include revenues from insurance operations, real estate activities and technology companies.
Year ended December 311
2020 2019 2018
Upstream United States $ 14,577 $ 23,358 $ 22,891 International 26,804 35,628 37,822
Subtotal 41,381 58,986 60,713
Intersegment Elimination – United States (8,068) (14,944) (13,965) Intersegment Elimination – International (7,002) (12,335) (13,679)
Total Upstream 26,311 31,707 33,069
Downstream United States 32,589 55,271 59,376 International 38,936 57,654 70,095
Subtotal 71,525 112,925 129,471
Intersegment Elimination – United States (2,150) (3,924) (2,742) Intersegment Elimination – International (1,292) (1,089) (1,132)
Total Downstream 68,083 107,912 125,597
All Other United States 744 1,064 1,022 International 15 20 22
Subtotal 759 1,084 1,044
Intersegment Elimination – United States (667) (818) (786) Intersegment Elimination – International (15) (20) (22)
Total All Other 77 246 236
Sales and Other Operating Revenues United States 47,910 79,693 83,289 International 65,755 93,302 107,939
Subtotal 113,665 172,995 191,228
Intersegment Elimination – United States (10,885) (19,686) (17,493) Intersegment Elimination – International (8,309) (13,444) (14,833)
Total Sales and Other Operating Revenues $ 94,471 $ 139,865 $ 158,902
1 Other than the United States, no other country accounted for 10 percent or more of the company’s Sales and Other Operating Revenues.
Segment Income Taxes Segment income tax expense for the years 2020, 2019 and 2018 is as follows:
Year ended December 31
2020 2019 2018
Upstream United States $ (570) $ (1,550) $ 811 International (415) 3,492 4,687
Total Upstream (985) 1,942 5,498
Downstream United States (192) 392 534 International 253 170 328
Total Downstream 61 562 862
All Other (968) 187 (645)
Total Income Tax Expense (Benefit) $ (1,892) $ 2,691 $ 5,715
Other Segment Information Additional information for the segmentation of major equity affiliates is contained in Note 13, on page 77. Information related to properties, plant and equipment by segment is contained in Note 16, on page 82.
Chevron Corporation 2020 Annual Report 76

Notes to the Consolidated Financial Statements Millions of dollars, except per-share amounts
Note 13 Investments and Advances Equity in earnings, together with investments in and advances to companies accounted for using the equity method and other investments accounted for at or below cost, is shown in the following table. For certain equity affiliates, Chevron pays its share of some income taxes directly. For such affiliates, the equity in earnings does not include these taxes, which are reported on the Consolidated Statement of Income as “Income tax expense.”
Investments and Advances At December 31
Equity in Earnings Year ended December 31
2020 2019 2020 2019 2018
Upstream Tengizchevroil $ 22,685 $ 20,214 $ 1,238 $ 3,067 $ 3,614 Petropiar — 1,396 (1,396) 80 317 Petroboscan — 1,139 (1,112) (11) 357 Caspian Pipeline Consortium 835 883 159 155 170 Angola LNG Limited 2,258 2,423 (166) (26) 172 Noble Midstream equity affiliates 895 — (9) — — Other 980 881 146 (478) 19
Total Upstream 27,653 26,936 (1,140) 2,787 4,649
Downstream Chevron Phillips Chemical Company LLC 6,181 6,241 630 880 1,034 GS Caltex Corporation 3,547 3,796 (185) 13 373 Other 1,389 1,443 223 288 273
Total Downstream 11,117 11,480 668 1,181 1,680
All Other Other (14) (14) — — (2)
Total equity method $ 38,756 $ 38,402 $ (472) $ 3,968 $ 6,327 Other non-equity method investments 296 286
Total investments and advances $ 39,052 $ 38,688
Total United States $ 7,978 $ 7,203 $ 709 $ 641 $ 1,033 Total International $ 31,074 $ 31,485 $ (1,181) $ 3,327 $ 5,294
Descriptions of major affiliates and non-equity investments, including significant differences between the company’s carrying value of its investments and its underlying equity in the net assets of the affiliates, are as follows:
Tengizchevroil Chevron has a 50 percent equity ownership interest in Tengizchevroil (TCO), which operates the Tengiz and Korolev crude oil fields in Kazakhstan. At December 31, 2020, the company’s carrying value of its investment in TCO was about $100 higher than the amount of underlying equity in TCO’s net assets. This difference results from Chevron acquiring a portion of its interest in TCO at a value greater than the underlying book value for that portion of TCO’s net assets. Included in the investment is a loan to TCO to fund the development of the Future Growth and Wellhead Pressure Management Project with a balance of $4,825.
Petropiar Chevron has a 30 percent interest in Petropiar, a joint stock company which operates the heavy oil Huyapari Field and upgrading project in Venezuela’s Orinoco Belt. In 2020, the company fully impaired its investments in the Petropiar affiliate and, effective July 1, 2020, began accounting for this venture as a non-equity method investment. At December 31, 2020, the underlying equity in Petropiar’s net assets was approximately $1,500.
Petroboscan Chevron has a 39.2 percent interest in Petroboscan, a joint stock company which operates the Boscan Field in Venezuela. In 2020, the company fully impaired its investments in the Petroboscan affiliate and, effective July 1, 2020, began accounting for this venture as a non-equity method investment. At December 31, 2020, the underlying equity in Petroboscan’s net assets was approximately $1,100. The company also has an outstanding long-term loan to Petroboscan of $560 at year-end 2020.
Caspian Pipeline Consortium Chevron has a 15 percent interest in the Caspian Pipeline Consortium, which provides the critical export route for crude oil from both TCO and Karachaganak.
Angola LNG Limited Chevron has a 36.4 percent interest in Angola LNG Limited, which processes and liquefies natural gas produced in Angola for delivery to international markets.
Noble Midstream Equity Affiliates Noble Midstream, a fully consolidated subsidiary of Chevron, has equity investments in entities which operate midstream assets in the United States. At December 31, 2020, equity investments included
Chevron Corporation 2020 Annual Report 77

Notes to the Consolidated Financial Statements Millions of dollars, except per-share amounts
Advantage Pipeline LLC (50 percent), Delaware Crossing LLC (50 percent), EPIC Crude Holdings (30 percent), EPIC Y-Grade (15 percent), EPIC Propane (15 percent), and Saddlehorn Pipeline Company, LLC (20 percent).
Chevron Phillips Chemical Company LLC Chevron owns 50 percent of Chevron Phillips Chemical Company LLC. The other half is owned by Phillips 66.
GS Caltex Corporation Chevron owns 50 percent of GS Caltex Corporation, a joint venture with GS Energy in South Korea. The joint venture imports, refines and markets petroleum products, petrochemicals and lubricants.
Other Information “Sales and other operating revenues” on the Consolidated Statement of Income includes $6,038, $8,006 and $10,378 with affiliated companies for 2020, 2019 and 2018, respectively. “Purchased crude oil and products” includes $3,003, $5,694 and $6,598 with affiliated companies for 2020, 2019 and 2018, respectively.
“Accounts and notes receivable” on the Consolidated Balance Sheet includes $807 and $810 due from affiliated companies at December 31, 2020 and 2019, respectively. “Accounts payable” includes $244 and $506 due to affiliated companies at December 31, 2020 and 2019, respectively.
The following table provides summarized financial information on a 100 percent basis for all equity affiliates as well as Chevron’s total share, which includes Chevron’s net loans to affiliates of $5,153, $4,331 and $3,402 at December 31, 2020, 2019 and 2018, respectively.
Affiliates Chevron Share
Year ended December 31 2020 2019 2018 2020 2019 2018
Total revenues $ 49,093 $ 66,473 $ 84,469 $ 21,641 $ 32,628 $ 40,679 Income before income tax expense 5,682 13,197 16,693 2,550 5,954 6,755 Net income attributable to affiliates 4,704 9,809 13,321 2,034 4,366 6,384
At December 31
Current assets $ 17,087 $ 30,791 $ 32,657 $ 7,328 $ 12,998 $ 12,813 Noncurrent assets 97,468 97,177 87,614 43,247 41,531 36,369 Current liabilities 12,164 26,032 26,006 5,052 10,610 9,843 Noncurrent liabilities 25,586 21,593 20,000 5,884 5,068 4,446
Total affiliates’ net equity $ 76,805 $ 80,343 $ 74,265 $ 39,639 $ 38,851 $ 34,893
Note 14 Litigation
MTBE Chevron and many other companies in the petroleum industry have used methyl tertiary butyl ether (MTBE) as a gasoline additive. Chevron is a party to six pending lawsuits and claims, the majority of which involve numerous other petroleum marketers and refiners. Resolution of these lawsuits and claims may ultimately require the company to correct or ameliorate the alleged effects on the environment of prior release of MTBE by the company or other parties. The company’s ultimate exposure related to pending lawsuits and claims is not determinable. The company no longer uses MTBE in the manufacture of gasoline in the United States.
Ecuador
Texaco Petroleum Company (Texpet), a subsidiary of Texaco Inc., was a minority member of an oil production consortium with Ecuadorian state-owned Petroecuador from 1967 until 1992. After termination of the consortium and a third-party environmental audit, Ecuador and the consortium parties entered into a settlement agreement specifying Texpet’s remediation obligations. Following Texpet’s completion of a three-year remediation program, Ecuador certified the remediation as proper and released Texpet and its affiliates from environmental liability. In May 2003, plaintiffs alleging environmental harm from the consortium’s activities sued Chevron in the Superior Court in Lago Agrio, Ecuador. In February 2011, that court entered a judgment against Chevron for approximately $9,500 plus additional punitive damages. An appellate panel affirmed, and Ecuador’s National Court of Justice ratified the judgment but nullified the punitive damages, resulting in a judgment of approximately $9,500. Ecuador’s highest Constitutional Court rejected Chevron’s final appeal in July 2018.
In February 2011, Chevron sued the Lago Agrio plaintiffs and several of their lawyers and supporters in the U.S. District Court for the Southern District of New York (SDNY) for violations of the Racketeer Influenced and Corrupt Organizations (RICO) Act and state law. The SDNY court ruled that the Ecuadorian judgment had been procured through fraud, bribery, and corruption, and prohibited the RICO defendants from seeking to enforce the Ecuadorian judgment in the United States or profiting from their illegal acts. The Court of Appeals for the Second Circuit affirmed, and the U.S. Supreme Court denied certiorari in June 2017, rendering final the U.S. judgment in favor of Chevron. The Lago Agrio plaintiffs sought to
Chevron Corporation 2020 Annual Report 78

Notes to the Consolidated Financial Statements Millions of dollars, except per-share amounts
have the Ecuadorian judgment recognized and enforced in Canada, Brazil, and Argentina. All of those recognition and enforcement actions were dismissed and resolved in Chevron’s favor. Chevron and Texpet filed an arbitration claim against Ecuador in September 2009 before an arbitral tribunal administered by the Permanent Court of Arbitration in The Hague, under the United States-Ecuador Bilateral Investment Treaty. In August 2018, the Tribunal issued an award holding that the Ecuadorian judgment was based on environmental claims that Ecuador had settled and released, and that it was procured through fraud, bribery, and corruption. According to the Tribunal, the Ecuadorian judgment “violates international public policy” and “should not be recognized or enforced by the courts of other States.” The Tribunal ordered Ecuador to remove the status of enforceability from the Ecuadorian judgment and to compensate Chevron for any injuries resulting from the judgment. The third and final phase of the arbitration, to determine the amount of compensation Ecuador owes to Chevron, is ongoing. In September 2020, the District Court of The Hague denied Ecuador’s request to set aside the Tribunal’s award, stating that it now is “common ground” between Ecuador and Chevron that the Ecuadorian judgment is fraudulent. In December 2020, Ecuador appealed the District Court’s decision to The Hague Court of Appeals. In a separate proceeding, Ecuador also admitted that the Ecuadorian judgment is fraudulent in a public filing with the Office of the United States Trade Representative in July 2020.
Management’s Assessment The ultimate outcome of the foregoing matters, including any financial effect on Chevron, remains uncertain. Chevron continues to believe that the Ecuadorian judgment is illegitimate and unenforceable and that it does not provide any basis upon which an estimate of a reasonably possible loss or range of loss can be made.
Note 15 Taxes
Income Taxes Year ended December 31
2020 2019 2018
Income tax expense (benefit) U.S. federal
Current $ (182) $ (73) $ (181) Deferred (1,315) (1,074) 738
State and local Current 65 153 183 Deferred (152) (172) (16)
Total United States (1,584) (1,166) 724
International Current 1,833 4,577 4,662 Deferred (2,141) (720) 329
Total International (308) 3,857 4,991
Total income tax expense (benefit) $ (1,892) $ 2,691 $ 5,715
The reconciliation between the U.S. statutory federal income tax rate and the company’s effective income tax rate is detailed in the following table:
2020 2019 2018
Income (loss) before income taxes United States $ (5,700) $ (5,483) $ 4,730 International (1,753) 11,019 15,845
Total income (loss) before income taxes (7,453) 5,536 20,575
Theoretical tax (at U.S. statutory rate of 21% ) (1,565) 1,163 4,321 Effect of U.S. tax reform — 3 (26) Equity affiliate accounting effect 211 (687) (1,526) Effect of income taxes from international operations* (39) 2,196 3,132 State and local taxes on income, net of U.S. federal income tax benefit (65) (18) 162 Prior year tax adjustments, claims and settlements (236) 192 (51) Tax credits (33) (18) (163) Other U.S.* (165) (140) (134)
Total income tax expense (benefit) $ (1,892) $ 2,691 $ 5,715
Effective income tax rate 25.4% 48.6% 27.8%
* Includes one-time tax costs (benefits) associated with changes in uncertain tax positions and valuation allowances.
The 2020 decrease in income tax expense of $4,583 is a result of the year-over-year decrease in total income before income tax expense, which is primarily due to lower crude oil prices in 2020, partially offset by lower impairment and write off
Chevron Corporation 2020 Annual Report 79

Notes to the Consolidated Financial Statements Millions of dollars, except per-share amounts
charges. The company’s effective tax rate changed from 49 percent in 2019 to 25 percent in 2020. The change in effective tax rate is a consequence of mix effect resulting from the absolute level of earnings or losses and whether they arose in higher or lower tax rate jurisdictions.
The company records its deferred taxes on a tax-jurisdiction basis. The reported deferred tax balances are composed of the following:
At December 31
2020 2019
Deferred tax liabilities Properties, plant and equipment $ 16,603 $ 17,251 Investments and other 5,617 5,372
Total deferred tax liabilities 22,220 22,623
Deferred tax assets Foreign tax credits (10,585) (9,840) Asset retirement obligations/environmental reserves (4,721) (4,329) Employee benefits (3,856) (3,454) Deferred credits (1,056) (1,083) Tax loss carryforwards (6,701) (5,262) Other accrued liabilities (228) (441) Inventory (633) (662) Operating leases (1,234) (1,211) Miscellaneous (3,685) (2,796)
Total deferred tax assets (32,699) (29,078)
Deferred tax assets valuation allowance 17,762 15,965
Total deferred taxes, net $ 7,283 $ 9,510
Deferred tax liabilities decreased by $403 from year-end 2019. The decrease to Properties, plant and equipment temporary differences was partially offset with an increase to Investments and other. The Properties, plant and equipment decrease was primarily due to upstream impairments. Deferred tax assets increased by $3,621 from year-end 2019. This increase was primarily related to increases in tax loss carryforwards for various locations, miscellaneous items related to foreign exchange and foreign tax credits acquired with the purchase of Noble.
The overall valuation allowance relates to deferred tax assets for U.S. foreign tax credit carryforwards, tax loss carryforwards and temporary differences. The valuation allowance reduces the deferred tax assets to amounts that are, in management’s assessment, more likely than not to be realized. At the end of 2020, the company had gross tax loss carryforwards of approximately $19,763 and tax credit carryforwards of approximately $1,056, primarily related to various international tax jurisdictions. Whereas some of these tax loss carryforwards do not have an expiration date, others expire at various times from 2021 through 2034. U.S. foreign tax credit carryforwards of $10,585 will expire between 2021 and 2030.
At December 31, 2020 and 2019, deferred taxes were classified on the Consolidated Balance Sheet as follows:
At December 31
2020 2019
Deferred charges and other assets $ (5,286) $ (4,178) Noncurrent deferred income taxes 12,569 13,688
Total deferred income taxes, net $ 7,283 $ 9,510
Income taxes are not accrued for unremitted earnings of international operations that have been or are intended to be reinvested indefinitely. The indefinite reinvestment assertion continues to apply for the purpose of determining deferred tax liabilities for U.S. state and foreign withholding tax purposes.
U.S. state and foreign withholding taxes are not accrued for unremitted earnings of international operations that have been or are intended to be reinvested indefinitely. Undistributed earnings of international consolidated subsidiaries and affiliates for which no deferred income tax provision has been made for possible future remittances totaled approximately $52,100 at December 31, 2020. This amount represents earnings reinvested as part of the company’s ongoing international business. It is not practicable to estimate the amount of state and foreign taxes that might be payable on the possible remittance of earnings that are intended to be reinvested indefinitely. The company does not anticipate incurring significant additional taxes on remittances of earnings that are not indefinitely reinvested.
Chevron Corporation 2020 Annual Report 80

Notes to the Consolidated Financial StatementsMillions of dollars, except per-share amounts
charges. The company’s effective tax rate changed from 49 percent in 2019 to 25 percent in 2020. The change in effectivetax rate is a consequence of mix effect resulting from the absolute level of earnings or losses and whether they arose inhigher or lower tax rate jurisdictions.
The company records its deferred taxes on a tax-jurisdiction basis. The reported deferred tax balances are composed of thefollowing:
At December 31
2020 2019
Deferred tax liabilitiesProperties, plant and equipment $ 16,603 $ 17,251Investments and other 5,617 5,372
Total deferred tax liabilities 22,220 22,623
Deferred tax assetsForeign tax credits (10,585) (9,840)Asset retirement obligations/environmental reserves (4,721) (4,329)Employee benefits (3,856) (3,454)Deferred credits (1,056) (1,083)Tax loss carryforwards (6,701) (5,262)Other accrued liabilities (228) (441)Inventory (633) (662)Operating leases (1,234) (1,211)Miscellaneous (3,685) (2,796)
Total deferred tax assets (32,699) (29,078)
Deferred tax assets valuation allowance 17,762 15,965
Total deferred taxes, net $ 7,283 $ 9,510
Deferred tax liabilities decreased by $403 from year-end 2019. The decrease to Properties, plant and equipment temporarydifferences was partially offset with an increase to Investments and other. The Properties, plant and equipment decrease wasprimarily due to upstream impairments. Deferred tax assets increased by $3,621 from year-end 2019. This increase wasprimarily related to increases in tax loss carryforwards for various locations, miscellaneous items related to foreign exchangeand foreign tax credits acquired with the purchase of Noble.
The overall valuation allowance relates to deferred tax assets for U.S. foreign tax credit carryforwards, tax loss carryforwardsand temporary differences. The valuation allowance reduces the deferred tax assets to amounts that are, in management’sassessment, more likely than not to be realized. At the end of 2020, the company had gross tax loss carryforwards ofapproximately $19,763 and tax credit carryforwards of approximately $1,056, primarily related to various international taxjurisdictions. Whereas some of these tax loss carryforwards do not have an expiration date, others expire at various timesfrom 2021 through 2034. U.S. foreign tax credit carryforwards of $10,585 will expire between 2021 and 2030.
At December 31, 2020 and 2019, deferred taxes were classified on the Consolidated Balance Sheet as follows:
At December 31
2020 2019
Deferred charges and other assets $ (5,286) $ (4,178)Noncurrent deferred income taxes 12,569 13,688
Total deferred income taxes, net $ 7,283 $ 9,510
Income taxes are not accrued for unremitted earnings of international operations that have been or are intended to bereinvested indefinitely. The indefinite reinvestment assertion continues to apply for the purpose of determining deferred taxliabilities for U.S. state and foreign withholding tax purposes.
U.S. state and foreign withholding taxes are not accrued for unremitted earnings of international operations that have been orare intended to be reinvested indefinitely. Undistributed earnings of international consolidated subsidiaries and affiliates forwhich no deferred income tax provision has been made for possible future remittances totaled approximately $52,100 atDecember 31, 2020. This amount represents earnings reinvested as part of the company’s ongoing international business. It isnot practicable to estimate the amount of state and foreign taxes that might be payable on the possible remittance of earningsthat are intended to be reinvested indefinitely. The company does not anticipate incurring significant additional taxes onremittances of earnings that are not indefinitely reinvested.
80 81
173155_Annual_Report_10-K.indd 81173155_Annual_Report_10-K.indd 81 3/5/21 6:04 PM3/5/21 6:04 PM
Notes to the Consolidated Financial Statements Millions of dollars, except per-share amounts
Uncertain Income Tax Positions The company recognizes a tax benefit in the financial statements for an uncertain tax position only if management’s assessment is that the position is “more likely than not” (i.e., a likelihood greater than 50 percent) to be allowed by the tax jurisdiction based solely on the technical merits of the position. The term “tax position” in the accounting standards for income taxes refers to a position in a previously filed tax return or a position expected to be taken in a future tax return that is reflected in measuring current or deferred income tax assets and liabilities for interim or annual periods.
The following table indicates the changes to the company’s unrecognized tax benefits for the years ended December 31, 2020, 2019 and 2018. The term “unrecognized tax benefits” in the accounting standards for income taxes refers to the differences between a tax position taken or expected to be taken in a tax return and the benefit measured and recognized in the financial statements. Interest and penalties are not included.
2020 2019 2018
Balance at January 1 $ 4,987 $ 5,070 $ 4,828 Foreign currency effects 2 1 (6) Additions based on tax positions taken in current year 253 94 239 Additions for tax positions taken in prior years 437 313 153 Reductions for tax positions taken in prior years (216) (194) (131) Settlements with taxing authorities in current year (429) (78) (13) Reductions as a result of a lapse of the applicable statute of limitations (16) (219) —
Balance at December 31 $ 5,018 $ 4,987 $ 5,070
Approximately 83 percent of the $5,018 of unrecognized tax benefits at December 31, 2020, would have an impact on the effective tax rate if subsequently recognized. Certain of these unrecognized tax benefits relate to tax carryforwards that may require a full valuation allowance at the time of any such recognition.
Tax positions for Chevron and its subsidiaries and affiliates are subject to income tax audits by many tax jurisdictions throughout the world. For the company’s major tax jurisdictions, examinations of tax returns for certain prior tax years had not been completed as of December 31, 2020. For these jurisdictions, the latest years for which income tax examinations had been finalized were as follows: United States – 2013, Nigeria – 2007, Australia – 2009 and Kazakhstan – 2012.
The company engages in ongoing discussions with tax authorities regarding the resolution of tax matters in the various jurisdictions. Both the outcome of these tax matters and the timing of resolution and/or closure of the tax audits are highly uncertain. However, it is reasonably possible that developments on tax matters in certain tax jurisdictions may result in significant increases or decreases in the company’s total unrecognized tax benefits within the next 12 months. Given the number of years that still remain subject to examination and the number of matters being examined in the various tax jurisdictions, the company is unable to estimate the range of possible adjustments to the balance of unrecognized tax benefits.
On the Consolidated Statement of Income, the company reports interest and penalties related to liabilities for uncertain tax positions as “Income tax expense.” As of December 31, 2020, accrual benefit of $(95) for anticipated interest and penalty were included on the Consolidated Balance Sheet, compared with accrual charges of $30 as of year-end 2019. Income tax expense (benefit) associated with interest and penalties was $(124), $(3) and $8 in 2020, 2019 and 2018, respectively.
Chevron Corporation 2020 Annual Report 81

82
Notes to the Consolidated Financial StatementsMillions of dollars, except per-share amounts
Note 17Short-Term Debt
At December 31
2020 2019
Commercial paper1 $ 5,612 $ 4,654Notes payable to banks and others with originating terms of one year or less 15 228Current maturities of long-term debt 2,600 5,054Current maturities of long-term finance leases 186 18Redeemable long-term obligations
Long-term debt 2,960 3,078
Subtotal 11,373 13,032Reclassified to long-term debt (9,825) (9,750)
Total short-term debt $ 1,548 $ 3,282
1 Weighted-average interest rates at December 31, 2020 and 2019, were 0.15% and 1.69%, respectively.
Redeemable long-term obligations consist primarily of tax-exempt variable-rate put bonds that are included as currentliabilities because they become redeemable at the option of the bondholders during the year following the balance sheet date.
The company may periodically enter into interest rate swaps on a portion of its short-term debt. At December 31, 2020, thecompany had no interest rate swaps on short-term debt.
At December 31, 2020, the company had $9,825 in 364-day committed credit facilities with various major banks that enablethe refinancing of short-term obligations on a long-term basis. The credit facilities allow the company to convert anyamounts outstanding into a term loan for a period of up to one year. This supports commercial paper borrowing and can alsobe used for general corporate purposes. The company’s practice has been to continually replace expiring commitments withnew commitments on substantially the same terms, maintaining levels management believes appropriate. Any borrowingsunder the facility would be unsecured indebtedness at interest rates based on the London Interbank Offered Rate or anaverage of base lending rates published by specified banks and on terms reflecting the company’s strong credit rating. Noborrowings were outstanding under this facility at December 31, 2020.
The company classified $9,825 and $9,750 of short-term debt as long-term at December 31, 2020 and 2019, respectively.Settlement of these obligations is not expected to require the use of working capital within one year, and the company hasboth the intent and the ability, as evidenced by committed credit facilities, to refinance them on a long-term basis.
83
173155_Annual_Report_10-K.indd 82173155_Annual_Report_10-K.indd 82 3/5/21 6:04 PM3/5/21 6:04 PM
Notes to the Consolidated Financial Statements Millions of dollars, except per-share amounts
Taxes Other Than on Income Year ended December 31
2020 2019 2018
United States Excise and similar taxes on products and merchandise $ 4,566 $ 4,990 $ 4,830 Consumer excise taxes collected on behalf of third parties (4,566) (4,990) (4,830) Import duties and other levies 7 2 15 Property and other miscellaneous taxes 2,248 1,785 1,577 Payroll taxes 235 254 246 Taxes on production 317 355 325
Total United States 2,807 2,396 2,163
International Excise and similar taxes on products and merchandise 2,367 2,801 3,031 Consumer excise taxes collected on behalf of third parties (2,367) (2,801) (3,031) Import duties and other levies 39 35 37 Property and other miscellaneous taxes 1,461 1,435 2,370 Payroll taxes 117 125 132 Taxes on production 75 145 165
Total International 1,692 1,740 2,704
Total taxes other than on income $ 4,499 $ 4,136 $ 4,867
Note 16 Properties, Plant and Equipment1
At December 31 Year ended December 31
Gross Investment at Cost Net Investment Additions at Cost2 Depreciation Expense3
2020 2019 2018 2020 2019 2018 2020 2019 2018 2020 2019 2018
Upstream United States $ 96,555 $ 82,117 $ 88,155 $ 38,175 $ 31,082 $ 39,526 $ 13,067 $ 7,751 $ 6,434 $ 6,841 $ 15,222 $ 5,328 International 209,846 206,292 215,329 102,010 102,639 113,603 11,069 3,664 4,865 11,121 12,618 12,726
Total Upstream 306,401 288,409 303,484 140,185 133,721 153,129 24,136 11,415 11,299 17,962 27,840 18,054
Downstream United States 26,499 25,968 24,685 11,101 11,398 10,838 638 1,452 1,259 851 869 751 International 7,993 7,480 7,237 3,395 3,114 3,023 573 355 278 283 256 282
Total Downstream 34,492 33,448 31,922 14,496 14,512 13,861 1,211 1,807 1,537 1,134 1,125 1,033
All Other United States 4,195 4,719 4,667 1,916 2,236 2,186 194 324 224 403 243 320 International 144 146 171 21 25 31 5 9 6 9 10 12
Total All Other 4,339 4,865 4,838 1,937 2,261 2,217 199 333 230 412 253 332
Total United States 127,249 112,804 117,507 51,192 44,716 52,550 13,899 9,527 7,917 8,095 16,334 6,399 Total International 217,983 213,918 222,737 105,426 105,778 116,657 11,647 4,028 5,149 11,413 12,884 13,020
Total $ 345,232 $ 326,722 $ 340,244 $ 156,618 $ 150,494 $ 169,207 $ 25,546 $ 13,555 $ 13,066 $ 19,508 $ 29,218 $ 19,419
1 Other than the United States and Australia, no other country accounted for 10 percent or more of the company’s net properties, plant and equipment (PP&E) in 2020. Australia had PP&E of $48,060, $51,359 and $53,768 in 2020, 2019 and 2018, respectively. Gross Investment at Cost, Net Investment and Additions at Cost for 2020 each include $16,703 associated with the Noble acquisition.
2 Net of dry hole expense related to prior years’ expenditures of $709, $49 and $343 in 2020, 2019 and 2018, respectively. 3 Depreciation expense includes accretion expense of $560, $628 and $654 in 2020, 2019 and 2018, respectively, and impairments of $2,792, $10,797 and $735 in 2020, 2019
and 2018, respectively.
Chevron Corporation 2020 Annual Report 82

Notes to the Consolidated Financial StatementsMillions of dollars, except per-share amounts
Taxes Other Than on Income Year ended December 31
2020 2019 2018
United StatesExcise and similar taxes on products and merchandise $ 4,566 $ 4,990 $ 4,830Consumer excise taxes collected on behalf of third parties (4,566) (4,990) (4,830)Import duties and other levies 7 2 15Property and other miscellaneous taxes 2,248 1,785 1,577Payroll taxes 235 254 246Taxes on production 317 355 325
Total United States 2,807 2,396 2,163
InternationalExcise and similar taxes on products and merchandise 2,367 2,801 3,031Consumer excise taxes collected on behalf of third parties (2,367) (2,801) (3,031)Import duties and other levies 39 35 37Property and other miscellaneous taxes 1,461 1,435 2,370Payroll taxes 117 125 132Taxes on production 75 145 165
Total International 1,692 1,740 2,704
Total taxes other than on income $ 4,499 $ 4,136 $ 4,867
Note 16Properties, Plant and Equipment1
At December 31 Year ended December 31
Gross Investment at Cost Net Investment Additions at Cost2 Depreciation Expense3
2020 2019 2018 2020 2019 2018 2020 2019 2018 2020 2019 2018
UpstreamUnited States $ 96,555 $ 82,117 $ 88,155 $ 38,175 $ 31,082 $ 39,526 $ 13,067 $ 7,751 $ 6,434 $ 6,841 $ 15,222 $ 5,328International 209,846 206,292 215,329 102,010 102,639 113,603 11,069 3,664 4,865 11,121 12,618 12,726
Total Upstream 306,401 288,409 303,484 140,185 133,721 153,129 24,136 11,415 11,299 17,962 27,840 18,054
DownstreamUnited States 26,499 25,968 24,685 11,101 11,398 10,838 638 1,452 1,259 851 869 751International 7,993 7,480 7,237 3,395 3,114 3,023 573 355 278 283 256 282
Total Downstream 34,492 33,448 31,922 14,496 14,512 13,861 1,211 1,807 1,537 1,134 1,125 1,033
All OtherUnited States 4,195 4,719 4,667 1,916 2,236 2,186 194 324 224 403 243 320International 144 146 171 21 25 31 5 9 6 9 10 12
Total All Other 4,339 4,865 4,838 1,937 2,261 2,217 199 333 230 412 253 332
Total United States 127,249 112,804 117,507 51,192 44,716 52,550 13,899 9,527 7,917 8,095 16,334 6,399Total International 217,983 213,918 222,737 105,426 105,778 116,657 11,647 4,028 5,149 11,413 12,884 13,020
Total $ 345,232 $ 326,722 $ 340,244 $ 156,618 $ 150,494 $ 169,207 $ 25,546 $ 13,555 $ 13,066 $ 19,508 $ 29,218 $ 19,419
1 Other than the United States and Australia, no other country accounted for 10 percent or more of the company’s net properties, plant and equipment (PP&E) in 2020. Australiahad PP&E of $48,060, $51,359 and $53,768 in 2020, 2019 and 2018, respectively. Gross Investment at Cost, Net Investment and Additions at Cost for 2020 each include$16,703 associated with the Noble acquisition.
2 Net of dry hole expense related to prior years’ expenditures of $709, $49 and $343 in 2020, 2019 and 2018, respectively.3 Depreciation expense includes accretion expense of $560, $628 and $654 in 2020, 2019 and 2018, respectively, and impairments of $2,792, $10,797 and $735 in 2020, 2019
and 2018, respectively.
82 83
173155_Annual_Report_10-K.indd 83173155_Annual_Report_10-K.indd 83 3/5/21 6:04 PM3/5/21 6:04 PM
Notes to the Consolidated Financial Statements Millions of dollars, except per-share amounts
Note 17 Short-Term Debt
At December 31
2020 2019
Commercial paper1 $ 5,612 $ 4,654 Notes payable to banks and others with originating terms of one year or less 15 228 Current maturities of long-term debt 2,600 5,054 Current maturities of long-term finance leases 186 18 Redeemable long-term obligations
Long-term debt 2,960 3,078
Subtotal 11,373 13,032 Reclassified to long-term debt (9,825) (9,750)
Total short-term debt $ 1,548 $ 3,282
1 Weighted-average interest rates at December 31, 2020 and 2019, were 0.15% and 1.69%, respectively.
Redeemable long-term obligations consist primarily of tax-exempt variable-rate put bonds that are included as current liabilities because they become redeemable at the option of the bondholders during the year following the balance sheet date.
The company may periodically enter into interest rate swaps on a portion of its short-term debt. At December 31, 2020, the company had no interest rate swaps on short-term debt.
At December 31, 2020, the company had $9,825 in 364-day committed credit facilities with various major banks that enable the refinancing of short-term obligations on a long-term basis. The credit facilities allow the company to convert any amounts outstanding into a term loan for a period of up to one year. This supports commercial paper borrowing and can also be used for general corporate purposes. The company’s practice has been to continually replace expiring commitments with new commitments on substantially the same terms, maintaining levels management believes appropriate. Any borrowings under the facility would be unsecured indebtedness at interest rates based on the London Interbank Offered Rate or an average of base lending rates published by specified banks and on terms reflecting the company’s strong credit rating. No borrowings were outstanding under this facility at December 31, 2020.
The company classified $9,825 and $9,750 of short-term debt as long-term at December 31, 2020 and 2019, respectively. Settlement of these obligations is not expected to require the use of working capital within one year, and the company has both the intent and the ability, as evidenced by committed credit facilities, to refinance them on a long-term basis.
Chevron Corporation 2020 Annual Report 83

84
Notes to the Consolidated Financial StatementsMillions of dollars, except per-share amounts
senior notes issued by CUSA, guaranteed by Chevron, and having the same interest rates and maturity dates as the Noblesenior notes. The aggregate principal amount of $5,697 prior Noble notes were validly tendered and accepted andsubsequently terminated. Following such termination, $103 aggregate principal amount remains outstanding across ten seriesof senior notes issued by Noble, for which Chevron provided no guarantee, and the indentures were modified to eliminateany financial reporting or credit rating requirements. In February 2021, the indenture governing Noble’s 7.250 percent seniordebentures due 2097 was modified to provide a guarantee by Chevron and eliminate any financial reporting or credit ratingrequirements.
See Note 7, beginning on page 71, for information concerning the fair value of the company’s long-term debt.
Note 19Accounting for Suspended Exploratory WellsThe company continues to capitalize exploratory well costs after the completion of drilling when the well has found asufficient quantity of reserves to justify completion as a producing well, and the business unit is making sufficient progressassessing the reserves and the economic and operating viability of the project. If either condition is not met or if the companyobtains information that raises substantial doubt about the economic or operational viability of the project, the exploratorywell would be assumed to be impaired, and its costs, net of any salvage value, would be charged to expense.
The following table indicates the changes to the company’s suspended exploratory well costs for the three years endedDecember 31, 2020:
2020 2019 2018
Beginning balance at January 1 $ 3,041 $ 3,563 $ 3,702Additions to capitalized exploratory well costs pending the determination of proved reserves 28 244 207Reclassifications to wells, facilities and equipment based on the determination of proved reserves (102) (500) (13)Capitalized exploratory well costs charged to expense (667) (125) (333)Other* 212 (141) —
Ending balance at December 31 $ 2,512 $ 3,041 $ 3,563
* 2020 represents fair value of well costs acquired in the Noble acquisition. 2019 represents property sales.
The following table provides an aging of capitalized well costs and the number of projects for which exploratory well costshave been capitalized for a period greater than one year since the completion of drilling. The aging of the former Noble wellsis based on the date the drilling was completed, rather than Chevron’s October 2020 acquisition of Noble.
At December 31
2020 2019 2018
Exploratory well costs capitalized for a period of one year or less $ 26 $ 214 $ 202Exploratory well costs capitalized for a period greater than one year 2,486 2,827 3,361
Balance at December 31 $ 2,512 $ 3,041 $ 3,563
Number of projects with exploratory well costs that have been capitalized for a period greater than one year* 17 22 30
* Certain projects have multiple wells or fields or both.
Of the $2,486 of exploratory well costs capitalized for more than one year at December 31, 2020, $1,197 is related to 7projects that had drilling activities underway or firmly planned for the near future. The $1,289 balance is related to 10projects in areas requiring a major capital expenditure before production could begin and for which additional drilling effortswere not underway or firmly planned for the near future. Additional drilling was not deemed necessary because the presenceof hydrocarbons had already been established, and other activities were in process to enable a future decision on projectdevelopment.
The projects for the $1,289 referenced above had the following activities associated with assessing the reserves and theprojects’ economic viability: (a) $826 (seven projects) – undergoing front-end engineering and design with final investmentdecision expected within four years; (b) $463 (three projects) – development alternatives under review. While progress wasbeing made on all 17 projects, the decision on the recognition of proved reserves under SEC rules in some cases may notoccur for several years because of the complexity, scale and negotiations associated with the projects. More than half of thesedecisions are expected to occur in the next five years.
85
173155_Annual_Report_10-K.indd 84173155_Annual_Report_10-K.indd 84 3/5/21 6:04 PM3/5/21 6:04 PM
Notes to the Consolidated Financial Statements Millions of dollars, except per-share amounts
Note 18 Long-Term Debt
Total long-term debt including finance lease liabilities at December 31, 2020, was $42,767. The company’s long-term debt outstanding at year-end 2020 and 2019 was as follows:
At December 31
2020 2019
Weighted Average Interest Rate (%)1
Range of Interest Rates (%)2 Principal Principal
Notes due 2021 2.100 $ 1,350 $ 1,350 Floating rate notes due 2021 0.913 0.751 - 1.171 650 650 Debentures due 2021 8.875 40 40 Notes due 2022 2.179 0.333 - 2.498 3,800 3,400 Floating rate notes due 2022 0.594 0.324 - 0.762 1,000 650 Notes due 2023 2.377 0.426 - 7.250 4,800 3,000 Floating rate notes due 2023 0.676 0.414 - 1.114 800 — Notes due 2024 3.291 2.895 - 3.900 1,650 1,000 Notes due 2025 1.724 0.687 - 3.326 4,000 750 Notes due 2026 2.954 2,250 2,250 Notes due 2027 2.379 1.018 - 8.000 2,000 — Notes due 2028 3.850 600 — Notes due 2029 3.250 500 — Notes due 2030 2.236 1,500 — Debentures due 2031 8.625 108 108 Debentures due 2032 8.414 8.000 - 8.625 222 222 Notes due 2040 2.978 500 — Notes due 2041 6.000 850 — Notes due 2043 5.250 1,000 — Notes due 2044 5.050 850 — Notes due 2047 4.950 500 — Notes due 2049 4.200 500 — Notes due 2050 2.763 2.343 - 3.078 1,750 — Debentures due 2097 7.250 84 — Bank loans due 2021 - 2023 1.530 1.240 - 2.004 1,948 — 3.400% loan3 3.400 218 218 Medium-term notes, maturing from 2021 to 2038 6.131 0.000 - 8.875 37 38 Notes due 2020 — 5,054
Total including debt due within one year 33,507 18,730 Debt due within one year (2,600) (5,054) Fair market valuation adjustment of Noble long-term debt 1,690 — Reclassified from short-term debt 9,825 9,750 Unamortized discounts and debt issuance costs (102) (17) Finance lease liabilities4 447 282
Total long-term debt $ 42,767 $ 23,691
1 Weighted-average interest rate at December 31, 2020 2 Range of interest rates at December 31, 2020. 3 Maturity date is conditional upon the occurrence of certain events. 2022 is the earliest period in which the loan may become payable 4 For details on finance lease liabilities, see Note 5 beginning on page 69
Chevron has an automatic shelf registration statement that expires in August 2023. This registration statement is for an unspecified amount of nonconvertible debt securities issued or guaranteed by Chevron Corporation or CUSA.
Long-term debt excluding finance lease liabilities with a principal balance of $33,507 matures as follows: 2021 – $2,600; 2022 – $5,548; 2023 – $6,475; 2024 – $1,650; 2025 – $4,000; and after 2025 – $13,234.
The company completed bond issuances of $8,000 and $4,000 in May and August 2020, respectively. Chevron also assumed total debt, including finance lease obligations, with a fair value of approximately $9,400, associated with the acquisition of Noble on October 5, 2020.
Included in the debt assumed from Noble were senior notes, with an aggregate principal amount of $5,800, with interest rates ranging from 3.250 percent to 8.000 percent and maturity dates ranging from 2023 to 2049. On January 6, 2021, Chevron announced that the aggregate principal amount of $5,697 of prior Noble senior notes were exchanged for new
Chevron Corporation 2020 Annual Report 84

Notes to the Consolidated Financial StatementsMillions of dollars, except per-share amounts
Note 18Long-Term Debt
Total long-term debt including finance lease liabilities at December 31, 2020, was $42,767. The company’s long-term debtoutstanding at year-end 2020 and 2019 was as follows:
At December 31
2020 2019
Weighted AverageInterest Rate (%)1
Range of InterestRates (%)2 Principal Principal
Notes due 2021 2.100 $ 1,350 $ 1,350Floating rate notes due 2021 0.913 0.751 - 1.171 650 650Debentures due 2021 8.875 40 40Notes due 2022 2.179 0.333 - 2.498 3,800 3,400Floating rate notes due 2022 0.594 0.324 - 0.762 1,000 650Notes due 2023 2.377 0.426 - 7.250 4,800 3,000Floating rate notes due 2023 0.676 0.414 - 1.114 800 —Notes due 2024 3.291 2.895 - 3.900 1,650 1,000Notes due 2025 1.724 0.687 - 3.326 4,000 750Notes due 2026 2.954 2,250 2,250Notes due 2027 2.379 1.018 - 8.000 2,000 —Notes due 2028 3.850 600 —Notes due 2029 3.250 500 —Notes due 2030 2.236 1,500 —Debentures due 2031 8.625 108 108Debentures due 2032 8.414 8.000 - 8.625 222 222Notes due 2040 2.978 500 —Notes due 2041 6.000 850 —Notes due 2043 5.250 1,000 —Notes due 2044 5.050 850 —Notes due 2047 4.950 500 —Notes due 2049 4.200 500 —Notes due 2050 2.763 2.343 - 3.078 1,750 —Debentures due 2097 7.250 84 —Bank loans due 2021 - 2023 1.530 1.240 - 2.004 1,948 —3.400% loan3 3.400 218 218Medium-term notes, maturing from 2021 to 2038 6.131 0.000 - 8.875 37 38Notes due 2020 — 5,054
Total including debt due within one year 33,507 18,730Debt due within one year (2,600) (5,054)Fair market valuation adjustment of Noble long-term debt 1,690 —Reclassified from short-term debt 9,825 9,750Unamortized discounts and debt issuance costs (102) (17)Finance lease liabilities4 447 282
Total long-term debt $ 42,767 $ 23,691
1 Weighted-average interest rate at December 31, 20202 Range of interest rates at December 31, 2020.3 Maturity date is conditional upon the occurrence of certain events. 2022 is the earliest period in which the loan may become payable4 For details on finance lease liabilities, see Note 5 beginning on page 69
Chevron has an automatic shelf registration statement that expires in August 2023. This registration statement is for anunspecified amount of nonconvertible debt securities issued or guaranteed by Chevron Corporation or CUSA.
Long-term debt excluding finance lease liabilities with a principal balance of $33,507 matures as follows: 2021 – $2,600;2022 – $5,548; 2023 – $6,475; 2024 – $1,650; 2025 – $4,000; and after 2025 – $13,234.
The company completed bond issuances of $8,000 and $4,000 in May and August 2020, respectively. Chevron also assumedtotal debt, including finance lease obligations, with a fair value of approximately $9,400, associated with the acquisition ofNoble on October 5, 2020.
Included in the debt assumed from Noble were senior notes, with an aggregate principal amount of $5,800, with interest ratesranging from 3.250 percent to 8.000 percent and maturity dates ranging from 2023 to 2049. On January 6, 2021, Chevronannounced that the aggregate principal amount of $5,697 of prior Noble senior notes were exchanged for new
84 85
173155_Annual_Report_10-K.indd 85173155_Annual_Report_10-K.indd 85 3/5/21 6:04 PM3/5/21 6:04 PM
Notes to the Consolidated Financial Statements Millions of dollars, except per-share amounts
senior notes issued by CUSA, guaranteed by Chevron, and having the same interest rates and maturity dates as the Noble senior notes. The aggregate principal amount of $5,697 prior Noble notes were validly tendered and accepted and subsequently terminated. Following such termination, $103 aggregate principal amount remains outstanding across ten series of senior notes issued by Noble, for which Chevron provided no guarantee, and the indentures were modified to eliminate any financial reporting or credit rating requirements. In February 2021, the indenture governing Noble’s 7.250 percent senior debentures due 2097 was modified to provide a guarantee by Chevron and eliminate any financial reporting or credit rating requirements.
See Note 7, beginning on page 71, for information concerning the fair value of the company’s long-term debt.
Note 19 Accounting for Suspended Exploratory Wells The company continues to capitalize exploratory well costs after the completion of drilling when the well has found a sufficient quantity of reserves to justify completion as a producing well, and the business unit is making sufficient progress assessing the reserves and the economic and operating viability of the project. If either condition is not met or if the company obtains information that raises substantial doubt about the economic or operational viability of the project, the exploratory well would be assumed to be impaired, and its costs, net of any salvage value, would be charged to expense.
The following table indicates the changes to the company’s suspended exploratory well costs for the three years ended December 31, 2020:
2020 2019 2018
Beginning balance at January 1 $ 3,041 $ 3,563 $ 3,702 Additions to capitalized exploratory well costs pending the determination of proved reserves 28 244 207 Reclassifications to wells, facilities and equipment based on the determination of proved reserves (102) (500) (13) Capitalized exploratory well costs charged to expense (667) (125) (333) Other* 212 (141) —
Ending balance at December 31 $ 2,512 $ 3,041 $ 3,563
* 2020 represents fair value of well costs acquired in the Noble acquisition. 2019 represents property sales.
The following table provides an aging of capitalized well costs and the number of projects for which exploratory well costs have been capitalized for a period greater than one year since the completion of drilling. The aging of the former Noble wells is based on the date the drilling was completed, rather than Chevron’s October 2020 acquisition of Noble.
At December 31
2020 2019 2018
Exploratory well costs capitalized for a period of one year or less $ 26 $ 214 $ 202 Exploratory well costs capitalized for a period greater than one year 2,486 2,827 3,361
Balance at December 31 $ 2,512 $ 3,041 $ 3,563
Number of projects with exploratory well costs that have been capitalized for a period greater than one year* 17 22 30
* Certain projects have multiple wells or fields or both.
Of the $2,486 of exploratory well costs capitalized for more than one year at December 31, 2020, $1,197 is related to 7 projects that had drilling activities underway or firmly planned for the near future. The $1,289 balance is related to 10 projects in areas requiring a major capital expenditure before production could begin and for which additional drilling efforts were not underway or firmly planned for the near future. Additional drilling was not deemed necessary because the presence of hydrocarbons had already been established, and other activities were in process to enable a future decision on project development.
The projects for the $1,289 referenced above had the following activities associated with assessing the reserves and the projects’ economic viability: (a) $826 (seven projects) – undergoing front-end engineering and design with final investment decision expected within four years; (b) $463 (three projects) – development alternatives under review. While progress was being made on all 17 projects, the decision on the recognition of proved reserves under SEC rules in some cases may not occur for several years because of the complexity, scale and negotiations associated with the projects. More than half of these decisions are expected to occur in the next five years.
Chevron Corporation 2020 Annual Report 85

86
Notes to the Consolidated Financial StatementsMillions of dollars, except per-share amounts
Year ended December 31
2020 2019 2018
Expected term in years1 6.6 6.6 6.5Volatility2 20.8 % 20.5 % 21.2 %Risk-free interest rate based on zero coupon U.S. treasury note 1.5 % 2.6 % 2.6 %Dividend yield 4.0 % 3.8 % 3.8 %Weighted-average fair value per option granted $ 13.00 $ 15.82 $ 18.18
1 Expected term is based on historical exercise and post-vesting cancellation data.2 Volatility rate is based on historical stock prices over an appropriate period, generally equal to the expected term.
A summary of option activity, including Noble, during 2020 is presented below:
Shares (Thousands)Weighted-Average
Exercise PriceAveraged Remaining
Contractual Term (Years) Aggregate Intrinsic Value
Outstanding at January 1, 2020 86,641 $ 103.22Granted 8,281 $ 150.98Exercised (2,739) $ 78.92Forfeited (2,033) $ 110.72
Outstanding at December 31, 2020 90,150 $ 108.17 4.11 $ 23
Exercisable at December 31, 2020 80,860 $ 107.65 3.59 $ 23
The total intrinsic value (i.e., the difference between the exercise price and the market price) of options exercised during2020, 2019 and 2018 was $92, $516 and $506, respectively. During this period, the company continued its practice of issuingtreasury shares upon exercise of these awards.
As of December 31, 2020, there was $57 of total unrecognized before-tax compensation cost related to nonvested share-based compensation arrangements granted under the plan. That cost is expected to be recognized over a weighted-averageperiod of 1.7 years.
At January 1, 2020, the number of LTIP performance shares outstanding was equivalent to 4,386,784 shares. During 2020,2,064,598 performance shares were granted, 676,282 shares vested with cash proceeds distributed to recipients and 1,340,303shares were forfeited. At December 31, 2020, performance shares outstanding were 4,434,797. The fair value of the liabilityrecorded for these instruments was $385, and was measured using the Monte Carlo simulation method.
At January 1, 2020, the number of restricted stock units outstanding was equivalent to 2,512,345 shares. During 2020,1,253,337 restricted stock units were granted, 165,007 units vested with cash proceeds distributed to recipients and 296,742units were forfeited. At December 31, 2020, restricted stock units outstanding were 3,303,933. The fair value of the liabilityrecorded for the vested portion of these instruments was $197, valued at the stock price as of December 31, 2020. In addition,outstanding stock appreciation rights that were granted under LTIP totaled approximately 4.1 million equivalent shares as ofDecember 31, 2020. The fair value of the liability recorded for the vested portion of these instruments was $34.
Note 21Employee Benefit PlansThe company has defined benefit pension plans for many employees. The company typically prefunds defined benefit plansas required by local regulations or in certain situations where prefunding provides economic advantages. In the United States,all qualified plans are subject to the Employee Retirement Income Security Act (ERISA) minimum funding standard. Thecompany does not typically fund U.S. nonqualified pension plans that are not subject to funding requirements under laws andregulations because contributions to these pension plans may be less economic and investment returns may be less attractivethan the company’s other investment alternatives.
The company also sponsors other postretirement benefit (OPEB) plans that provide medical and dental benefits, as well aslife insurance for some active and qualifying retired employees. The plans are unfunded, and the company and retirees sharethe costs. For the company’s main U.S. medical plan, the increase to the pre-Medicare company contribution for retireemedical coverage is limited to no more than 4 percent each year. Certain life insurance benefits are paid by the company.
The company recognizes the overfunded or underfunded status of each of its defined benefit pension and OPEB plans as anasset or liability on the Consolidated Balance Sheet.
87
173155_Annual_Report_10-K.indd 86173155_Annual_Report_10-K.indd 86 3/5/21 6:04 PM3/5/21 6:04 PM
Notes to the Consolidated Financial Statements Millions of dollars, except per-share amounts
The $2,486 of suspended well costs capitalized for a period greater than one year as of December 31, 2020, represents 89 exploratory wells in 17 projects. The tables below contain the aging of these costs on a well and project basis:
Aging based on drilling completion date of individual wells: Amount Number of wells
2000-2009 $ 342 17 2010-2014 1,457 54 2015-2019 687 18
Total $ 2,486 89
Aging based on drilling completion date of last suspended well in project: Amount Number of projects
2003-2012 $ 371 4 2013-2016 1,627 8 2017-2020 488 5
Total $ 2,486 17
Note 20 Stock Options and Other Share-Based Compensation Compensation expense for stock options for 2020, 2019 and 2018 was $94 ($74 after tax), $81 ($64 after tax) and $105 ($83 after tax), respectively. In addition, compensation expense for stock appreciation rights, restricted stock, performance shares and restricted stock units was $96 ($76 after tax), $313 ($266 after tax) and $60 ($47 after tax) for 2020, 2019 and 2018, respectively. No significant stock-based compensation cost was capitalized at December 31, 2020, or December 31, 2019.
Cash received in payment for option exercises under all share-based payment arrangements for 2020, 2019 and 2018 was $226, $1,090 and $1,159, respectively. Actual tax benefits realized for the tax deductions from option exercises were $8, $43 and $43 for 2020, 2019 and 2018, respectively.
Cash paid to settle performance shares, restricted stock units and stock appreciation rights was $95, $119 and $157 for 2020, 2019 and 2018, respectively. Cash paid in 2020 included $11 million for Noble awards paid under change-in-control plan provisions.
Awards under the Chevron Long-Term Incentive Plan (LTIP) may take the form of, but are not limited to, stock options, restricted stock, restricted stock units, stock appreciation rights, performance shares and nonstock grants. From April 2004 through May 2023, no more than 260 million shares may be issued under the LTIP. For awards issued on or after May 29, 2013, no more than 50 million of those shares may be in a form other than a stock option, stock appreciation right or award requiring full payment for shares by the award recipient. For the major types of awards issued before January 1, 2017, the contractual terms vary between three years for the performance shares and restricted stock units, and 10 years for the stock options and stock appreciation rights. For awards issued after January 1, 2017, contractual terms vary between three years for the performance shares and special restricted stock units, five years for standard restricted stock units and 10 years for the stock options and stock appreciation rights. Forfeitures for performance shares, restricted stock units, and stock appreciation rights are recognized as they occur. Forfeitures for stock options are estimated using historical forfeiture data dating back to 1990.
Noble Share-Based Plans (Noble Plans) On the closing of the acquisition of Noble in October 2020, outstanding stock options granted under various Noble Plans were exchanged for fully vested Chevron options at a conversion rate of 0.1191 Chevron shares for each Noble share. These awards retained the same provision as the original Noble Plans. Awards issued may be exercised for up to 5 years after termination of employment, depending upon the termination type, or the original expiration date, whichever is earlier. Other awards issued under the Noble Plans included restricted stock, phantom stock units, and performance shares that retained the same provisions as the original Noble Plans. Upon termination of employment due to change-in-control, all unvested awards issued under the Noble Plans, including stock options, restricted stock, phantom stock units and performance shares become vested on the termination date.
Fair Value and Assumptions The fair market values of stock options and stock appreciation rights granted in 2020, 2019 and 2018 were measured on the date of grant using the Black-Scholes option-pricing model, with the following weighted-average assumptions:
Chevron Corporation 2020 Annual Report 86

Notes to the Consolidated Financial StatementsMillions of dollars, except per-share amounts
The $2,486 of suspended well costs capitalized for a period greater than one year as of December 31, 2020, represents 89exploratory wells in 17 projects. The tables below contain the aging of these costs on a well and project basis:
Aging based on drilling completion date of individual wells: Amount Number of wells
2000-2009 $ 342 172010-2014 1,457 542015-2019 687 18
Total $ 2,486 89
Aging based on drilling completion date of last suspended well in project: Amount Number of projects
2003-2012 $ 371 42013-2016 1,627 82017-2020 488 5
Total $ 2,486 17
Note 20Stock Options and Other Share-Based CompensationCompensation expense for stock options for 2020, 2019 and 2018 was $94 ($74 after tax), $81 ($64 after tax) and $105 ($83after tax), respectively. In addition, compensation expense for stock appreciation rights, restricted stock, performance sharesand restricted stock units was $96 ($76 after tax), $313 ($266 after tax) and $60 ($47 after tax) for 2020, 2019 and 2018,respectively. No significant stock-based compensation cost was capitalized at December 31, 2020, or December 31, 2019.
Cash received in payment for option exercises under all share-based payment arrangements for 2020, 2019 and 2018 was$226, $1,090 and $1,159, respectively. Actual tax benefits realized for the tax deductions from option exercises were $8, $43and $43 for 2020, 2019 and 2018, respectively.
Cash paid to settle performance shares, restricted stock units and stock appreciation rights was $95, $119 and $157 for 2020,2019 and 2018, respectively. Cash paid in 2020 included $11 million for Noble awards paid under change-in-control planprovisions.
Awards under the Chevron Long-Term Incentive Plan (LTIP) may take the form of, but are not limited to, stock options,restricted stock, restricted stock units, stock appreciation rights, performance shares and nonstock grants. From April 2004through May 2023, no more than 260 million shares may be issued under the LTIP. For awards issued on or after May 29,2013, no more than 50 million of those shares may be in a form other than a stock option, stock appreciation right or awardrequiring full payment for shares by the award recipient. For the major types of awards issued before January 1, 2017, thecontractual terms vary between three years for the performance shares and restricted stock units, and 10 years for the stockoptions and stock appreciation rights. For awards issued after January 1, 2017, contractual terms vary between three years forthe performance shares and special restricted stock units, five years for standard restricted stock units and 10 years for thestock options and stock appreciation rights. Forfeitures for performance shares, restricted stock units, and stock appreciationrights are recognized as they occur. Forfeitures for stock options are estimated using historical forfeiture data dating back to1990.
Noble Share-Based Plans (Noble Plans) On the closing of the acquisition of Noble in October 2020, outstanding stockoptions granted under various Noble Plans were exchanged for fully vested Chevron options at a conversion rate of 0.1191Chevron shares for each Noble share. These awards retained the same provision as the original Noble Plans. Awards issuedmay be exercised for up to 5 years after termination of employment, depending upon the termination type, or the originalexpiration date, whichever is earlier. Other awards issued under the Noble Plans included restricted stock, phantom stockunits, and performance shares that retained the same provisions as the original Noble Plans. Upon termination of employmentdue to change-in-control, all unvested awards issued under the Noble Plans, including stock options, restricted stock,phantom stock units and performance shares become vested on the termination date.
Fair Value and Assumptions The fair market values of stock options and stock appreciation rights granted in 2020, 2019and 2018 were measured on the date of grant using the Black-Scholes option-pricing model, with the following weighted-average assumptions:
86 87
173155_Annual_Report_10-K.indd 87173155_Annual_Report_10-K.indd 87 3/5/21 6:04 PM3/5/21 6:04 PM
Notes to the Consolidated Financial Statements Millions of dollars, except per-share amounts
Year ended December 31
2020 2019 2018
Expected term in years1 6.6 6.6 6.5 Volatility2 20.8 % 20.5 % 21.2 % Risk-free interest rate based on zero coupon U.S. treasury note 1.5 % 2.6 % 2.6 % Dividend yield 4.0 % 3.8 % 3.8 % Weighted-average fair value per option granted $ 13.00 $ 15.82 $ 18.18
1 Expected term is based on historical exercise and post-vesting cancellation data. 2 Volatility rate is based on historical stock prices over an appropriate period, generally equal to the expected term.
A summary of option activity, including Noble, during 2020 is presented below:
Shares (Thousands) Weighted-Average
Exercise Price Averaged Remaining
Contractual Term (Years) Aggregate Intrinsic Value
Outstanding at January 1, 2020 86,641 $ 103.22 Granted 8,281 $ 150.98 Exercised (2,739) $ 78.92 Forfeited (2,033) $ 110.72
Outstanding at December 31, 2020 90,150 $ 108.17 4.11 $ 23
Exercisable at December 31, 2020 80,860 $ 107.65 3.59 $ 23
The total intrinsic value (i.e., the difference between the exercise price and the market price) of options exercised during 2020, 2019 and 2018 was $92, $516 and $506, respectively. During this period, the company continued its practice of issuing treasury shares upon exercise of these awards.
As of December 31, 2020, there was $57 of total unrecognized before-tax compensation cost related to nonvested share-based compensation arrangements granted under the plan. That cost is expected to be recognized over a weighted-average period of 1.7 years.
At January 1, 2020, the number of LTIP performance shares outstanding was equivalent to 4,386,784 shares. During 2020, 2,064,598 performance shares were granted, 676,282 shares vested with cash proceeds distributed to recipients and 1,340,303 shares were forfeited. At December 31, 2020, performance shares outstanding were 4,434,797. The fair value of the liability recorded for these instruments was $385, and was measured using the Monte Carlo simulation method.
At January 1, 2020, the number of restricted stock units outstanding was equivalent to 2,512,345 shares. During 2020, 1,253,337 restricted stock units were granted, 165,007 units vested with cash proceeds distributed to recipients and 296,742 units were forfeited. At December 31, 2020, restricted stock units outstanding were 3,303,933. The fair value of the liability recorded for the vested portion of these instruments was $197, valued at the stock price as of December 31, 2020. In addition, outstanding stock appreciation rights that were granted under LTIP totaled approximately 4.1 million equivalent shares as of December 31, 2020. The fair value of the liability recorded for the vested portion of these instruments was $34.
Note 21 Employee Benefit Plans The company has defined benefit pension plans for many employees. The company typically prefunds defined benefit plans as required by local regulations or in certain situations where prefunding provides economic advantages. In the United States, all qualified plans are subject to the Employee Retirement Income Security Act (ERISA) minimum funding standard. The company does not typically fund U.S. nonqualified pension plans that are not subject to funding requirements under laws and regulations because contributions to these pension plans may be less economic and investment returns may be less attractive than the company’s other investment alternatives.
The company also sponsors other postretirement benefit (OPEB) plans that provide medical and dental benefits, as well as life insurance for some active and qualifying retired employees. The plans are unfunded, and the company and retirees share the costs. For the company’s main U.S. medical plan, the increase to the pre-Medicare company contribution for retiree medical coverage is limited to no more than 4 percent each year. Certain life insurance benefits are paid by the company.
The company recognizes the overfunded or underfunded status of each of its defined benefit pension and OPEB plans as an asset or liability on the Consolidated Balance Sheet.
Chevron Corporation 2020 Annual Report 87

88
Notes to the Consolidated Financial StatementsMillions of dollars, except per-share amounts
Pension Benefits
2020 2019
U.S. Int’l. U.S. Int’l.
Projected benefit obligations $ 15,103 $ 2,084 $ 14,401 $ 1,554Accumulated benefit obligations 13,545 1,622 12,718 1,268Fair value of plan assets 9,842 600 10,091 278
The components of net periodic benefit cost and amounts recognized in the Consolidated Statement of ComprehensiveIncome for 2020, 2019 and 2018 are shown in the table below:
Pension Benefits
2020 2019 2018 Other Benefits
U.S. Int’l. U.S. Int’l. U.S. Int’l. 2020 2019 2018
Net Periodic Benefit CostService cost $ 497 $ 130 $ 406 $ 139 $ 480 $ 141 $ 38 $ 36 $ 42Interest cost 353 175 397 199 370 206 71 96 94Expected return on plan assets (650) (209) (565) (231) (636) (253) — — —Amortization of prior service costs (credits) 2 10 2 11 2 10 (28) (28) (28)Recognized actuarial losses 385 45 239 21 304 29 3 (3) 15Settlement losses 620 37 259 3 411 33 — — —Curtailment losses (gains) 92 2 — 16 — 3 (27) — —
Total net periodic benefit cost 1,299 190 738 158 931 169 57 101 123
Changes Recognized in Comprehensive IncomeNet actuarial (gain) loss during period 1,584 230 1,939 338 151 12 190 128 (248)Amortization of actuarial loss (1,005) (98) (498) (24) (715) (62) (4) 3 (15)Prior service (credits) costs during period — — — 29 — 23 — (1) 3Amortization of prior service (costs) credits (2) (17) (2) (30) (2) (13) 42 28 28
Total changes recognized in othercomprehensive income 577 115 1,439 313 (566) (40) 228 158 (232)
Recognized in Net Periodic Benefit Cost andOther Comprehensive Income $ 1,876 $ 305 $ 2,177 $ 471 $ 365 $ 129 $ 285 $ 259 $ (109)
Assumptions The following weighted-average assumptions were used to determine benefit obligations and net periodicbenefit costs for years ended December 31:
Pension Benefits
2020 2019 2018 Other Benefits
U.S. Int’l. U.S. Int’l. U.S. Int’l. 2020 2019 2018
Assumptions used to determine benefit obligations:Discount rate 2.4% 2.4% 3.1% 3.2% 4.2% 4.4% 2.6% 3.2% 4.4%Rate of compensation increase 4.5% 4.0% 4.5% 4.0% 4.5% 4.0% N/A N/A N/A
Assumptions used to determine net periodic benefit cost:Discount rate for service cost 3.3% 3.2% 4.4% 4.4% 3.7% 3.9% 3.5% 4.6% 3.9%Discount rate for interest cost 2.6% 3.2% 3.7% 4.4% 3.0% 3.9% 3.0% 4.2% 3.5%Expected return on plan assets 6.5% 4.5% 6.8% 5.6% 6.8% 5.5% N/A N/A N/ARate of compensation increase 4.5% 4.0% 4.5% 4.0% 4.5% 4.0% N/A N/A N/A
Expected Return on Plan Assets The company’s estimated long-term rates of return on pension assets are driven primarilyby actual historical asset-class returns, an assessment of expected future performance, advice from external actuarial firmsand the incorporation of specific asset-class risk factors. Asset allocations are periodically updated using pension plan asset/liability studies, and the company’s estimated long-term rates of return are consistent with these studies.
For 2020, the company used an expected long-term rate of return of 6.50 percent for U.S. pension plan assets, which accountfor 65 percent of the company’s pension plan assets. In both 2019 and 2018, the company used a long-term rate of return of6.75 percent for these plans.
The market-related value of assets of the main U.S. pension plan used in the determination of pension expense was based onthe market values in the three months preceding the year-end measurement date. Management considers the three-month timeperiod long enough to minimize the effects of distortions from day-to-day market volatility and still be contemporaneous tothe end of the year. For other plans, market value of assets as of year-end is used in calculating the pension expense.
89
173155_Annual_Report_10-K.indd 88173155_Annual_Report_10-K.indd 88 3/5/21 6:04 PM3/5/21 6:04 PM
Notes to the Consolidated Financial Statements Millions of dollars, except per-share amounts
The funded status of the company’s pension and OPEB plans for 2020 and 2019 follows:
Pension Benefits
Other Benefits 2020 2019
U.S. Int’l. U.S. Int’l. 2020 2019
Change in Benefit Obligation Benefit obligation at January 1 $ 14,465 $ 5,680 $ 11,726 $ 4,820 $ 2,520 $ 2,430 Service cost 497 130 406 139 38 36 Interest cost 353 175 397 199 71 96 Plan participants’ contributions — 3 — 4 59 72 Plan amendments — — — 29 — — Actuarial (gain) loss 1,782 550 2,922 673 191 125 Foreign currency exchange rate changes — 158 — 121 (1) 2 Benefits paid (2,045) (368) (1,035) (302) (214) (240) Divestitures/Acquisitions 22 — 49 — — (1) Curtailment 92 (21) — (3) (14) —
Benefit obligation at December 31 15,166 6,307 14,465 5,680 2,650 2,520
Change in Plan Assets Fair value of plan assets at January 1 10,177 4,791 8,532 4,142 — — Actual return on plan assets 848 500 1,548 566 — — Foreign currency exchange rate changes — 174 — 115 — — Employer contributions 950 263 1,096 266 155 168 Plan participants’ contributions — 3 — 4 59 72 Benefits paid (2,045) (368) (1,035) (302) (214) (240) Divestitures/Acquisitions — — 36 — — —
Fair value of plan assets at December 31 9,930 5,363 10,177 4,791 — —
Funded status at December 31 $ (5,236) $ (944) $ (4,288) $ (889) $ (2,650) $ (2,520)
Amounts recognized on the Consolidated Balance Sheet for the company’s pension and OPEB plans at December 31, 2020 and 2019, include:
Pension Benefits
Other Benefits 2020 2019
U.S. Int’l. U.S. Int’l. 2020 2019
Deferred charges and other assets $ 24 $ 547 $ 23 $ 413 $ — $ — Accrued liabilities (258) (76) (239) (71) (153) (174) Noncurrent employee benefit plans (5,002) (1,415) (4,072) (1,231) (2,497) (2,346)
Net amount recognized at December 31 $ (5,236) $ (944) $ (4,288) $ (889) $ (2,650) $ (2,520)
For the years ended December 31, 2020 and December 31, 2019, the increase in benefit obligations was primarily due to actuarial losses caused by lower discount rates used to value the obligations.
Amounts recognized on a before-tax basis in “Accumulated other comprehensive loss” for the company’s pension and OPEB plans were $7,278 and $6,357 at the end of 2020 and 2019, respectively. These amounts consisted of:
Pension Benefits
Other Benefits 2020 2019
U.S. Int’l. U.S. Int’l. 2020 2019
Net actuarial loss $ 5,714 $ 1,401 $ 5,135 $ 1,269 $ 260 $ 74 Prior service (credit) costs 3 86 5 102 (186) (228)
Total recognized at December 31 $ 5,717 $ 1,487 $ 5,140 $ 1,371 $ 74 $ (154)
The accumulated benefit obligations for all U.S. and international pension plans were $13,608 and $5,758, respectively, at December 31, 2020, and $12,781 and $5,203, respectively, at December 31, 2019.
Information for U.S. and international pension plans with an accumulated benefit obligation in excess of plan assets at December 31, 2020 and 2019, was:
Chevron Corporation 2020 Annual Report 88

Notes to the Consolidated Financial StatementsMillions of dollars, except per-share amounts
The funded status of the company’s pension and OPEB plans for 2020 and 2019 follows:
Pension Benefits
2020 2019 Other Benefits
U.S. Int’l. U.S. Int’l. 2020 2019
Change in Benefit ObligationBenefit obligation at January 1 $ 14,465 $ 5,680 $ 11,726 $ 4,820 $ 2,520 $ 2,430Service cost 497 130 406 139 38 36Interest cost 353 175 397 199 71 96Plan participants’ contributions — 3 — 4 59 72Plan amendments — — — 29 — —Actuarial (gain) loss 1,782 550 2,922 673 191 125Foreign currency exchange rate changes — 158 — 121 (1) 2Benefits paid (2,045) (368) (1,035) (302) (214) (240)Divestitures/Acquisitions 22 — 49 — — (1)Curtailment 92 (21) — (3) (14) —
Benefit obligation at December 31 15,166 6,307 14,465 5,680 2,650 2,520
Change in Plan AssetsFair value of plan assets at January 1 10,177 4,791 8,532 4,142 — —Actual return on plan assets 848 500 1,548 566 — —Foreign currency exchange rate changes — 174 — 115 — —Employer contributions 950 263 1,096 266 155 168Plan participants’ contributions — 3 — 4 59 72Benefits paid (2,045) (368) (1,035) (302) (214) (240)Divestitures/Acquisitions — — 36 — — —
Fair value of plan assets at December 31 9,930 5,363 10,177 4,791 — —
Funded status at December 31 $ (5,236) $ (944) $ (4,288) $ (889) $ (2,650) $ (2,520)
Amounts recognized on the Consolidated Balance Sheet for the company’s pension and OPEB plans at December 31, 2020and 2019, include:
Pension Benefits
2020 2019 Other Benefits
U.S. Int’l. U.S. Int’l. 2020 2019
Deferred charges and other assets $ 24 $ 547 $ 23 $ 413 $ — $ —Accrued liabilities (258) (76) (239) (71) (153) (174)Noncurrent employee benefit plans (5,002) (1,415) (4,072) (1,231) (2,497) (2,346)
Net amount recognized at December 31 $ (5,236) $ (944) $ (4,288) $ (889) $ (2,650) $ (2,520)
For the years ended December 31, 2020 and December 31, 2019, the increase in benefit obligations was primarily due toactuarial losses caused by lower discount rates used to value the obligations.
Amounts recognized on a before-tax basis in “Accumulated other comprehensive loss” for the company’s pension and OPEBplans were $7,278 and $6,357 at the end of 2020 and 2019, respectively. These amounts consisted of:
Pension Benefits
2020 2019 Other Benefits
U.S. Int’l. U.S. Int’l. 2020 2019
Net actuarial loss $ 5,714 $ 1,401 $ 5,135 $ 1,269 $ 260 $ 74Prior service (credit) costs 3 86 5 102 (186) (228)
Total recognized at December 31 $ 5,717 $ 1,487 $ 5,140 $ 1,371 $ 74 $ (154)
The accumulated benefit obligations for all U.S. and international pension plans were $13,608 and $5,758, respectively, atDecember 31, 2020, and $12,781 and $5,203, respectively, at December 31, 2019.
Information for U.S. and international pension plans with an accumulated benefit obligation in excess of plan assets atDecember 31, 2020 and 2019, was:
88 89
173155_Annual_Report_10-K.indd 89173155_Annual_Report_10-K.indd 89 3/5/21 6:04 PM3/5/21 6:04 PM
Notes to the Consolidated Financial Statements Millions of dollars, except per-share amounts
Pension Benefits
2020 2019
U.S. Int’l. U.S. Int’l.
Projected benefit obligations $ 15,103 $ 2,084 $ 14,401 $ 1,554 Accumulated benefit obligations 13,545 1,622 12,718 1,268 Fair value of plan assets 9,842 600 10,091 278
The components of net periodic benefit cost and amounts recognized in the Consolidated Statement of Comprehensive Income for 2020, 2019 and 2018 are shown in the table below:
Pension Benefits
Other Benefits 2020 2019 2018
U.S. Int’l. U.S. Int’l. U.S. Int’l. 2020 2019 2018
Net Periodic Benefit Cost Service cost $ 497 $ 130 $ 406 $ 139 $ 480 $ 141 $ 38 $ 36 $ 42 Interest cost 353 175 397 199 370 206 71 96 94 Expected return on plan assets (650) (209) (565) (231) (636) (253) — — — Amortization of prior service costs (credits) 2 10 2 11 2 10 (28) (28) (28) Recognized actuarial losses 385 45 239 21 304 29 3 (3) 15 Settlement losses 620 37 259 3 411 33 — — — Curtailment losses (gains) 92 2 — 16 — 3 (27) — —
Total net periodic benefit cost 1,299 190 738 158 931 169 57 101 123
Changes Recognized in Comprehensive Income Net actuarial (gain) loss during period 1,584 230 1,939 338 151 12 190 128 (248) Amortization of actuarial loss (1,005) (98) (498) (24) (715) (62) (4) 3 (15) Prior service (credits) costs during period — — — 29 — 23 — (1) 3 Amortization of prior service (costs) credits (2) (17) (2) (30) (2) (13) 42 28 28
Total changes recognized in other comprehensive income 577 115 1,439 313 (566) (40) 228 158 (232)
Recognized in Net Periodic Benefit Cost and Other Comprehensive Income $ 1,876 $ 305 $ 2,177 $ 471 $ 365 $ 129 $ 285 $ 259 $ (109)
Assumptions The following weighted-average assumptions were used to determine benefit obligations and net periodic benefit costs for years ended December 31:
Pension Benefits
2020 2019 2018 Other Benefits
U.S. Int’l. U.S. Int’l. U.S. Int’l. 2020 2019 2018
Assumptions used to determine benefit obligations: Discount rate 2.4% 2.4% 3.1% 3.2% 4.2% 4.4% 2.6% 3.2% 4.4% Rate of compensation increase 4.5% 4.0% 4.5% 4.0% 4.5% 4.0% N/A N/A N/A
Assumptions used to determine net periodic benefit cost: Discount rate for service cost 3.3% 3.2% 4.4% 4.4% 3.7% 3.9% 3.5% 4.6% 3.9% Discount rate for interest cost 2.6% 3.2% 3.7% 4.4% 3.0% 3.9% 3.0% 4.2% 3.5% Expected return on plan assets 6.5% 4.5% 6.8% 5.6% 6.8% 5.5% N/A N/A N/A Rate of compensation increase 4.5% 4.0% 4.5% 4.0% 4.5% 4.0% N/A N/A N/A
Expected Return on Plan Assets The company’s estimated long-term rates of return on pension assets are driven primarily by actual historical asset-class returns, an assessment of expected future performance, advice from external actuarial firms and the incorporation of specific asset-class risk factors. Asset allocations are periodically updated using pension plan asset/ liability studies, and the company’s estimated long-term rates of return are consistent with these studies.
For 2020, the company used an expected long-term rate of return of 6.50 percent for U.S. pension plan assets, which account for 65 percent of the company’s pension plan assets. In both 2019 and 2018, the company used a long-term rate of return of 6.75 percent for these plans.
The market-related value of assets of the main U.S. pension plan used in the determination of pension expense was based on the market values in the three months preceding the year-end measurement date. Management considers the three-month time period long enough to minimize the effects of distortions from day-to-day market volatility and still be contemporaneous to the end of the year. For other plans, market value of assets as of year-end is used in calculating the pension expense.
Chevron Corporation 2020 Annual Report 89

90
Notes to the Consolidated Financial StatementsMillions of dollars, except per-share amounts
The effects of fair value measurements using significant unobservable inputs on changes in Level 3 plan assets are outlinedbelow:
Equity Fixed Income
International Corporate Bank Loans Real Estate Other Total
Total at December 31, 2018 $ 1 $ 21 $ 5 $ 56 $ 46 $ 129Actual Return on Plan Assets:
Assets held at the reporting date (1) 1 — — (1) (1)Assets sold during the period — — — — — —
Purchases, Sales and Settlements — (19) — (1) 1 (19)Transfers in and/or out of Level 3 1 — 2 — — 3
Total at December 31, 2019 $ 1 $ 3 $ 7 $ 55 $ 46 $ 112
Actual Return on Plan Assets:Assets held at the reporting date — — — — 1 1Assets sold during the period — — — (10) — (10)
Purchases, Sales and Settlements — (3) (5) — (2) (10)Transfers in and/or out of Level 3 — — — — — —
Total at December 31, 2020 $ 1 $ — $ 2 $ 45 $ 45 $ 93
The primary investment objectives of the pension plans are to achieve the highest rate of total return within prudent levels ofrisk and liquidity, to diversify and mitigate potential downside risk associated with the investments, and to provide adequateliquidity for benefit payments and portfolio management.
The company’s U.S. and U.K. pension plans comprise 91 percent of the total pension assets. Both the U.S. and U.K. planshave an Investment Committee that regularly meets during the year to review the asset holdings and their returns. To assessthe plans’ investment performance, long-term asset allocation policy benchmarks have been established.
For the primary U.S. pension plan, the company’s Investment Committee has established the following approved assetallocation ranges: Equities 40–65 percent, Fixed Income 20–40 percent, Real Estate 0–15 percent, Alternative Investments0–5 percent and Cash 0–25 percent. For the U.K. pension plan, the U.K. Board of Trustees has established the followingasset allocation guidelines: Equities 10–30 percent, Fixed Income 55–85 percent, Real Estate 5–15 percent, and Cash 0–5 percent. The other significant international pension plans also have established maximum and minimum asset allocationranges that vary by plan. Actual asset allocation within approved ranges is based on a variety of factors, including marketconditions and illiquidity constraints. To mitigate concentration and other risks, assets are invested across multiple assetclasses with active investment managers and passive index funds.
The company does not prefund its OPEB obligations.
Cash Contributions and Benefit Payments In 2020, the company contributed $950 and $263 to its U.S. and internationalpension plans, respectively. In 2021, the company expects contributions to be approximately $1,050 to its U.S. plans and$200 to its international pension plans. Actual contribution amounts are dependent upon investment returns, changes inpension obligations, regulatory environments, tax law changes and other economic factors. Additional funding mayultimately be required if investment returns are insufficient to offset increases in plan obligations.
The company anticipates paying OPEB benefits of approximately $153 in 2021; $155 was paid in 2020.
The following benefit payments, which include estimated future service, are expected to be paid by the company in the next10 years:
Pension Benefits Other
U.S. Int’l. Benefits
2021 $ 1,779 $ 658 $ 1532022 919 220 1622023 1,069 225 1582024 1,097 243 1542025 1,068 250 1512026-2030 4,856 1,400 706
Employee Savings Investment Plan Eligible employees of Chevron and certain of its subsidiaries participate in the ChevronEmployee Savings Investment Plan (ESIP). Compensation expense for the ESIP totaled $281, $284 and $270 in 2020, 2019and 2018, respectively.
91
173155_Annual_Report_10-K.indd 90173155_Annual_Report_10-K.indd 90 3/5/21 6:04 PM3/5/21 6:04 PM
Notes to the Consolidated Financial Statements Millions of dollars, except per-share amounts
Discount Rate The discount rate assumptions used to determine the U.S. and international pension and OPEB plan obligations and expense reflect the rate at which benefits could be effectively settled, and are equal to the equivalent single rate resulting from yield curve analysis. This analysis considered the projected benefit payments specific to the company’s plans and the yields on high-quality bonds. The projected cash flows were discounted to the valuation date using the yield curve for the main U.S. pension and OPEB plans. The effective discount rates derived from this analysis at the end of 2020 were 2.4 for the main U.S. pension plan and 2.4 for the main U.S. OPEB plan. The discount rates for these plans at the end of 2019 were 3.1 and 3.1 percent, respectively, while in 2018 they were 4.2 and 4.3 percent for these plans, respectively.
Other Benefit Assumptions For the measurement of accumulated postretirement benefit obligation at December 31, 2020, for the main U.S. OPEB plan, the assumed health care cost-trend rates start with 6.1 percent in 2021 and gradually decline to 4.5 percent for 2027 and beyond. For this measurement at December 31, 2019, the assumed health care cost-trend rates started with 6.8 percent in 2020 and gradually declined to 4.5 percent for 2025 and beyond.
Plan Assets and Investment Strategy
The fair value measurements of the company’s pension plans for 2020 and 2019 are as follows:
U.S. Int’l.
Total Level 1 Level 2 Level 3 NAV Total Level 1 Level 2 Level 3 NAV
At December 31, 2019 Equities
U.S.1 $ 1,769 $ 1,769 $ — $ — $ — $ 471 $ 471 $ — $ — $ — International 1,958 1,958 — — — 422 421 — 1 — Collective Trusts/Mutual Funds2 1,079 52 — — 1,027 184 6 — — 178
Fixed Income Government 523 — 523 — — 265 144 121 — — Corporate 1,444 — 1,444 — — 493 — 490 3 — Bank Loans 120 — 113 7 — — — — — — Mortgage/Asset Backed 1 — 1 — — 4 — 4 — — Collective Trusts/Mutual Funds2 963 — — — 963 2,230 5 — — 2,225
Mixed Funds3 — — — — — 84 7 77 — — Real Estate4 1,089 — — — 1,089 277 — — 55 222 Alternative Investments 924 — — — 924 — — — — — Cash and Cash Equivalents 235 228 7 — — 338 334 2 — 2 Other5 72 (5) 29 44 4 23 — 21 2 —
Total at December 31, 2019 $ 10,177 $ 4,002 $ 2,117 $ 51 $ 4,007 $ 4,791 $ 1,388 $ 715 $ 61 $ 2,627
At December 31, 2020 Equities
U.S.1 $ 2,286 $ 2,286 $ — $ — $ — $ 443 $ 443 $ — $ — $ — International 2,211 2,210 — 1 — 373 373 — — — Collective Trusts/Mutual Funds2 1,107 48 — — 1,059 192 7 — — 185
Fixed Income Government 231 — 231 — — 240 125 115 — — Corporate 778 — 778 — — 578 10 568 — — Bank Loans 129 — 127 2 — — — — — — Mortgage/Asset Backed 1 — 1 — — 4 — 4 — — Collective Trusts/Mutual Funds2 1,901 13 — — 1,888 2,520 4 — — 2,516
Mixed Funds3 — — — — — 127 38 89 — — Real Estate4 1,018 — — — 1,018 448 — — 45 403 Alternative Investments — — — — — — — — — — Cash and Cash Equivalents 221 209 12 — — 417 408 3 — 6 Other5 47 (19) 22 41 3 21 (2) 19 4 —
Total at December 31, 2020 $ 9,930 $ 4,747 $ 1,171 $ 44 $ 3,968 $ 5,363 $ 1,406 $ 798 $ 49 $ 3,110
1 U.S. equities include investments in the company’s common stock in the amount of $4 at December 31, 2020, and $6 at December 31, 2019. 2 Collective Trusts/Mutual Funds for U.S. plans are entirely index funds; for International plans, they are mostly unit trust and index funds. 3 Mixed funds are composed of funds that invest in both equity and fixed-income instruments in order to diversify and lower risk. 4 The year-end valuations of the U.S. real estate assets are based on third-party appraisals that occur at least once a year for each property in the portfolio. 5 The “Other” asset class includes net payables for securities purchased but not yet settled (Level 1); dividends and interest- and tax-related receivables (Level 2); insurance
contracts (Level 3); and investments in private-equity limited partnerships (NAV).
Chevron Corporation 2020 Annual Report 90

Notes to the Consolidated Financial StatementsMillions of dollars, except per-share amounts
Discount Rate The discount rate assumptions used to determine the U.S. and international pension and OPEB planobligations and expense reflect the rate at which benefits could be effectively settled, and are equal to the equivalent singlerate resulting from yield curve analysis. This analysis considered the projected benefit payments specific to the company’splans and the yields on high-quality bonds. The projected cash flows were discounted to the valuation date using the yieldcurve for the main U.S. pension and OPEB plans. The effective discount rates derived from this analysis at the end of 2020were 2.4 for the main U.S. pension plan and 2.4 for the main U.S. OPEB plan. The discount rates for these plans at the end of2019 were 3.1 and 3.1 percent, respectively, while in 2018 they were 4.2 and 4.3 percent for these plans, respectively.
Other Benefit Assumptions For the measurement of accumulated postretirement benefit obligation at December 31, 2020,for the main U.S. OPEB plan, the assumed health care cost-trend rates start with 6.1 percent in 2021 and gradually decline to4.5 percent for 2027 and beyond. For this measurement at December 31, 2019, the assumed health care cost-trend ratesstarted with 6.8 percent in 2020 and gradually declined to 4.5 percent for 2025 and beyond.
Plan Assets and Investment Strategy
The fair value measurements of the company’s pension plans for 2020 and 2019 are as follows:
U.S. Int’l.
Total Level 1 Level 2 Level 3 NAV Total Level 1 Level 2 Level 3 NAV
At December 31, 2019Equities
U.S.1 $ 1,769 $ 1,769 $ — $ — $ — $ 471 $ 471 $ — $ — $ —International 1,958 1,958 — — — 422 421 — 1 —Collective Trusts/Mutual Funds2 1,079 52 — — 1,027 184 6 — — 178
Fixed IncomeGovernment 523 — 523 — — 265 144 121 — —Corporate 1,444 — 1,444 — — 493 — 490 3 —Bank Loans 120 — 113 7 — — — — — —Mortgage/Asset Backed 1 — 1 — — 4 — 4 — —Collective Trusts/Mutual Funds2 963 — — — 963 2,230 5 — — 2,225
Mixed Funds3 — — — — — 84 7 77 — —Real Estate4 1,089 — — — 1,089 277 — — 55 222Alternative Investments 924 — — — 924 — — — — —Cash and Cash Equivalents 235 228 7 — — 338 334 2 — 2Other5 72 (5) 29 44 4 23 — 21 2 —
Total at December 31, 2019 $ 10,177 $ 4,002 $ 2,117 $ 51 $ 4,007 $ 4,791 $ 1,388 $ 715 $ 61 $ 2,627
At December 31, 2020Equities
U.S.1 $ 2,286 $ 2,286 $ — $ — $ — $ 443 $ 443 $ — $ — $ —International 2,211 2,210 — 1 — 373 373 — — —Collective Trusts/Mutual Funds2 1,107 48 — — 1,059 192 7 — — 185
Fixed IncomeGovernment 231 — 231 — — 240 125 115 — —Corporate 778 — 778 — — 578 10 568 — —Bank Loans 129 — 127 2 — — — — — —Mortgage/Asset Backed 1 — 1 — — 4 — 4 — —Collective Trusts/Mutual Funds2 1,901 13 — — 1,888 2,520 4 — — 2,516
Mixed Funds3 — — — — — 127 38 89 — —Real Estate4 1,018 — — — 1,018 448 — — 45 403Alternative Investments — — — — — — — — — —Cash and Cash Equivalents 221 209 12 — — 417 408 3 — 6Other5 47 (19) 22 41 3 21 (2) 19 4 —
Total at December 31, 2020 $ 9,930 $ 4,747 $ 1,171 $ 44 $ 3,968 $ 5,363 $ 1,406 $ 798 $ 49 $ 3,110
1 U.S. equities include investments in the company’s common stock in the amount of $4 at December 31, 2020, and $6 at December 31, 2019.2 Collective Trusts/Mutual Funds for U.S. plans are entirely index funds; for International plans, they are mostly unit trust and index funds.3 Mixed funds are composed of funds that invest in both equity and fixed-income instruments in order to diversify and lower risk.4 The year-end valuations of the U.S. real estate assets are based on third-party appraisals that occur at least once a year for each property in the portfolio.5 The “Other” asset class includes net payables for securities purchased but not yet settled (Level 1); dividends and interest- and tax-related receivables (Level 2); insurance
contracts (Level 3); and investments in private-equity limited partnerships (NAV).
90 91
173155_Annual_Report_10-K.indd 91173155_Annual_Report_10-K.indd 91 3/5/21 6:04 PM3/5/21 6:04 PM
Notes to the Consolidated Financial Statements Millions of dollars, except per-share amounts
The effects of fair value measurements using significant unobservable inputs on changes in Level 3 plan assets are outlined below:
Equity
International
Fixed Income
Corporate Bank Loans Real Estate Other Total
Total at December 31, 2018 $ 1 $ 21 $ 5 $ 56 $ 46 $ 129 Actual Return on Plan Assets:
Assets held at the reporting date (1) 1 — — (1) (1) Assets sold during the period — — — — — —
Purchases, Sales and Settlements — (19) — (1) 1 (19) Transfers in and/or out of Level 3 1 — 2 — — 3
Total at December 31, 2019 $ 1 $ 3 $ 7 $ 55 $ 46 $ 112
Actual Return on Plan Assets: Assets held at the reporting date — — — — 1 1 Assets sold during the period — — — (10) — (10)
Purchases, Sales and Settlements — (3) (5) — (2) (10) Transfers in and/or out of Level 3 — — — — — —
Total at December 31, 2020 $ 1 $ — $ 2 $ 45 $ 45 $ 93
The primary investment objectives of the pension plans are to achieve the highest rate of total return within prudent levels of risk and liquidity, to diversify and mitigate potential downside risk associated with the investments, and to provide adequate liquidity for benefit payments and portfolio management.
The company’s U.S. and U.K. pension plans comprise 91 percent of the total pension assets. Both the U.S. and U.K. plans have an Investment Committee that regularly meets during the year to review the asset holdings and their returns. To assess the plans’ investment performance, long-term asset allocation policy benchmarks have been established.
For the primary U.S. pension plan, the company’s Investment Committee has established the following approved asset allocation ranges: Equities 40–65 percent, Fixed Income 20–40 percent, Real Estate 0–15 percent, Alternative Investments 0–5 percent and Cash 0–25 percent. For the U.K. pension plan, the U.K. Board of Trustees has established the following asset allocation guidelines: Equities 10–30 percent, Fixed Income 55–85 percent, Real Estate 5–15 percent, and Cash 0– 5 percent. The other significant international pension plans also have established maximum and minimum asset allocation ranges that vary by plan. Actual asset allocation within approved ranges is based on a variety of factors, including market conditions and illiquidity constraints. To mitigate concentration and other risks, assets are invested across multiple asset classes with active investment managers and passive index funds.
The company does not prefund its OPEB obligations.
Cash Contributions and Benefit Payments In 2020, the company contributed $950 and $263 to its U.S. and international pension plans, respectively. In 2021, the company expects contributions to be approximately $1,050 to its U.S. plans and $200 to its international pension plans. Actual contribution amounts are dependent upon investment returns, changes in pension obligations, regulatory environments, tax law changes and other economic factors. Additional funding may ultimately be required if investment returns are insufficient to offset increases in plan obligations.
The company anticipates paying OPEB benefits of approximately $153 in 2021; $155 was paid in 2020.
The following benefit payments, which include estimated future service, are expected to be paid by the company in the next 10 years:
Pension Benefits Other
Benefits U.S. Int’l.
2021 $ 1,779 $ 658 $ 153 2022 919 220 162 2023 1,069 225 158 2024 1,097 243 154 2025 1,068 250 151 2026-2030 4,856 1,400 706
Employee Savings Investment Plan Eligible employees of Chevron and certain of its subsidiaries participate in the Chevron Employee Savings Investment Plan (ESIP). Compensation expense for the ESIP totaled $281, $284 and $270 in 2020, 2019 and 2018, respectively.
Chevron Corporation 2020 Annual Report 91

92
Notes to the Consolidated Financial StatementsMillions of dollars, except per-share amounts
ultimately be shared with project partners. Total payments under the agreements were approximately $500 in 2020, $800 in2019 and $1,400 in 2018.
Environmental The company is subject to loss contingencies pursuant to laws, regulations, private claims and legalproceedings related to environmental matters that are subject to legal settlements or that in the future may require thecompany to take action to correct or ameliorate the effects on the environment of prior release of chemicals or petroleumsubstances, including MTBE, by the company or other parties. Such contingencies may exist for various operating, closedand divested sites, including, but not limited to, federal Superfund sites and analogous sites under state laws, refineries,chemical plants, marketing facilities, crude oil fields, and mining sites.
Although the company has provided for known environmental obligations that are probable and reasonably estimable, it islikely that the company will continue to incur additional liabilities. The amount of additional future costs are not fullydeterminable due to such factors as the unknown magnitude of possible contamination, the unknown timing and extent of thecorrective actions that may be required, the determination of the company’s liability in proportion to other responsibleparties, and the extent to which such costs are recoverable from third parties. These future costs may be material to results ofoperations in the period in which they are recognized, but the company does not expect these costs will have a material effecton its consolidated financial position or liquidity.
Chevron’s environmental reserve as of December 31, 2020, was $1,139. Included in this balance was $247 related toremediation activities at approximately 145 sites for which the company had been identified as a potentially responsible partyunder the provisions of the federal Superfund law or analogous state laws which provide for joint and several liability for allresponsible parties. Any future actions by regulatory agencies to require Chevron to assume other potentially responsibleparties’ costs at designated hazardous waste sites are not expected to have a material effect on the company’s results ofoperations, consolidated financial position or liquidity.
Of the remaining year-end 2020 environmental reserves balance of $892, $611 is related to the company’s U.S. downstreamoperations, $47 to its international downstream operations, $233 to upstream operations and $1 to other businesses.Liabilities at all sites were primarily associated with the company’s plans and activities to remediate soil or groundwatercontamination or both.
The company manages environmental liabilities under specific sets of regulatory requirements, which in the United Statesinclude the Resource Conservation and Recovery Act and various state and local regulations. No single remediation site atyear-end 2020 had a recorded liability that was material to the company’s results of operations, consolidated financialposition or liquidity.
Refer to Note 23 on page 94 for a discussion of the company’s asset retirement obligations.
Other Contingencies Governmental and other entities in California and other jurisdictions have filed legal proceedingsagainst fossil fuel producing companies, including Chevron, purporting to seek legal and equitable relief to address allegedimpacts of climate change. Further such proceedings are likely to be filed by other parties. The unprecedented legal theoriesset forth in these proceedings entail the possibility of damages liability and injunctions against the production of all fossilfuels that, while we believe remote, could have a material adverse effect on the company’s results of operations and financialcondition. Management believes that these proceedings are legally and factually meritless and detract from constructiveefforts to address the important policy issues presented by climate change, and will vigorously defend against suchproceedings.
Seven coastal parishes and the State of Louisiana have filed 43 separate lawsuits in Louisiana against numerous oil and gascompanies seeking damages for coastal erosion in or near oil fields located within Louisiana’s coastal zone under Louisiana’sState and Local Coastal Resources Management Act (SLCRMA). Chevron entities are defendants in 39 of these cases. Thelawsuits allege that the defendants’ historical operations were conducted without necessary permits or failed to comply withpermits obtained and seek damages and other relief, including the costs of restoring coastal wetlands allegedly impacted byoil field operations. Plaintiffs’ SLCRMA theories are unprecedented; thus, there remains significant uncertainty about thescope of the claims and alleged damages and any potential effects on the company’s results of operations and financialcondition. Management believes that the claims lack legal and factual merit and will continue to vigorously defend againstsuch proceedings.
Chevron receives claims from and submits claims to customers; trading partners; joint venture partners; U.S. federal, stateand local regulatory bodies; governments; contractors; insurers; suppliers; and individuals. The amounts of these claims,
93
173155_Annual_Report_10-K.indd 92173155_Annual_Report_10-K.indd 92 3/5/21 6:04 PM3/5/21 6:04 PM
Notes to the Consolidated Financial Statements Millions of dollars, except per-share amounts
Benefit Plan Trusts Prior to its acquisition by Chevron, Texaco established a benefit plan trust for funding obligations under some of its benefit plans. At year-end 2020, the trust contained 14.2 million shares of Chevron treasury stock. The trust will sell the shares or use the dividends from the shares to pay benefits only to the extent that the company does not pay such benefits. The company intends to continue to pay its obligations under the benefit plans. The trustee will vote the shares held in the trust as instructed by the trust’s beneficiaries. The shares held in the trust are not considered outstanding for earnings-per-share purposes until distributed or sold by the trust in payment of benefit obligations.
Prior to its acquisition by Chevron, Unocal established various grantor trusts to fund obligations under some of its benefit plans, including the deferred compensation and supplemental retirement plans. At December 31, 2020 and 2019, trust assets of $36 and $35, respectively, were invested primarily in interest-earning accounts.
Employee Incentive Plans The Chevron Incentive Plan is an annual cash bonus plan for eligible employees that links awards to corporate, business unit and individual performance in the prior year. Charges to expense for cash bonuses were $462, $826 and $1,048 in 2020, 2019 and 2018, respectively. Chevron also has the LTIP for officers and other regular salaried employees of the company and its subsidiaries who hold positions of significant responsibility. Awards under the LTIP consist of stock options and other share-based compensation that are described in Note 20, beginning on page 86.
Note 22 Other Contingencies and Commitments Income Taxes The company calculates its income tax expense and liabilities quarterly. These liabilities generally are subject to audit and are not finalized with the individual taxing authorities until several years after the end of the annual period for which income taxes have been calculated. Refer to Note 15, beginning on page 79, for a discussion of the periods for which tax returns have been audited for the company’s major tax jurisdictions and a discussion for all tax jurisdictions of the differences between the amount of tax benefits recognized in the financial statements and the amount taken or expected to be taken in a tax return.
Settlement of open tax years, as well as other tax issues in countries where the company conducts its businesses, are not expected to have a material effect on the consolidated financial position or liquidity of the company and, in the opinion of management, adequate provisions have been made for all years under examination or subject to future examination.
Guarantees The company has two guarantees to equity affiliates totaling $391. Of this amount, $137 is associated with a financing arrangement with an equity affiliate. Over the approximate 1-year remaining term of this guarantee, the maximum amount will be reduced as payments are made by the affiliate. The remaining amount of $254 is associated with certain payments under a terminal use agreement entered into by an equity affiliate. Over the approximate 7-year remaining term of this guarantee, the maximum guarantee amount will be reduced as certain fees are paid by the affiliate. There are numerous cross-indemnity agreements with the affiliate and the other partners to permit recovery of amounts paid under the guarantee. Chevron has recorded no liability for either guarantee.
Indemnifications In the acquisition of Unocal, the company assumed certain indemnities relating to contingent environmental liabilities associated with assets that were sold in 1997. The acquirer of those assets shared in certain environmental remediation costs up to a maximum obligation of $200, which had been reached at December 31, 2009. Under the indemnification agreement, after reaching the $200 obligation, Chevron is solely responsible until April 2022, when the indemnification expires. The environmental conditions or events that are subject to these indemnities must have arisen prior to the sale of the assets in 1997.
Although the company has provided for known obligations under this indemnity that are probable and reasonably estimable, the amount of additional future costs may be material to results of operations in the period in which they are recognized. The company does not expect these costs will have a material effect on its consolidated financial position or liquidity.
Long-Term Unconditional Purchase Obligations and Commitments, Including Throughput and Take-or-Pay Agreements The company and its subsidiaries have certain contingent liabilities with respect to long-term unconditional purchase obligations and commitments, including throughput and take-or-pay agreements, some of which may relate to suppliers’ financing arrangements. The agreements typically provide goods and services, such as pipeline and storage capacity, utilities, and petroleum products, to be used or sold in the ordinary course of the company’s business. The aggregate approximate amounts of required payments under these various commitments are: 2021 – $1,000; 2022 – $1,200; 2023 – $1,300; 2024 – $1,300; 2025 – $1,400; 2026 and after – $8,400. A portion of these commitments may
Chevron Corporation 2020 Annual Report 92

Notes to the Consolidated Financial StatementsMillions of dollars, except per-share amounts
Benefit Plan Trusts Prior to its acquisition by Chevron, Texaco established a benefit plan trust for funding obligations undersome of its benefit plans. At year-end 2020, the trust contained 14.2 million shares of Chevron treasury stock. The trust willsell the shares or use the dividends from the shares to pay benefits only to the extent that the company does not pay suchbenefits. The company intends to continue to pay its obligations under the benefit plans. The trustee will vote the shares heldin the trust as instructed by the trust’s beneficiaries. The shares held in the trust are not considered outstanding forearnings-per-share purposes until distributed or sold by the trust in payment of benefit obligations.
Prior to its acquisition by Chevron, Unocal established various grantor trusts to fund obligations under some of its benefitplans, including the deferred compensation and supplemental retirement plans. At December 31, 2020 and 2019, trust assetsof $36 and $35, respectively, were invested primarily in interest-earning accounts.
Employee Incentive Plans The Chevron Incentive Plan is an annual cash bonus plan for eligible employees that linksawards to corporate, business unit and individual performance in the prior year. Charges to expense for cash bonuses were$462, $826 and $1,048 in 2020, 2019 and 2018, respectively. Chevron also has the LTIP for officers and other regularsalaried employees of the company and its subsidiaries who hold positions of significant responsibility. Awards under theLTIP consist of stock options and other share-based compensation that are described in Note 20, beginning on page 86.
Note 22Other Contingencies and CommitmentsIncome Taxes The company calculates its income tax expense and liabilities quarterly. These liabilities generally are subjectto audit and are not finalized with the individual taxing authorities until several years after the end of the annual period forwhich income taxes have been calculated. Refer to Note 15, beginning on page 79, for a discussion of the periods for whichtax returns have been audited for the company’s major tax jurisdictions and a discussion for all tax jurisdictions of thedifferences between the amount of tax benefits recognized in the financial statements and the amount taken or expected to betaken in a tax return.
Settlement of open tax years, as well as other tax issues in countries where the company conducts its businesses, are notexpected to have a material effect on the consolidated financial position or liquidity of the company and, in the opinion ofmanagement, adequate provisions have been made for all years under examination or subject to future examination.
Guarantees The company has two guarantees to equity affiliates totaling $391. Of this amount, $137 is associated with afinancing arrangement with an equity affiliate. Over the approximate 1-year remaining term of this guarantee, the maximumamount will be reduced as payments are made by the affiliate. The remaining amount of $254 is associated with certainpayments under a terminal use agreement entered into by an equity affiliate. Over the approximate 7-year remaining term ofthis guarantee, the maximum guarantee amount will be reduced as certain fees are paid by the affiliate. There are numerouscross-indemnity agreements with the affiliate and the other partners to permit recovery of amounts paid under the guarantee.Chevron has recorded no liability for either guarantee.
Indemnifications In the acquisition of Unocal, the company assumed certain indemnities relating to contingentenvironmental liabilities associated with assets that were sold in 1997. The acquirer of those assets shared in certainenvironmental remediation costs up to a maximum obligation of $200, which had been reached at December 31, 2009. Underthe indemnification agreement, after reaching the $200 obligation, Chevron is solely responsible until April 2022, when theindemnification expires. The environmental conditions or events that are subject to these indemnities must have arisen priorto the sale of the assets in 1997.
Although the company has provided for known obligations under this indemnity that are probable and reasonably estimable,the amount of additional future costs may be material to results of operations in the period in which they are recognized. Thecompany does not expect these costs will have a material effect on its consolidated financial position or liquidity.
Long-Term Unconditional Purchase Obligations and Commitments, Including Throughput and Take-or-PayAgreements The company and its subsidiaries have certain contingent liabilities with respect to long-term unconditionalpurchase obligations and commitments, including throughput and take-or-pay agreements, some of which may relate tosuppliers’ financing arrangements. The agreements typically provide goods and services, such as pipeline and storagecapacity, utilities, and petroleum products, to be used or sold in the ordinary course of the company’s business. Theaggregate approximate amounts of required payments under these various commitments are: 2021 – $1,000; 2022 – $1,200;2023 – $1,300; 2024 – $1,300; 2025 – $1,400; 2026 and after – $8,400. A portion of these commitments may
92 93
173155_Annual_Report_10-K.indd 93173155_Annual_Report_10-K.indd 93 3/5/21 6:04 PM3/5/21 6:04 PM
Notes to the Consolidated Financial Statements Millions of dollars, except per-share amounts
ultimately be shared with project partners. Total payments under the agreements were approximately $500 in 2020, $800 in 2019 and $1,400 in 2018.
Environmental The company is subject to loss contingencies pursuant to laws, regulations, private claims and legal proceedings related to environmental matters that are subject to legal settlements or that in the future may require the company to take action to correct or ameliorate the effects on the environment of prior release of chemicals or petroleum substances, including MTBE, by the company or other parties. Such contingencies may exist for various operating, closed and divested sites, including, but not limited to, federal Superfund sites and analogous sites under state laws, refineries, chemical plants, marketing facilities, crude oil fields, and mining sites.
Although the company has provided for known environmental obligations that are probable and reasonably estimable, it is likely that the company will continue to incur additional liabilities. The amount of additional future costs are not fully determinable due to such factors as the unknown magnitude of possible contamination, the unknown timing and extent of the corrective actions that may be required, the determination of the company’s liability in proportion to other responsible parties, and the extent to which such costs are recoverable from third parties. These future costs may be material to results of operations in the period in which they are recognized, but the company does not expect these costs will have a material effect on its consolidated financial position or liquidity.
Chevron’s environmental reserve as of December 31, 2020, was $1,139. Included in this balance was $247 related to remediation activities at approximately 145 sites for which the company had been identified as a potentially responsible party under the provisions of the federal Superfund law or analogous state laws which provide for joint and several liability for all responsible parties. Any future actions by regulatory agencies to require Chevron to assume other potentially responsible parties’ costs at designated hazardous waste sites are not expected to have a material effect on the company’s results of operations, consolidated financial position or liquidity.
Of the remaining year-end 2020 environmental reserves balance of $892, $611 is related to the company’s U.S. downstream operations, $47 to its international downstream operations, $233 to upstream operations and $1 to other businesses. Liabilities at all sites were primarily associated with the company’s plans and activities to remediate soil or groundwater contamination or both.
The company manages environmental liabilities under specific sets of regulatory requirements, which in the United States include the Resource Conservation and Recovery Act and various state and local regulations. No single remediation site at year-end 2020 had a recorded liability that was material to the company’s results of operations, consolidated financial position or liquidity.
Refer to Note 23 on page 94 for a discussion of the company’s asset retirement obligations.
Other Contingencies Governmental and other entities in California and other jurisdictions have filed legal proceedings against fossil fuel producing companies, including Chevron, purporting to seek legal and equitable relief to address alleged impacts of climate change. Further such proceedings are likely to be filed by other parties. The unprecedented legal theories set forth in these proceedings entail the possibility of damages liability and injunctions against the production of all fossil fuels that, while we believe remote, could have a material adverse effect on the company’s results of operations and financial condition. Management believes that these proceedings are legally and factually meritless and detract from constructive efforts to address the important policy issues presented by climate change, and will vigorously defend against such proceedings.
Seven coastal parishes and the State of Louisiana have filed 43 separate lawsuits in Louisiana against numerous oil and gas companies seeking damages for coastal erosion in or near oil fields located within Louisiana’s coastal zone under Louisiana’s State and Local Coastal Resources Management Act (SLCRMA). Chevron entities are defendants in 39 of these cases. The lawsuits allege that the defendants’ historical operations were conducted without necessary permits or failed to comply with permits obtained and seek damages and other relief, including the costs of restoring coastal wetlands allegedly impacted by oil field operations. Plaintiffs’ SLCRMA theories are unprecedented; thus, there remains significant uncertainty about the scope of the claims and alleged damages and any potential effects on the company’s results of operations and financial condition. Management believes that the claims lack legal and factual merit and will continue to vigorously defend against such proceedings.
Chevron receives claims from and submits claims to customers; trading partners; joint venture partners; U.S. federal, state and local regulatory bodies; governments; contractors; insurers; suppliers; and individuals. The amounts of these claims,
Chevron Corporation 2020 Annual Report 93

94
Notes to the Consolidated Financial StatementsMillions of dollars, except per-share amounts
Note 25Other Financial InformationEarnings in 2020 included after-tax gains of approximately $765 relating to the sale of certain properties. Of this amount,approximately $30 and $735 related to downstream and upstream, respectively. Earnings in 2019 included after-tax gains ofapproximately $1,500 relating to the sale of certain properties, of which approximately $50 and $1,450 related todownstream and upstream assets, respectively. Earnings in 2018 included after-tax gains of approximately $630 relating tothe sale of certain properties, of which approximately $365 and $265 related to downstream and upstream assets,respectively. Earnings in 2020 included after-tax charges of approximately $4,800 for impairments and other asset write-offsrelated to upstream. Earnings in 2019 included after-tax charges of approximately $10,400 for impairments and other assetwrite-offs related to upstream. Earnings in 2018 included after-tax charges of approximately $2,000 for impairments andother asset write-offs related to upstream.
Other financial information is as follows:Year ended December 31
2020 2019 2018
Total financing interest and debt costs $ 735 $ 817 $ 921Less: Capitalized interest 38 19 173
Interest and debt expense $ 697 $ 798 $ 748
Research and development expenses $ 435 $ 500 $ 453
Excess of replacement cost over the carrying value of inventories (LIFO method) $ 2,749 $ 4,513 $ 5,134LIFO profits (losses) on inventory drawdowns included in earnings $ (147) $ (9) $ 26
Foreign currency effects* $ (645) $ (304) $ 611
* Includes $(152), $(28) and $416 in 2020, 2019 and 2018, respectively, for the company’s share of equity affiliates’ foreign currency effects.
The company has $4,402 in goodwill on the Consolidated Balance Sheet, all of which is in the upstream segment andprimarily related to the 2005 acquisition of Unocal. The company tested this goodwill for impairment during 2020, and noimpairment was required.
Note 26Summarized Financial Data – Chevron Phillips Chemical Company LLCChevron has a 50 percent equity ownership interest in Chevron Phillips Chemical Company LLC (CPChem). Refer to Note13, on page 77, for a discussion of CPChem operations. Summarized financial information for 100 percent of CPChem ispresented in the table below:
Year ended December 31
2020 2019 2018
Sales and other operating revenues $ 8,407 $ 9,333 $ 11,310Costs and other deductions 7,221 7,863 9,812Net income attributable to CPChem 1,260 1,760 2,069
At December 31
2020 2019
Current assets $ 2,816 $ 2,554Other assets 14,210 14,314Current liabilities 1,394 1,247Other liabilities 3,380 3,174
Total CPChem net equity $ 12,252 $ 12,447
Note 27Restructuring and Reorganization CostsIn 2020, the company recorded severance accruals and adjustments for employee reduction programs related to enterprise-wide restructuring, which are expected to be substantially completed by the end of 2021.
A before-tax charge of $859 ($670 after-tax) was recorded in 2020, with $690 reported as “Operating expenses” and $169reported as “Selling, general and administrative expenses” on the Consolidated Statement of Income. Approximately $127($97 after-tax) is associated with terminations in U.S. Upstream, $288 ($228 after-tax) in International Upstream, $112 ($85after-tax) in U.S. Downstream, $69 ($54 after-tax) in International Downstream and $263 ($206 after-tax) in All Other.
95
173155_Annual_Report_10-K.indd 94173155_Annual_Report_10-K.indd 94 3/5/21 6:04 PM3/5/21 6:04 PM
Notes to the Consolidated Financial Statements Millions of dollars, except per-share amounts
individually and in the aggregate, may be significant and take lengthy periods to resolve, and may result in gains or losses in future periods.
The company and its affiliates also continue to review and analyze their operations and may close, retire, sell, exchange, acquire or restructure assets to achieve operational or strategic benefits and to improve competitiveness and profitability. These activities, individually or together, may result in significant gains or losses in future periods.
Note 23 Asset Retirement Obligations The company records the fair value of a liability for an asset retirement obligation (ARO) both as an asset and a liability when there is a legal obligation associated with the retirement of a tangible long-lived asset and the liability can be reasonably estimated. The legal obligation to perform the asset retirement activity is unconditional, even though uncertainty may exist about the timing and/or method of settlement that may be beyond the company’s control. This uncertainty about the timing and/or method of settlement is factored into the measurement of the liability when sufficient information exists to reasonably estimate fair value. Recognition of the ARO includes: (1) the present value of a liability and offsetting asset, (2) the subsequent accretion of that liability and depreciation of the asset, and (3) the periodic review of the ARO liability estimates and discount rates.
AROs are primarily recorded for the company’s crude oil and natural gas producing assets. No significant AROs associated with any legal obligations to retire downstream long-lived assets have been recognized, as indeterminate settlement dates for the asset retirements prevent estimation of the fair value of the associated ARO. The company performs periodic reviews of its downstream long-lived assets for any changes in facts and circumstances that might require recognition of a retirement obligation.
The following table indicates the changes to the company’s before-tax asset retirement obligations in 2020, 2019 and 2018:
2020 2019 2018
Balance at January 1 $ 12,832 $ 14,050 $ 14,214 Liabilities assumed in the Noble acquisition 630 — — Liabilities incurred 10 32 96 Liabilities settled (1,661) (1,694) (830) Accretion expense 560 628 654 Revisions in estimated cash flows 1,245 (184) (84)
Balance at December 31 $ 13,616 $ 12,832 $ 14,050
In the table above, the amount associated with “Revisions in estimated cash flows” in 2020 reflects increased cost estimates to decommission wells, equipment and facilities. The long-term portion of the $13,616 balance at the end of 2020 was $11,877.
Note 24 Revenue Revenue from contracts with customers is presented in “Sales and other operating revenue” along with some activity that is accounted for outside the scope of Accounting Standard Codification (ASC) 606, which is not material to this line, on the Consolidated Statement of Income. Purchases and sales of inventory with the same counterparty that are entered into in contemplation of one another (including buy/sell arrangements) are combined and recorded on a net basis and reported in “Purchased crude oil and products” on the Consolidated Statement of Income. Refer to Note 12 beginning on page 74 for additional information on the company’s segmentation of revenue.
Receivables related to revenue from contracts with customers are included in “Accounts and notes receivable, net” on the Consolidated Balance Sheet, net of the allowance for doubtful accounts. The net balance of these receivables was $7,631 and $9,247 at December 31, 2020 and December 31, 2019, respectively. Other items included in “Accounts and notes receivable, net” represent amounts due from partners for their share of joint venture operating and project costs and amounts due from others, primarily related to derivatives, leases, buy/sell arrangements and product exchanges, which are accounted for outside the scope of ASC 606.
Contract assets and related costs are reflected in “Prepaid expenses and other current assets” and contract liabilities are reflected in “Accrued liabilities” and “Deferred credits and other noncurrent obligations” on the Consolidated Balance Sheet. Amounts for these items are not material to the company’s financial position.
Chevron Corporation 2020 Annual Report 94

Notes to the Consolidated Financial StatementsMillions of dollars, except per-share amounts
individually and in the aggregate, may be significant and take lengthy periods to resolve, and may result in gains or losses infuture periods.
The company and its affiliates also continue to review and analyze their operations and may close, retire, sell, exchange,acquire or restructure assets to achieve operational or strategic benefits and to improve competitiveness and profitability.These activities, individually or together, may result in significant gains or losses in future periods.
Note 23Asset Retirement ObligationsThe company records the fair value of a liability for an asset retirement obligation (ARO) both as an asset and a liabilitywhen there is a legal obligation associated with the retirement of a tangible long-lived asset and the liability can bereasonably estimated. The legal obligation to perform the asset retirement activity is unconditional, even though uncertaintymay exist about the timing and/or method of settlement that may be beyond the company’s control. This uncertainty aboutthe timing and/or method of settlement is factored into the measurement of the liability when sufficient information exists toreasonably estimate fair value. Recognition of the ARO includes: (1) the present value of a liability and offsetting asset,(2) the subsequent accretion of that liability and depreciation of the asset, and (3) the periodic review of the ARO liabilityestimates and discount rates.
AROs are primarily recorded for the company’s crude oil and natural gas producing assets. No significant AROs associatedwith any legal obligations to retire downstream long-lived assets have been recognized, as indeterminate settlement dates forthe asset retirements prevent estimation of the fair value of the associated ARO. The company performs periodic reviews ofits downstream long-lived assets for any changes in facts and circumstances that might require recognition of a retirementobligation.
The following table indicates the changes to the company’s before-tax asset retirement obligations in 2020, 2019 and 2018:
2020 2019 2018
Balance at January 1 $ 12,832 $ 14,050 $ 14,214Liabilities assumed in the Noble acquisition 630 — —Liabilities incurred 10 32 96Liabilities settled (1,661) (1,694) (830)Accretion expense 560 628 654Revisions in estimated cash flows 1,245 (184) (84)
Balance at December 31 $ 13,616 $ 12,832 $ 14,050
In the table above, the amount associated with “Revisions in estimated cash flows” in 2020 reflects increased cost estimatesto decommission wells, equipment and facilities. The long-term portion of the $13,616 balance at the end of 2020 was$11,877.
Note 24RevenueRevenue from contracts with customers is presented in “Sales and other operating revenue” along with some activity that isaccounted for outside the scope of Accounting Standard Codification (ASC) 606, which is not material to this line, on theConsolidated Statement of Income. Purchases and sales of inventory with the same counterparty that are entered into incontemplation of one another (including buy/sell arrangements) are combined and recorded on a net basis and reported in“Purchased crude oil and products” on the Consolidated Statement of Income. Refer to Note 12 beginning on page 74 foradditional information on the company’s segmentation of revenue.
Receivables related to revenue from contracts with customers are included in “Accounts and notes receivable, net” on theConsolidated Balance Sheet, net of the allowance for doubtful accounts. The net balance of these receivables was $7,631 and$9,247 at December 31, 2020 and December 31, 2019, respectively. Other items included in “Accounts and notes receivable,net” represent amounts due from partners for their share of joint venture operating and project costs and amounts due fromothers, primarily related to derivatives, leases, buy/sell arrangements and product exchanges, which are accounted for outsidethe scope of ASC 606.
Contract assets and related costs are reflected in “Prepaid expenses and other current assets” and contract liabilities arereflected in “Accrued liabilities” and “Deferred credits and other noncurrent obligations” on the Consolidated Balance Sheet.Amounts for these items are not material to the company’s financial position.
94 95
173155_Annual_Report_10-K.indd 95173155_Annual_Report_10-K.indd 95 3/5/21 6:04 PM3/5/21 6:04 PM
Notes to the Consolidated Financial Statements Millions of dollars, except per-share amounts
Note 25 Other Financial Information Earnings in 2020 included after-tax gains of approximately $765 relating to the sale of certain properties. Of this amount, approximately $30 and $735 related to downstream and upstream, respectively. Earnings in 2019 included after-tax gains of approximately $1,500 relating to the sale of certain properties, of which approximately $50 and $1,450 related to downstream and upstream assets, respectively. Earnings in 2018 included after-tax gains of approximately $630 relating to the sale of certain properties, of which approximately $365 and $265 related to downstream and upstream assets, respectively. Earnings in 2020 included after-tax charges of approximately $4,800 for impairments and other asset write-offs related to upstream. Earnings in 2019 included after-tax charges of approximately $10,400 for impairments and other asset write-offs related to upstream. Earnings in 2018 included after-tax charges of approximately $2,000 for impairments and other asset write-offs related to upstream.
Other financial information is as follows: Year ended December 31
2020 2019 2018
Total financing interest and debt costs $ 735 $ 817 $ 921 Less: Capitalized interest 38 19 173
Interest and debt expense $ 697 $ 798 $ 748
Research and development expenses $ 435 $ 500 $ 453
Excess of replacement cost over the carrying value of inventories (LIFO method) $ 2,749 $ 4,513 $ 5,134 LIFO profits (losses) on inventory drawdowns included in earnings $ (147) $ (9) $ 26
Foreign currency effects* $ (645) $ (304) $ 611
* Includes $(152), $(28) and $416 in 2020, 2019 and 2018, respectively, for the company’s share of equity affiliates’ foreign currency effects.
The company has $4,402 in goodwill on the Consolidated Balance Sheet, all of which is in the upstream segment and primarily related to the 2005 acquisition of Unocal. The company tested this goodwill for impairment during 2020, and no impairment was required.
Note 26 Summarized Financial Data – Chevron Phillips Chemical Company LLC Chevron has a 50 percent equity ownership interest in Chevron Phillips Chemical Company LLC (CPChem). Refer to Note 13, on page 77, for a discussion of CPChem operations. Summarized financial information for 100 percent of CPChem is presented in the table below:
Year ended December 31
2020 2019 2018
Sales and other operating revenues $ 8,407 $ 9,333 $ 11,310 Costs and other deductions 7,221 7,863 9,812 Net income attributable to CPChem 1,260 1,760 2,069
At December 31
2020 2019
Current assets $ 2,816 $ 2,554 Other assets 14,210 14,314 Current liabilities 1,394 1,247 Other liabilities 3,380 3,174
Total CPChem net equity $ 12,252 $ 12,447
Note 27 Restructuring and Reorganization Costs In 2020, the company recorded severance accruals and adjustments for employee reduction programs related to enterprise-wide restructuring, which are expected to be substantially completed by the end of 2021.
A before-tax charge of $859 ($670 after-tax) was recorded in 2020, with $690 reported as “Operating expenses” and $169 reported as “Selling, general and administrative expenses” on the Consolidated Statement of Income. Approximately $127 ($97 after-tax) is associated with terminations in U.S. Upstream, $288 ($228 after-tax) in International Upstream, $112 ($85 after-tax) in U.S. Downstream, $69 ($54 after-tax) in International Downstream and $263 ($206 after-tax) in All Other.
Chevron Corporation 2020 Annual Report 95

96
Notes to the Consolidated Financial StatementsMillions of dollars, except per-share amounts
immediately after the acquisition. As part of the transaction, the company recognized long-term debt and finance leases witha fair value of $9,231.
The acquisition was accounted for as a business combination under ASC 805, which requires assets acquired and liabilitiesassumed to be measured at their acquisition date fair values. Provisional fair value measurements were made for acquiredassets and liabilities, and adjustments to those measurements may be made in subsequent periods, up to one year from theacquisition date, as information necessary to complete the analysis is obtained. Oil and gas properties were valued using adiscounted cash flow approach that incorporated internally generated price assumptions and production profiles together withappropriate operating cost and development cost assumptions. Debt assumed in the acquisition was valued based onobservable market prices for Noble’s debt. As a result of measuring the assets acquired and the liabilities assumed at fairvalue, there was no goodwill or bargain purchase recognized.
The following table summarizes the values assigned to assets acquired and liabilities assumed:
At October 5, 2020
Current assets $ 1,105Investments and long-term receivables 1,282Properties (includes $14,935 for oil and gas properties) 16,703Other assets 607
Total assets acquired 19,697
Current liabilities 1,829Long-term debt and finance leases 9,231Deferred income taxes 2,355Other liabilities 1,394
Total liabilities assumed 14,809Noncontrolling interest and redeemable noncontrolling interest 779
Net assets acquired $ 4,109
The following unaudited pro forma summary presents the results of operations as if the acquisition of Noble had occurredJanuary 1, 2019:
Year ended December 31
2020 2019
Sales and other operating revenues $ 96,980 $ 144,303Net income $ (9,890) $ 1,412
The pro forma summary uses estimates and assumptions based on information available at the time. Management believesthe estimates and assumptions to be reasonable; however, actual results may differ significantly from this pro forma financialinformation. The pro forma information does not reflect any synergistic savings that might be achieved from combining theoperations and is not intended to reflect the actual results that would have occurred had the companies actually beencombined during the periods presented.
97
173155_Annual_Report_10-K.indd 96173155_Annual_Report_10-K.indd 96 3/5/21 6:04 PM3/5/21 6:04 PM
Notes to the Consolidated Financial Statements Millions of dollars, except per-share amounts
During 2020, the company made payments of $396 associated with these liabilities. The following table summarizes the accrued severance liability, which is classified as current on the Consolidated Balance Sheet.
Amounts Before Tax
Balance at January 1, 2020 $ 7 Accruals/Adjustments 859 Payments (396)
Balance at December 31, 2020 $ 470
Note 28 Financial Instruments—Credit Losses Chevron adopted Accounting Standards Update (ASU) 2016-13, Financial Instruments—Credit Losses, and its related amendments at the effective date of January 1, 2020. The standard replaces the “incurred loss model” and requires an estimate of expected credit losses, measured over the contractual life of a financial instrument, that considers forecast of future economic conditions in addition to information about past events and current conditions. The cumulative-effect adjustment to the opening retained earnings at January 1, 2020 was a reduction of $25, representing a decrease to the net accounts and notes receivable balances shown on the company’s consolidated balance sheet on page 61. Chevron’s expected credit loss allowance balance was $671 as of December 31, 2020 and $849 as of December 31, 2019, with a majority of the allowance relating to non-trade receivable balances. A reduction in the allowance for non-trade receivables of $550 was recorded in the second quarter as an agreement was reached with a government joint venture partner that resulted in the write-off of the associated receivable balances. Additionally, new allowances of $265 were recorded in the second and third quarters associated with other than trade receivables.
The majority of the company’s receivable balance is concentrated in trade receivables, with a balance of $9.5 billion as of December 31, 2020, which reflects the company’s diversified sources of revenues and is dispersed across the company’s broad worldwide customer base. As a result, the company believes the concentration of credit risk is limited. The company routinely assesses the financial strength of its customers. When the financial strength of a customer is not considered sufficient, alternative risk mitigation measures may be deployed, including requiring pre-payments, letters of credit or other acceptable forms of collateral. Once credit is extended and a receivable balance exists, the company applies a quantitative calculation to current trade receivable balances that reflects credit risk predictive analysis, including probability of default and loss given default, which takes into consideration current and forward-looking market data as well as the company’s historical loss data. This statistical approach becomes the basis of the company’s expected credit loss allowance for current trade receivables with payment terms that are typically short-term in nature, with most due in less than 90 days. The company continues to monitor credit risk in response to the COVID-19 pandemic and the significant reduction in crude prices resulting from decreased demand associated with government-mandated travel restrictions.
Chevron’s non-trade receivable balance was $3.3 billion as of December 31, 2020, which includes receivables from certain governments in their capacity as joint venture partners. Joint venture partner balances that are paid as per contract terms or not yet due are subject to the statistical analysis described above while past due balances are subject to additional qualitative management quarterly review. This management review includes review of reasonable and supportable repayment forecasts. Non-trade receivables also include employee and tax receivables that are deemed immaterial and low risk.
Equity affiliate loans are also considered non-trade and during the second quarter 2020 review, a $560 allowance was recognized within “Investments and advances” on the Consolidated Balance Sheet.
Note 29 Acquisition of Noble Energy, Inc. On October 5, 2020, the company acquired Noble Energy, Inc., an independent oil and gas exploration and production company. Noble’s principal upstream operations are in the United States, the Eastern Mediterranean and West Africa. Noble’s operations also include an integrated midstream business in the United States. The acquisition of Noble provides the company with low-cost proved reserves, attractive undeveloped resources and cash-generating assets.
The aggregate purchase price of Noble was $4,109, with approximately 58 million shares of Chevron common stock issued as consideration in the transaction, representing approximately 3 percent of shares of Chevron common stock outstanding
Chevron Corporation 2020 Annual Report 96
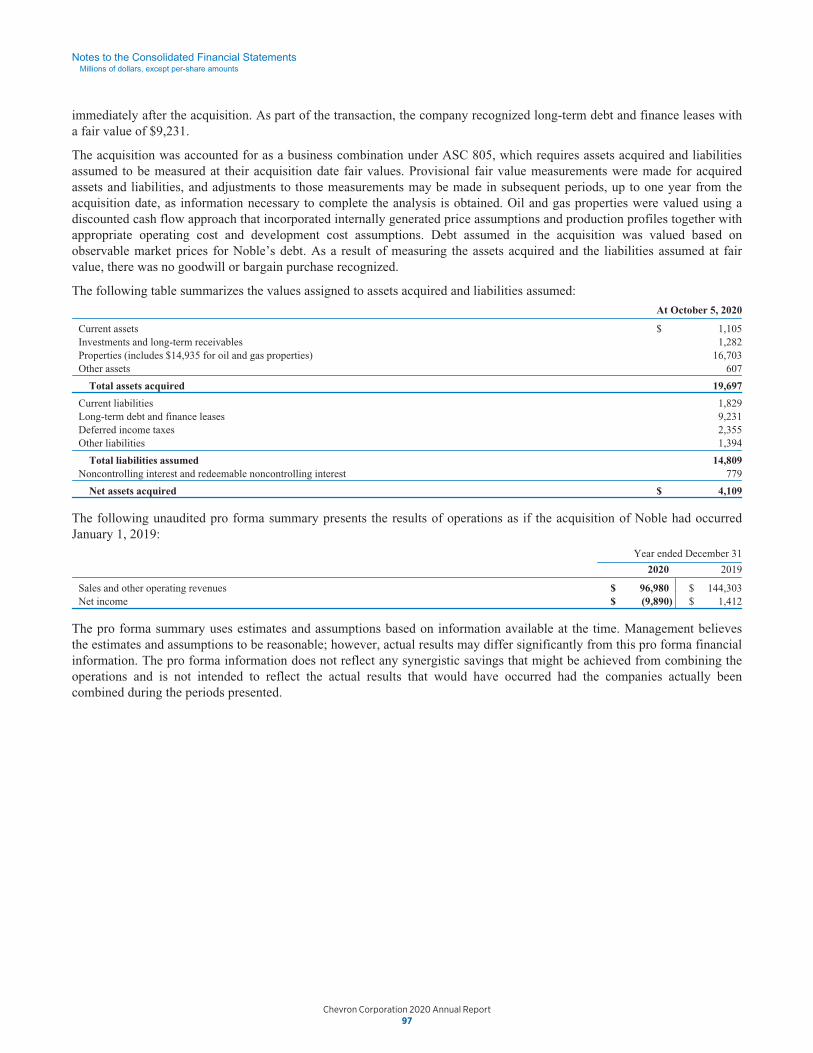
Notes to the Consolidated Financial StatementsMillions of dollars, except per-share amounts
During 2020, the company made payments of $396 associated with these liabilities. The following table summarizes theaccrued severance liability, which is classified as current on the Consolidated Balance Sheet.
Amounts Before Tax
Balance at January 1, 2020 $ 7Accruals/Adjustments 859Payments (396)
Balance at December 31, 2020 $ 470
Note 28Financial Instruments—Credit LossesChevron adopted Accounting Standards Update (ASU) 2016-13, Financial Instruments—Credit Losses, and its relatedamendments at the effective date of January 1, 2020. The standard replaces the “incurred loss model” and requires anestimate of expected credit losses, measured over the contractual life of a financial instrument, that considers forecast offuture economic conditions in addition to information about past events and current conditions. The cumulative-effectadjustment to the opening retained earnings at January 1, 2020 was a reduction of $25, representing a decrease to the netaccounts and notes receivable balances shown on the company’s consolidated balance sheet on page 61. Chevron’s expectedcredit loss allowance balance was $671 as of December 31, 2020 and $849 as of December 31, 2019, with a majority of theallowance relating to non-trade receivable balances. A reduction in the allowance for non-trade receivables of $550 wasrecorded in the second quarter as an agreement was reached with a government joint venture partner that resulted in thewrite-off of the associated receivable balances. Additionally, new allowances of $265 were recorded in the second and thirdquarters associated with other than trade receivables.
The majority of the company’s receivable balance is concentrated in trade receivables, with a balance of $9.5 billion as ofDecember 31, 2020, which reflects the company’s diversified sources of revenues and is dispersed across the company’sbroad worldwide customer base. As a result, the company believes the concentration of credit risk is limited. The companyroutinely assesses the financial strength of its customers. When the financial strength of a customer is not consideredsufficient, alternative risk mitigation measures may be deployed, including requiring pre-payments, letters of credit or otheracceptable forms of collateral. Once credit is extended and a receivable balance exists, the company applies a quantitativecalculation to current trade receivable balances that reflects credit risk predictive analysis, including probability of defaultand loss given default, which takes into consideration current and forward-looking market data as well as the company’shistorical loss data. This statistical approach becomes the basis of the company’s expected credit loss allowance for currenttrade receivables with payment terms that are typically short-term in nature, with most due in less than 90 days. Thecompany continues to monitor credit risk in response to the COVID-19 pandemic and the significant reduction in crudeprices resulting from decreased demand associated with government-mandated travel restrictions.
Chevron’s non-trade receivable balance was $3.3 billion as of December 31, 2020, which includes receivables from certaingovernments in their capacity as joint venture partners. Joint venture partner balances that are paid as per contract terms ornot yet due are subject to the statistical analysis described above while past due balances are subject to additional qualitativemanagement quarterly review. This management review includes review of reasonable and supportable repayment forecasts.Non-trade receivables also include employee and tax receivables that are deemed immaterial and low risk.
Equity affiliate loans are also considered non-trade and during the second quarter 2020 review, a $560 allowance wasrecognized within “Investments and advances” on the Consolidated Balance Sheet.
Note 29Acquisition of Noble Energy, Inc.On October 5, 2020, the company acquired Noble Energy, Inc., an independent oil and gas exploration and productioncompany. Noble’s principal upstream operations are in the United States, the Eastern Mediterranean and West Africa.Noble’s operations also include an integrated midstream business in the United States. The acquisition of Noble provides thecompany with low-cost proved reserves, attractive undeveloped resources and cash-generating assets.
The aggregate purchase price of Noble was $4,109, with approximately 58 million shares of Chevron common stock issuedas consideration in the transaction, representing approximately 3 percent of shares of Chevron common stock outstanding
96 97
173155_Annual_Report_10-K.indd 97173155_Annual_Report_10-K.indd 97 3/5/21 6:04 PM3/5/21 6:04 PM
Notes to the Consolidated Financial Statements Millions of dollars, except per-share amounts
immediately after the acquisition. As part of the transaction, the company recognized long-term debt and finance leases with a fair value of $9,231.
The acquisition was accounted for as a business combination under ASC 805, which requires assets acquired and liabilities assumed to be measured at their acquisition date fair values. Provisional fair value measurements were made for acquired assets and liabilities, and adjustments to those measurements may be made in subsequent periods, up to one year from the acquisition date, as information necessary to complete the analysis is obtained. Oil and gas properties were valued using a discounted cash flow approach that incorporated internally generated price assumptions and production profiles together with appropriate operating cost and development cost assumptions. Debt assumed in the acquisition was valued based on observable market prices for Noble’s debt. As a result of measuring the assets acquired and the liabilities assumed at fair value, there was no goodwill or bargain purchase recognized.
The following table summarizes the values assigned to assets acquired and liabilities assumed:
At October 5, 2020
Current assets $ 1,105 Investments and long-term receivables 1,282 Properties (includes $14,935 for oil and gas properties) 16,703 Other assets 607
Total assets acquired 19,697
Current liabilities 1,829 Long-term debt and finance leases 9,231 Deferred income taxes 2,355 Other liabilities 1,394
Total liabilities assumed 14,809 Noncontrolling interest and redeemable noncontrolling interest 779
Net assets acquired $ 4,109
The following unaudited pro forma summary presents the results of operations as if the acquisition of Noble had occurred January 1, 2019:
Year ended December 31
2020 2019
Sales and other operating revenues $ 96,980 $ 144,303 Net income $ (9,890) $ 1,412
The pro forma summary uses estimates and assumptions based on information available at the time. Management believes the estimates and assumptions to be reasonable; however, actual results may differ significantly from this pro forma financial information. The pro forma information does not reflect any synergistic savings that might be achieved from combining the operations and is not intended to reflect the actual results that would have occurred had the companies actually been combined during the periods presented.
Chevron Corporation 2020 Annual Report 97

98
Supplemental Information on Oil and Gas Producing Activities - Unaudited
In accordance with FASB and SEC disclosure requirements for oil and gas producing activities, this section providessupplemental information on oil and gas exploration and producing activities of the company in seven separate tables. TablesI through IV provide historical cost information pertaining to costs incurred in exploration, property acquisitions anddevelopment; capitalized costs; and results of operations. Tables V through VII present information on the company’s
Table I - Costs Incurred in Exploration, Property Acquisitions and Development1
Consolidated Companies Affiliated Companies
Millions of dollars U.S.Other
Americas Africa AsiaAustralia/
Oceania Europe Total TCO Other
Year Ended December 31, 2020Exploration
Wells $ 190 $ 181 $ 1 $ 8 $ 1 $ — $ 381 $ — $ —Geological and geophysical 83 29 58 3 12 — 185 — —Other 125 77 42 22 39 2 307 — —
Total exploration 398 287 101 33 52 2 873 — —
Property acquisitions2
Proved - Noble 3,463 — 438 7,945 — — 11,846 — —Proved - Other 23 — 2 56 — — 81 — —Unproved - Noble 2,845 2 113 129 — — 3,089 — —Unproved - Other 35 — 10 — — — 45 — —
Total property acquisitions 6,366 2 563 8,130 — — 15,061 — —
Development3 4,622 740 386 1,034 753 37 7,572 2,998 81
Total Costs Incurred4 $ 11,386 $ 1,029 $ 1,050 $ 9,197 $ 805 $ 39 $ 23,506 $ 2,998 $ 81
Year Ended December 31, 2019Exploration
Wells $ 571 $ 44 $ 9 $ 2 $ 4 $ 4 $ 634 $ — $ —Geological and geophysical 82 118 21 5 11 1 238 — —Other 140 52 35 29 44 6 306 — 8
Total exploration 793 214 65 36 59 11 1,178 — 8
Property acquisitions2
Proved 81 34 — 93 — — 208 — —Unproved 68 150 — 17 1 — 236 — —
Total property acquisitions 149 184 — 110 1 — 444 — —
Development3 7,072 1,216 279 1,020 518 199 10,304 5,112 158
Total Costs Incurred4 $ 8,014 $ 1,614 $ 344 $ 1,166 $ 578 $ 210 $ 11,926 $ 5,112 $ 166
Year Ended December 31, 2018Exploration
Wells $ 508 $ 74 $ 25 $ 55 $ — $ 14 $ 676 $ — $ —Geological and geophysical 84 41 4 5 7 1 142 — —Other 190 46 35 33 49 23 376 — —
Total exploration 782 161 64 93 56 38 1,194 — —
Property acquisitions2
Proved 160 — 7 117 — — 284 — —Unproved 52 494 2 27 — — 575 — —
Total property acquisitions 212 494 9 144 — — 859 — —
Development3 6,245 856 711 1,095 845 278 10,030 4,963 200
Total Costs Incurred4 $ 7,239 $ 1,511 $ 784 $ 1,332 $ 901 $ 316 $ 12,083 $ 4,963 $ 200
1 Includes costs incurred whether capitalized or expensed. Excludes general support equipment expenditures. Includes capitalized amounts related to asset retirement obligations.See Note 23, “Asset Retirement Obligations,” on page 94.
2 Includes wells, equipment and facilities associated with proved reserves. Does not include properties acquired in nonmonetary transactions.3 Includes $897, $246 and $114 of costs incurred on major capital projects prior to assignment of proved reserves for consolidated companies in 2020, 2019, and 2018,
respectively.4 Reconciliation of consolidated and affiliated companies total cost incurred to Upstream capital and exploratory (C&E) expenditures - $ billions:
2020 2019 2018
Total cost incurred $ 26.6 $ 17.2 $ 17.2Noble acquisition (14.9) — — See Note 29 for additional informationNon-oil and gas activities — 0.3 0.6 (Primarily; LNG and transportation activities.)ARO reduction/(build) (0.8) 0.3 (0.1)
Upstream C&E $ 10.9 $ 17.8 $ 17.7 Reference page 44 Upstream total
99
173155_Annual_Report_10-K.indd 98173155_Annual_Report_10-K.indd 98 3/5/21 6:04 PM3/5/21 6:04 PM
Five-Year Financial Summary Unaudited
Millions of dollars, except per-share amounts 2020 2019 2018 2017 2016
Statement of Income Data Revenues and Other Income
Total sales and other operating revenues* $ 94,471 $ 139,865 $ 158,902 $ 134,674 $ 110,215 Income from equity affiliates and other income 221 6,651 7,437 7,048 4,257
Total Revenues and Other Income 94,692 146,516 166,339 141,722 114,472 Total Costs and Other Deductions 102,145 140,980 145,764 132,501 116,632
Income (Loss) Before Income Tax Expense (7,453) 5,536 20,575 9,221 (2,160) Income Tax Expense (Benefit) (1,892) 2,691 5,715 (48) (1,729)
Net Income (Loss) (5,561) 2,845 14,860 9,269 (431) Less: Net income (loss) attributable to noncontrolling
interests (18) (79) 36 74 66
Net Income (Loss) Attributable to Chevron Corporation $ (5,543) $ 2,924 $ 14,824 $ 9,195 $ (497)
Per Share of Common Stock Net Income (Loss) Attributable to Chevron
– Basic $ (2.96) $ 1.55 $ 7.81 $ 4.88 $ (0.27) – Diluted $ (2.96) $ 1.54 $ 7.74 $ 4.85 $ (0.27)
Cash Dividends Per Share $ 5.16 $ 4.76 $ 4.48 $ 4.32 $ 4.29
Balance Sheet Data (at December 31) Current assets $ 26,078 $ 28,329 $ 34,021 $ 28,560 $ 29,619 Noncurrent assets 213,712 209,099 219,842 225,246 230,459
Total Assets 239,790 237,428 253,863 253,806 260,078
Short-term debt 1,548 3,282 5,726 5,192 10,840 Other current liabilities 20,635 23,248 21,445 22,545 20,945 Long-term debt 42,767 23,691 28,733 33,571 35,286 Other noncurrent liabilities 42,114 41,999 42,317 43,179 46,285
Total Liabilities 107,064 92,220 98,221 104,487 113,356
Total Chevron Corporation Stockholders’ Equity $ 131,688 $ 144,213 $ 154,554 $ 148,124 $ 145,556 Noncontrolling interests 1,038 995 1,088 1,195 1,166
Total Equity $ 132,726 $ 145,208 $ 155,642 $ 149,319 $ 146,722
* Includes excise, value-added and similar taxes: $ — $ — $ — $ 7,189 $ 6,905
Chevron Corporation 2020 Annual Report 98

Five-Year Financial SummaryUnaudited
Millions of dollars, except per-share amounts 2020 2019 2018 2017 2016
Statement of Income DataRevenues and Other Income
Total sales and other operating revenues* $ 94,471 $ 139,865 $ 158,902 $ 134,674 $ 110,215Income from equity affiliates and other income 221 6,651 7,437 7,048 4,257
Total Revenues and Other Income 94,692 146,516 166,339 141,722 114,472Total Costs and Other Deductions 102,145 140,980 145,764 132,501 116,632
Income (Loss) Before Income Tax Expense (7,453) 5,536 20,575 9,221 (2,160)Income Tax Expense (Benefit) (1,892) 2,691 5,715 (48) (1,729)
Net Income (Loss) (5,561) 2,845 14,860 9,269 (431)Less: Net income (loss) attributable to noncontrolling
interests (18) (79) 36 74 66
Net Income (Loss) Attributable to Chevron Corporation $ (5,543) $ 2,924 $ 14,824 $ 9,195 $ (497)
Per Share of Common StockNet Income (Loss) Attributable to Chevron
– Basic $ (2.96) $ 1.55 $ 7.81 $ 4.88 $ (0.27)– Diluted $ (2.96) $ 1.54 $ 7.74 $ 4.85 $ (0.27)
Cash Dividends Per Share $ 5.16 $ 4.76 $ 4.48 $ 4.32 $ 4.29
Balance Sheet Data (at December 31)Current assets $ 26,078 $ 28,329 $ 34,021 $ 28,560 $ 29,619Noncurrent assets 213,712 209,099 219,842 225,246 230,459
Total Assets 239,790 237,428 253,863 253,806 260,078
Short-term debt 1,548 3,282 5,726 5,192 10,840Other current liabilities 20,635 23,248 21,445 22,545 20,945Long-term debt 42,767 23,691 28,733 33,571 35,286Other noncurrent liabilities 42,114 41,999 42,317 43,179 46,285
Total Liabilities 107,064 92,220 98,221 104,487 113,356
Total Chevron Corporation Stockholders’ Equity $ 131,688 $ 144,213 $ 154,554 $ 148,124 $ 145,556Noncontrolling interests 1,038 995 1,088 1,195 1,166
Total Equity $ 132,726 $ 145,208 $ 155,642 $ 149,319 $ 146,722
* Includes excise, value-added and similar taxes: $ — $ — $ — $ 7,189 $ 6,905
98 99
173155_Annual_Report_10-K.indd 99173155_Annual_Report_10-K.indd 99 3/5/21 6:04 PM3/5/21 6:04 PM
Supplemental Information on Oil and Gas Producing Activities - Unaudited
In accordance with FASB and SEC disclosure requirements for oil and gas producing activities, this section provides supplemental information on oil and gas exploration and producing activities of the company in seven separate tables. Tables I through IV provide historical cost information pertaining to costs incurred in exploration, property acquisitions and development; capitalized costs; and results of operations. Tables V through VII present information on the company’s
Table I - Costs Incurred in Exploration, Property Acquisitions and Development1
Consolidated Companies Affiliated Companies
Millions of dollars U.S. Other
Americas Africa Asia Australia/
Oceania Europe Total TCO Other
Year Ended December 31, 2020 Exploration
Wells $ 190 $ 181 $ 1 $ 8 $ 1 $ — $ 381 $ — $ —Geological and geophysical 83 29 58 3 12 — 185 — — Other 125 77 42 22 39 2 307 — —
Total exploration 398 287 101 33 52 2 873 — —
Property acquisitions2
Proved - Noble 3,463 — 438 7,945 — — 11,846 — — Proved - Other 23 — 2 56 — — 81 — — Unproved - Noble 2,845 2 113 129 — — 3,089 — — Unproved - Other 35 — 10 — — — 45 — —
Total property acquisitions 6,366 2 563 8,130 — — 15,061 — —
Development3 4,622 740 386 1,034 753 37 7,572 2,998 81
Total Costs Incurred4 $ 11,386 $ 1,029 $ 1,050 $ 9,197 $ 805 $ 39 $ 23,506 $ 2,998 $ 81
Year Ended December 31, 2019 Exploration
Wells $ 571 $ 44 $ 9 $ 2 $ 4 $ 4 $ 634 $ — $ — Geological and geophysical 82 118 21 5 11 1 238 — — Other 140 52 35 29 44 6 306 — 8
Total exploration 793 214 65 36 59 11 1,178 — 8
Property acquisitions2
Proved 81 34 — 93 — — 208 — — Unproved 68 150 — 17 1 — 236 — —
Total property acquisitions 149 184 — 110 1 — 444 — —
Development3 7,072 1,216 279 1,020 518 199 10,304 5,112 158
Total Costs Incurred4 $ 8,014 $ 1,614 $ 344 $ 1,166 $ 578 $ 210 $ 11,926 $ 5,112 $ 166
Year Ended December 31, 2018 Exploration
Wells $ 508 $ 74 $ 25 $ 55 $ — $ 14 $ 676 $ — $ — Geological and geophysical 84 41 4 5 7 1 142 — — Other 190 46 35 33 49 23 376 — —
Total exploration 782 161 64 93 56 38 1,194 — —
Property acquisitions2
Proved 160 — 7 117 — — 284 — — Unproved 52 494 2 27 — — 575 — —
Total property acquisitions 212 494 9 144 — — 859 — —
Development3 6,245 856 711 1,095 845 278 10,030 4,963 200
Total Costs Incurred4 $ 7,239 $ 1,511 $ 784 $ 1,332 $ 901 $ 316 $ 12,083 $ 4,963 $ 200
1 Includes costs incurred whether capitalized or expensed. Excludes general support equipment expenditures. Includes capitalized amounts related to asset retirement obligations. See Note 23, “Asset Retirement Obligations,” on page 94.
2 Includes wells, equipment and facilities associated with proved reserves. Does not include properties acquired in nonmonetary transactions. 3 Includes $897, $246 and $114 of costs incurred on major capital projects prior to assignment of proved reserves for consolidated companies in 2020, 2019, and 2018,
respectively. 4 Reconciliation of consolidated and affiliated companies total cost incurred to Upstream capital and exploratory (C&E) expenditures - $ billions:
2020 2019 2018
Total cost incurred $ 26.6 $ 17.2 $ 17.2 Noble acquisition (14.9) — — See Note 29 for additional information Non-oil and gas activities — 0.3 0.6 (Primarily; LNG and transportation activities.) ARO reduction/(build) (0.8) 0.3 (0.1)
Upstream C&E $ 10.9 $ 17.8 $ 17.7 Reference page 44 Upstream total
Chevron Corporation 2020 Annual Report 99

100
Supplemental Information on Oil and Gas Producing Activities - Unaudited
Table III - Results of Operations for Oil and Gas Producing Activities1
The company’s results of operations from oil and gas producing activities for the years 2020, 2019 and 2018 are shown in thefollowing table. Net income (loss) from exploration and production activities as reported on page 75 reflects income taxescomputed on an effective rate basis.
Income taxes in Table III are based on statutory tax rates, reflecting allowable deductions and tax credits. Interest income andexpense are excluded from the results reported in Table III and from the net income amounts on page 75.
Consolidated Companies Affiliated Companies
Millions of dollars U.S.Other
Americas Africa AsiaAustralia/
Oceania Europe Total TCO Other
Year Ended December 31, 2020Revenues from net production
Sales $ 1,665 $ 505 $ 473 $ 5,629 $ 3,010 $ 149 $ 11,431 $ 3,088 $ 288Transfers 7,711 1,683 3,378 1,092 1,830 — 15,694 — —
Total 9,376 2,188 3,851 6,721 4,840 149 27,125 3,088 288Production expenses excluding taxes (3,933) (981) (1,485) (2,408) (589) (64) (9,460) (419) (98)Taxes other than on income (597) (62) (77) (11) (121) (2) (870) (190) (30)Proved producing properties:
Depreciation and depletion (6,482) (1,221) (2,323) (3,466) (2,192) (92) (15,776) (879) (146)Accretion expense2 (165) (22) (136) (120) (62) (10) (515) (9) (6)Exploration expenses (457) (314) (431) (67) (231) (15) (1,515) — 1Unproved properties valuation (58) (215) (6) (8) (1) — (288) — —Other income (expense)3 51 (8) (11) 1,053 (2) (9) 1,074 (29) (2,103)
Results before income taxes (2,265) (635) (618) 1,694 1,642 (43) (225) 1,562 (2,094)Income tax (expense) benefit 558 (5) 888 (353) (558) 12 542 (471) 161
Results of Producing Operations $ (1,707) $ (640) $ 270 $ 1,341 $ 1,084 $ (31) $ 317 $ 1,091 $ (1,933)
Year Ended December 31, 2019Revenues from net production
Sales $ 2,259 $ 863 $ 668 $ 7,410 $ 4,332 $ 592 $ 16,124 $ 5,603 $ 780Transfers 11,043 2,160 6,534 1,311 2,596 655 24,299 — —
Total 13,302 3,023 7,202 8,721 6,928 1,247 40,423 5,603 780Production expenses excluding taxes (3,567) (1,020) (1,460) (2,703) (616) (343) (9,709) (475) (247)Taxes other than on income (595) (64) (101) (16) (221) (2) (999) (57) (10)Proved producing properties:
Depreciation and depletion (11,659) (1,380) (2,548) (3,165) (2,192) (85) (21,029) (870) (211)Accretion expense2 (191) (21) (148) (133) (53) (37) (583) (5) (8)Exploration expenses (293) (211) (73) (93) (60) (10) (740) — (8)Unproved properties valuation (3,268) (591) (2) (388) (2) — (4,251) (4) —Other income (expense)3 (51) (44) (121) 413 53 1,373 1,623 1 (157)
Results before income taxes (6,322) (308) 2,749 2,636 3,837 2,143 4,735 4,193 139Income tax (expense) benefit 1,311 (27) (1,731) (1,212) (1,161) (311) (3,131) (1,261) (73)
Results of Producing Operations $ (5,011) $ (335) $ 1,018 $ 1,424 $ 2,676 $ 1,832 $ 1,604 $ 2,932 $ 66
1 The value of owned production consumed in operations as fuel has been eliminated from revenues and production expenses, and the related volumes have been deducted fromnet production in calculating the unit average sales price and production cost. This has no effect on the results of producing operations.
2 Represents accretion of ARO liability. Refer to Note 23, “Asset Retirement Obligations,” on page 94.3 Includes foreign currency gains and losses, gains and losses on property dispositions and other miscellaneous income and expenses.
101
173155_Annual_Report_10-K.indd 100173155_Annual_Report_10-K.indd 100 3/5/21 6:04 PM3/5/21 6:04 PM
Supplemental Information on Oil and Gas Producing Activities - Unaudited
estimated net proved reserve quantities, standardized measure of estimated discounted future net cash flows related to proved reserves, and changes in estimated discounted future net cash flows. The amounts for consolidated companies are organized by geographic areas including the United States, Other Americas, Africa, Asia, Australia/Oceania and Europe. Amounts for affiliated companies include Chevron’s equity interests in Tengizchevroil (TCO) in the Republic of Kazakhstan and in other affiliates, principally in Venezuela and Angola. Refer to Note 13, beginning on page 77, for a discussion of the company’s major equity affiliates.
Table II - Capitalized Costs Related to Oil and Gas Producing Activities
Millions of dollars
Consolidated Companies Affiliated Companies
U.S. Other
Americas Africa Asia Australia/
Oceania Europe Total TCO Other
At December 31, 2020 Unproved properties $ 3,519 $ 2,438 $ 188 $ 984 $ 1,987 $ — $ 9,116 $ 108 $ — Proved properties and related
producing assets 81,573 24,108 46,637 58,086 22,321 2,117 234,842 11,326 1,548 Support equipment 1,882 197 1,087 2,042 18,898 — 24,106 2,023 — Deferred exploratory wells 411 142 202 505 1,144 108 2,512 — — Other uncompleted projects 5,549 582 1,030 803 1,157 20 9,141 18,806 23
Gross Capitalized Costs 92,934 27,467 49,144 62,420 45,507 2,245 279,717 32,263 1,571
Unproved properties valuation 179 1,471 126 856 110 — 2,742 67 — Proved producing properties –
Depreciation and depletion 55,839 13,141 35,899 42,354 7,541 498 155,272 6,746 493 Support equipment depreciation 1,002 159 742 1,644 2,965 — 6,512 1,169 —
Accumulated provisions 57,020 14,771 36,767 44,854 10,616 498 164,526 7,982 493
Net Capitalized Costs $ 35,914 $ 12,696 $ 12,377 $ 17,566 $ 34,891 $ 1,747 $ 115,191 $ 24,281 $ 1,078
At December 31, 2019 Unproved properties $ 4,620 $ 2,492 $ 151 $ 1,081 $ 1,986 $ — $ 10,330 $ 108 $ — Proved properties and
related producing assets 82,199 24,189 45,756 56,648 22,032 2,082 232,906 10,757 4,311 Support equipment 2,287 311 1,098 2,075 18,610 — 24,381 1,981 — Deferred exploratory wells 533 147 405 513 1,322 121 3,041 — — Other uncompleted projects 5,080 505 1,176 926 1,023 15 8,725 16,503 743
Gross Capitalized Costs 94,719 27,644 48,586 61,243 44,973 2,218 279,383 29,349 5,054
Unproved properties valuation 3,964 1,271 120 842 109 — 6,306 65 — Proved producing properties –
Depreciation and depletion 56,911 12,644 33,613 44,871 6,064 404 154,507 6,018 1,912 Support equipment depreciation 1,635 226 772 1,605 2,272 — 6,510 1,053 —
Accumulated provisions 62,510 14,141 34,505 47,318 8,445 404 167,323 7,136 1,912
Net Capitalized Costs $ 32,209 $ 13,503 $ 14,081 $ 13,925 $ 36,528 $ 1,814 $ 112,060 $ 22,213 $ 3,142
At December 31, 2018 Unproved properties $ 4,687 $ 2,463 $ 201 $ 1,299 $ 1,986 $ — $ 10,636 $ 108 $ — Proved properties and related
producing assets 75,013 21,796 44,876 57,168 22,047 12,634 233,534 9,892 4,336 Support equipment 2,216 317 1,096 2,149 17,712 124 23,614 1,858 — Deferred exploratory wells 782 160 405 632 1,323 261 3,563 — — Other uncompleted projects 4,730 3,704 1,744 1,292 1,462 300 13,232 12,311 605
Gross Capitalized Costs 87,428 28,440 48,322 62,540 44,530 13,319 284,579 24,169 4,941
Unproved properties valuation 820 694 164 623 107 — 2,408 61 — Proved producing properties –
Depreciation and depletion 45,712 12,984 31,102 43,735 4,631 10,014 148,178 5,276 1,730 Support equipment depreciation 1,466 220 738 1,674 1,531 119 5,748 947 —
Accumulated provisions 47,998 13,898 32,004 46,032 6,269 10,133 156,334 6,284 1,730
Net Capitalized Costs $ 39,430 $ 14,542 $ 16,318 $ 16,508 $ 38,261 $ 3,186 $ 128,245 $ 17,885 $ 3,211
Chevron Corporation 2020 Annual Report 100

Supplemental Information on Oil and Gas Producing Activities - Unaudited
estimated net proved reserve quantities, standardized measure of estimated discounted future net cash flows related to provedreserves, and changes in estimated discounted future net cash flows. The amounts for consolidated companies are organizedby geographic areas including the United States, Other Americas, Africa, Asia, Australia/Oceania and Europe. Amounts foraffiliated companies include Chevron’s equity interests in Tengizchevroil (TCO) in the Republic of Kazakhstan and in otheraffiliates, principally in Venezuela and Angola. Refer to Note 13, beginning on page 77, for a discussion of the company’smajor equity affiliates.
Table II - Capitalized Costs Related to Oil and Gas Producing Activities
Consolidated Companies Affiliated Companies
Millions of dollars U.S.Other
Americas Africa AsiaAustralia/
Oceania Europe Total TCO Other
At December 31, 2020Unproved properties $ 3,519 $ 2,438 $ 188 $ 984 $ 1,987 $ — $ 9,116 $ 108 $ —Proved properties and related
producing assets 81,573 24,108 46,637 58,086 22,321 2,117 234,842 11,326 1,548Support equipment 1,882 197 1,087 2,042 18,898 — 24,106 2,023 —Deferred exploratory wells 411 142 202 505 1,144 108 2,512 — —Other uncompleted projects 5,549 582 1,030 803 1,157 20 9,141 18,806 23
Gross Capitalized Costs 92,934 27,467 49,144 62,420 45,507 2,245 279,717 32,263 1,571
Unproved properties valuation 179 1,471 126 856 110 — 2,742 67 —Proved producing properties –
Depreciation and depletion 55,839 13,141 35,899 42,354 7,541 498 155,272 6,746 493Support equipment depreciation 1,002 159 742 1,644 2,965 — 6,512 1,169 —
Accumulated provisions 57,020 14,771 36,767 44,854 10,616 498 164,526 7,982 493
Net Capitalized Costs $ 35,914 $ 12,696 $ 12,377 $ 17,566 $ 34,891 $ 1,747 $ 115,191 $ 24,281 $ 1,078
At December 31, 2019Unproved properties $ 4,620 $ 2,492 $ 151 $ 1,081 $ 1,986 $ — $ 10,330 $ 108 $ —Proved properties and
related producing assets 82,199 24,189 45,756 56,648 22,032 2,082 232,906 10,757 4,311Support equipment 2,287 311 1,098 2,075 18,610 — 24,381 1,981 —Deferred exploratory wells 533 147 405 513 1,322 121 3,041 — —Other uncompleted projects 5,080 505 1,176 926 1,023 15 8,725 16,503 743
Gross Capitalized Costs 94,719 27,644 48,586 61,243 44,973 2,218 279,383 29,349 5,054
Unproved properties valuation 3,964 1,271 120 842 109 — 6,306 65 —Proved producing properties –
Depreciation and depletion 56,911 12,644 33,613 44,871 6,064 404 154,507 6,018 1,912Support equipment depreciation 1,635 226 772 1,605 2,272 — 6,510 1,053 —
Accumulated provisions 62,510 14,141 34,505 47,318 8,445 404 167,323 7,136 1,912
Net Capitalized Costs $ 32,209 $ 13,503 $ 14,081 $ 13,925 $ 36,528 $ 1,814 $ 112,060 $ 22,213 $ 3,142
At December 31, 2018Unproved properties $ 4,687 $ 2,463 $ 201 $ 1,299 $ 1,986 $ — $ 10,636 $ 108 $ —Proved properties and related
producing assets 75,013 21,796 44,876 57,168 22,047 12,634 233,534 9,892 4,336Support equipment 2,216 317 1,096 2,149 17,712 124 23,614 1,858 —Deferred exploratory wells 782 160 405 632 1,323 261 3,563 — —Other uncompleted projects 4,730 3,704 1,744 1,292 1,462 300 13,232 12,311 605
Gross Capitalized Costs 87,428 28,440 48,322 62,540 44,530 13,319 284,579 24,169 4,941
Unproved properties valuation 820 694 164 623 107 — 2,408 61 —Proved producing properties –
Depreciation and depletion 45,712 12,984 31,102 43,735 4,631 10,014 148,178 5,276 1,730Support equipment depreciation 1,466 220 738 1,674 1,531 119 5,748 947 —
Accumulated provisions 47,998 13,898 32,004 46,032 6,269 10,133 156,334 6,284 1,730
Net Capitalized Costs $ 39,430 $ 14,542 $ 16,318 $ 16,508 $ 38,261 $ 3,186 $ 128,245 $ 17,885 $ 3,211
100 101
173155_Annual_Report_10-K.indd 101173155_Annual_Report_10-K.indd 101 3/5/21 6:04 PM3/5/21 6:04 PM
Supplemental Information on Oil and Gas Producing Activities - Unaudited
Table III - Results of Operations for Oil and Gas Producing Activities1
The company’s results of operations from oil and gas producing activities for the years 2020, 2019 and 2018 are shown in the following table. Net income (loss) from exploration and production activities as reported on page 75 reflects income taxes computed on an effective rate basis.
Income taxes in Table III are based on statutory tax rates, reflecting allowable deductions and tax credits. Interest income and expense are excluded from the results reported in Table III and from the net income amounts on page 75.
Millions of dollars
Consolidated Companies Affiliated Companies
U.S. Other
Americas Africa Asia Australia/
Oceania Europe Total TCO Other
Year Ended December 31, 2020 Revenues from net production
Sales $ 1,665 $ 505 $ 473 $ 5,629 $ 3,010 $ 149 $ 11,431 $ 3,088 $ 288 Transfers 7,711 1,683 3,378 1,092 1,830 — 15,694 — —
Total 9,376 2,188 3,851 6,721 4,840 149 27,125 3,088 288 Production expenses excluding taxes (3,933) (981) (1,485) (2,408) (589) (64) (9,460) (419) (98) Taxes other than on income (597) (62) (77) (11) (121) (2) (870) (190) (30) Proved producing properties:
Depreciation and depletion (6,482) (1,221) (2,323) (3,466) (2,192) (92) (15,776) (879) (146) Accretion expense2 (165) (22) (136) (120) (62) (10) (515) (9) (6) Exploration expenses (457) (314) (431) (67) (231) (15) (1,515) — 1 Unproved properties valuation (58) (215) (6) (8) (1) — (288) — — Other income (expense)3 51 (8) (11) 1,053 (2) (9) 1,074 (29) (2,103)
Results before income taxes (2,265) (635) (618) 1,694 1,642 (43) (225) 1,562 (2,094) Income tax (expense) benefit 558 (5) 888 (353) (558) 12 542 (471) 161
Results of Producing Operations $ (1,707) $ (640) $ 270 $ 1,341 $ 1,084 $ (31) $ 317 $ 1,091 $ (1,933)
Year Ended December 31, 2019 Revenues from net production
Sales $ 2,259 $ 863 $ 668 $ 7,410 $ 4,332 $ 592 $ 16,124 $ 5,603 $ 780 Transfers 11,043 2,160 6,534 1,311 2,596 655 24,299 — —
Total 13,302 3,023 7,202 8,721 6,928 1,247 40,423 5,603 780 Production expenses excluding taxes (3,567) (1,020) (1,460) (2,703) (616) (343) (9,709) (475) (247) Taxes other than on income (595) (64) (101) (16) (221) (2) (999) (57) (10) Proved producing properties:
Depreciation and depletion (11,659) (1,380) (2,548) (3,165) (2,192) (85) (21,029) (870) (211) Accretion expense2 (191) (21) (148) (133) (53) (37) (583) (5) (8) Exploration expenses (293) (211) (73) (93) (60) (10) (740) — (8) Unproved properties valuation (3,268) (591) (2) (388) (2) — (4,251) (4) — Other income (expense)3 (51) (44) (121) 413 53 1,373 1,623 1 (157)
Results before income taxes (6,322) (308) 2,749 2,636 3,837 2,143 4,735 4,193 139 Income tax (expense) benefit 1,311 (27) (1,731) (1,212) (1,161) (311) (3,131) (1,261) (73)
Results of Producing Operations $ (5,011) $ (335) $ 1,018 $ 1,424 $ 2,676 $ 1,832 $ 1,604 $ 2,932 $ 66
1 The value of owned production consumed in operations as fuel has been eliminated from revenues and production expenses, and the related volumes have been deducted from net production in calculating the unit average sales price and production cost. This has no effect on the results of producing operations.
2 Represents accretion of ARO liability. Refer to Note 23, “Asset Retirement Obligations,” on page 94. 3 Includes foreign currency gains and losses, gains and losses on property dispositions and other miscellaneous income and expenses.
Chevron Corporation 2020 Annual Report 101
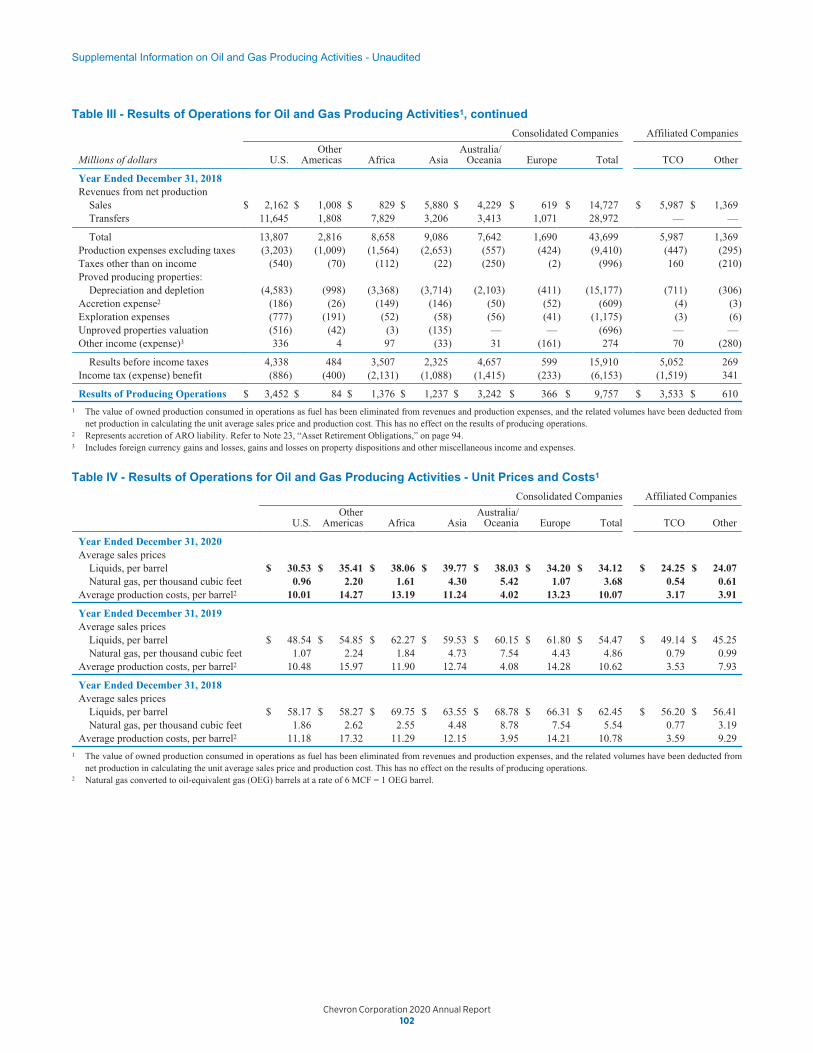
102
Supplemental Information on Oil and Gas Producing Activities - Unaudited
Table V Reserve Quantity Information
Summary of Net Oil and Gas Reserves
2020 2019 2018
Liquids in Millions of BarrelsNatural Gas inBillions of Cubic Feet
Crude OilCondensate
SyntheticOil NGL
NaturalGas
Crude OilCondensate
SyntheticOil NGL
NaturalGas
Crude OilCondensate
SyntheticOil NGL
NaturalGas
Proved Developed
Consolidated CompaniesU.S. 1,157 — 346 2,503 1,121 — 258 2,998 1,061 — 179 2,396Other Americas 168 597 6 222 174 540 5 397 156 545 3 393Africa 497 — 68 1,629 525 — 67 1,472 568 — 60 1,316Asia 358 — — 7,864 406 — — 3,382 470 — — 4,021Australia/Oceania 115 — 4 8,951 136 — 4 10,697 127 — 5 10,084Europe 23 — — 8 21 — — 8 81 — 3 205
Total Consolidated 2,318 597 424 21,177 2,383 540 334 18,954 2,463 545 250 18,415
Affiliated CompaniesTCO 565 — 53 1,057 584 — 59 1,135 638 — 62 1,179Other 2 — 12 322 114 — 10 308 65 55 11 308
Total Consolidated andAffiliated Companies 2,885 597 489 22,556 3,081 540 403 20,397 3,166 600 323 19,902
Proved Undeveloped
Consolidated CompaniesU.S. 593 — 247 1,747 807 — 244 1,730 813 — 349 4,313Other Americas 92 — 2 107 146 — 11 339 185 — 19 470Africa 57 — 36 1,208 88 — 33 1,286 110 — 38 1,499Asia 45 — — 319 107 — — 299 109 — — 289Australia/Oceania 26 — — 2,434 30 — — 3,961 29 — — 3,647Europe 38 — — 14 48 — — 18 65 — — 100
Total Consolidated 851 — 285 5,829 1,226 — 288 7,633 1,311 — 406 10,318
Affiliated CompaniesTCO 985 — 49 961 889 — 44 869 866 — 39 755Other 1 — 5 576 45 — 5 558 2 72 5 601
Total Consolidated andAffiliated Companies 1,837 — 339 7,366 2,160 — 337 9,060 2,179 72 450 11,674
Total Proved Reserves 4,722 597 828 29,922 5,241 540 740 29,457 5,345 672 773 31,576
Reserves Governance The company has adopted a comprehensive reserves and resource classification system modeled aftera system developed and approved by a number of organizations including the Society of Petroleum Engineers, the WorldPetroleum Congress and the American Association of Petroleum Geologists. The company classifies recoverablehydrocarbons into six categories based on their status at the time of reporting – three deemed commercial and threepotentially recoverable. Within the commercial classification are proved reserves and two categories of unproved reserves:probable and possible. The potentially recoverable categories are also referred to as contingent resources. For reservesestimates to be classified as proved, they must meet all SEC and company standards.
Proved oil and gas reserves are the estimated quantities that geoscience and engineering data demonstrate with reasonablecertainty to be economically producible in the future from known reservoirs under existing economic conditions, operatingmethods and government regulations. Net proved reserves exclude royalties and interests owned by others and reflectcontractual arrangements and royalty obligations in effect at the time of the estimate.
Proved reserves are classified as either developed or undeveloped. Proved developed reserves are the quantities expected tobe recovered through existing wells with existing equipment and operating methods. Proved undeveloped reserves are thequantities expected to be recovered from new wells on undrilled acreage or from existing wells where a relatively majorexpenditure is required for recompletion.
Due to the inherent uncertainties and the limited nature of reservoir data, estimates of reserves are subject to change asadditional information becomes available.
Proved reserves are estimated by company asset teams composed of earth scientists and engineers. As part of the internalcontrol process related to reserves estimation, the company maintains a Reserves Advisory Committee (RAC) that is chairedby the Manager of Global Reserves, an organization that is separate from the Upstream operating organization. The
103
173155_Annual_Report_10-K.indd 102173155_Annual_Report_10-K.indd 102 3/5/21 6:04 PM3/5/21 6:04 PM
Supplemental Information on Oil and Gas Producing Activities - Unaudited
Table III - Results of Operations for Oil and Gas Producing Activities1, continued
Millions of dollars
Consolidated Companies Affiliated Companies
U.S. Other
Americas Africa Asia Australia/
Oceania Europe Total TCO Other
Year Ended December 31, 2018 Revenues from net production
Sales $ 2,162 $ 1,008 $ 829 $ 5,880 $ 4,229 $ 619 $ 14,727 $ 5,987 $ 1,369 Transfers 11,645 1,808 7,829 3,206 3,413 1,071 28,972 — —
Total 13,807 2,816 8,658 9,086 7,642 1,690 43,699 5,987 1,369 Production expenses excluding taxes (3,203) (1,009) (1,564) (2,653) (557) (424) (9,410) (447) (295) Taxes other than on income (540) (70) (112) (22) (250) (2) (996) 160 (210) Proved producing properties:
Depreciation and depletion (4,583) (998) (3,368) (3,714) (2,103) (411) (15,177) (711) (306) Accretion expense2 (186) (26) (149) (146) (50) (52) (609) (4) (3) Exploration expenses (777) (191) (52) (58) (56) (41) (1,175) (3) (6) Unproved properties valuation (516) (42) (3) (135) — — (696) — — Other income (expense)3 336 4 97 (33) 31 (161) 274 70 (280)
Results before income taxes 4,338 484 3,507 2,325 4,657 599 15,910 5,052 269 Income tax (expense) benefit (886) (400) (2,131) (1,088) (1,415) (233) (6,153) (1,519) 341
Results of Producing Operations $ 3,452 $ 84 $ 1,376 $ 1,237 $ 3,242 $ 366 $ 9,757 $ 3,533 $ 610
1 The value of owned production consumed in operations as fuel has been eliminated from revenues and production expenses, and the related volumes have been deducted from net production in calculating the unit average sales price and production cost. This has no effect on the results of producing operations.
2 Represents accretion of ARO liability. Refer to Note 23, “Asset Retirement Obligations,” on page 94. 3 Includes foreign currency gains and losses, gains and losses on property dispositions and other miscellaneous income and expenses.
Table IV - Results of Operations for Oil and Gas Producing Activities - Unit Prices and Costs1
Consolidated Companies Affiliated Companies
U.S. Other
Americas Africa Asia Australia/
Oceania Europe Total TCO Other
Year Ended December 31, 2020 Average sales prices
Liquids, per barrel $ 30.53 $ 35.41 $ 38.06 $ 39.77 $ 38.03 $ 34.20 $ 34.12 $ 24.25 $ 24.07 Natural gas, per thousand cubic feet 0.96 2.20 1.61 4.30 5.42 1.07 3.68 0.54 0.61
Average production costs, per barrel2 10.01 14.27 13.19 11.24 4.02 13.23 10.07 3.17 3.91
Year Ended December 31, 2019 Average sales prices
Liquids, per barrel $ 48.54 $ 54.85 $ 62.27 $ 59.53 $ 60.15 $ 61.80 $ 54.47 $ 49.14 $ 45.25 Natural gas, per thousand cubic feet 1.07 2.24 1.84 4.73 7.54 4.43 4.86 0.79 0.99
Average production costs, per barrel2 10.48 15.97 11.90 12.74 4.08 14.28 10.62 3.53 7.93
Year Ended December 31, 2018 Average sales prices
Liquids, per barrel $ 58.17 $ 58.27 $ 69.75 $ 63.55 $ 68.78 $ 66.31 $ 62.45 $ 56.20 $ 56.41 Natural gas, per thousand cubic feet 1.86 2.62 2.55 4.48 8.78 7.54 5.54 0.77 3.19
Average production costs, per barrel2 11.18 17.32 11.29 12.15 3.95 14.21 10.78 3.59 9.29
1 The value of owned production consumed in operations as fuel has been eliminated from revenues and production expenses, and the related volumes have been deducted from net production in calculating the unit average sales price and production cost. This has no effect on the results of producing operations.
2 Natural gas converted to oil-equivalent gas (OEG) barrels at a rate of 6 MCF = 1 OEG barrel.
Chevron Corporation 2020 Annual Report 102

Supplemental Information on Oil and Gas Producing Activities - Unaudited
Table III - Results of Operations for Oil and Gas Producing Activities1, continued
Consolidated Companies Affiliated Companies
Millions of dollars U.S.Other
Americas Africa AsiaAustralia/
Oceania Europe Total TCO Other
Year Ended December 31, 2018Revenues from net production
Sales $ 2,162 $ 1,008 $ 829 $ 5,880 $ 4,229 $ 619 $ 14,727 $ 5,987 $ 1,369Transfers 11,645 1,808 7,829 3,206 3,413 1,071 28,972 — —
Total 13,807 2,816 8,658 9,086 7,642 1,690 43,699 5,987 1,369Production expenses excluding taxes (3,203) (1,009) (1,564) (2,653) (557) (424) (9,410) (447) (295)Taxes other than on income (540) (70) (112) (22) (250) (2) (996) 160 (210)Proved producing properties:
Depreciation and depletion (4,583) (998) (3,368) (3,714) (2,103) (411) (15,177) (711) (306)Accretion expense2 (186) (26) (149) (146) (50) (52) (609) (4) (3)Exploration expenses (777) (191) (52) (58) (56) (41) (1,175) (3) (6)Unproved properties valuation (516) (42) (3) (135) — — (696) — —Other income (expense)3 336 4 97 (33) 31 (161) 274 70 (280)
Results before income taxes 4,338 484 3,507 2,325 4,657 599 15,910 5,052 269Income tax (expense) benefit (886) (400) (2,131) (1,088) (1,415) (233) (6,153) (1,519) 341
Results of Producing Operations $ 3,452 $ 84 $ 1,376 $ 1,237 $ 3,242 $ 366 $ 9,757 $ 3,533 $ 610
1 The value of owned production consumed in operations as fuel has been eliminated from revenues and production expenses, and the related volumes have been deducted fromnet production in calculating the unit average sales price and production cost. This has no effect on the results of producing operations.
2 Represents accretion of ARO liability. Refer to Note 23, “Asset Retirement Obligations,” on page 94.3 Includes foreign currency gains and losses, gains and losses on property dispositions and other miscellaneous income and expenses.
Table IV - Results of Operations for Oil and Gas Producing Activities - Unit Prices and Costs1
Consolidated Companies Affiliated Companies
U.S.Other
Americas Africa AsiaAustralia/
Oceania Europe Total TCO Other
Year Ended December 31, 2020Average sales prices
Liquids, per barrel $ 30.53 $ 35.41 $ 38.06 $ 39.77 $ 38.03 $ 34.20 $ 34.12 $ 24.25 $ 24.07Natural gas, per thousand cubic feet 0.96 2.20 1.61 4.30 5.42 1.07 3.68 0.54 0.61
Average production costs, per barrel2 10.01 14.27 13.19 11.24 4.02 13.23 10.07 3.17 3.91
Year Ended December 31, 2019Average sales prices
Liquids, per barrel $ 48.54 $ 54.85 $ 62.27 $ 59.53 $ 60.15 $ 61.80 $ 54.47 $ 49.14 $ 45.25Natural gas, per thousand cubic feet 1.07 2.24 1.84 4.73 7.54 4.43 4.86 0.79 0.99
Average production costs, per barrel2 10.48 15.97 11.90 12.74 4.08 14.28 10.62 3.53 7.93
Year Ended December 31, 2018Average sales prices
Liquids, per barrel $ 58.17 $ 58.27 $ 69.75 $ 63.55 $ 68.78 $ 66.31 $ 62.45 $ 56.20 $ 56.41Natural gas, per thousand cubic feet 1.86 2.62 2.55 4.48 8.78 7.54 5.54 0.77 3.19
Average production costs, per barrel2 11.18 17.32 11.29 12.15 3.95 14.21 10.78 3.59 9.29
1 The value of owned production consumed in operations as fuel has been eliminated from revenues and production expenses, and the related volumes have been deducted fromnet production in calculating the unit average sales price and production cost. This has no effect on the results of producing operations.
2 Natural gas converted to oil-equivalent gas (OEG) barrels at a rate of 6 MCF = 1 OEG barrel.
102 103
173155_Annual_Report_10-K.indd 103173155_Annual_Report_10-K.indd 103 3/5/21 6:04 PM3/5/21 6:04 PM
Supplemental Information on Oil and Gas Producing Activities - Unaudited
Table V Reserve Quantity Information
Summary of Net Oil and Gas Reserves
Liquids in Millions of Barrels Natural Gas in Billions of Cubic Feet
2020 2019 2018
Crude Oil Condensate
Synthetic Oil NGL
Natural Gas
Crude Oil Condensate
Synthetic Oil NGL
Natural Gas
Crude Oil Condensate
Synthetic Oil NGL
Natural Gas
Proved Developed
Consolidated Companies U.S. 1,157 — 346 2,503 1,121 — 258 2,998 1,061 — 179 2,396 Other Americas 168 597 6 222 174 540 5 397 156 545 3 393 Africa 497 — 68 1,629 525 — 67 1,472 568 — 60 1,316 Asia 358 — — 7,864 406 — — 3,382 470 — — 4,021 Australia/Oceania 115 — 4 8,951 136 — 4 10,697 127 — 5 10,084 Europe 23 — — 8 21 — — 8 81 — 3 205
Total Consolidated 2,318 597 424 21,177 2,383 540 334 18,954 2,463 545 250 18,415
Affiliated Companies TCO 565 — 53 1,057 584 — 59 1,135 638 — 62 1,179 Other 2 — 12 322 114 — 10 308 65 55 11 308
Total Consolidated and Affiliated Companies 2,885 597 489 22,556 3,081 540 403 20,397 3,166 600 323 19,902
Proved Undeveloped
Consolidated Companies U.S. 593 — 247 1,747 807 — 244 1,730 813 — 349 4,313 Other Americas 92 — 2 107 146 — 11 339 185 — 19 470 Africa 57 — 36 1,208 88 — 33 1,286 110 — 38 1,499 Asia 45 — — 319 107 — — 299 109 — — 289 Australia/Oceania 26 — — 2,434 30 — — 3,961 29 — — 3,647 Europe 38 — — 14 48 — — 18 65 — — 100
Total Consolidated 851 — 285 5,829 1,226 — 288 7,633 1,311 — 406 10,318
Affiliated Companies TCO 985 — 49 961 889 — 44 869 866 — 39 755 Other 1 — 5 576 45 — 5 558 2 72 5 601
Total Consolidated and Affiliated Companies 1,837 — 339 7,366 2,160 — 337 9,060 2,179 72 450 11,674
Total Proved Reserves 4,722 597 828 29,922 5,241 540 740 29,457 5,345 672 773 31,576
Reserves Governance The company has adopted a comprehensive reserves and resource classification system modeled after a system developed and approved by a number of organizations including the Society of Petroleum Engineers, the World Petroleum Congress and the American Association of Petroleum Geologists. The company classifies recoverable hydrocarbons into six categories based on their status at the time of reporting – three deemed commercial and three potentially recoverable. Within the commercial classification are proved reserves and two categories of unproved reserves: probable and possible. The potentially recoverable categories are also referred to as contingent resources. For reserves estimates to be classified as proved, they must meet all SEC and company standards.
Proved oil and gas reserves are the estimated quantities that geoscience and engineering data demonstrate with reasonable certainty to be economically producible in the future from known reservoirs under existing economic conditions, operating methods and government regulations. Net proved reserves exclude royalties and interests owned by others and reflect contractual arrangements and royalty obligations in effect at the time of the estimate.
Proved reserves are classified as either developed or undeveloped. Proved developed reserves are the quantities expected to be recovered through existing wells with existing equipment and operating methods. Proved undeveloped reserves are the quantities expected to be recovered from new wells on undrilled acreage or from existing wells where a relatively major expenditure is required for recompletion.
Due to the inherent uncertainties and the limited nature of reservoir data, estimates of reserves are subject to change as additional information becomes available.
Proved reserves are estimated by company asset teams composed of earth scientists and engineers. As part of the internal control process related to reserves estimation, the company maintains a Reserves Advisory Committee (RAC) that is chaired by the Manager of Global Reserves, an organization that is separate from the Upstream operating organization. The
Chevron Corporation 2020 Annual Report 103

104
Supplemental Information on Oil and Gas Producing Activities - Unaudited
In 2020, Revisions include a reduction of 392 million BOE in the United States, primarily from the Midland and Delawarebasins where 300 million BOE was attributed to demotions due to capital reductions, commodity price effects andperformance revisions, and 75 million BOE from the Gulf of Mexico, primarily from commodity price effects at Anchor. InAustralia, there was a net reduction of 269 million BOE, primarily from demotion of compression volumes related to capitaland approval delays at Jansz Io, partially offset by positive revisions at Gorgon (Gorgon and Jansz Io make up the GorgonProject). A reduction of 85 million BOE was recorded in Canada, primarily from commodity price effects at KaybobDuvernay. In Nigeria, there was a reduction of 67 million BOE, primarily from gas volume changes based on reduceddemand and development plan changes at Meren. In Venezuela, there was a demotion of 48 million BOE, due to impairmentand accounting methodology change. These negative revisions were partially offset by an increase of 143 million BOE inKazakhstan, primarily from entitlement effects at TCO and Karachaganak.
In 2020, Extensions and Discoveries of 108 million BOE in the United States were primarily due to portfolio optimizationswhere future drilling in various fields is being targeted toward liquids-rich reservoirs with higher execution efficiencies in theMidland and Delaware basins.
The differences in 2020 Extensions and Discoveries of 124 million BOE, between the net quantities of Proved reserves of247 million BOE as reflected on pages 106 to 109 and net quantities of Proved Undeveloped of 123 million BOE, areprimarily due to proved extensions and discoveries that were not recognized as PUDs in the prior year but rather wererecognized directly as proved developed.
Purchases of 329 million BOE in 2020 include 326 million BOE from the Noble acquisition, primarily in Israel and the DJbasin in the United States.
Sales of 95 million BOE in 2020 include 77 million BOE from the sale of the company’s interest in Azerbaijan.
Transfers to proved developed reserves in 2020 include 178 million BOE in the United States, primarily from the Midlandand Delaware basin developments and 84 million BOE in Canada, Kazakhstan, and other international locations. Thesetransfers are the consequence of development expenditures on completing wells and facilities.
During 2020, investments totaling approximately $6.3 billion in oil and gas producing activities and about $0.1 billion innon-oil and gas producing activities were expended to advance the development of proved undeveloped reserves. In Asia,expenditures during the year totaled approximately $3.4 billion, primarily related to development projects of the TCOaffiliate in Kazakhstan. The United States accounted for about $2.1 billion related primarily to various development activitiesin the Midland and Delaware basins and the Gulf of Mexico. In Africa, about $0.3 billion was expended on various offshoredevelopment and natural gas projects in Nigeria, Angola and Republic of Congo. Development activities in Canada and otherinternational locations were primarily responsible for about $0.5 billion of expenditures.
Reserves that remain proved undeveloped for five or more years are a result of several factors that affect optimal projectdevelopment and execution, such as the complex nature of the development project in adverse and remote locations, physicallimitations of infrastructure or plant capacities that dictate project timing, compression projects that are pending reservoirpressure declines, and contractual limitations that dictate production levels.
At year-end 2020, the company held approximately 1.6 billion BOE of proved undeveloped reserves that have remainedundeveloped for five years or more. The majority of these reserves are in three locations where the company has a proventrack record of developing major projects. In Australia, approximately 400 million BOE remain undeveloped for five years ormore related to the Gorgon and Wheatstone Projects. Further field development to convert the remaining provedundeveloped reserves is scheduled to occur in line with operating constraints and infrastructure optimization. In Africa,approximately 200 million BOE have remained undeveloped for five years or more, primarily due to facility constraints atvarious fields and infrastructure associated with the Escravos gas projects in Nigeria. Affiliates account for about 1.3 billionBOE of proved undeveloped reserves with about 900 million BOE that have remained undeveloped for five years or more,with the majority related to the TCO affiliate in Kazakhstan. At TCO, further field development to convert the remainingproved undeveloped reserves is scheduled to occur in line with reservoir depletion and facility constraints.
Annually, the company assesses whether any changes have occurred in facts or circumstances, such as changes todevelopment plans, regulations or government policies, that would warrant a revision to reserve estimates. In 2020, decreasesin commodity prices negatively impacted the economic limits of oil and gas properties, resulting in proved reserve decreases,and positively impacted proved reserves due to entitlement effects. The year-end reserves quantities have been updated forthese circumstances and significant changes have been discussed in the appropriate reserves
105
173155_Annual_Report_10-K.indd 104173155_Annual_Report_10-K.indd 104 3/5/21 6:04 PM3/5/21 6:04 PM
Supplemental Information on Oil and Gas Producing Activities - Unaudited
Manager of Global Reserves has more than 30 years’ experience working in the oil and gas industry and holds both undergraduate and graduate degrees in geoscience. His experience includes various technical and management roles in providing reserve and resource estimates in support of major capital and exploration projects, and more than 10 years of overseeing oil and gas reserves processes. He has been named a Distinguished Lecturer by the American Association of Petroleum Geologists and is an active member of the American Association of Petroleum Geologists, the SEPM Society of Sedimentary Geologists and the Society of Petroleum Engineers.
All RAC members are degreed professionals, each with more than 10 years of experience in various aspects of reserves estimation relating to reservoir engineering, petroleum engineering, earth science or finance. The members are knowledgeable in SEC guidelines for proved reserves classification and receive annual training on the preparation of reserves estimates.
The RAC has the following primary responsibilities: establish the policies and processes used within the operating units to estimate reserves; provide independent reviews and oversight of the business units’ recommended reserves estimates and changes; confirm that proved reserves are recognized in accordance with SEC guidelines; determine that reserve volumes are calculated using consistent and appropriate standards, procedures and technology; and maintain the Chevron Corporation Reserves Manual, which provides standardized procedures used corporatewide for classifying and reporting hydrocarbon reserves.
During the year, the RAC is represented in meetings with each of the company’s upstream business units to review and discuss reserve changes recommended by the various asset teams. Major changes are also reviewed with the company’s senior leadership team including the Chief Executive Officer and the Chief Financial Officer. The company’s annual reserve activity is also reviewed with the Board of Directors. If major changes to reserves were to occur between the annual reviews, those matters would also be discussed with the Board.
RAC subteams also conduct in-depth reviews during the year of many of the fields that have large proved reserves quantities. These reviews include an examination of the proved-reserve records and documentation of their compliance with the Chevron Corporation Reserves Manual.
The acquisition of Noble was completed on October 5, 2020. Given the timing of the acquisition, Chevron has continued to rely on legacy Noble reserves staff and processes for reviewing reserves with input and guidance from the Chevron Reserves Advisory Committee. The processes include internal reviews and an external audit. Accordingly, Chevron continued to retain Netherland, Sewell & Associates, Inc. (NSAI), a third-party petroleum consulting firm, that completed an audit of the legacy Noble acquisition proved reserves at December 31, 2020 (representing approximately 15% of Chevron’s total reserves). Based upon their evaluation NSAI issued an unqualified audit opinion, and this report is attached as Exhibit 99.3 to the company’s Annual Report on Form 10-K.
Technologies Used in Establishing Proved Reserves Additions In 2020, additions to Chevron’s proved reserves were based on a wide range of geologic and engineering technologies. Information generated from wells, such as well logs, wire line sampling, production and pressure testing, fluid analysis, and core analysis, was integrated with seismic data, regional geologic studies, and information from analogous reservoirs to provide “reasonably certain” proved reserves estimates. Both proprietary and commercially available analytic tools, including reservoir simulation, geologic modeling and seismic processing, have been used in the interpretation of the subsurface data. These technologies have been utilized extensively by the company in the past, and the company believes that they provide a high degree of confidence in establishing reliable and consistent reserves estimates.
Proved Undeveloped Reserves
Noteworthy changes in proved undeveloped reserves are shown in the table below and discussed on the following page.
Proved Undeveloped Reserves (Millions of BOE) 2020
Quantity at January 1 4,007 Revisions (699) Improved Recovery 1 Extension & Discoveries 123 Purchases 329 Sales (95) Transfers to Proved Developed (262)
Quantity at December 31 3,404
Chevron Corporation 2020 Annual Report 104

Supplemental Information on Oil and Gas Producing Activities - Unaudited
Manager of Global Reserves has more than 30 years’ experience working in the oil and gas industry and holds bothundergraduate and graduate degrees in geoscience. His experience includes various technical and management roles inproviding reserve and resource estimates in support of major capital and exploration projects, and more than 10 years ofoverseeing oil and gas reserves processes. He has been named a Distinguished Lecturer by the American Association ofPetroleum Geologists and is an active member of the American Association of Petroleum Geologists, the SEPM Society ofSedimentary Geologists and the Society of Petroleum Engineers.
All RAC members are degreed professionals, each with more than 10 years of experience in various aspects of reservesestimation relating to reservoir engineering, petroleum engineering, earth science or finance. The members areknowledgeable in SEC guidelines for proved reserves classification and receive annual training on the preparation of reservesestimates.
The RAC has the following primary responsibilities: establish the policies and processes used within the operating units toestimate reserves; provide independent reviews and oversight of the business units’ recommended reserves estimates andchanges; confirm that proved reserves are recognized in accordance with SEC guidelines; determine that reserve volumes arecalculated using consistent and appropriate standards, procedures and technology; and maintain the Chevron CorporationReserves Manual, which provides standardized procedures used corporatewide for classifying and reporting hydrocarbonreserves.
During the year, the RAC is represented in meetings with each of the company’s upstream business units to review anddiscuss reserve changes recommended by the various asset teams. Major changes are also reviewed with the company’ssenior leadership team including the Chief Executive Officer and the Chief Financial Officer. The company’s annual reserveactivity is also reviewed with the Board of Directors. If major changes to reserves were to occur between the annual reviews,those matters would also be discussed with the Board.
RAC subteams also conduct in-depth reviews during the year of many of the fields that have large proved reserves quantities.These reviews include an examination of the proved-reserve records and documentation of their compliance with theChevron Corporation Reserves Manual.
The acquisition of Noble was completed on October 5, 2020. Given the timing of the acquisition, Chevron has continued torely on legacy Noble reserves staff and processes for reviewing reserves with input and guidance from the Chevron ReservesAdvisory Committee. The processes include internal reviews and an external audit. Accordingly, Chevron continued to retainNetherland, Sewell & Associates, Inc. (NSAI), a third-party petroleum consulting firm, that completed an audit of the legacyNoble acquisition proved reserves at December 31, 2020 (representing approximately 15% of Chevron’s total reserves).Based upon their evaluation NSAI issued an unqualified audit opinion, and this report is attached as Exhibit 99.3 to thecompany’s Annual Report on Form 10-K.
Technologies Used in Establishing Proved Reserves Additions In 2020, additions to Chevron’s proved reserves were basedon a wide range of geologic and engineering technologies. Information generated from wells, such as well logs, wire linesampling, production and pressure testing, fluid analysis, and core analysis, was integrated with seismic data, regionalgeologic studies, and information from analogous reservoirs to provide “reasonably certain” proved reserves estimates. Bothproprietary and commercially available analytic tools, including reservoir simulation, geologic modeling and seismicprocessing, have been used in the interpretation of the subsurface data. These technologies have been utilized extensively bythe company in the past, and the company believes that they provide a high degree of confidence in establishing reliable andconsistent reserves estimates.
Proved Undeveloped Reserves
Noteworthy changes in proved undeveloped reserves are shown in the table below and discussed on the following page.
Proved Undeveloped Reserves (Millions of BOE) 2020
Quantity at January 1 4,007Revisions (699)Improved Recovery 1Extension & Discoveries 123Purchases 329Sales (95)Transfers to Proved Developed (262)
Quantity at December 31 3,404
104 105
173155_Annual_Report_10-K.indd 105173155_Annual_Report_10-K.indd 105 3/5/21 6:04 PM3/5/21 6:04 PM
Supplemental Information on Oil and Gas Producing Activities - Unaudited
In 2020, Revisions include a reduction of 392 million BOE in the United States, primarily from the Midland and Delaware basins where 300 million BOE was attributed to demotions due to capital reductions, commodity price effects and performance revisions, and 75 million BOE from the Gulf of Mexico, primarily from commodity price effects at Anchor. In Australia, there was a net reduction of 269 million BOE, primarily from demotion of compression volumes related to capital and approval delays at Jansz Io, partially offset by positive revisions at Gorgon (Gorgon and Jansz Io make up the Gorgon Project). A reduction of 85 million BOE was recorded in Canada, primarily from commodity price effects at Kaybob Duvernay. In Nigeria, there was a reduction of 67 million BOE, primarily from gas volume changes based on reduced demand and development plan changes at Meren. In Venezuela, there was a demotion of 48 million BOE, due to impairment and accounting methodology change. These negative revisions were partially offset by an increase of 143 million BOE in Kazakhstan, primarily from entitlement effects at TCO and Karachaganak.
In 2020, Extensions and Discoveries of 108 million BOE in the United States were primarily due to portfolio optimizations where future drilling in various fields is being targeted toward liquids-rich reservoirs with higher execution efficiencies in the Midland and Delaware basins.
The differences in 2020 Extensions and Discoveries of 124 million BOE, between the net quantities of Proved reserves of 247 million BOE as reflected on pages 106 to 109 and net quantities of Proved Undeveloped of 123 million BOE, are primarily due to proved extensions and discoveries that were not recognized as PUDs in the prior year but rather were recognized directly as proved developed.
Purchases of 329 million BOE in 2020 include 326 million BOE from the Noble acquisition, primarily in Israel and the DJ basin in the United States.
Sales of 95 million BOE in 2020 include 77 million BOE from the sale of the company’s interest in Azerbaijan.
Transfers to proved developed reserves in 2020 include 178 million BOE in the United States, primarily from the Midland and Delaware basin developments and 84 million BOE in Canada, Kazakhstan, and other international locations. These transfers are the consequence of development expenditures on completing wells and facilities.
During 2020, investments totaling approximately $6.3 billion in oil and gas producing activities and about $0.1 billion in non-oil and gas producing activities were expended to advance the development of proved undeveloped reserves. In Asia, expenditures during the year totaled approximately $3.4 billion, primarily related to development projects of the TCO affiliate in Kazakhstan. The United States accounted for about $2.1 billion related primarily to various development activities in the Midland and Delaware basins and the Gulf of Mexico. In Africa, about $0.3 billion was expended on various offshore development and natural gas projects in Nigeria, Angola and Republic of Congo. Development activities in Canada and other international locations were primarily responsible for about $0.5 billion of expenditures.
Reserves that remain proved undeveloped for five or more years are a result of several factors that affect optimal project development and execution, such as the complex nature of the development project in adverse and remote locations, physical limitations of infrastructure or plant capacities that dictate project timing, compression projects that are pending reservoir pressure declines, and contractual limitations that dictate production levels.
At year-end 2020, the company held approximately 1.6 billion BOE of proved undeveloped reserves that have remained undeveloped for five years or more. The majority of these reserves are in three locations where the company has a proven track record of developing major projects. In Australia, approximately 400 million BOE remain undeveloped for five years or more related to the Gorgon and Wheatstone Projects. Further field development to convert the remaining proved undeveloped reserves is scheduled to occur in line with operating constraints and infrastructure optimization. In Africa, approximately 200 million BOE have remained undeveloped for five years or more, primarily due to facility constraints at various fields and infrastructure associated with the Escravos gas projects in Nigeria. Affiliates account for about 1.3 billion BOE of proved undeveloped reserves with about 900 million BOE that have remained undeveloped for five years or more, with the majority related to the TCO affiliate in Kazakhstan. At TCO, further field development to convert the remaining proved undeveloped reserves is scheduled to occur in line with reservoir depletion and facility constraints.
Annually, the company assesses whether any changes have occurred in facts or circumstances, such as changes to development plans, regulations or government policies, that would warrant a revision to reserve estimates. In 2020, decreases in commodity prices negatively impacted the economic limits of oil and gas properties, resulting in proved reserve decreases, and positively impacted proved reserves due to entitlement effects. The year-end reserves quantities have been updated for these circumstances and significant changes have been discussed in the appropriate reserves
Chevron Corporation 2020 Annual Report 105

106
Supplemental Information on Oil and Gas Producing Activities - Unaudited
Net Proved Reserves of Crude Oil, Condensate and Synthetic Oil
Consolidated Companies Affiliated CompaniesTotal
Consolidated
Millions of barrels U.S.Other
Americas1 Africa AsiaAustralia/
Oceania EuropeSynthetic
Oil2 Total TCOSynthetic
Oil Other3and Affiliated
Companies
Reserves at January 1, 2018 1,573 280 743 631 153 142 543 4,065 1,630 159 83 5,937Changes attributable to:
Revisions 121 59 61 37 17 19 21 335 (28) (23) (7) 277Improved recovery 5 — — 1 — 4 — 10 — — — 10Extensions and discoveries 359 31 1 — — — — 391 — — — 391Purchases 31 — — — — — — 31 — — — 31Sales (26) — (5) — — — — (31) — — — (31)Production (189) (29) (122) (90) (14) (19) (19) (482) (98) (9) (9) (598)
Reserves at December 31, 20184 1,874 341 678 579 156 146 545 4,319 1,504 127 67 6,017Changes attributable to:
Revisions (153) (25) 42 19 25 6 14 (72) 75 (126) 105 (18)Improved recovery 7 — — — — — — 7 — — — 7Extensions and discoveries 394 39 1 1 1 2 — 438 — — — 438Purchases 19 2 — — — — — 21 — — — 21Sales — (4) — — — (69) — (73) — — — (73)Production (213) (33) (108) (86) (16) (16) (19) (491) (106) (1) (13) (611)
Reserves at December 31, 20194 1,928 320 613 513 166 69 540 4,149 1,473 — 159 5,781Changes attributable to:
Revisions (279) (25) 11 74 (11) (4) 77 (157) 180 — (149) (126)Improved recovery 1 1 — — — — — 2 — — — 2Extensions and discoveries 105 3 1 — 1 — — 110 — — — 110Purchases 227 — 21 10 — — — 258 — — — 258Sales (11) — — (99) — — — (110) — — — (110)Production (221) (39) (92) (95) (15) (4) (20) (486) (103) — (7) (596)
Reserves at December 31, 20204 1,750 260 554 403 141 61 597 3,766 1,550 — 3 5,319
1 Ending reserve balances in North America were 166, 230 and 269 and in South America were 94, 90 and 72 in 2020, 2019 and 2018, respectively.2 Reserves associated with Canada.3 Ending reserve balances in Africa were 3, 3 and 3 and in South America were 0, 156 and 64 in 2020, 2019 and 2018, respectively.4 Included are year-end reserve quantities related to production-sharing contracts (PSC) (refer to glossary of energy and financial terms for the definition of a PSC). PSC-related
reserve quantities are 9 percent, 11 percent and 14 percent for consolidated companies for 2020, 2019 and 2018, respectively.
Noteworthy changes in natural gas liquids proved reserves for 2018 through 2020 are discussed below and shown in the tableon the following page:
Revisions In 2018, improved field performance in the Midland and Delaware basins were primarily responsible for the34 million barrel increase in the United States.
In 2019, portfolio optimizations and low price realizations in various fields in the Midland and Delaware basins and planneddivestments in the Appalachian basin were mainly responsible for the 120 million barrel decrease in the United States.
In 2020, capital reductions and commodity price effects in various fields in Midland and Delaware basins were primarilyresponsible for the 71 million barrels decrease in the United States.
Extensions and Discoveries In 2018, extensions and discoveries in the Midland and Delaware basins were primarilyresponsible for the 173 million barrel increase in the United States.
In 2019, extensions and discoveries in the Midland and Delaware basins and deepwater fields in the Gulf of Mexico wereprimarily responsible for the 140 million barrel increase in the United States.
In 2020, extensions and discoveries in various fields in Midland and Delaware basins were primarily responsible for the60 million barrels increase in the United States.
Purchases In 2020, the acquisition of Noble assets contributed 198 million barrels primarily in the Denver Julesburg basin,Midland and Delaware basins and Eagle Ford Shale in the United States.
107
173155_Annual_Report_10-K.indd 106173155_Annual_Report_10-K.indd 106 3/5/21 6:04 PM3/5/21 6:04 PM
Supplemental Information on Oil and Gas Producing Activities - Unaudited
sections. Over the past three years, the ratio of proved undeveloped reserves to total proved reserves has ranged between 31 percent and 38 percent.
Proved Reserve Quantities For the three years ending December 31, 2020, the pattern of net reserve changes shown in the following tables are not necessarily indicative of future trends. Apart from acquisitions, the company’s ability to add proved reserves can be affected by events and circumstances that are outside the company’s control, such as delays in government permitting, partner approvals of development plans, changes in oil and gas prices, OPEC constraints, geopolitical uncertainties, and civil unrest.
At December 31, 2020, proved reserves for the company were 11.1 billion BOE. The company’s estimated net proved reserves of liquids including crude oil, condensate and synthetic oil for the years 2018, 2019 and 2020 are shown in the table on page 107. The company’s estimated net proved reserves of natural gas liquids are shown on page 108 and the company’s estimated net proved reserves of natural gas are shown on page 109.
Noteworthy changes in crude oil, condensate and synthetic oil proved reserves for 2018 through 2020 are discussed below and shown in the table on the following page:
Revisions In 2018, improved field performance at various Gulf of Mexico fields and in the Midland and Delaware basins were primarily responsible for the 121 million barrel increase in the United States. Improved field performance at various fields, including Agbami in Nigeria and Moho-Bilondo in the Republic of Congo, were responsible for the 61 million barrel increase in Africa. Reserves in Other Americas increased by 59 million barrels, primarily due to improved field performance at the Hebron field in Canada. In Asia, improved performance across numerous assets resulted in the 37 million barrel increase.
In 2019, portfolio optimizations, where future drilling in various fields in the Midland and Delaware basins is being targeted away from reservoirs with higher gas-to-oil ratios and lower execution efficiencies, and planned divestments in the Appalachian basin, were primarily responsible for the 153 million barrel decrease in the United States. Operational issues with the Petropiar upgrader in Venezuela resulted in a decrease in reserves of synthetic oil of 126 million barrels and an increase of crude oil and condensate reserves of 105 million barrels. Reservoir management and entitlement effects were mainly responsible for 75 million barrels increase in the TCO affiliate in Kazakhstan. Improved field performance at various fields, including Moho-Bilondo in the Republic of Congo, Mafumeria in Angola, and Sonam in Nigeria, were responsible for the 42 million barrel increase in Africa.
In 2020, capital reductions and commodity price effects in the Midland and Delaware basins and Anchor in the Gulf of Mexico, were primarily responsible for the 279 million barrels decrease in the United States. Reserves in Venezuela affiliates decreased by 149 million barrels, primarily due to impairments and accounting methodology change. Entitlement effects and performance revisions in the TCO affiliate were primarily responsible for the 180 million barrels increase. Entitlement effects primarily contributed to an increase of 77 million barrels synthetic oil at the Athabasca Oil sands in Canada and 74 million barrels at multiple locations in Asia.
Extensions and Discoveries In 2018, extensions and discoveries in the Midland and Delaware basins were primarily responsible for the 359 million barrel increase in the United States. Extensions and discoveries in the Duvernay Shale in Canada and Loma Campana in Argentina were primarily responsible for the 31 million barrel increase in Other Americas.
In 2019, portfolio optimizations, where future drilling in various fields in the Midland and Delaware basins is being targeted towards liquids-rich reservoirs with higher execution efficiencies, and extensions and discoveries in the deepwater fields in the Gulf of Mexico, were primarily responsible for the 394 million barrel increase in the United States. Extensions and discoveries in Loma Campana in Argentina were primarily responsible for the 39 million barrel increase in Other Americas.
In 2020, extensions and discoveries in the Midland and Delaware basins were primarily responsible for the 105 million barrels increase in the United States.
Purchases In 2018, purchases of 31 million barrels in the United States were primarily in the Midland and Delaware basins.
In 2020, the acquisition of Noble assets contributed 227 million barrels in the DJ basin, Midland and Delaware basins in the United States.
Sales In 2019, sales of 69 million barrels in Europe were in the United Kingdom and Denmark.
In 2020, sale of 99 million barrels in Asia were in Azerbaijan.
Chevron Corporation 2020 Annual Report 106

Supplemental Information on Oil and Gas Producing Activities - Unaudited
sections. Over the past three years, the ratio of proved undeveloped reserves to total proved reserves has ranged between31 percent and 38 percent.
Proved Reserve Quantities For the three years ending December 31, 2020, the pattern of net reserve changes shown in thefollowing tables are not necessarily indicative of future trends. Apart from acquisitions, the company’s ability to add provedreserves can be affected by events and circumstances that are outside the company’s control, such as delays in governmentpermitting, partner approvals of development plans, changes in oil and gas prices, OPEC constraints, geopoliticaluncertainties, and civil unrest.
At December 31, 2020, proved reserves for the company were 11.1 billion BOE. The company’s estimated net provedreserves of liquids including crude oil, condensate and synthetic oil for the years 2018, 2019 and 2020 are shown in the tableon page 107. The company’s estimated net proved reserves of natural gas liquids are shown on page 108 and the company’sestimated net proved reserves of natural gas are shown on page 109.
Noteworthy changes in crude oil, condensate and synthetic oil proved reserves for 2018 through 2020 are discussed belowand shown in the table on the following page:
Revisions In 2018, improved field performance at various Gulf of Mexico fields and in the Midland and Delaware basinswere primarily responsible for the 121 million barrel increase in the United States. Improved field performance at variousfields, including Agbami in Nigeria and Moho-Bilondo in the Republic of Congo, were responsible for the 61 million barrelincrease in Africa. Reserves in Other Americas increased by 59 million barrels, primarily due to improved field performanceat the Hebron field in Canada. In Asia, improved performance across numerous assets resulted in the 37 million barrelincrease.
In 2019, portfolio optimizations, where future drilling in various fields in the Midland and Delaware basins is being targetedaway from reservoirs with higher gas-to-oil ratios and lower execution efficiencies, and planned divestments in theAppalachian basin, were primarily responsible for the 153 million barrel decrease in the United States. Operational issueswith the Petropiar upgrader in Venezuela resulted in a decrease in reserves of synthetic oil of 126 million barrels and anincrease of crude oil and condensate reserves of 105 million barrels. Reservoir management and entitlement effects weremainly responsible for 75 million barrels increase in the TCO affiliate in Kazakhstan. Improved field performance at variousfields, including Moho-Bilondo in the Republic of Congo, Mafumeria in Angola, and Sonam in Nigeria, were responsible forthe 42 million barrel increase in Africa.
In 2020, capital reductions and commodity price effects in the Midland and Delaware basins and Anchor in the Gulf ofMexico, were primarily responsible for the 279 million barrels decrease in the United States. Reserves in Venezuela affiliatesdecreased by 149 million barrels, primarily due to impairments and accounting methodology change. Entitlement effects andperformance revisions in the TCO affiliate were primarily responsible for the 180 million barrels increase. Entitlementeffects primarily contributed to an increase of 77 million barrels synthetic oil at the Athabasca Oil sands in Canada and74 million barrels at multiple locations in Asia.
Extensions and Discoveries In 2018, extensions and discoveries in the Midland and Delaware basins were primarilyresponsible for the 359 million barrel increase in the United States. Extensions and discoveries in the Duvernay Shale inCanada and Loma Campana in Argentina were primarily responsible for the 31 million barrel increase in Other Americas.
In 2019, portfolio optimizations, where future drilling in various fields in the Midland and Delaware basins is being targetedtowards liquids-rich reservoirs with higher execution efficiencies, and extensions and discoveries in the deepwater fields inthe Gulf of Mexico, were primarily responsible for the 394 million barrel increase in the United States. Extensions anddiscoveries in Loma Campana in Argentina were primarily responsible for the 39 million barrel increase in Other Americas.
In 2020, extensions and discoveries in the Midland and Delaware basins were primarily responsible for the 105 millionbarrels increase in the United States.
Purchases In 2018, purchases of 31 million barrels in the United States were primarily in the Midland and Delaware basins.
In 2020, the acquisition of Noble assets contributed 227 million barrels in the DJ basin, Midland and Delaware basins in theUnited States.
Sales In 2019, sales of 69 million barrels in Europe were in the United Kingdom and Denmark.
In 2020, sale of 99 million barrels in Asia were in Azerbaijan.
106 107
173155_Annual_Report_10-K.indd 107173155_Annual_Report_10-K.indd 107 3/5/21 6:04 PM3/5/21 6:04 PM
Supplemental Information on Oil and Gas Producing Activities - Unaudited
Net Proved Reserves of Crude Oil, Condensate and Synthetic Oil
Millions of barrels
Consolidated Companies Affiliated Companies Total
Consolidated and Affiliated
Companies U.S. Other
Americas1 Africa Asia Australia/
Oceania Europe Synthetic
Oil2 Total TCO Synthetic
Oil Other3
Reserves at January 1, 2018 1,573 280 743 631 153 142 543 4,065 1,630 159 83 5,937 Changes attributable to:
Revisions 121 59 61 37 17 19 21 335 (28) (23) (7) 277 Improved recovery 5 — — 1 — 4 — 10 — — — 10 Extensions and discoveries 359 31 1 — — — — 391 — — — 391 Purchases 31 — — — — — — 31 — — — 31 Sales (26) — (5) — — — — (31) — — — (31) Production (189) (29) (122) (90) (14) (19) (19) (482) (98) (9) (9) (598)
Reserves at December 31, 20184 1,874 341 678 579 156 146 545 4,319 1,504 127 67 6,017 Changes attributable to:
Revisions (153) (25) 42 19 25 6 14 (72) 75 (126) 105 (18) Improved recovery 7 — — — — — — 7 — — — 7 Extensions and discoveries 394 39 1 1 1 2 — 438 — — — 438 Purchases 19 2 — — — — — 21 — — — 21 Sales — (4) — — — (69) — (73) — — — (73) Production (213) (33) (108) (86) (16) (16) (19) (491) (106) (1) (13) (611)
Reserves at December 31, 20194 1,928 320 613 513 166 69 540 4,149 1,473 — 159 5,781 Changes attributable to:
Revisions (279) (25) 11 74 (11) (4) 77 (157) 180 — (149) (126) Improved recovery 1 1 — — — — — 2 — — — 2 Extensions and discoveries 105 3 1 — 1 — — 110 — — — 110 Purchases 227 — 21 10 — — — 258 — — — 258 Sales (11) — — (99) — — — (110) — — — (110) Production (221) (39) (92) (95) (15) (4) (20) (486) (103) — (7) (596)
Reserves at December 31, 20204 1,750 260 554 403 141 61 597 3,766 1,550 — 3 5,319
1 Ending reserve balances in North America were 166, 230 and 269 and in South America were 94, 90 and 72 in 2020, 2019 and 2018, respectively. 2 Reserves associated with Canada. 3 Ending reserve balances in Africa were 3, 3 and 3 and in South America were 0, 156 and 64 in 2020, 2019 and 2018, respectively. 4 Included are year-end reserve quantities related to production-sharing contracts (PSC) (refer to glossary of energy and financial terms for the definition of a PSC). PSC-related
reserve quantities are 9 percent, 11 percent and 14 percent for consolidated companies for 2020, 2019 and 2018, respectively.
Noteworthy changes in natural gas liquids proved reserves for 2018 through 2020 are discussed below and shown in the table on the following page:
Revisions In 2018, improved field performance in the Midland and Delaware basins were primarily responsible for the 34 million barrel increase in the United States.
In 2019, portfolio optimizations and low price realizations in various fields in the Midland and Delaware basins and planned divestments in the Appalachian basin were mainly responsible for the 120 million barrel decrease in the United States.
In 2020, capital reductions and commodity price effects in various fields in Midland and Delaware basins were primarily responsible for the 71 million barrels decrease in the United States.
Extensions and Discoveries In 2018, extensions and discoveries in the Midland and Delaware basins were primarily responsible for the 173 million barrel increase in the United States.
In 2019, extensions and discoveries in the Midland and Delaware basins and deepwater fields in the Gulf of Mexico were primarily responsible for the 140 million barrel increase in the United States.
In 2020, extensions and discoveries in various fields in Midland and Delaware basins were primarily responsible for the 60 million barrels increase in the United States.
Purchases In 2020, the acquisition of Noble assets contributed 198 million barrels primarily in the Denver Julesburg basin, Midland and Delaware basins and Eagle Ford Shale in the United States.
Chevron Corporation 2020 Annual Report 107
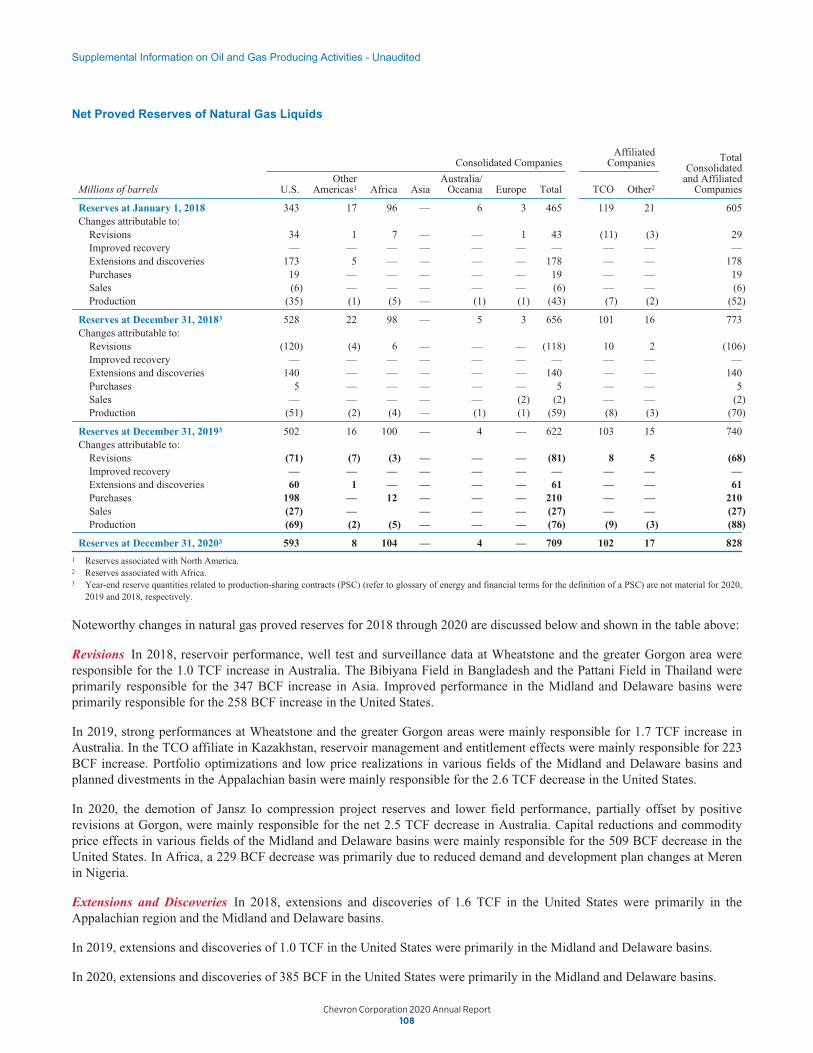
108
Supplemental Information on Oil and Gas Producing Activities - Unaudited
Purchases In 2020, the acquisition of Noble assets contributed 5.4 TCF in Israel in Asia, 1.5 TCF in the Denver Julesburgbasin, Midland and Delaware basins and Eagle Ford Shale in the United States and 441 BCF in Equatorial Guinea in Africa.
Sales In 2019, sales of 240 BCF in Europe were in the United Kingdom and Denmark.
In 2020, sales of 1.3 TCF were primarily in the Appalachian basin, in the United States and 264 BCF primarily in Azerbaijanin Asia.
Net Proved Reserves of Natural Gas
Consolidated CompaniesAffiliated
Companies TotalConsolidated
and AffiliatedCompaniesBillions of cubic feet (BCF) U.S.
OtherAmericas1 Africa Asia
Australia/Oceania Europe Total TCO Other2
Reserves at January 1, 2018 5,180 795 2,906 4,773 13,559 301 27,514 2,183 1,039 30,736Changes attributable to:
Revisions 258 (3) 25 347 1,012 68 1,707 (108) (38) 1,561Improved recovery 2 2 — — 1 — 5 — — 5Extensions and discoveries 1,627 138 — 5 — 1 1,771 — 3 1,774Purchases 144 — 1 — — — 145 — — 145Sales (125) — (5) — — — (130) — — (130)Production3 (377) (69) (112) (815) (841) (65) (2,279) (141) (95) (2,515)
Reserves at December 31, 20184 6,709 863 2,815 4,310 13,731 305 28,733 1,934 909 31,576Changes attributable to:
Revisions (2,565) (107) 46 165 1,732 3 (726) 223 39 (464)Improved recovery — — — — — — — — — —Extensions and discoveries 1,008 49 — 5 93 1 1,156 — 20 1,176Purchases 24 — — — — — 24 — — 24Sales (1) (2) — — — (240) (243) — — (243)Production3 (447) (67) (103) (799) (898) (43) (2,357) (153) (102) (2,612)
Reserves at December 31, 20194 4,728 736 2,758 3,681 14,658 26 26,587 2,004 866 29,457Changes attributable to:
Revisions (509) (178) (229) 169 (2,455) (2) (3,204) 162 138 (2,904)Improved recovery — — — — — — — — — —Extensions and discoveries 385 8 2 — 58 — 453 — — 453Purchases 1,548 — 441 5,350 — — 7,339 — — 7,339Sales (1,314) (177) — (264) — — (1,755) — — (1,755)Production3 (588) (60) (135) (753) (876) (2) (2,414) (148) (106) (2,668)
Reserves at December 31, 20204 4,250 329 2,837 8,183 11,385 22 27,006 2,018 898 29,922
1 Ending reserve balances in North America and South America were 234, 462, 582 and 95, 274, 281 in 2020, 2019 and 2018, respectively.2 Ending reserve balances in Africa and South America were 898, 802, 799 and 0, 64, 110 in 2020, 2019 and 2018, respectively.3 Total “as sold” volumes are 2,447, 2,379 and 2,289 for 2020, 2019 and 2018, respectively.4 Includes reserve quantities related to production-sharing contracts (PSC) (refer to glossary of energy and financial terms for the definition of a PSC). PSC-related reserve
quantities are 10 percent, 10 percent and 10 percent for consolidated companies for 2020, 2019 and 2018, respectively.
109
173155_Annual_Report_10-K.indd 108173155_Annual_Report_10-K.indd 108 3/5/21 6:04 PM3/5/21 6:04 PM
Supplemental Information on Oil and Gas Producing Activities - Unaudited
Net Proved Reserves of Natural Gas Liquids
Millions of barrels
Consolidated Companies Affiliated
Companies Total Consolidated
and Affiliated Companies U.S.
Other Americas1 Africa Asia
Australia/ Oceania Europe Total TCO Other2
Reserves at January 1, 2018 343 17 96 — 6 3 465 119 21 605 Changes attributable to:
Revisions 34 1 7 — — 1 43 (11) (3) 29 Improved recovery — — — — — — — — — — Extensions and discoveries 173 5 — — — — 178 — — 178 Purchases 19 — — — — — 19 — — 19 Sales (6) — — — — — (6) — — (6) Production (35) (1) (5) — (1) (1) (43) (7) (2) (52)
Reserves at December 31, 20183 528 22 98 — 5 3 656 101 16 773 Changes attributable to:
Revisions (120) (4) 6 — — — (118) 10 2 (106) Improved recovery — — — — — — — — — — Extensions and discoveries 140 — — — — — 140 — — 140 Purchases 5 — — — — — 5 — — 5 Sales — — — — — (2) (2) — — (2) Production (51) (2) (4) — (1) (1) (59) (8) (3) (70)
Reserves at December 31, 20193 502 16 100 — 4 — 622 103 15 740 Changes attributable to:
Revisions (71) (7) (3) — — — (81) 8 5 (68) Improved recovery — — — — — — — — — — Extensions and discoveries 60 1 — — — — 61 — — 61 Purchases 198 — 12 — — — 210 — — 210 Sales (27) — — — — (27) — — (27) Production (69) (2) (5) — — — (76) (9) (3) (88)
Reserves at December 31, 20203 593 8 104 — 4 — 709 102 17 828
1 Reserves associated with North America. 2 Reserves associated with Africa. 3 Year-end reserve quantities related to production-sharing contracts (PSC) (refer to glossary of energy and financial terms for the definition of a PSC) are not material for 2020,
2019 and 2018, respectively.
Noteworthy changes in natural gas proved reserves for 2018 through 2020 are discussed below and shown in the table above:
Revisions In 2018, reservoir performance, well test and surveillance data at Wheatstone and the greater Gorgon area were responsible for the 1.0 TCF increase in Australia. The Bibiyana Field in Bangladesh and the Pattani Field in Thailand were primarily responsible for the 347 BCF increase in Asia. Improved performance in the Midland and Delaware basins were primarily responsible for the 258 BCF increase in the United States.
In 2019, strong performances at Wheatstone and the greater Gorgon areas were mainly responsible for 1.7 TCF increase in Australia. In the TCO affiliate in Kazakhstan, reservoir management and entitlement effects were mainly responsible for 223 BCF increase. Portfolio optimizations and low price realizations in various fields of the Midland and Delaware basins and planned divestments in the Appalachian basin were mainly responsible for the 2.6 TCF decrease in the United States.
In 2020, the demotion of Jansz Io compression project reserves and lower field performance, partially offset by positive revisions at Gorgon, were mainly responsible for the net 2.5 TCF decrease in Australia. Capital reductions and commodity price effects in various fields of the Midland and Delaware basins were mainly responsible for the 509 BCF decrease in the United States. In Africa, a 229 BCF decrease was primarily due to reduced demand and development plan changes at Meren in Nigeria.
Extensions and Discoveries In 2018, extensions and discoveries of 1.6 TCF in the United States were primarily in the Appalachian region and the Midland and Delaware basins.
In 2019, extensions and discoveries of 1.0 TCF in the United States were primarily in the Midland and Delaware basins.
In 2020, extensions and discoveries of 385 BCF in the United States were primarily in the Midland and Delaware basins.
Chevron Corporation 2020 Annual Report 108

Supplemental Information on Oil and Gas Producing Activities - Unaudited
Net Proved Reserves of Natural Gas Liquids
Consolidated CompaniesAffiliated
Companies TotalConsolidated
and AffiliatedCompaniesMillions of barrels U.S.
OtherAmericas1 Africa Asia
Australia/Oceania Europe Total TCO Other2
Reserves at January 1, 2018 343 17 96 — 6 3 465 119 21 605Changes attributable to:
Revisions 34 1 7 — — 1 43 (11) (3) 29Improved recovery — — — — — — — — — —Extensions and discoveries 173 5 — — — — 178 — — 178Purchases 19 — — — — — 19 — — 19Sales (6) — — — — — (6) — — (6)Production (35) (1) (5) — (1) (1) (43) (7) (2) (52)
Reserves at December 31, 20183 528 22 98 — 5 3 656 101 16 773Changes attributable to:
Revisions (120) (4) 6 — — — (118) 10 2 (106)Improved recovery — — — — — — — — — —Extensions and discoveries 140 — — — — — 140 — — 140Purchases 5 — — — — — 5 — — 5Sales — — — — — (2) (2) — — (2)Production (51) (2) (4) — (1) (1) (59) (8) (3) (70)
Reserves at December 31, 20193 502 16 100 — 4 — 622 103 15 740Changes attributable to:
Revisions (71) (7) (3) — — — (81) 8 5 (68)Improved recovery — — — — — — — — — —Extensions and discoveries 60 1 — — — — 61 — — 61Purchases 198 — 12 — — — 210 — — 210Sales (27) — — — — (27) — — (27)Production (69) (2) (5) — — — (76) (9) (3) (88)
Reserves at December 31, 20203 593 8 104 — 4 — 709 102 17 828
1 Reserves associated with North America.2 Reserves associated with Africa.3 Year-end reserve quantities related to production-sharing contracts (PSC) (refer to glossary of energy and financial terms for the definition of a PSC) are not material for 2020,
2019 and 2018, respectively.
Noteworthy changes in natural gas proved reserves for 2018 through 2020 are discussed below and shown in the table above:
Revisions In 2018, reservoir performance, well test and surveillance data at Wheatstone and the greater Gorgon area wereresponsible for the 1.0 TCF increase in Australia. The Bibiyana Field in Bangladesh and the Pattani Field in Thailand wereprimarily responsible for the 347 BCF increase in Asia. Improved performance in the Midland and Delaware basins wereprimarily responsible for the 258 BCF increase in the United States.
In 2019, strong performances at Wheatstone and the greater Gorgon areas were mainly responsible for 1.7 TCF increase inAustralia. In the TCO affiliate in Kazakhstan, reservoir management and entitlement effects were mainly responsible for 223BCF increase. Portfolio optimizations and low price realizations in various fields of the Midland and Delaware basins andplanned divestments in the Appalachian basin were mainly responsible for the 2.6 TCF decrease in the United States.
In 2020, the demotion of Jansz Io compression project reserves and lower field performance, partially offset by positiverevisions at Gorgon, were mainly responsible for the net 2.5 TCF decrease in Australia. Capital reductions and commodityprice effects in various fields of the Midland and Delaware basins were mainly responsible for the 509 BCF decrease in theUnited States. In Africa, a 229 BCF decrease was primarily due to reduced demand and development plan changes at Merenin Nigeria.
Extensions and Discoveries In 2018, extensions and discoveries of 1.6 TCF in the United States were primarily in theAppalachian region and the Midland and Delaware basins.
In 2019, extensions and discoveries of 1.0 TCF in the United States were primarily in the Midland and Delaware basins.
In 2020, extensions and discoveries of 385 BCF in the United States were primarily in the Midland and Delaware basins.
108 109
173155_Annual_Report_10-K.indd 109173155_Annual_Report_10-K.indd 109 3/5/21 6:04 PM3/5/21 6:04 PM
Supplemental Information on Oil and Gas Producing Activities - Unaudited
Purchases In 2020, the acquisition of Noble assets contributed 5.4 TCF in Israel in Asia, 1.5 TCF in the Denver Julesburg basin, Midland and Delaware basins and Eagle Ford Shale in the United States and 441 BCF in Equatorial Guinea in Africa.
Sales In 2019, sales of 240 BCF in Europe were in the United Kingdom and Denmark.
In 2020, sales of 1.3 TCF were primarily in the Appalachian basin, in the United States and 264 BCF primarily in Azerbaijan in Asia.
Net Proved Reserves of Natural Gas
Billions of cubic feet (BCF)
Consolidated Companies Affiliated
Companies Total Consolidated
and Affiliated Companies U.S.
Other Americas1 Africa Asia
Australia/ Oceania Europe Total TCO Other2
Reserves at January 1, 2018 5,180 795 2,906 4,773 13,559 301 27,514 2,183 1,039 30,736 Changes attributable to:
Revisions 258 (3) 25 347 1,012 68 1,707 (108) (38) 1,561 Improved recovery 2 2 — — 1 — 5 — — 5 Extensions and discoveries 1,627 138 — 5 — 1 1,771 — 3 1,774 Purchases 144 — 1 — — — 145 — — 145 Sales (125) — (5) — — — (130) — — (130) Production3 (377) (69) (112) (815) (841) (65) (2,279) (141) (95) (2,515)
Reserves at December 31, 20184 6,709 863 2,815 4,310 13,731 305 28,733 1,934 909 31,576 Changes attributable to:
Revisions (2,565) (107) 46 165 1,732 3 (726) 223 39 (464) Improved recovery — — — — — — — — — — Extensions and discoveries 1,008 49 — 5 93 1 1,156 — 20 1,176 Purchases 24 — — — — — 24 — — 24 Sales (1) (2) — — — (240) (243) — — (243) Production3 (447) (67) (103) (799) (898) (43) (2,357) (153) (102) (2,612)
Reserves at December 31, 20194 4,728 736 2,758 3,681 14,658 26 26,587 2,004 866 29,457 Changes attributable to:
Revisions (509) (178) (229) 169 (2,455) (2) (3,204) 162 138 (2,904) Improved recovery — — — — — — — — — — Extensions and discoveries 385 8 2 — 58 — 453 — — 453 Purchases 1,548 — 441 5,350 — — 7,339 — — 7,339 Sales (1,314) (177) — (264) — — (1,755) — — (1,755) Production3 (588) (60) (135) (753) (876) (2) (2,414) (148) (106) (2,668)
Reserves at December 31, 20204 4,250 329 2,837 8,183 11,385 22 27,006 2,018 898 29,922
1 Ending reserve balances in North America and South America were 234, 462, 582 and 95, 274, 281 in 2020, 2019 and 2018, respectively. 2 Ending reserve balances in Africa and South America were 898, 802, 799 and 0, 64, 110 in 2020, 2019 and 2018, respectively. 3 Total “as sold” volumes are 2,447, 2,379 and 2,289 for 2020, 2019 and 2018, respectively. 4 Includes reserve quantities related to production-sharing contracts (PSC) (refer to glossary of energy and financial terms for the definition of a PSC). PSC-related reserve
quantities are 10 percent, 10 percent and 10 percent for consolidated companies for 2020, 2019 and 2018, respectively.
Chevron Corporation 2020 Annual Report 109

110
Supplemental Information on Oil and Gas Producing Activities - Unaudited
Table VII - Changes in the Standardized Measure of Discounted Future Net Cash Flows From Proved Reserves
The changes in present values between years, which can be significant, reflect changes in estimated proved-reserve quantitiesand prices and assumptions used in forecasting production volumes and costs. Changes in the timing of production areincluded with “Revisions of previous quantity estimates.”
Millions of dollars Consolidated Companies Affiliated CompaniesTotal Consolidated and
Affiliated Companies
Present Value at January 1, 2018 $ 65,847 $ 14,166 $ 80,013Sales and transfers of oil and gas produced net of production costs (33,535) (6,813) (40,348)Development costs incurred 9,723 5,044 14,767Purchases of reserves 99 — 99Sales of reserves (622) — (622)Extensions, discoveries and improved recovery less related costs 5,503 14 5,517Revisions of previous quantity estimates 15,480 (2,255) 13,225Net changes in prices, development and production costs 39,241 17,251 56,492Accretion of discount 9,413 2,084 11,497Net change in income tax (16,518) (4,795) (21,313)
Net Change for 2018 28,784 10,530 39,314
Present Value at December 31, 2018 $ 94,631 $ 24,696 $119,327Sales and transfers of oil and gas produced net of production costs (29,436) (5,823) (35,259)Development costs incurred 10,497 5,120 15,617Purchases of reserves 406 — 406Sales of reserves (579) — (579)Extensions, discoveries and improved recovery less related costs 5,697 43 5,740Revisions of previous quantity estimates 621 2,122 2,743Net changes in prices, development and production costs (25,056) (11,637) (36,693)Accretion of discount 13,538 3,584 17,122Net change in income tax 10,077 2,046 12,123
Net Change for 2019 (14,235) (4,545) (18,780)
Present Value at December 31, 2019 $ 80,396 $ 20,151 $100,547Sales and transfers of oil and gas produced net of production costs (16,621) (2,322) (18,943)Development costs incurred 6,301 2,892 9,193Purchases of reserves 10,295 — 10,295Sales of reserves (803) — (803)Extensions, discoveries and improved recovery less related costs 2,066 — 2,066Revisions of previous quantity estimates (1,293) 4,033 2,740Net changes in prices, development and production costs (62,788) (22,925) (85,713)Accretion of discount 11,274 2,948 14,222Net change in income tax 19,616 5,317 24,933
Net Change for 2020 (31,953) (10,057) (42,010)
Present Value at December 31, 2020 $ 48,443 $ 10,094 $ 58,537
111
173155_Annual_Report_10-K.indd 110173155_Annual_Report_10-K.indd 110 3/5/21 6:04 PM3/5/21 6:04 PM
Supplemental Information on Oil and Gas Producing Activities - Unaudited
Table VI - Standardized Measure of Discounted Future Net Cash Flows Related to Proved Oil and Gas Reserves
The standardized measure of discounted future net cash flows is calculated in accordance with SEC and FASB requirements. This includes using the average of first-day-of-the-month oil and gas prices for the 12-month period prior to the end of the reporting period, estimated future development and production costs assuming the continuation of existing economic conditions, estimated costs for asset retirement obligations (includes costs to retire existing wells and facilities in addition to those future wells and facilities necessary to produce proved undeveloped reserves), and estimated future income taxes based on appropriate statutory tax rates. Discounted future net cash flows are calculated using 10 percent mid-period discount factors. Estimates of proved-reserve quantities are imprecise and change over time as new information becomes available. Probable and possible reserves, which may become proved in the future, are excluded from the calculations. The valuation requires assumptions as to the timing and amount of future development and production costs. The calculations are made as of December 31 each year and do not represent management’s estimate of the company’s future cash flows or value of its oil and gas reserves. In the following table, the caption “Standardized Measure Net Cash Flows” refers to the standardized measure of discounted future net cash flows.
Millions of dollars
Consolidated Companies Affiliated
Companies Total Consolidated
and Affiliated Companies U.S.
Other Americas Africa Asia
Australia/ Oceania Europe Total TCO Other
At December 31, 2020 Future cash inflows from production $ 74,671 $ 29,605 $ 27,521 $ 49,265 $ 53,241 $ 2,304 $ 236,607 $ 53,309 $ 1,070 $ 290,986 Future production costs (30,359) (15,410) (15,364) (12,784) (11,036) (1,336) (86,289) (19,525) (426) (106,240) Future development costs (10,492) (2,366) (3,017) (2,274) (3,205) (522) (21,876) (7,138) (38) (29,052) Future income taxes (5,874) (3,131) (6,197) (17,543) (11,700) (178) (44,623) (7,994) (212) (52,829)
Undiscounted future net cash flows 27,946 8,698 2,943 16,664 27,300 268 83,819 18,652 394 102,865 10 percent midyear annual discount
for timing of estimated cash flows (10,456) (4,652) (582) (7,856) (11,774) (56) (35,376) (8,803) (149) (44,328)
Standardized Measure Net Cash Flows $ 17,490 $ 4,046 $ 2,361 $ 8,808 $ 15,526 $ 212 $ 48,443 $ 9,849 $ 245 $ 58,537
At December 31, 2019 Future cash inflows from production $ 122,012 $ 45,701 $ 45,706 $ 43,386 $ 95,845 $ 4,466 $ 357,116 $ 85,179 $ 12,309 $ 454,604 Future production costs (32,349) (18,324) (17,982) (14,646) (14,141) (1,428) (98,870) (22,302) (2,487) (123,659) Future development costs (15,987) (4,219) (3,643) (5,070) (5,458) (341) (34,718) (14,340) (705) (49,763) Future income taxes (15,780) (6,491) (17,562) (11,147) (22,874) (1,078) (74,932) (14,561) (3,855) (93,348)
Undiscounted future net cash flows 57,896 16,667 6,519 12,523 53,372 1,619 148,596 33,976 5,262 187,834 10 percent midyear annual discount
for timing of estimated cash flows (26,422) (9,312) (1,629) (3,652) (26,536) (650) (68,201) (16,990) (2,096) (87,287)
Standardized Measure Net Cash Flows $ 31,474 $ 7,355 $ 4,890 $ 8,871 $ 26,836 $ 969 $ 80,395 $ 16,986 $ 3,166 $ 100,547
At December 31, 2018 Future cash inflows from production $ 132,512 $ 52,470 $ 56,856 $ 54,012 $ 109,116 $ 11,959 $ 416,925 $ 100,518 $ 16,928 $ 534,371 Future production costs (34,679) (20,691) (18,850) (17,359) (16,296) (6,609) (114,484) (24,580) (4,665) (143,729) Future development costs (17,322) (5,106) (4,112) (5,494) (7,757) (1,393) (41,184) (14,069) (1,692) (56,945) Future income taxes (17,369) (7,553) (23,593) (14,514) (25,519) (1,676) (90,224) (18,561) (4,496) (113,281)
Undiscounted future net cash flows 63,142 19,120 10,301 16,645 59,544 2,281 171,033 43,308 6,075 220,416 10 percent midyear annual discount
for timing of estimated cash flows (29,103) (11,136) (2,646) (4,822) (28,276) (419) (76,402) (22,025) (2,662) (101,089)
Standardized Measure Net Cash Flows $ 34,039 $ 7,984 $ 7,655 $ 11,823 $ 31,268 $ 1,862 $ 94,631 $ 21,283 $ 3,413 $ 119,327
Chevron Corporation 2020 Annual Report 110

Supplemental Information on Oil and Gas Producing Activities - Unaudited
Table VI - Standardized Measure of Discounted Future Net Cash Flows Related to Proved Oil and Gas Reserves
The standardized measure of discounted future net cash flows is calculated in accordance with SEC and FASB requirements.This includes using the average of first-day-of-the-month oil and gas prices for the 12-month period prior to the end of thereporting period, estimated future development and production costs assuming the continuation of existing economicconditions, estimated costs for asset retirement obligations (includes costs to retire existing wells and facilities in addition tothose future wells and facilities necessary to produce proved undeveloped reserves), and estimated future income taxes basedon appropriate statutory tax rates. Discounted future net cash flows are calculated using 10 percent mid-period discountfactors. Estimates of proved-reserve quantities are imprecise and change over time as new information becomes available.Probable and possible reserves, which may become proved in the future, are excluded from the calculations. The valuationrequires assumptions as to the timing and amount of future development and production costs. The calculations are made asof December 31 each year and do not represent management’s estimate of the company’s future cash flows or value of its oiland gas reserves. In the following table, the caption “Standardized Measure Net Cash Flows” refers to the standardizedmeasure of discounted future net cash flows.
Consolidated CompaniesAffiliated
Companies TotalConsolidated
and AffiliatedCompaniesMillions of dollars U.S.
OtherAmericas Africa Asia
Australia/Oceania Europe Total TCO Other
At December 31, 2020Future cash inflows from production $ 74,671 $ 29,605 $ 27,521 $ 49,265 $ 53,241 $ 2,304 $ 236,607 $ 53,309 $ 1,070 $ 290,986Future production costs (30,359) (15,410) (15,364) (12,784) (11,036) (1,336) (86,289) (19,525) (426) (106,240)Future development costs (10,492) (2,366) (3,017) (2,274) (3,205) (522) (21,876) (7,138) (38) (29,052)Future income taxes (5,874) (3,131) (6,197) (17,543) (11,700) (178) (44,623) (7,994) (212) (52,829)
Undiscounted future net cash flows 27,946 8,698 2,943 16,664 27,300 268 83,819 18,652 394 102,86510 percent midyear annual discount
for timing of estimated cash flows (10,456) (4,652) (582) (7,856) (11,774) (56) (35,376) (8,803) (149) (44,328)
Standardized MeasureNet Cash Flows $ 17,490 $ 4,046 $ 2,361 $ 8,808 $ 15,526 $ 212 $ 48,443 $ 9,849 $ 245 $ 58,537
At December 31, 2019Future cash inflows from production $ 122,012 $ 45,701 $ 45,706 $ 43,386 $ 95,845 $ 4,466 $ 357,116 $ 85,179 $ 12,309 $ 454,604Future production costs (32,349) (18,324) (17,982) (14,646) (14,141) (1,428) (98,870) (22,302) (2,487) (123,659)Future development costs (15,987) (4,219) (3,643) (5,070) (5,458) (341) (34,718) (14,340) (705) (49,763)Future income taxes (15,780) (6,491) (17,562) (11,147) (22,874) (1,078) (74,932) (14,561) (3,855) (93,348)
Undiscounted future net cash flows 57,896 16,667 6,519 12,523 53,372 1,619 148,596 33,976 5,262 187,83410 percent midyear annual discount
for timing of estimated cash flows (26,422) (9,312) (1,629) (3,652) (26,536) (650) (68,201) (16,990) (2,096) (87,287)
Standardized MeasureNet Cash Flows $ 31,474 $ 7,355 $ 4,890 $ 8,871 $ 26,836 $ 969 $ 80,395 $ 16,986 $ 3,166 $ 100,547
At December 31, 2018Future cash inflows from production $ 132,512 $ 52,470 $ 56,856 $ 54,012 $ 109,116 $ 11,959 $ 416,925 $ 100,518 $ 16,928 $ 534,371Future production costs (34,679) (20,691) (18,850) (17,359) (16,296) (6,609) (114,484) (24,580) (4,665) (143,729)Future development costs (17,322) (5,106) (4,112) (5,494) (7,757) (1,393) (41,184) (14,069) (1,692) (56,945)Future income taxes (17,369) (7,553) (23,593) (14,514) (25,519) (1,676) (90,224) (18,561) (4,496) (113,281)
Undiscounted future net cash flows 63,142 19,120 10,301 16,645 59,544 2,281 171,033 43,308 6,075 220,41610 percent midyear annual discount
for timing of estimated cash flows (29,103) (11,136) (2,646) (4,822) (28,276) (419) (76,402) (22,025) (2,662) (101,089)
Standardized MeasureNet Cash Flows $ 34,039 $ 7,984 $ 7,655 $ 11,823 $ 31,268 $ 1,862 $ 94,631 $ 21,283 $ 3,413 $ 119,327
110 111
173155_Annual_Report_10-K.indd 111173155_Annual_Report_10-K.indd 111 3/5/21 6:04 PM3/5/21 6:04 PM
Supplemental Information on Oil and Gas Producing Activities - Unaudited
Table VII - Changes in the Standardized Measure of Discounted Future Net Cash Flows From Proved Reserves
The changes in present values between years, which can be significant, reflect changes in estimated proved-reserve quantities and prices and assumptions used in forecasting production volumes and costs. Changes in the timing of production are included with “Revisions of previous quantity estimates.”
Total Consolidated and Affiliated Companies Millions of dollars Consolidated Companies Affiliated Companies
Present Value at January 1, 2018 $ 65,847 $ 14,166 $ 80,013 Sales and transfers of oil and gas produced net of production costs (33,535) (6,813) (40,348) Development costs incurred 9,723 5,044 14,767 Purchases of reserves 99 — 99 Sales of reserves (622) — (622) Extensions, discoveries and improved recovery less related costs 5,503 14 5,517 Revisions of previous quantity estimates 15,480 (2,255) 13,225 Net changes in prices, development and production costs 39,241 17,251 56,492 Accretion of discount 9,413 2,084 11,497 Net change in income tax (16,518) (4,795) (21,313)
Net Change for 2018 28,784 10,530 39,314
Present Value at December 31, 2018 $ 94,631 $ 24,696 $119,327 Sales and transfers of oil and gas produced net of production costs (29,436) (5,823) (35,259) Development costs incurred 10,497 5,120 15,617 Purchases of reserves 406 — 406 Sales of reserves (579) — (579) Extensions, discoveries and improved recovery less related costs 5,697 43 5,740 Revisions of previous quantity estimates 621 2,122 2,743 Net changes in prices, development and production costs (25,056) (11,637) (36,693) Accretion of discount 13,538 3,584 17,122 Net change in income tax 10,077 2,046 12,123
Net Change for 2019 (14,235) (4,545) (18,780)
Present Value at December 31, 2019 $ 80,396 $ 20,151 $100,547 Sales and transfers of oil and gas produced net of production costs (16,621) (2,322) (18,943) Development costs incurred 6,301 2,892 9,193 Purchases of reserves 10,295 — 10,295 Sales of reserves (803) — (803) Extensions, discoveries and improved recovery less related costs 2,066 — 2,066 Revisions of previous quantity estimates (1,293) 4,033 2,740 Net changes in prices, development and production costs (62,788) (22,925) (85,713) Accretion of discount 11,274 2,948 14,222 Net change in income tax 19,616 5,317 24,933
Net Change for 2020 (31,953) (10,057) (42,010)
Present Value at December 31, 2020 $ 48,443 $ 10,094 $ 58,537
Chevron Corporation 2020 Annual Report 111
1149230_Annual_Report_v8.3_r2.indd 1121149230_Annual_Report_v8.3_r2.indd 112 3/18/21 7:07 PM3/18/21 7:07 PM
glossary of energy and financial terms energy terms Additives Specialty chemicals incorporated into fuels and lubricants that enhance the performance of the fnished products.
Barrels of oil-equivalent (BOE) A unit of measure to quantify crude oil, natural gas liquids and natural gas amounts using the same basis. Natural gas volumes are converted to barrels on the basis of energy content. See oil-equivalent gas and production.
Condensate Hydrocarbons that are in a gaseous state at reservoir conditions, but condense into liquid as they travel up the wellbore and reach surface conditions.
Development Drilling, construction and related activities following discovery that are necessary to begin production and transportation of crude oil and natural gas.
Enhanced recovery Techniques used to increase or prolong production from crude oil and natural gas reservoirs.
Entitlement efects The impact on Chevron’s share of net production and net proved reserves due to changes in crude oil and natural gas prices and spending levels between periods. Under production-sharing contracts (PSCs) and variable-royalty provisions of certain agreements, price and spending variability can increase or decrease royalty burdens and/or volumes attributable to the company. For example, at higher prices, fewer volumes are required for Chevron to recover its costs under certain PSCs. Also under certain PSCs, Chevron’s share of future proft oil and/or gas is reduced once specifed contractual thresholds are met, such as a cumulative return on investment.
Exploration Searching for crude oil and/or natural gas by utilizing geologic and topographical studies, geophysical and seismic surveys, and drilling of wells.
Gas-to-liquids (GTL) A process that converts natural gas into high-quality liquid transportation fuels and other products.
Greenhouse gases Gases that trap heat in Earth’s atmosphere (e.g., water vapor, ozone, carbon dioxide, methane, nitrous oxide, hydrofuorocarbons, perfuorocarbons and sulfur hexafuoride).
Integrated energy company A company engaged in all aspects of the energy industry, including exploring for and producing crude oil and natural gas; refning, marketing and transporting crude oil, natural gas and refned products; manufacturing and distributing petrochemicals; and generating power.
Liquefed natural gas (LNG) Natural gas that is liquefed under extremely cold temperatures to facilitate storage or transportation in specially designed vessels.
Natural gas liquids (NGLs) Separated from natural gas, these include ethane, propane, butane and natural gasoline.
Oil-equivalent gas (OEG) The volume of natural gas needed to generate the equivalent amount of heat as a barrel of crude oil. Approximately 6,000 cubic feet of natural gas is equivalent to one barrel of crude oil.
Oil sands Naturally occurring mixture of bitumen (a heavy, viscous form of crude oil), water, sand and clay. Using hydroprocessing technology, bitumen can be refned to yield synthetic oil.
Petrochemicals Compounds derived from petroleum. These include aromatics, which are used to make plastics, adhesives, synthetic fbers and
household detergents; and olefns, which are used to make packaging, plastic pipes, tires, batteries, household detergents and synthetic motor oils.
Production Total production refers to all the crude oil (including synthetic oil), NGLs and natural gas produced from a property. Net production is the company’s share of total production after deducting both royalties paid to landowners and a government’s agreed-upon share of production under a PSC. Liquids production refers to crude oil, condensate, NGLs and synthetic oil volumes. Oil-equivalent production is the sum of the barrels of liquids and the oil-equivalent barrels of natural gas produced. See barrels of oil-equivalent and oil-equivalent gas.
Production-sharing contract (PSC) An agreement between a government and a contractor (generally an oil and gas company) whereby production is shared between the parties in a prearranged manner. The contractor typically incurs all exploration, development and production costs, which are subsequently recoverable out of an agreed-upon share of any future PSC production, referred to as cost recovery oil and/or gas. Any remaining production, referred to as proft oil and/or gas, is shared between the parties on an agreed-upon basis as stipulated in the PSC. The government may also retain a share of PSC production as a royalty payment, and the contractor typically owes income tax on its portion of the proft oil and/or gas. The contractor’s share of PSC oil and/or gas production and reserves varies over time, as it is dependent on prices, costs and specifc PSC terms.
Reserves Crude oil and natural gas contained in underground rock formations called reservoirs and saleable hydrocarbons extracted from oil sands, shale, coalbeds and other nonrenewable natural resources that are intended to be upgraded into synthetic oil or gas. Net proved reserves are the estimated quantities that geoscience and engineering data demonstrate with reasonable certainty to be economically producible in the future from known reservoirs under existing economic conditions, operating methods and government regulations and exclude royalties and interests owned by others. Estimates change as additional information becomes available. Oil-equivalent reserves are the sum of the liquids reserves and the oil-equivalent gas reserves. See barrels of oil-equivalent and oil-equivalent gas. The company discloses only net proved reserves in its flings with the U.S. Securities and Exchange Commission. Investors should refer to proved reserves disclosures in Chevron’s Annual Report on Form 10-K for the year ended December 31, 2020.
Resources Estimated quantities of oil and gas resources are recorded under Chevron’s 6P system, which is modeled after the Society of Petroleum Engineers’ Petroleum Resource Management System, and include quantities classifed as proved, probable and possible reserves, plus those that remain contingent on commerciality. Unrisked resources, unrisked resource base and similar terms represent the arithmetic sum of the amounts recorded under each of these classifcations. Recoverable resources, potentially recoverable volumes and similar terms represent estimated remaining quantities that are expected to be ultimately recoverable and produced in the future, adjusted to refect the relative uncertainty represented by the various classifcations. These estimates may change signifcantly as development work provides additional information. At times,
original oil in place and similar terms are used to describe total hydrocarbons contained in a reservoir without regard to the likelihood of their being produced. All of these measures are considered by management in making capital investment and operating decisions and may provide some indication to stockholders of the resource potential of oil and gas properties in which the company has an interest.
Shale gas Natural gas produced from shale rock formations where the gas was sourced from within the shale itself. Shale is very fne-grained rock, characterized by low porosity and extremely low permeability. Production of shale gas normally requires formation stimulation such as the use of hydraulic fracturing (pumping a fuid-sand mixture into the formation under high pressure) to help produce the gas.
Synthetic oil A marketable and transportable hydrocarbon liquid, resembling crude oil, that is produced by upgrading highly viscous or solid hydrocarbons, such as extra-heavy crude oil and oil sands.
Tight oil Liquid hydrocarbons produced from shale (also referred to as shale oil) and other rock formations with extremely low permeability. As with shale gas, production from tight oil reservoirs normally requires formation stimulation such as hydraulic fracturing.
fnancial terms Cash flow from operating activities Cash generated from the company’s businesses; an indicator of a company’s ability to fund capital programs and stockholder distributions. Excludes cash flows related to the company’s financing and investing activities.
Debt ratio Total debt, including finance lease obligations, divided by total debt plus Chevron Corporation stockholders’ equity.
Earnings Net income attributable to Chevron Corporation as presented on the Consolidated Statement of Income.
Free cash flow The cash provided by operating activities less cash capital expenditures.
Margin The difference between the cost of purchasing, producing and/or marketing a product and its sales price.
Net debt ratio Total debt less the sum of cash and cash equivalents, time deposits and marketable securities as a percentage of total debt less the sum of cash and cash equivalents, time deposits and marketable securities plus Chevron Corporation’s total stockholder’s equity.
Return on capital employed (ROCE) Ratio calculated by dividing earnings (adjusted for after-tax interest expense and noncontrolling interests) by the average of total debt, noncontrolling interests and Chevron Corporation stockholders’ equity for the year.
Return on stockholders’ equity (ROSE) Ratio calculated by dividing earnings by average Chevron Corporation stockholders’ equity. Average Chevron Corporation stockholders’ equity is computed by averaging the sum of the beginning-of-year and end-of-year balances.
Total stockholder return (TSR) The return to stockholders as measured by stock price appreciation and reinvested dividends for a period of time.
Chevron Corporation 2020 Annual Report 112

1149230_Annual_Report_v8.3_r1.indd 1131149230_Annual_Report_v8.3_r1.indd 113 3/12/21 2:54 PM3/12/21 2:54 PM
-
-
stockholder and investor information Stock exchange listing Chevron common stock is listed on the New York Stock Exchange. The symbol is “CVX.”
Stockholder information As of February 10, 2021, stockholders of record numbered approximately 114,000.
For questions about stock ownership, changes of address and dividend reinvestment programs, please contact Chevron’s Stock Transfer Agent:
Computershare P.O. Box 505000 Louisville, KY 40233-5000 800 368 8357 (U.S. and Canada) 201 680 6578 (outside the U.S. and Canada) www.computershare.com/investor
Overnight correspondence should be sent to:
Computershare 462 South 4th Street Suite 1600 Louisville, KY 40202
The Computershare Investment Plan is a direct stock purchase and dividend reinvestment plan.
Dividend payment dates Quarterly dividends on common stock are paid, generally, following declaration by the Board of Directors, on or about the 10th day of March, June, September and December. Direct deposit of dividends is available to stockholders. For information, contact Computershare. (See Stockholder information.)
Annual meeting The Annual Meeting of Stockholders will be held online via live audio webcast at 8 a.m. PDT, Wednesday, May 26, 2021. www.virtualshareholdermeeting.com/CVX2021
Electronic access In an effort to conserve natural resources and reduce the cost of printing and mailing proxy materials, we encourage stockholders to register to receive these documents by email and vote their shares on the Internet. Stockholders of record may sign up for electronic access (and beneficial stockholders may be able to request electronic access by contacting their broker or bank or Broadridge Financial Solutions) on this website: www.icsdelivery.com/cvx/. Enrollment is revocable until each year’s Annual Meeting record date.
Investor information Securities analysts, portfolio managers and representatives of fnancial institutions may contact:
Investor Relations Chevron Corporation 6001 Bollinger Canyon Road San Ramon, CA 94583-2324 925 842 5690 Email: [email protected]
Notice As used in this report, the term
“Chevron” and such terms as “the company,” “the corporation,” “our,”
“we,” “us” and “its” may refer to one or more of Chevron’s consolidated subsidiaries or to all of them taken as a whole. All of these terms are used for convenience only and are not intended as a precise description of any of the separate companies, each of which manages its own afairs.
Corporate headquarters 6001 Bollinger Canyon Road San Ramon, CA 94583-2324 925 842 1000
assisting local communities during the COVID 19 crisis Chevron has a history of supporting communities during crises. This pandemic is no different. To date, we have contributed more than $30 million to COVID 19 humanitarian relief efforts in 17 countries to support medical needs, essential workers, food banks, education, small businesses and more. In the Riau province of Indonesia, we delivered over 50 patient beds.
Chevron Corporation 2020 Annual Report 113

Publications and other news sourcesThe Annual Report, distributed in April, summarizes the company’s financial performance in the preced ing year and provides an overview of the company’s major activities.
Chevron’s Annual Report on Form 10-K filed with the U.S. Securities and Exchange Commission and the Supplement to the Annual Report, containing additional financial and operating data, are available on the company’s website, www.chevron.com, or copies may be requested by contacting: Investor Relations
Chevron Corporation 6001 Bollinger Canyon Road, A3140 San Ramon, CA 94583-2324 925 842 5690 Email: [email protected]
The 2020 Sustainability Report will be available in May on the company’s website, www.chevron.com/sustainability, where a guide to Chevron’s sustainability efforts and approach to our environment, social and governance (ESG) priorities can be found.
Highlights include: the innovative and responsible actions Chevron is taking to advance environmental performance; our investment in people and partnership; and our commitment to delivering results the right and responsible way, with safety and health as operating priorities.
Printed copies may be requested by writing to: Corporate Affairs: Corporate
Sustainability Communications Chevron Corporation 6001 Bollinger Canyon Road Building G San Ramon, CA 94583-2324
Details of the company’s political contributions for 2020 are available on the company’s website, www.chevron.com, or by writing to: Corporate Affairs
Chevron Corporation 6001 Bollinger Canyon Road Building G San Ramon, CA 94583-2324
For additional information about the company and the energy industry, visit Chevron’s website, www.chevron.com. It includes articles, news releases, speeches, quarterly earnings information, the Proxy Statement and the complete text of this Annual Report.
This Annual Report contains forward-looking statements – identified by words such as “believe,” “expect,” “may,” “will,” “commit,” “position,” “focus,” “goal,” “target,” “schedule,” “plan,” “opportunity,” “strategy,” “project,” “forecast,” “on track” and similar phrases – that reflect management’s current estimates and beliefs, but are not guarantees of future results.
Please see “Cautionary Statements Relevant to Forward-Looking Information for the Purpose of ‘Safe Harbor’ Provisions of the Private Securities Litigation Reform Act of 1995” on page 30 for a discussion of some of the factors that could cause actual results to differ materially.
PRODUCED BY Corporate Affairs and Controller’s Departments, Chevron Corporation DESIGN Bluehouse, Chevron Corporation PRINTING Advantage ColorGraphics – Anaheim, California
www.chevron.com/annualreport2020
connect with us
COVID‑19 responseChevron has a robust infrastructure to deal with emergencies – from earthquakes and wildfires to hurricanes, typhoons and other extreme weather. We also have become adept at managing epidemics, like SARS-1, Ebola and AIDS. These experiences remain in our corporate DNA as a foundation for emergency planning.
After China first reported COVID-19 cases in January 2020, we quickly mustered an enterprisewide response. Data-focused analysis of the virus’s potential global reach prompted Chevron’s leadership to activate our Corporate Pandemic Response Team – weeks before the World Health Organization declared a pandemic, to protect our workers, communities and operations.
Learn more at www.chevron.com/covid‑19

Chevron Corporation6001 Bollinger Canyon Road, San Ramon, CA 94583-2324 USA
www.chevron.com
© 2021 Chevron Corporation. All rights reserved.
100% Recyclable
912-0985
1149230_Annual_Report_v8.3_r2.indd 55-159 3/18/21 6:41 PM
