Chicago: Snapshot of Po verty , Income, and Health Insurance Coverage 33 West Grand Avenue, Suite 500 | Chicago, Illinois 60654 | 312.870.4949 | research@heartlan dalliance.org The newly released data from the U.S. Census Bureau’s Ame rican Community Survey pro- vide a glimpse of the ongoing impacts of the Great Recession for millions of individuals and families. This snapshot of your community’s data includes a comparison of 2010 data to 2009 and 1999, illustrating trends over time. Fact sheets for additional geographies are available at http://www .heartlandalli ance.org/research /current-and-local -data/local-fac t-sheets.html. The effects of the Great Recession on unemployment, poverty , and income are still being felt by millions ofindividuals and families, and the eroding safety net means that while there are more people in need, there are fewer resources to help them. Preserving, extending, and strengthening these solutions can help keep more people from falling into poverty and help those struggling to meet their basic needs: •Fundsaf etyne tandbenei tp rograms such as SNAP (food stamps), TANF , Medicaid, and the Earned Income Tax Credit, which help poor and nea r-poor individuals and families bridge the gap between low incomes and meeting their most basic needs. These programs not only help reduce poverty , but also generate additional economic activity in local communities. •Continue Unemployment Insurance for those seeking employment, which will help protect people who are out of work and keep families out of poverty . •Invest in subsidized and transitional employment programs to help disadvantaged workers and struggling businesses weather the stalled economy and create jobs that will put people back to work and that pay living wages. 2010 data from the U.S. Census Bureau’s American Community Survey Social IMPACT Research Center, a program of Heartland Alliance September 22, 2011 (version 1) poverty overview Poverty Rate in 2010: 22.5% •The poverty rate rose from 21.6% in 2009, which is notastatisticallysigniicantchange. •The poverty rate rose from 19.6% in 1999, which is astatisticallysigniicantchange. Number in Poverty in 2010: 596,975 •The number of people in poverty declined from 603,218 in 2009, which is not a statistically signiicantchange. •The number of people in poverty rose from 556,791in1999,whichisastatisticallysigniicantchange. 0 5 10 15 20 25 0 5 10 15 20 25 Chicago Poverty Rates Over Time 1999 2007 2008 2009 2010
33 West Grand Avenue, Sui te 500 | Chicago, I l l inois 60654 | 312.870.4949 | research@heart lan dal l iance.org
The newly released data from the U.S. Census Bureau’s American Community Survey pro-
vide a glimpse of the ongoing impacts of the Great Recession for millions of individuals
and families. This snapshot of your community’s data includes a comparison of 2010 data
to 2009 and 1999, illustrating trends over time. Fact sheets for additional geographies are
available at http://www.heartlandalliance.org/research/current-and-local-data/local-fact-sheets.html.
The effects of the Great Recession on unemployment, poverty, and income are still being felt by millions of
individuals and families, and the eroding safety net means that while there are more people in need, there arefewer resources to help them. Preserving, extending, and strengthening these solutions can help keep morepeople from falling into poverty and help those struggling to meet their basic needs:
• Fundsafetynetandbeneitprograms such as SNAP (food stamps), TANF, Medicaid, and the EarnedIncome Tax Credit, which help poor and near-poor individuals and families bridge the gap between lowincomes and meeting their most basic needs. These programs not only help reduce poverty, but alsogenerate additional economic activity in local communities.
• Continue Unemployment Insurance for those seeking employment, which will help protect people whoare out of work and keep families out of poverty.
• Invest in subsidized and transitional employment programs to help disadvantaged workers andstruggling businesses weather the stalled economy and create jobs that will put people back to work andthat pay living wages.
2010 data from the U.S. Census Bureau’s American Community Survey
Social IMPACT Research Center, a program of Heartland Alliance
September 22, 2011 (version 1)
poverty
overview
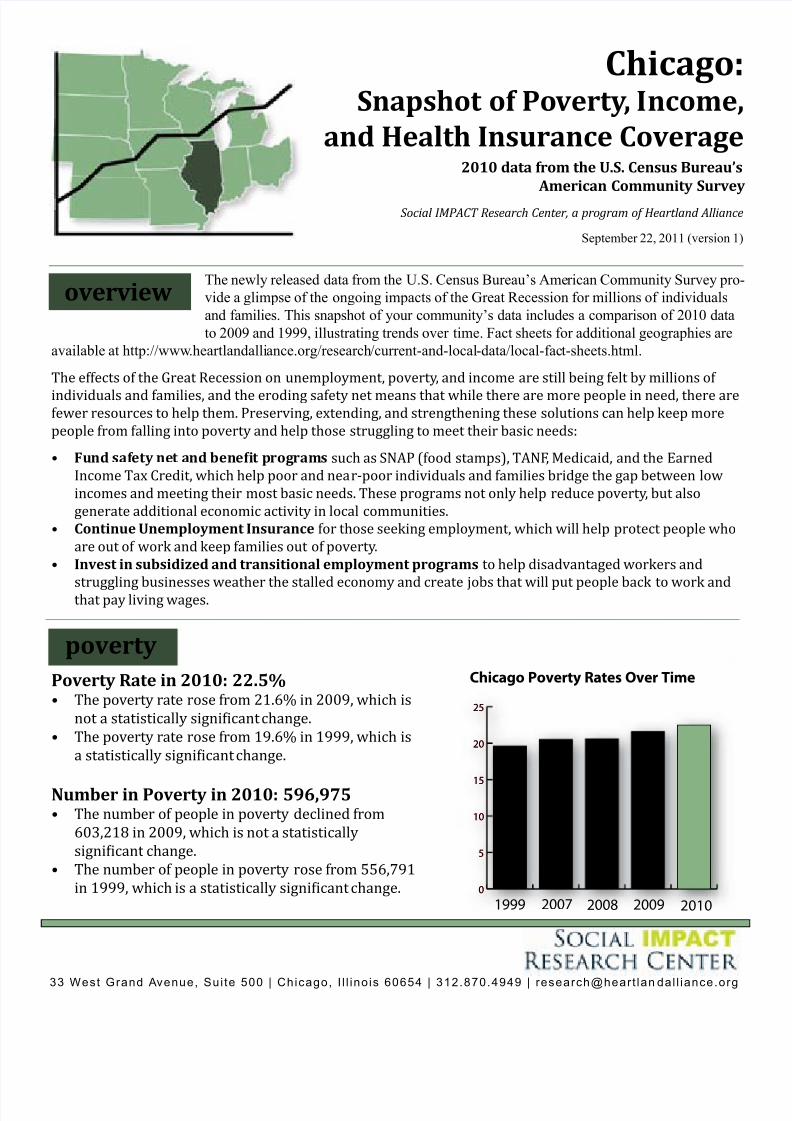
Poverty Rate in 2010: 22.5%• The poverty rate rose from 21.6% in 2009, which isnotastatisticallysigniicant change.
• The poverty rate rose from 19.6% in 1999, which isastatisticallysigniicant change.
Number in Poverty in 2010: 596,975• The number of people in poverty declined from
603,218 in 2009, which is not a statisticallysigniicant change.
• The number of people in poverty rose from 556,791 in1999,whichisastatisticallysigniicant change. 0
65 years old; sum of uninsured, privately, and publicly insured percents do not addup to 100 because for certain populations it is possible have both public and privatecoverage.
3 of 4
Uninsured Rate in 2010: 22.8%• The uninsured rate rose from 21.6% in
2009,whichisastatisticallysigniicant change.
Number of Uninsured in 2010:548,077• The number of people without health
insurance declined from 549,354 in 2009,whichisnotastatisticallysigniicant
change.
Type of Insurance in 2010:• 52.9% are covered by private insurance.• 26.2% are covered by public insurance.• 22.8% are uninsured.
Number with Low Incomes in 2010: 588,104• The number of people with low incomes declined from 608,140 in 2009, which is not a statisticallysigniicant change.
• The number of people with low incomes rose from 570,901 in 1999, which is not a statisticallysigniicant change.
In 2010, a family of three wasconsidered low income if their annual
that it takes a family of 3 (adult, preschooler, school age child)$55,273 to make ends meet in Chicago.
All data are derived from the U.S. Census Bureau’s American Community Survey and from the 2000 Decennial Census. The AmericanCommunity Survey recently released estimates on 2010 income, poverty, and health insurance coverage, which are the most current data
available for geographies with populations over 65,000. For more information on the American Community Survey, visit www.census.gov/acs/www/. Statistical signicance refers to the probability that the observed changes are “true” rather than the result of an error in sampling or
estimation. Data included here are statistically signicant at the 90th percentile. FormoreinformationontheIllinoisSelf-SuficiencyStandard,
The Social IMPACT Research Center (IMPACT) is a nonprofit organization that investigates today’s most pressing social issues and solutions
to inform and equip those working toward a just global society. IMPACT, a program of Heartland Alliance for Human Needs & Human Rights,
provides research, policy analysis, consulting, technical assistance, communications, and coalition building to projects in Illinois, the Midwest,
and nationally. Visit www.heartlandalliance.org/research to learn more.4 of 4
Median Earnings for Female Full-TimeYear-Round Workers in 2010: $41,130• Women’s earnings rose by 2.8% from $40,002 in2009,whichisastatisticallysigniicant change.
• Women’s earnings rose by 2.9% from $39,958 in1999,whichisastatisticallysigniicant change.
Median Earnings for Male Full-Time Year-Round Workers in 2010: $45,752• Men’s earnings rose by 1.2% from $45,189 in2009,whichisnotastatisticallysigniicant
change.• Men’s earnings declined by 2.6% from $46,986 in1999,whichisnotastatisticallysigniicant
change.
In 2010, women earned $0.90 for every$1.00 earned by men.