A sluggish first half of the year gave way to healthy demand in the second half, resulting in a decrease in vacancy for the Chicago CBD during 2012 and signs of progress leading into the new year. Statistically speaking, the recovery appears to be at its mid-point. However, economic instability, political gridlock and the looming fiscal policy changes continue to hinder the pace of recovery. Tenants remain cautious as they evaluate what the current political climate means for their businesses and most are hesitant to make any drastic long-term changes as it relates to their real estate use unless it means they can yield cost savings by doing so. Most tenants, with certain exceptions such as the technology industry, are seeking ways to reduce their footprint and increase density as part of their lease negotiations. A more cautious approach by tenants has resulted in a lengthier timeframe to effectuate lease transactions. The uncertainty felt by tenants as it relates to macro-economic conditions has resulted in a perception that the market is still very soft and laden with infinite savings opportunities. Although there are still deals to be had in the market, landlords in some improving sectors are becoming more bullish as they anticipate a full recovery on the horizon, creating a disconnect between landlord and tenant perception about the near-term future. Some landlords have begun to hold firm on rental rates and push back on concession packages. Additionally, frustration over credit issues with tenants has made landlords more selective when it comes to which deals they will aggressively pursue. Signs of Life Vacancy Rate by Submarket YEAR-END 2011 YEAR-END 2012 CENTRAL LOOP 14.6% 14.2% EAST LOOP 15.6% 16.0% NORTH MICHIGAN 14.6% 14.7% RIVER NORTH 14.3% 12.7% WEST LOOP 14.4% 13.5% MARKET INDICATORS Overall Chicago CBD YEAR-END 2011 YEAR-END 2012 VACANCY RATE 14.7% 14.2% ABSORPTION (SF) 1,180,489 725,142 RENTS $31.39 $31.90 INVENTORY 144,016,736 144,016,736 COLLIERS INTERNATIONAL | P. 1 CHICAGO END-OF-YEAR 2012 | DOWNTOWN OFFICE OFFICE MARKET OVERVIEW
Transcript
A sluggish fi rst half of the year gave way to healthy demand in the second half, resulting in a decrease in vacancy for the Chicago CBD during 2012 and signs of progress leading into the new year.Statistically speaking, the recovery appears to be at its mid-point. However, economic instability, political gridlock and the looming fi scal policy changes continue to hinder the pace of recovery. Tenants remain cautious as they evaluate what the current political climate means for their businesses and most are hesitant to make any drastic long-term changes as it relates to their real estate use unless it means they can yield cost savings by doing so. Most tenants, with certain exceptions such as the technology industry, are seeking ways to reduce their footprint and increase density as part of their lease negotiations. A more cautious approach by tenants has resulted in a lengthier timeframe to eff ectuate lease transactions.
The uncertainty felt by tenants as it relates to macro-economic conditions has resulted in a perception that the market is still very soft and laden with infi nite savings opportunities. Although there are still deals to be had in the market, landlords in some improving sectors are becoming more bullish as they anticipate a full recovery on the horizon, creating a disconnect between landlord and tenant perception about the near-term future. Some landlords have begun to hold fi rm on rental rates and push back on concession packages. Additionally, frustration over credit issues with tenants has made landlords more selective when it comes to which deals they will aggressively pursue.
Signs of Life
Vacancy Rate by Submarket
YEAR-END 2011
YEAR-END 2012
central loop 14.6% 14.2%
east loop 15.6% 16.0%
north Michigan 14.6% 14.7%
river north 14.3% 12.7%
west loop 14.4% 13.5%
Market indicatorsOverall Chicago CBD
YEAR-END 2011
YEAR-END 2012
vacancy rate 14.7% 14.2%
absorption (sf) 1,180,489 725,142
rents $31.39 $31.90
inventory 144,016,736 144,016,736
research report | year-end 2012 | downtown chicago | office
colliers international | p. 1
chicago
END-OF-YEAR 2012 | DOWNTOWN OFFICE
OFFICE MARKET OVERVIEW
technology sector leads the way to recoverySeveral factors continue to bolster the CBD’s recovery. Chicago’s thriving technology sector has served as a source of positive demand, helping to offset some of the space contractions experienced across the wider market. Several technology-based companies completed leases within the CBD during 2012. The largest transaction of the year was Google’s commitment to relocate 3,000 employees from suburban Libertyville into 572,000 square feet at the Merchandise Mart.
The Google lease transaction is also representative of another trend that has benefited the CBD. Several suburban-based corporations have made commitments to relocate their offices into the CBD. This trend is in response to a desire to recruit from a more extensive labor pool as well as the recognition of employee preference to work in an urban setting that offers greater ease in commuting and a work-life balance. The future migration of these companies into the CBD will help create positive absorption upon occupancy. Recent lease signings with companies such as Hillshire Brands, Maximus, Capital One and Presence Health are all examples of this trend which is likely to continue as long as pricing in the CBD remains competitive.
looking aheadThe CBD will continue to benefit from a lack of new inventory over the next three years. Although potential exists for a new development to officially break ground during the coming year, delivery will not occur until 2016 at the earliest, allowing for quicker absorption of the existing available space in the market. The direction the market will take in the year ahead is largely dependent upon job creation and continued growth in tenant confidence. Contingent upon these factors, it is anticipated that 2013 will result in moderate improvement with stronger market conditions starting to emerge in areas of the market that have yet to experience more pronounced signs of recovery.
research report | year-end 2012 | downtown chicago | office
colliers international | p. 2
vacancy and absorptionFollowing a flat first half of the year, positive absorption during the second half of 2012 resulted in a vacancy decrease to 14.2 percent, down from 14.5 percent at year-end 2011. Both Class A and B space ended the year with 14.1 percent vacancy. Class B space experienced the largest improvement in vacancy during the year with a 0.7 percent reduction while Class A space posted a 0.3 percent reduction.
Direct vacancy declined from 13.5 percent one year ago to the current rate of 13.1 percent. Although showing improvement from this market cycle’s peak rate of 14.2 percent as posted in early-2010, there still is ground to be made up before returning to the 10 percent average rates experienced prior to the financial crisis. Sublease vacancy has remained fairly stagnant throughout most of 2012, ending the year at 1.0 percent, down just slightly from 1.1 percent one year prior. Sublease vacancy has fallen by 100 percent since the start of the financial crisis, a result of burn-off from lease expirations as well as tenants slowing the pace at which they are shedding excess space.
The first half of 2012 was uneventful with only 18,461 square feet of net absorption in the two quarters combined. However, the third and fourth quarter of the year resulted in a combined 706,681 square feet of net absorption, bolstering the annual total to positive 725,142 square feet. Although the absorption experienced during the year is less than the 1,180,498 square feet experienced in 2011, it still is a positive sign that the market is beginning to improve. All three building classes posted positive absorption for the year. Class A space ended the year at positive 186,525 square feet while Class B space posted positive 422,539 square feet of net absorption.
net absorption & vacancy central business district
Squa
re F
oota
ge Vacancy
Source: Costar; Colliers International Research
Source: Costar; Colliers International Research Class B Class C AverageClass A
Central Loop East Loop North Michigan Ave. River North West Loop
Submarket Vacancy Rates2010 - 2012 (YTD)
Squa
re F
eet
Number of Transactions
25
13
12
2
5
18
13
16
4
9
0
500,000
1,000,000
1,500,000
2,000,000
2,500,000
3,000,000
West Loop East Loop Central Loop North Michigan River North
Large Lease Activity by Submarket: 2011 vs. 2012-
Squa
re F
eet
Number of Transactions
57
0
1,000,000
2,000,000
3,000,000
4,000,000
5,000,000
6,000,000
7,000,000
2011
60
2012
Total CBD: 2011 vs. 2012
research report | year-end 2012 | downtown chicago | office
colliers international | p. 3
lease activityThe fourth quarter of the year was active with three transactions greater than 100,000 square feet completed. The largest was Citadel’s renewal and contraction at 131 S. Dearborn Street in the Central Loop. The bank will be reducing its footprint at the property by over 30 percent to 222,400 square feet as part of a long-term lease extension. The second largest transaction of the quarter also occurred in the Central Loop. Grant Thornton agreed to relocate its office space 161 N. Clark Street and will backfill space vacated by Chicago Title & Trust. The company will be leasing 137,000 square feet starting in 2015. Additionally, Huron Consulting renewed and expanded its space at 550 W. Van Buren Street in the West Loop. The company will now occupy 129,000 square feet at the building.
Leasing volume as it relates to transactions greater than 40,000 square feet improved slightly during the year. In 2012, a total of 60 large transactions were closed in the CBD totaling 5.7 million square feet. In comparison, at year-end 2011, 57 such transactions were completed totaling a cumulative 5.5 million square feet. During 2011, as the recovery was just starting to get underway, 44 percent of the large lease transactions were completed in the West Loop. These transactions totaled 2.5 million square feet. However, in 2012, only 30 percent of the transactions were completed in the West Loop, totaling 1.6 million square feet, a sign that landlords in other submarkets are now starting to participate in the recovery.
Central Loop East Loop North Michigan Ave. River North West Loop
Submarket Vacancy Rates2010 - 2012 (YTD)
Squa
re F
eet
Number of Transactions
25
13
12
2
5
18
13
16
4
9
0
500,000
1,000,000
1,500,000
2,000,000
2,500,000
3,000,000
West Loop East Loop Central Loop North Michigan River North
Large Lease Activity by Submarket: 2011 vs. 2012-
Squa
re F
eet
Number of Transactions
57
0
1,000,000
2,000,000
3,000,000
4,000,000
5,000,000
6,000,000
7,000,000
2011
60
2012
Total CBD: 2011 vs. 2012large lease activity 2011 vs 2012
total cbd by subMarket
131 south dearborn streetresearch report | year-end 2012 | downtown chicago | office
colliers international | p. 4
chicago cbd significant leasing transactions of 2012
tenant address class submarket size (sf) deal type Quarter
hillshire Brands 400 S. Jefferson C West Loop 235,000 New Lease 1stFoley & Lardner 321 N. Clark A River North 169,000 Renewal/Contraction 1stLatham & Watkins 330 N. Wabash A River North 137,000 New Lease 1sttrading technologies 222 S. Riverside B West Loop 108,000 Renewal 1stttX company 101 N. Wacker B West Loop 103,400 Renewal 1stU.s. securities & exchange commission 175 W. Jackson A Central Loop 102,600 Renewal 1stchildren's Memorial hospital 680 N. Lake Shore B North Michigan Ave. 95,500 Sublease 1stchicago title & trust 10 S. LaSalle B Central Loop 86,000 New Lease 1stDotomi 101 N. Wacker B West Loop 80,000 New Lease/Expansion 1stMedicus International 222 Merchandise Mart B River North 70,000 Renewal 1stschawk 1 N. Dearborn B Central Loop 68,000 Renewal 1strazorfish 222 Merchandise Mart B River North 65,000 New Lease/Expansion 1stGrubhub 111 W. Washington B Central Loop 59,400 New Lease 1stBurke, Warren, MacKay & serritella 330 N. Wabash A River North 54,800 Renewal/Expansion 1stLevenfield pearlstein 2 N. LaSalle B Central Loop 53,000 Renewal 1stchicago entrepreneurial center (1871) 222 Merchandise Mart B River North 50,000 New Lease 1stsalesforce.com 111 W. Illinois A River North 116,700 New Lease 2ndtribeca Flashpoint Media arts academy 111 W. Washington B Central Loop 104,000 Renewal/Expansion 2ndperkins coie 131 S. Dearborn A Central Loop 101,300 Renewal/Expansion 2ndU.s. secret service 525 W. Van Buren A West Loop 76,200 Renewal 2ndharris & harris 111 W. Jackson B Central Loop 75,000 New Lease 2ndNWU Feinberg school of Medicine 633 N. St. Clair A North Michigan Ave. 61,700 New Lease 2ndaecoM technology corporation 303 E. Wacker B East Loop 58,400 Renewal/Contraction 2ndGroupon 303 E. Wacker B East Loop 52,553 Renewal/Contraction 2ndGoogle (Motorola Mobility) 222 Merchandise Mart B River North 572,000 New Lease 3rdaoN corporation 200 E. Randolph A East Loop 386,000 Renewal 3rdUnited continental holdings 233 S. Wacker A West Loop 205,000 Expansion 3rdDraftFcB 875 N. Michigan A North Michigan Ave. 167,000 New Lease 3rdGreenberg traurig 77 W. Wacker A Central Loop 112,300 Renewal 3rdGrosvenor capital Management 900 N. Michigan A North Michigan Ave. 96,000 Renewal & Expansion 3rdGuggenheim partners 227 W. Monroe A West Loop 80,000 Renewal/Expansion 3rdcramer-Krasselt 225 N. Michigan B East Loop 75,700 Renewal 3rdaIG 500 W. Madison A West Loop 74,000 New Lease 3rdWalgreens ecommerce 33 S. State B East Loop 68,000 Expansion 3rdGsa - army corp of engineers 231 S. LaSalle B Central Loop 63,600 New Lease 3rdceDa 208 S. LaSalle B Central Loop 58,000 Renewal 3rdGe transportation 500 W. Monroe A West Loop 53,900 New Lease 3rdshoppertrak 233 S. Wacker A West Loop 52,400 New Lease 3rdropes & Gray 191 N. Wacker A West Loop 51,700 Sublease 3rdenergy BBDo 225 N. Michigan A East Loop 51,000 New Lease 3rdcitadel 131 S. Dearborn A Central Loop 222,400 Renewal/Contraction 4thGrant thorton 161 N. Clark A Central Loop 137,000 New Lease 4thhuron consulting 550 W. Van Buren A West Loop 129,000 Renewal/Expansion 4thBain & company 190 S. LaSalle A Central Loop 73,000 Renewal 4thMaximus 303 E. Wacker B East Loop 68,700 New Lease 4thcapital one Financial corp 77 W. Wacker A Central Loop 65,000 Sublease 4thheitman 191 N. Wacker A West Loop 65,000 Renewal 4thtowers Watson 191 N. Wacker A West Loop 65,000 Renewal 4thoracle 233 S. Wacker A West Loop 60,000 Renewal 4thaep energy 225 W. Wacker A West Loop 51,000 Sublease 4thFiserv 350 W. Mart Center B River North 50,000 Renewal/Contraction 4th
research report | year-end 2012 | downtown chicago | office
colliers international | p. 5
large blocks of availability and tenant deMandLarge blocks of space in the CBD are defined as those containing 100,000 square feet or greater on a contiguous and direct basis.
During the fourth quarter, net large block availability decreased by two. Four blocks were removed during the quarter, the largest of which was a 165,587-square-foot block at 303 E. Wacker Drive. It was reduced in size due to Maximus leasing 68,700 square feet at the building, bringing the space below the large block threshold. Another large block removed during the quarter was the 116,964-square-foot space at 161 N. Clark Street, the result of securing Grant Thornton’s lease to relocate to the building in 2015. Added during the quarter was a 250,553-square-foot space at 540 W. Madison Street. The building, which also sold during the quarter for the highest price per square foot reported in 2012, has a large block of space available resulting from a contraction by its largest tenant, Bank of America. Additionally, a 171,470-square-foot block of space was added at 111 N. Canal Street. The building was recently purchased by Sterling Bay Companies and is undergoing a redevelopment.
large block direct availabilities (100,000+ sQuare feet)
Building class size (sf) floor submarket
515 N. state st. A 350,906 2-17 North Michigan Ave.
500 W. Monroe st. A 338,131 32-44 West Loop
435-445 N. Michigan ave. B 316,190 1-5 North Michigan Ave.
200 e. randolph st. A 306,091 67-76 East Loop
233 s. Wacker Dr. A 285,910 48-54 West Loop
130 e. randolph st. A 256,720 30-41 East Loop
540 W. Madison st. A 250,553 14-19 West Loop
225 W. randolph st. B 238,778 22-30 West Loop
101 e. erie st. A 217,569 1-20 North Michigan Ave.
410 N. Michigan ave. B 214,849 6-18 North Michigan Ave.
309-311 W. Monroe B 214,490 2-9 West Loop
401-465 e. Illinois C 210,000 4-6 North Michigan Ave.
222 N. Lasalle st. B 199,132 14-18 Central Loop
300 s. riverside plz. B 198,302 20-23 West Loop
303 e. Wacker Dr. B 182,782 15-20 East Loop
77 W. Wacker Dr. A 174,624 11-19 Central Loop
111 N. canal B 171,370 12-15 West Loop
200 N. Lasalle st. A 164,586 19-23 Central Loop
440 s. Lasalle st A 162,517 18-26 Central Loop
130 e. randolph st. A 155,829 16-22 East Loop
11 s. Lasalle st. C 146,313 1-14 Central Loop
10 s. Dearborn/21 s. clark A 139,165 26-30 Central Loop
350 W. Mart center B 138,225 3-5 River North
130 e. randolph st. A 128,948 6-8 East Loop
131 s. Dearborn A 128,622 7-8 Central Loop
233 s. Wacker Dr. A 125,553 58-60 West Loop
600 W. chicago ave. B 117,101 2 River North
227 W. Monroe st. A 117,053 6-8 West Loop
333 s. Wabash ave. B 112,000 26-30 East Loop
401 s. state st. C 110,898 4-6 East Loop
401 N. Michigan ave. A 104,990 21-25 North Michigan Ave.
15 large direct blocks of
cbd class a space
consisting of
3,104,521 square feet
5 large blocks of
west loop class a space
consisting of
1,117,200square feet
3 large blocks of
west loophigh rise
class a space consisting of
749,594square feet
research report | year-end 2012 | downtown chicago | office
colliers international | p. 6
Large block availability has increased over the past year. In 2011, the number of large blocks of space totaled 22 blocks, comprised of an aggregate 3.8 million square feet. At year-end 2012, 26 such blocks are now available totaling 5.1 million square feet. The addition of these sizeable blocks in the past year is the result of tenant contractions across the market. However, only 46 percent of the large blocks are currently vacant and available now. The balance of the spaces have future availabilities extending as far out as 2015 as a sign that many of the market’s largest tenants opted to take advantage of softened market conditions by making leasing decisions well ahead of their current expiration dates.
Large tenants are finding that the spaces available for their occupancies are dwindling when factors such as asset class, submarket desirability and view characteristics are considered. Of the 26 large blocks of available space, 15 reside within Class A buildings. When dissected further, the lack of high view, quality, well-located space becomes more apparent. Only five of those blocks reside within the highly desired West Loop submarket and of those, only three are located within the building’s high-rise.
Central Loop East Loop North Michigan Ave. River North West Loop
Submarket Vacancy Rates2010 - 2012 (YTD)
Squa
re F
eet
Number of Transactions
25
13
12
2
5
18
13
16
4
9
0
500,000
1,000,000
1,500,000
2,000,000
2,500,000
3,000,000
West Loop East Loop Central Loop North Michigan River North
Large Lease Activity by Submarket: 2011 vs. 2012-
Squa
re F
eet
Number of Transactions
57
0
1,000,000
2,000,000
3,000,000
4,000,000
5,000,000
6,000,000
7,000,000
2011
60
2012
Total CBD: 2011 vs. 2012
proposed chicago cbd office developMent sites
address developer total rba
601 W. Monroe street fifield companies 642,526
108 N. Jefferson street Jupiter realty 450,000
625 W. adams street the alter group/ white oak realty partners 494,601 or 346,849
150 N. riverside plaza o’donnell investments 1,471,223
444 W. Lake street hines/levy (joint venture) 1,100,000
301 s. Wacker Drive insite/trammell crow 1,002,807
Wolf point hines/kennedy (joint venture) 1,500,000 (east)1,800,000 (south)
130 N. Franklin street cc industries/ tishman speyer 1,000,000
645 W. Madison street hines, Mr properties (owner) 500,000
401 s. Wacker Drive dri/oaktree capital 863,000
222 W. randolph street John buck company (developer)interpark (owner)
991,805
constructionThe fourth quarter of the year ended without any new development announcements. Hines is anticipated to break ground on a new 45-story, 900,000-square-foot office tower at 444 W. Lake Street in the early part of 2013. Known as River Point, the development was originally slated for a 2011 delivery, but the project was tabled in 2009 as a result of the credit crisis when financing fell through despite substantial pre-leasing. Hines and Ivanhoe Cambridge are providing equity financing for the project and have recently entered into a letter of intent with law firm McDermott Will & Emery to be the building’s anchor tenant.
Recognizing the limited availability of quality, large blocks of space, developers are anticipating that demand is sufficient enough in this sector of the market to support the development of one or more new office towers with deliveries anticipated in the 2016-2017 timeframe. Several projects continue to garner press as developers attempt to lure large tenants.
Other projects gaining momentum include the site owned by developer John O’Donnell at 150 N. Riverside Plaza, located along the Chicago River between Lake Street and Randolph Street, and the site at 301 S. Wacker Drive which is being marketed by Trammell Crow and InSite Real Estate. Both projects are in the 1.0-million-square-foot range.
A secondary subset of new developments also exists in a more peripheral West Loop location that resides in the area between the Chicago River and the Kennedy Expressway. The Alter Group and White Oak Realty Partners are marketing a 490,000-square-foot building at 625 W. Adams Street while Fifield Companies is proposing a 640,000-square-foot tower at 601 W. Monroe Street. These developments would be on a smaller scale delivering space in the 400,000- to 600,000-square-foot range.
Responding to the economic uncertainties that still exist, large tenants remain very cautious as it relates to their real estate needs, resulting in longer than usual decision timelines as they evaluate their risk characteristics in a stay versus move outcome. Once lease commitments are secured, it is likely the Chicago CBD could see, dependent upon size, two or three new developments launched. With the market now trending towards recovery, it is expected that fundamentals will be in place to support the addition of new inventory by 2016.
New construction has not delivered to the Chicago CBD since 2010 when the vertical expansion of the Blue Cross Blue Shield Building at 300 E. Randolph Street added 933,000 square feet to inventory. The last new building additions to inventory occurred in 2009 with the deliveries of 353 N. Clark Street, 300 N. LaSalle Street and 155 N. Wacker Drive, which added a combined 3.7 million square feet to inventory.
research report | year-end 2012 | downtown chicago | office
colliers international | p. 7
asking gross face rate central business district
Squa
re F
oota
ge VacancySource: Costar; Colliers International Research
Source: Costar; Colliers International Research Class B Class C AverageClass A
725,142
1,180,498
(373,091)
(1,018,952)
382,325
3,446,345
14.2%14.7%
15.5%15.3%
11.7%11.7%
0.0%
2.0%
4.0%
6.0%
8.0%
10.0%
12.0%
14.0%
16.0%
18.0%
(1,500,000)
(1,000,000)
(500,000)
0
500,000
1,000,000
1,500,000
2,000,000
2,500,000
3,000,000
3,500,000
4,000,000
201220112010200920082007
Absorption Vacancy
$0.00
$5.00
$10.00
$15.00
$20.00
$25.00
$30.00
$35.00
$40.00
$45.00
201220112010200920082007
rents and concessions
Following six consecutive quarters of increases, the average gross asking rental rate in the Chicago CBD decreased slightly during the fourth quarter, ending the year at $31.90 per square foot, down from $31.96 per square foot in the prior quarter. During the past year, the average asking rate has increased by $0.51 from the rate posted at year-end 2011.
Class A rates increased marginally during the year, up 0.7 percent to $37.36 percent. Class B rates ended the year at $30.22 per square foot, representing a 2.2 percent increase over the average rate posted in 2011.
Although movement in CBD asking rates has been fairly modest, some well-positioned landlords with improved occupancy rates at their buildings have begun placing upward pressure on rates, thereby increasing the average slightly. A factor that is impacting the relatively slow movement of rental rates is the prevalence of historically low property taxes across the CBD. Following the credit crisis, many properties were experiencing inflated vacancies. As a result of reassessments, most have realized a substantial decrease in their property taxes. These tax savings are likely helping to offset any actual rental rate increases being imposed by landlords and are impacting the pace at which rates are really increasing. Once the market fully recovers, it can be expected that most buildings will return to more normalized property tax levels, resulting in a bump in the average gross asking rate.
Concession packages still remain fairly strong and many landlords continue to offer healthy tenant improvement and free rent packages. However, the packages being offered are not consistent across the market and vary based upon various factors such as the landlord’s ability to fund improvements, the building’s occupancy level and recent sales impacting proformas.
As the market continues its gradual recovery, it is likely more landlords will start to take a bullish stance, making future rent decreases unlikely. Tenants in the market should continue capitalizing on the still relatively low asking rates in the CBD before more substantial increases are realized.
research report | year-end 2012 | downtown chicago | office
colliers international | p. 8
capital Markets
The year ended with the strongest investment sales activity since 2007, prior to the start of the financial crisis. A total of 25 transactions consisting of 14.5 million square feet were completed during the year, representing a 31.6 percent increase above the 19 transactions totaling 11.9 million square feet reported in 2011.
During the fourth quarter alone, eight transactions were completed, the largest of which was the sale of 540 W. Madison Street. Joseph Mizrachi and David Werner purchased the 1.1-million-squarefoot property for $350 million ($314.77 per square foot), making it the largest investment sales transaction of the year. Bank of America, the prior owner and largest tenant in the building, is contracting part of its space as part of a sale-leaseback. Also during the quarter, Harbor Group International completed its purchase of 1 S. Wacker Drive from TIAA-CREF for $221 million ($184.91 per square foot).
Although the volume of transactions reported at year-end exceeded the number reported in the prior year, the average sales price per square foot in 2012 decreased to $161.86 per square foot, down from $212.33 per square foot one year ago. The reason for the decline in average sales price is largely attributable to an increase in non-core transaction volume during 2012, resulting from improved investor confidence and an emergence of value-seeking investors looking to purchase and reposition non-core assets. During 2011, 32 percent of the properties sold were Class A assets, including trophy assets that commanded a price averaging $300-$500 per square foot. These assets, which were a more stable bet in a vulnerable marketplace, inflated the average sales price. By comparison, only 12 percent of the sales transactions completed in 2012 were Class A transactions. A shift in confidence became apparent during the year with the predominantly Class B and C composition of building sales in 2012 seeming to suggest a broadened threshold for risk on the part of investors.
With occupancy rates rising in many sectors of the market and low interest rates still available, 2013 will likely serve as a continuation of the resurgence in investment sales activity that was experienced in the past year. At year-end there were six buildings already under contract and another eight being actively marketed.
Central Loop East Loop North Michigan Ave. River North West Loop
Submarket Vacancy Rates2010 - 2012 (YTD)
Squa
re F
eet
Number of Transactions
25
13
12
2
5
18
13
16
4
9
0
500,000
1,000,000
1,500,000
2,000,000
2,500,000
3,000,000
West Loop East Loop Central Loop North Michigan River North
Large Lease Activity by Submarket: 2011 vs. 2012-
Squa
re F
eet
Number of Transactions
57
0
1,000,000
2,000,000
3,000,000
4,000,000
5,000,000
6,000,000
7,000,000
2011
60
2012
Total CBD: 2011 vs. 2012
540 WEST M
ADISON STREET
research report | year-end 2012 | downtown chicago | office
colliers international | p. 9
fs = for salecl = central loop el = east loop nMa = north Michigan avenue rn = river north wl = west loop
nM = new to Market uc = under contract
chicago cbd sales activity - fourth Quarter 2012
status addresssub Mkt class size (sf) sale price price/sf seller buyer
fs 20 s. clark street cl b 363,657 tbd tbd M&J wilkow tbd
fs 540 N. Lasalle street rn c 65,140 tbd tbd Joseph lagoa tbd
fs 123 W. Madison street cl c 78,100 tbd tbd canadian imperial bank of commerce tbd
fs 300 N. Lasalle street (partial stake) rn a 1,302,901 tbd tbd kbs reit 2 -
nM 55 e Washington street (Floors 1-12) el b 506,000 tbd tbd Morgan reed group tbd
nM 208 s Lasalle street (office & retail portions) cl b 355,411 tbd tbd prime group tbd
nM 225 W. Wacker Drive wl a 650,812 tbd tbd J.p. Morgan chase & co. tbd
nM 73 W. Monroe street cl c 52,021 tbd tbd terra nova group tbd
sold 111 N. canal street wl b 860,000 $100,000,000 $116.28 albert frank & co. sterling bay cos.
sold 1 s. Wacker Drive wl b 1,195,170 $221,000,000 $184.91 tiaa-cref harbor group international
sold 231 s. Lasalle street cl b 936,800 $97,000,000 $103.54 gramercy capital corp berkley properties
sold 20 e. Jackson Boulevard el c 63,520 $6,750,000 $106.27 first Midwest bank dri of ca gibbons & steger
sold 525 W Van Buren street wl a 522,000 $95,000,000 $181.99 american recovery property trust & northwood investors daymark realty advisors
sold 540 W. Madison street wl a 1,111,925 $350,000,000 $314.77 bank of america david werner & Joseph Mizrachi
sold 125 s. Wacker Drive wl b 518,276 $107,000,000 $206.45 tishman speyer properties Metlife
sold 303 W. erie street rn b 62,000 $11,100,000 $179.03 303 erie partners abc realty & cedar street co.
uc 205 W. Wacker Drive wl b 263,650 undisclosed undisclosed cape horn group undisclosed
uc 32 W. randolph street cl c 226,666 $13,250,000 $58.46 david & barbara kalish -
uc 28 e Jackson avenue el c 21,988 undisclosed undisclosed harris preferred capital corporation undisclosed
uc 111 W. Washington street cl b 579,778 $79,500,000 $137.12 harbor group Management shidler group
uc130 e. randolph street & 180 N. stetson Drive (partial stake)
el a 2,204,137 $100,000,000 - bentleyforbes Michael silberberg & Mark karasick
uc 550 W. Washington street wl a 372,000 $112,000,000 $301.08 beacon capital partners Metlife insurance
research report | year-end 2012 | downtown chicago | office
colliers international | p. 10
Central Loop
YEAR-END 2011
YEAR-END 2012
vacancy rate 14.6% 14.2%
absorption (sf) 49,096 181,855
rents $30.18 $30.79
inventory 38,244,638 38,244,638
The Central Loop remains in transition and is likely to experience more of the same in 2013 as ground that was lost as a result of the financial crisis is made up. When economic conditions worsened, the submarket, which has a significant banking and financial presence, experienced a spike in vacancy as those tenants shed excess space via sublease and consolidations. Although the pace at which contractions are occurring has slowed, some tenants still continue to give back excess space upon renegotiating their leases. Existence of this trend was evidenced by Citadel’s recent give back of over 100,000 square feet upon renewing at 131 S. Dearborn Street during the fourth quarter.
Although the Central Loop’s rebound has been less speedy than its counterparts, several factors have helped to stave off conditions that could have been much worse. Landlords in the submarket have been successful in retaining most of the submarket’s existing large tenants by securing renewals over the past two years. When analyzing only transactions greater than 100,000 square feet in the submarket over the past two years, landlords have retained nearly 1.0 million square feet of existing tenants. Additionally, with historically low rental rates in the Central Loop’s Class A sector, many tenants have opted to upgrade their space. This flight-to-quality served as a benefit to the Central Loop which now has a very healthy Class A vacancy rate.
leasing activityLeasing activity was very strong during the final quarter of the year as several major lease transactions were completed. The largest to occur was Citadel’s renewal and contraction at 131 S. Dearborn Street. The bank will be reducing its footprint at the property by over 30% to 222,400 square feet as part of a long term lease extension. In a move that will backfill space vacated by Chicago Title & Trust, Grant Thornton agreed to relocate its office space from 175 W. Jackson to the low-rise of 161 N. Clark Street. The company will be leasing 137,000 square feet starting in 2015 at the building which will be renamed as a result of the new tenancy.
Central Loop landlords had a fairly successful 2012 with 16 lease transactions greater than 40,000 square feet completed. These transactions totaled upwards of 1.4 million square feet, nearly twice the amount reported in 2011 when 12 such transactions totaled only 789,000 square feet.
Central LoopAs predicted, the Central Loop has experienced a rather jagged road to recovery. Divided largely by asset class, it boasts one of the healthiest Class A sectors in the CBD with a 12.2 percent vacancy rate, while its Class B assets continue to have one of the more inflated vacancy rates in the market at 15.9 percent.
Market indicators
central loop lease activity fourth Quarter 2012
tenant address class size (sf) deal type
citadel 131 s. dearborn a 222,400 renewal/contraction
Grant thorton 161 n. clark a 137,000 new lease
Bain & company 190 s. lasalle a 73,000 renewal
capital one Financial corp 77 w. wacker a 65,000 sublease
advantage Futures 231 s. lasalle b 41,000 sublease
heartland alliance 208 s. lasalle b 37,000 renewal
131 south dearborn
research report | year-end 2012 | downtown chicago | office
colliers international | p. 11
large blocks of availabilityDuring the fourth quarter, the net change in the number of available large, contiguous blocks of space available on a direct basis decreased by one bringing the total available to five. A large block of space consisting of 116,964 square feet was removed from the market at 161 N. Clark Street after Grant Thornton signed a lease to relocate to the building. Also noteworthy, although listed on a sublease basis, another large block of Class A space was reduced in size during the quarter as Capital One agreed to sublease 65,000 square feet of space being offered by United Continental Holdings. The block, which was formerly listed at 240,108 square feet, was reduced to 174,624 square feet as a result.
sale activityOne investment sales transaction closed during the fourth quarter in the Central Loop. 231 S. LaSalle Street, a Class B property, traded for $97 million ($103.54 per square foot). The property was acquired by Berkley Properties USA from Gramercy Capital Corp. The Shidler Group also entered into contract with Harbor Group Management to purchase 111 W. Washington Street for a reported $79.5 million ($137.12/SF).
Investment sales activity was fairly active in the Central Loop during 2012 with a total of six transactions completed at an average price of $160.15 per square foot. Only one Class A property traded during 2012, resulting in a lower average purchase price when compared to 2011 when the majority of sales included Class A properties. In 2011, five transactions closed with an average price of $195.20 per square foot.
large blocks availablecentral loop | 100,000 + sf
CLASS A CLASS B CLASS CCentral Loop
West Loop
East Loop
North Mich
River North
CLASS A CLASS B CLASS C
CLASS A CLASS B CLASS C
CLASS A CLASS B CLASS C
CLASS A CLASS B CLASS C
128,622 SF
139,165 SF
146,313 SF
162,517 SF
164,586 SF
174,624 SF
199,132 SF
131 S. DEARBORN
10 S. DEARBORN/21 S. …
11 S. LASALLE ST.
440 S. LASALLE ST
200 N. LASALLE ST.
77 W. WACKER DR.
222 N. LASALLE ST.
110,898 SF
112,000 SF
128,948 SF
155,829 SF
182,782 SF
256,720 SF
306,091 SF
401 S. STATE ST.
333 S. WABASH AVE.
130 E. RANDOLPH ST.
130 E. RANDOLPH ST.
303 E. WACKER DR.
130 E. RANDOLPH ST.
200 E. RANDOLPH ST.
104,990 SF
210,000 SF
214,849 SF
217,569 SF
316,190 SF
350,906 SF
401 N. MICHIGAN AVE.
401-465 E. ILLINOIS
410 N. MICHIGAN AVE.
101 E. ERIE ST.
435-445 N. MICHIGAN AVE.
515 N. STATE ST.
117,101 SF
138,225 SF
600 W. CHICAGO AVE.
350 W. MART CENTER
117,053 SF
125,553 SF
171,370 SF
198,302 SF
214,490 SF
238,778 SF
250,553 SF
285,910 SF
338,131 SF
227 W. MONROE ST.
233 S. WACKER DR.
111 N. CANAL
300 S. RIVERSIDE PLZ.
309-311 W. MONROE
225 W. RANDOLPH ST.
540 W. MADISON ST.
233 S. WACKER DR.
500 W. MONROE ST.
central loop sales activity fourth Quarter 2012
status address class size (sf) sale price price/sf seller buyer
soLD 231 s. Lasalle street b 936,800 $97,000,000 $103.54 gramercy capital corp berkley properties
Uc 111 W. Washington street b 579,778 $79,500,000 $137.12 harbor group Management shidler group
Fs 20 s. clark street b 363,657 tbd tbd M&J wilkow tbd
NM208 s Lasalle street
(office & retail portions)b 355,411 tbd tbd prime group tbd
Uc 32 W. randolph street c 226,666 $13,250,000 $58.46 david & barbara kalish -
Fs 123 W. Madison street c 78,100 tbd tbd canadian imperial bank of commerce tbd
NM 73 W. Monroe street c 52,021 tbd tbd terra nova group tbd
fs = for sale nM = new to market uc = under contract
231 SOU
TH LASALLE STREET
research report | year-end 2012 | downtown chicago | office
colliers international | p. 12
vacancyThe average Central Loop vacancy rate increased slightly during the fourth quarter to 14.2 percent, up from 14.0 percent as of the third quarter. However, during the past year, overall vacancy has fallen 0.4 percent from the 14.6 percent rate posted at year-end 2011. While Class A vacancy has increased by 2.2 percent over the past year, Class B and C spaces have seen decreases of 2.5 percent and 2.0 percent respectively. Despite an increase in Class A vacancy over the year, it still remains the healthiest Class A sector in the CBD at 12.2 percent. Class B vacancy currently resides at 15.9 percent while Class C vacancy posted 14.4 percent at year-end.
absorption
Despite posting negative 76,658 square feet of absorption during the fourth quarter of the year, total net absorption for the submarket in 2012 was positive 181,855 square feet, marking the second consecutive year of positive absorption. Class A space ended the year with a total of negative 344,146 square feet of net absorption while Class B space rebounded substantially with positive 440,789 square feet absorbed.
rentsThe average direct asking rental rate held steady during the fourth quarter of the year at $30.79 per square foot. The current rate represents a 2.0 percent increase from the $30.18 per square foot average rate reported one year ago. Class A asking rates remained stagnant during 2012, ending the year at $36.36 per square foot gross, up just slightly from the $36.33 per square foot rate at year-end 2011. Class B and C rates saw increases during the year, reporting year-end rates of $29.45 per square foot and $21.96 per square foot, respectively.
net absorption & vacancy central loop subMarketNet Absorption & VacancyCentral Loop Submarket
Absorption Vacancy
Asking Gross Rental RatesCentral Loop Submarket
Squa
re F
oota
ge Vacancy
Source: Costar; Colliers International Research
Source: Costar; Colliers International Research Class B Class C AverageClass A
181,855
49,096
(175,725)
0
141,901
1,224,863 14.2%
14.6%14.8%14.3%
12.4%11.6%
0.0%
2.0%
4.0%
6.0%
8.0%
10.0%
12.0%
14.0%
16.0%
-400,000
-200,000
0
200,000
400,000
600,000
800,000
1,000,000
1,200,000
1,400,000
201220112010200920082007
$0.00
$5.00
$10.00
$15.00
$20.00
$25.00
$30.00
$35.00
$40.00
$45.00
201220112010200920082007
asking gross face rates central loop subMarket
Net Absorption & VacancyCentral Loop Submarket
Absorption Vacancy
Asking Gross Rental RatesCentral Loop Submarket
Squa
re F
oota
ge Vacancy
Source: Costar; Colliers International Research
Source: Costar; Colliers International Research Class B Class C AverageClass A
181,855
49,096
(175,725)
0
141,901
1,224,863 14.2%
14.6%14.8%14.3%
12.4%11.6%
0.0%
2.0%
4.0%
6.0%
8.0%
10.0%
12.0%
14.0%
16.0%
-400,000
-200,000
0
200,000
400,000
600,000
800,000
1,000,000
1,200,000
1,400,000
201220112010200920082007
$0.00
$5.00
$10.00
$15.00
$20.00
$25.00
$30.00
$35.00
$40.00
$45.00
201220112010200920082007
what to expect in 2013 › Coming off a year of fairly robust leasing activity that consisted of almost entirely renewals or
same-submarket transactions, Central Loop landlords will need to look outside the submarket to attract new tenants in order to yield more positive absorption.
› Rental rates are likely to remain flat or slightly increased as some upward pressure will be driven by Class A landlords that have fairly low vacancies.
constructionNo new construction was delivered to the Central Loop during the fourth quarter. There are no office developments currently planned in the submarket.
research report | year-end 2012 | downtown chicago | office
colliers international | p. 13
East Loop
Market indicatorsEast Loop
YEAR-END 2011
YEAR-END 2012
vacancy rate 15.6% 16.0%
absorption (sf) 122,650 (100,201)
rents $29.46 $30.36
inventory 27,419,804 27,419,804
The East Loop was amongst the most negatively affected submarkets during the economic downturn, with vacancy spiking 520 basis points from pre-recession quarters in 2008 to the submarket’s peak rate of 16.7 percent at the end of 2009. With substantial ground to make up, East Loop landlords have faced considerable challenges over the past couple of years as they worked to not only retain existing large tenants but also attempted to lure new tenants into the submarket’s bounds, which historically has been considered a more peripheral CBD location.
Although the East Loop’s recovery has been less consistent than the other submarkets, it has slowly made its way towards more stabilized conditions. Despite ending the year with slightly negative absorption, several bright spots have helped to circumvent further losses. Sublease vacancy in the East Loop has decreased substantially in recent quarters as a result of tenants seeking discounted, quality space options. The current sublease vacancy rate now resides under 1.0 percent for the first time since the beginning of 2008, a marked improvement over the peak rate of 3.1 percent posted at the end of 2009. Additionally, because several of the submarket’s largest tenants had lease expirations that coincided with the recession, East Loop landlords were largely focused on their retention. As those tenants were retained, landlords began to focus their efforts on recruiting new tenants into the submarket. The result was over 50% of the large transactions completed in the East Loop during 2012 included new tenants to the submarket or direct expansions by existing tenants.
leasing activityThe largest lease transaction to close during the fourth quarter occurred at 303 E. Wacker Drive as Maximus agreed to lease 68,700 square feet in the building. On the heels of securing AON Corporation as a direct tenant in the building for 386,000 square feet, the landlord of 200 E. Randolph also leased over 40,000 square feet to Standard Parking during the fourth quarter.
During 2012, East Loop landlords were successful in completing 13 lease transactions greater than 40,000 square feet, totaling a cumulative 1,032,122 square feet. Of these 13 transactions, seven were either expansions of existing East Loop tenants, new space requirements to the CBD, or existing CBD tenants that signed leases to relocate from other submarkets into the East Loop. These new transactions to the submarket will help benefit the East Loop with positive absorption once their occupancies take place.
During the year, occupancy losses experienced within East Loop Class B properties tempered any gains made within the Class A sector. The net result was a slight increase in vacancy over the course of the year.
303 east wacker drive
east loop lease activity fourth Quarter 2012
tenant address class size (sf) deal type
Maximus 303 e. wacker b 70,000 new leasestandard parking 200 e. randolph a 41,000 new leaseXpo Logistics 303 e. wacker b 30,000 new leaseUnited Way 333 s. wabash b 28,000 new lease
research report | year-end 2012 | downtown chicago | office
colliers international | p. 14
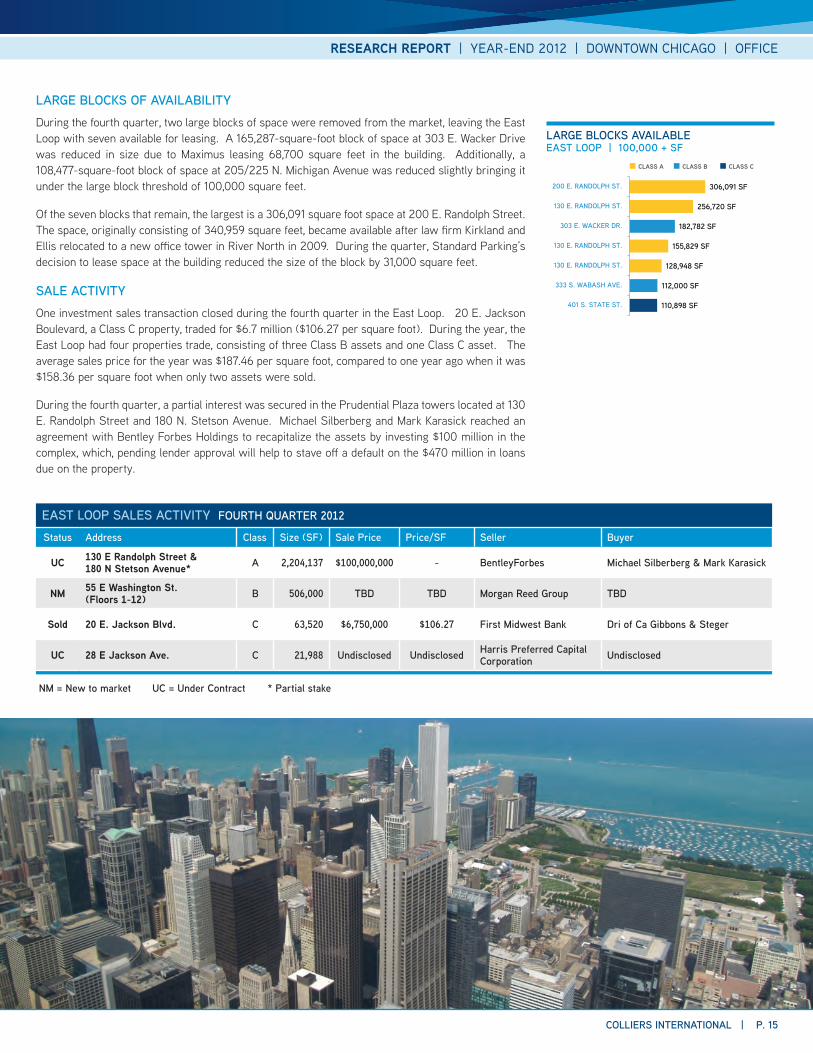
large blocks of availabilityDuring the fourth quarter, two large blocks of space were removed from the market, leaving the East Loop with seven available for leasing. A 165,287-square-foot block of space at 303 E. Wacker Drive was reduced in size due to Maximus leasing 68,700 square feet in the building. Additionally, a 108,477-square-foot block of space at 205/225 N. Michigan Avenue was reduced slightly bringing it under the large block threshold of 100,000 square feet.
Of the seven blocks that remain, the largest is a 306,091 square foot space at 200 E. Randolph Street. The space, originally consisting of 340,959 square feet, became available after law firm Kirkland and Ellis relocated to a new office tower in River North in 2009. During the quarter, Standard Parking’s decision to lease space at the building reduced the size of the block by 31,000 square feet.
sale activityOne investment sales transaction closed during the fourth quarter in the East Loop. 20 E. Jackson Boulevard, a Class C property, traded for $6.7 million ($106.27 per square foot). During the year, the East Loop had four properties trade, consisting of three Class B assets and one Class C asset. The average sales price for the year was $187.46 per square foot, compared to one year ago when it was $158.36 per square foot when only two assets were sold.
During the fourth quarter, a partial interest was secured in the Prudential Plaza towers located at 130 E. Randolph Street and 180 N. Stetson Avenue. Michael Silberberg and Mark Karasick reached an agreement with Bentley Forbes Holdings to recapitalize the assets by investing $100 million in the complex, which, pending lender approval will help to stave off a default on the $470 million in loans due on the property.
large blocks availableeast loop | 100,000 + sf
CLASS A CLASS B CLASS CCentral Loop
West Loop
East Loop
North Mich
River North
CLASS A CLASS B CLASS C
CLASS A CLASS B CLASS C
CLASS A CLASS B CLASS C
CLASS A CLASS B CLASS C
128,622 SF
139,165 SF
146,313 SF
162,517 SF
164,586 SF
174,624 SF
199,132 SF
131 S. DEARBORN
10 S. DEARBORN/21 S. …
11 S. LASALLE ST.
440 S. LASALLE ST
200 N. LASALLE ST.
77 W. WACKER DR.
222 N. LASALLE ST.
110,898 SF
112,000 SF
128,948 SF
155,829 SF
182,782 SF
256,720 SF
306,091 SF
401 S. STATE ST.
333 S. WABASH AVE.
130 E. RANDOLPH ST.
130 E. RANDOLPH ST.
303 E. WACKER DR.
130 E. RANDOLPH ST.
200 E. RANDOLPH ST.
104,990 SF
210,000 SF
214,849 SF
217,569 SF
316,190 SF
350,906 SF
401 N. MICHIGAN AVE.
401-465 E. ILLINOIS
410 N. MICHIGAN AVE.
101 E. ERIE ST.
435-445 N. MICHIGAN AVE.
515 N. STATE ST.
117,101 SF
138,225 SF
600 W. CHICAGO AVE.
350 W. MART CENTER
117,053 SF
125,553 SF
171,370 SF
198,302 SF
214,490 SF
238,778 SF
250,553 SF
285,910 SF
338,131 SF
227 W. MONROE ST.
233 S. WACKER DR.
111 N. CANAL
300 S. RIVERSIDE PLZ.
309-311 W. MONROE
225 W. RANDOLPH ST.
540 W. MADISON ST.
233 S. WACKER DR.
500 W. MONROE ST.
east loop sales activity fourth Quarter 2012
status address class size (sf) sale price price/sf seller buyer
Uc 130 e randolph street & 180 N stetson avenue* a 2,204,137 $100,000,000 - bentleyforbes Michael silberberg & Mark karasick
NM 55 e Washington st. (Floors 1-12) b 506,000 tbd tbd Morgan reed group tbd
sold 20 e. Jackson Blvd. c 63,520 $6,750,000 $106.27 first Midwest bank dri of ca gibbons & steger
Uc 28 e Jackson ave. c 21,988 undisclosed undisclosed harris preferred capital corporation undisclosed
* partial stakenM = new to market uc = under contract
research report | year-end 2012 | downtown chicago | office
colliers international | p. 15
Net Absorption & VacancyEast Loop Submarket
Asking Gross Rental RatesEast Loop Submarket
Absorption Vacancy
Squa
re F
oota
ge Vacancy
Source: Costar; Colliers International Research
Source: Costar; Colliers International Research Class B Class C AverageClass A
(100,201)
122,650 32,832
(1,141,281)
638,439
249,241
16.0%15.6%16.0%16.7%
11.5%
13.9%
0.0%
2.0%
4.0%
6.0%
8.0%
10.0%
12.0%
14.0%
16.0%
18.0%
-1,400,000
-1,200,000
-1,000,000
-800,000
-600,000
-400,000
-200,000
0
200,000
400,000
600,000
800,000
201220112010200920082007
$0.00
$5.00
$10.00
$15.00
$20.00
$25.00
$30.00
$35.00
$40.00
$45.00
201220112010200920082007
net absorption & vacancy east loop subMarket
Net Absorption & VacancyEast Loop Submarket
Asking Gross Rental RatesEast Loop Submarket
Absorption Vacancy
Squa
re F
oota
ge Vacancy
Source: Costar; Colliers International Research
Source: Costar; Colliers International Research Class B Class C AverageClass A
(100,201)
122,650 32,832
(1,141,281)
638,439
249,241
16.0%15.6%16.0%16.7%
11.5%
13.9%
0.0%
2.0%
4.0%
6.0%
8.0%
10.0%
12.0%
14.0%
16.0%
18.0%
-1,400,000
-1,200,000
-1,000,000
-800,000
-600,000
-400,000
-200,000
0
200,000
400,000
600,000
800,000
201220112010200920082007
$0.00
$5.00
$10.00
$15.00
$20.00
$25.00
$30.00
$35.00
$40.00
$45.00
201220112010200920082007
asking gross face rates east loop subMarket
what to expect in 2013 › Historically low pricing, particularly due to recently realized tax savings, will allow East Loop
landlords to continue attracting tenants from other submarkets. The East Loop will also continue to appeal to new tenants in the CBD.
› Concession packages are likely to remain at current levels during the coming year.
constructionNo new construction was delivered to the East Loop during the year. There are no office tower developments planned in the submarket.
vacancyFollowing two consecutive quarters of vacancy descents, the East Loop ended the year with a vacancy rate of 16.0 percent. Over the past year, overall vacancy increased by 0.4 percent. This increase was largely fueled by substantial occupancy losses in the Class B sector, with a current vacancy rate of at 18.3 percent, up from 16.4 percent one year ago. Helping to offset some of the loss experienced across Class B space, Class A properties reported substantial gains in occupancy in 2012, thereby decreasing vacancy from 19.8 percent rate as posted at the end of 2011 to the current rate of 14.9 percent.
absorptionDespite posting positive 25,642 square feet of net absorption during the fourth quarter, the East Loop ended 2012 at negative 100,201 square feet. Class A space was the one bright spot in with positive 331,411 square feet of net absorption for the year while Class B and C space totaled a combined negative 431,612 square feet.
rentsRental rates in the submarket remained steady during the quarter at $30.36 per square foot gross. The overall asking rental rate in the East Loop has increased 3.0 percent during the past year with a $0.90 per square foot increase over the $29.46 per square foot rate posted at the end of 2011. The result of successful leasing efforts during the past year, landlords of Class A assets began to place upward pressure on asking rates. Class A properties experienced the most dramatic shift in asking rates of any other building class in the submarket. The current gross asking rate of $36.75 per square foot represents a 5.1 percent or $1.78 per square foot increase over one year ago. During the year, Class B and C assets also posted increases in asking rates. Class B rates reside at $29.81 per square foot gross, up $0.10 per square foot while Class C rates increased to $23.85 per square foot gross, representing a $0.74 per square foot increase during the year.
research report | year-end 2012 | downtown chicago | office
colliers international | p. 16
North Michigan Avenue
YEAR-END 2011
YEAR-END 2012
vacancy rate 14.6% 14.7%
absorption (sf) (42,608) (17,261)
rents $31.59 $30.92
inventory 13,696,152 13,696,152
North Michigan AvenueDue to a loyal tenant base, the North Michigan Avenue submarket is historically one of the more stable submarkets. Major shifts in occupancy levels are uncommon and due to a large medical presence, the submarket has been slow to realize the impact of the economic downturn. Vacancy has gradually climbed over the past two years as opposed to the dramatic spikes experienced across other submarkets.
Market indicators
north Michigan lease activity fourth Quarter 2012
tenant address class size (sf) deal type
N o s I G N I F I c a N t L e a s e a c t I V I t Y t h I s Q U a r t e r
303 east wacker drive
research report | year-end 2012 | downtown chicago | office
colliers international | p. 17
The submarket’s current vacancy rate of 14.7 percent remains substantially elevated over the 8.0 percent average vacancy rate during pre-recession quarters. The submarket’s building composition consisting of a mix of retail space, hotels, office buildings, medical facilities and residential properties make it a unique office environment that appeals to a smaller subset of office users. As a result, the submarket has not been as successful as its counterparts in luring the sizeable tenants needed to backfill some of the large blocks of availability that exist.
The relocation of the new Children’s Hospital to 225 E. Chicago Avenue and 680 N. Lake Shore Drive combined with Northwestern Hospital’s recent growth have helped to buoy the submarket’s vacancy by offsetting some of the deflections and space contractions that have occurred to date. However, as one of its largest tenants prepares to vacate North Michigan Avenue in 2013, the submarket’s health will take a direct hit. The American Medical Association will be vacating its 350,000-square-foot space at 515 N. State in a relocation to 330 N. Wabash in River North. This, combined with historically sluggish leasing activity, will result in North Michigan Avenue continuing to trail the other CBD submarkets as it relates to recovery.
leasing activityThere were no large lease transactions completed during the fourth quarter in the submarket. Leasing activity during the year, although fairly sluggish, improved slightly from one year ago. During 2012, four lease transactions greater than 40,000 square feet were completed, totaling a cumulative 420,000 square feet. Comparatively, only two such transactions totally 168,000 square feet were completed in 2011.
large blocks of availabilityLarge block availability remained unchanged during the fourth quarter at six blocks of contiguous and direct space greater than 100,000 square feet. The largest available block in the CBD is located in North Michigan Avenue. A 350,906-square-foot space is being marketed for lease at the end of 2013 when the current tenant, American Medical Association, relocates to 330 N. Wabash in River North. The third largest block of available space in the CBD also resides in the submarket at the Tribune Tower which has a 316,000-square-foot block of space available for lease.
sale activityInvestment sales activity was uneventful in the submarket during the fourth quarter. In fact, only one investment sales transaction occurred throughout the entire year as 500 N. Michigan Avenue was sold during the first quarter for $70.9 million ($218.83 per square).
large blocks availablenorth Michigan avenue | 100,000 + sf
CLASS A CLASS B CLASS CCentral Loop
West Loop
East Loop
North Mich
River North
CLASS A CLASS B CLASS C
CLASS A CLASS B CLASS C
CLASS A CLASS B CLASS C
CLASS A CLASS B CLASS C
128,622 SF
139,165 SF
146,313 SF
162,517 SF
164,586 SF
174,624 SF
199,132 SF
131 S. DEARBORN
10 S. DEARBORN/21 S. …
11 S. LASALLE ST.
440 S. LASALLE ST
200 N. LASALLE ST.
77 W. WACKER DR.
222 N. LASALLE ST.
110,898 SF
112,000 SF
128,948 SF
155,829 SF
182,782 SF
256,720 SF
306,091 SF
401 S. STATE ST.
333 S. WABASH AVE.
130 E. RANDOLPH ST.
130 E. RANDOLPH ST.
303 E. WACKER DR.
130 E. RANDOLPH ST.
200 E. RANDOLPH ST.
104,990 SF
210,000 SF
214,849 SF
217,569 SF
316,190 SF
350,906 SF
401 N. MICHIGAN AVE.
401-465 E. ILLINOIS
410 N. MICHIGAN AVE.
101 E. ERIE ST.
435-445 N. MICHIGAN AVE.
515 N. STATE ST.
117,101 SF
138,225 SF
600 W. CHICAGO AVE.
350 W. MART CENTER
117,053 SF
125,553 SF
171,370 SF
198,302 SF
214,490 SF
238,778 SF
250,553 SF
285,910 SF
338,131 SF
227 W. MONROE ST.
233 S. WACKER DR.
111 N. CANAL
300 S. RIVERSIDE PLZ.
309-311 W. MONROE
225 W. RANDOLPH ST.
540 W. MADISON ST.
233 S. WACKER DR.
500 W. MONROE ST.
north Michigan sales activity fourth Quarter 2012
status address class size (sf) sale price price/sf seller buyer
N o s I G N I F I c a N t s a L e s a c t I V I t Y t h I s Q U a r t e r
research report | year-end 2012 | downtown chicago | office
colliers international | p. 18
Net Absorption & VacancyNorth Michigan Avenue Submarket
Squa
re F
oota
ge Vacancy
Source: Costar; Colliers International Research
Source: Costar; Colliers International Research Class B Class C AverageClass A
Absorption Vacancy
(17,261)(42,608)
(592,962)
(59,757)(81,363)
270,254 14.7%14.6%14.3%
9.9%9.5%
8.9%
0.0%
2.0%
4.0%
6.0%
8.0%
10.0%
12.0%
14.0%
16.0%
-700,000
-600,000
-500,000
-400,000
-300,000
-200,000
-100,000
0
100,000
200,000
300,000
400,000
201220112010200920082007
$0.00
$5.00
$10.00
$15.00
$20.00
$25.00
$30.00
$35.00
$40.00
$45.00
201220112010200920082007
vacancyNorth Michigan Avenue’s overall vacancy rate remained stagnant during the fourth quarter at 14.7 percent. Over the past year, the submarket has not experienced much movement from the 14.6 percent vacancy rate posted at year-end 2011. Class A vacancy decreased during the year from 15.6 percent in 2011 to its current level at 13.3 percent. However, any gains experienced in Class A space were offset by a vacancy increase in Class B properties over the past year, which now resides at 13.9 percent, up from 11.6 percent one year ago.
absorptionEnding on a flat note, net absorption for the fourth quarter totaled negative 3,413 square feet, bringing the total of the year to negative 17,261 square feet. Class A space experienced positive 40,818 square feet of net absorption with an annual total of positive 104,179 square feet. Contrarily, Class B properties had negative 64,946 square feet of net absorption during the quarter, ending the year at negative 150,247 square feet.
rentsThe average direct gross asking rate in the submarket has fallen $0.67 per square foot over the past year. The current rate of $30.92 per square foot resides well below the average rate of $36.50 per square foot posted prior to the economic downturn. The most dramatic decreases in asking rates over the past year have occurred in Class A and C properties which have decreased by $1.06 per square foot and $2.00 per square foot over the past year. The average direct Class A asking rate now resides at $35.23 per square foot gross while Class B space ended the year at $31.22 per square foot gross.
net absorption & vacancy north Michigan subMarket
Net Absorption & VacancyNorth Michigan Avenue Submarket
Squa
re F
oota
ge Vacancy
Source: Costar; Colliers International Research
Source: Costar; Colliers International Research Class B Class C AverageClass A
Absorption Vacancy
(17,261)(42,608)
(592,962)
(59,757)(81,363)
270,254 14.7%14.6%14.3%
9.9%9.5%
8.9%
0.0%
2.0%
4.0%
6.0%
8.0%
10.0%
12.0%
14.0%
16.0%
-700,000
-600,000
-500,000
-400,000
-300,000
-200,000
-100,000
0
100,000
200,000
300,000
400,000
201220112010200920082007
$0.00
$5.00
$10.00
$15.00
$20.00
$25.00
$30.00
$35.00
$40.00
$45.00
201220112010200920082007
asking gross face rates north Michigan subMarket
what to expect in 2013 › Continued sluggish demand characteristics with the exception of space absorbed by healthcare
companies associated with Northwestern Hospital or the new Children’s Memorial Hospital.
› Rental rates and concessions are likely to remain flat in the submarket.
› The impending relocation of the American Medical Association from North Michigan Avenue to River North will result in a substantial hit to absorption for the submarket.
constructionNo new construction was delivered to North Michigan Avenue during the fourth quarter. There are currently no office developments planned in the submarket.
research report | year-end 2012 | downtown chicago | office
colliers international | p. 19
River North
Market indicatorsRiver North
YEAR-END 2011
YEAR-END 2012
vacancy rate 14.3% 12.7%
absorption (sf) 130,359 264,642
rents $32.42 $31.24
inventory 16,522,189 16,522,189
The result of new office development, a booming residential community and most recently, an infiltration of the city’s technology companies, River North has transformed from a once fairly undeveloped area consisting of warehouses and loft properties to a lively and dynamic office environment.
river north lease activity fourth Quarter 2012
tenant address class size (sf) deal type
fiserv 350 w. Mart center b 50,000 renewal/contraction
350 west M
art center
research report | year-end 2012 | downtown chicago | office
colliers international | p. 20
Leasing activity in 2012 further reinforced River North’s growing reputation as the technology hub of Chicago’s CBD. The most widely discussed transaction was Google’s decision to relocate Motorola Mobility staff from suburban Libertyville into 572,000 square feet in River North. Google will now join other technology giants such as Groupon, headquartered at 600 W. Chicago Avenue, and Salesforce.com, who is taking space at 111 W. Illinois Street, in calling River North its home. In addition to housing the city’s largest technology firms, the submarket is also a hotbed for start-ups as evidenced by the Chicagoland Entrepreneurial Center’s decision to lease 50,000 square feet of space for 1871, a digital hub that is now providing space for start-ups at the Merchandise Mart.
With the healthiest vacancy rate in the CBD, River North will continue to benefit from occupancies that are expected in the coming year. During the year, publicity was focused largely on the rapid growth of the submarket resulting from the tech industry. However, looking ahead, several major occupancies by more traditional office tenants, will also help to fuel positive absorption within the submarket in the coming year. The American Medical Association, Latham & Watkins and SmithBucklin will all be relocating to River North from other submarkets. Additionally, Salesforce.com will take occupancy of its new space at 111 W. Illinois. These transactions combined with Google’s new lease will create upwards of 1.0 million square feet of positive absorption for the submarket, making the year ahead bright for River North.
leasing activityLeasing activity cooled a bit during the fourth quarter with only one major lease transaction completed. Fiserv agreed to renew and contract its space to 50,000 square feet at 350 W. Mart Center. Despite a slow final quarter of the year, 2012 proved to generate fairly robust leasing activity for the submarket. River North had the largest lease transaction of any submarket for the year with Google’s decision to relocate its newly acquired Motorola Mobility division from Libertyville to the Merchandise Mart. The company agreed to lease 572,000 square feet at the building and will take occupancy in summer of 2013. During the year, nine lease transactions greater than 40,000 square feet were completed, totaling 1.3 million square feet. This marks a substantial increase over the five transactions totaling 864,000 square feet reported at year-end 2011.
river north sales activity fourth Quarter 2012
status address class size (sf) sale price price/sf seller buyer
Fs 300 N. Lasalle st. (partial stake) a 1,302,901 tbd tbd kbs reit 2 -
Fs 540 N. Lasalle st. c 65,140 tbd tbd Joseph lagoa tbd
soLD 303 W. erie st. b 62,000 $11,100,000 $179.03 303 erie partners abc realty & cedar street co.
fs = for sale
303 EAST ERIE STREETresearch report | year-end 2012 | downtown chicago | office
colliers international | p. 21
large blocks of availabilityRiver North currently has no contiguous blocks of space containing 100,000 square feet or greater on a direct basis. However, two major sublease blocks are being marketed for lease. AT&T is marketing 138,225 square feet of space at 350 W. Mart Center and Level 3 Communications is looking to sublease its 117,101-square-foot space at 600 W. Chicago Avenue.
sale activityOnly one investment sales transaction was completed during the fourth quarter in River North. 303 W. Erie Street was sold for $11.1 million ($179.03 per square foot) from 303 Erie Partners to ABC Realty & Cedar Street Co. There are two properties currently being marketed for sale in the submarket. 300 N. LaSalle remains on the market as current owner, KBS REIT 2, is selling a partial stake in the building. Joseph Lagoa is also selling 540 N. LaSalle Street, which is currently vacant, for an asking price of $8,500,000 ($130.48 per square foot).
During the year, River North saw three investment sales transactions, consisting of one in each asset class. The average sales price of these transactions was $164.41 per square foot.
large blocks available100,000 + sQuare feet
CLASS A CLASS B CLASS CCentral Loop
West Loop
East Loop
North Mich
River North
CLASS A CLASS B CLASS C
CLASS A CLASS B CLASS C
CLASS A CLASS B CLASS C
CLASS A CLASS B CLASS C
128,622 SF
139,165 SF
146,313 SF
162,517 SF
164,586 SF
174,624 SF
199,132 SF
131 S. DEARBORN
10 S. DEARBORN/21 S. …
11 S. LASALLE ST.
440 S. LASALLE ST
200 N. LASALLE ST.
77 W. WACKER DR.
222 N. LASALLE ST.
110,898 SF
112,000 SF
128,948 SF
155,829 SF
182,782 SF
256,720 SF
306,091 SF
401 S. STATE ST.
333 S. WABASH AVE.
130 E. RANDOLPH ST.
130 E. RANDOLPH ST.
303 E. WACKER DR.
130 E. RANDOLPH ST.
200 E. RANDOLPH ST.
104,990 SF
210,000 SF
214,849 SF
217,569 SF
316,190 SF
350,906 SF
401 N. MICHIGAN AVE.
401-465 E. ILLINOIS
410 N. MICHIGAN AVE.
101 E. ERIE ST.
435-445 N. MICHIGAN AVE.
515 N. STATE ST.
117,101 SF
138,225 SF
600 W. CHICAGO AVE.
350 W. MART CENTER
117,053 SF
125,553 SF
171,370 SF
198,302 SF
214,490 SF
238,778 SF
250,553 SF
285,910 SF
338,131 SF
227 W. MONROE ST.
233 S. WACKER DR.
111 N. CANAL
300 S. RIVERSIDE PLZ.
309-311 W. MONROE
225 W. RANDOLPH ST.
540 W. MADISON ST.
233 S. WACKER DR.
500 W. MONROE ST.
what to expect in 2013 › The submarket will benefit from substantial positive absorption as 2013 gets underway, particularly
with the impending occupancies of major tenants including Google, American Medical Association, Latham & Watkins, Salesforce.com and SmithBucklin.
› Demand will continue to be sourced by growth within the technology sector.
› With no significant new construction anticipated and tightening vacancy characteristics, landlords will continue placing upward pressure on rents.
Squa
re F
oota
ge Vacancy
Source: Costar; Colliers International Research
Source: Costar; Colliers International Research Class B Class C AverageClass A
264,642
130,359
305,792
938,537
161,964
338,233
12.7%
14.3%15.1%
16.9%
9.0%
10.7%
0.0%
2.0%
4.0%
6.0%
8.0%
10.0%
12.0%
14.0%
16.0%
18.0%
0
100,000
200,000
300,000
400,000
500,000
600,000
700,000
800,000
900,000
1,000,000
201220112010200920082007
Absorption Vacancy
$0.00
$5.00
$10.00
$15.00
$20.00
$25.00
$30.00
$35.00
$40.00
$45.00
201220112010200920082007
vacancyDuring the past year, vacancy in River North has descended to 12.7 percent, down from 14.3 percent at year-end 2011. Class A vacancy currently resides at 19.9 percent, down from 24.7 percent one year prior. With only six Class A properties in the submarket, vacancy in this sector is substantially impacted with any major occupancy gain or loss. A large block of vacancy at 330 N. Wabash Street continues to hinder the submarket’s Class A vacancy rate. Although two tenants from other submarkets have committed to leases at the building, their occupancies have not yet taken place, resulting in an artificially high vacancy. Class B vacancy is the lowest in the CBD at 8.8 percent, up just slightly from 8.6 percent at the end of 2011
absorptionThe River North submarket experienced 119,891 square feet of positive net absorption during the fourth quarter, bringing the total for the year to positive 264,642 square feet, compared to 130,359 square feet at the end of 2011. The majority of the positive absorption experienced in the submarket during the year, occurred in Class A space with a total of 246,392 square feet for the year. Although Class B space ended the year a negative 21,279 square feet of net absorption, the coming year is anticipated to bring strong positive absorption to this sector of the market, particularly as Google takes occupancy of 572,000 square feet of space at the Merchandise Mart.
net absorption & vacancy river north subMarket
Squa
re F
oota
ge Vacancy
Source: Costar; Colliers International Research
Source: Costar; Colliers International Research Class B Class C AverageClass A
264,642
130,359
305,792
938,537
161,964
338,233
12.7%
14.3%15.1%
16.9%
9.0%
10.7%
0.0%
2.0%
4.0%
6.0%
8.0%
10.0%
12.0%
14.0%
16.0%
18.0%
0
100,000
200,000
300,000
400,000
500,000
600,000
700,000
800,000
900,000
1,000,000
201220112010200920082007
Absorption Vacancy
$0.00
$5.00
$10.00
$15.00
$20.00
$25.00
$30.00
$35.00
$40.00
$45.00
201220112010200920082007
asking gross face rates river north subMarket
rentsThe overall average asking rate in the submarket dipped to $31.24 per square foot during the year, down from $32.42 per square foot at the end of 2011. However, due to significant leasing during the year, actual Class A space availability is very low, thereby impacting the overall weighted average asking rate. Class A asking rates have increased substantially over the past year to $40.76 per square foot, up from $37.94 per square foot one year ago. Additionally, Class B space has seen a similar increase ending 2012 at $31.00 per square foot, up from $27.93 per square foot at year-end 2011.
constructionNo new construction was delivered to River North during the year. There is currently no office development planned in the submarket.
research report | year-end 2012 | downtown chicago | office
colliers international | p. 22
west loop lease activity fourth Quarter 2012
tenant address class size (sf) deal type
huron consulting 550 w. van buren a 129,000 renewal/expansion
heitman 191 n. wacker a 65,000 renewal
towers watson 191 n. wacker a 65,000 renewal
oracle 233 s. wacker a 60,000 renewal
aep energy 225 w. wacker a 51,000 sublease
presence health 200 s. wacker b 44,000 new lease
bgc brokers 500 w. Monroe a 32,000 new lease
Zones 233 s. wacker a 29,000 sublease
globetrotters engineering 300 s. wacker b 28,000 renewal
West LoopWith the largest Class A inventory in the CBD, it is not surprising that the West Loop outpaced the other CBD submarkets during 2012 in terms of leasing activity and occupancy gains. The submarket continued its streak of positive demand for the eleventh consecutive quarter, making it the only submarket to realize such consistent gains.
Market indicatorsWest Loop
YEAR-END 2011
YEAR-END 2012
vacancy rate 14.4% 13.5%
absorption (sf) 921,001 396,107
rents $33.19 $34.62
inventory 48,133,953 48,133,953
550 west van buren street
research report | year-end 2012 | downtown chicago | office
colliers international | p. 23
Although total leasing activity and the magnitude of the gains realized in the West Loop during the year was less than those experienced in 2011, the West Loop was the first submarket to rebound following the financial crisis. The submarket’s proximity to transit, abundance of trophy and Class A towers, and its reputation as the leading submarket in the CBD, resulted in a speedier recovery. Immediately following the start of the financial crisis, the West Loop’s vacancy rate spiked to 17.7 percent, a level that had not been witnessed since the market cycle following the 9/11 crisis. However, once the spike occurred, the submarket almost immediately began to rebound, with a cumulative 2.0 million square feet of positive absorption posted over the past 11 quarters.
As the submarket’s vacancy continues its descent and is now approaching pre-recession levels, the search is on for anchor tenants to occupy a new development in the West Loop. The last addition to inventory in the submarket was in 2009 when the 1.2-million-square-foot building at 155 N. Wacker Drive delivered. There are several potential new developments in play for the West Loop with targeted delivery dates between 2016 and 2017. It is likely one or two of these projects will officially launch once financing is obtained and anchor tenants are officially secured.
leasing activityActivity was fairly robust in the West Loop during the fourth quarter with several sizeable transactions completed. The largest was Huron Consulting’s renewal and expansion at 550 W. Van Buren Street. The company expanded by 19.0% and will lease 129,000 square feet under a long-term lease agreement. Two lease renewals were completed at 191 N. Wacker Drive. Both Heitman and Towers Watson renewed their 65,000-square-foot leases at the building.
The West Loop experienced more leasing activity than any other submarket during 2012, ending the year with 18 transactions greater than 40,000 square feet, totaling a cumulative 1.6 million square feet. Despite its position as the strongest submarket in the CBD from a leasing perspective, the West Loop’s activity is down from one year ago when 25 such transactions were completed, totaling 2.5 million square feet.
west loop lease activity fourth Quarter 2012
status address class size (sf) sale price price/sf seller buyer
sold 1 s. Wacker Drive b 1,195,170 $221,000,000 $184.91 tiaa-cref harbor group international
sold 540 W. Madison street a 1,111,925 $350,000,000 $314.77 bank of america david werner & Joseph Mizrachi
sold 111 N. canal street b 860,000 $100,000,000 $116.28 albert frank & co. sterling bay cos.
NM 225 W. Wacker Drive a 650,812 tbd tbd J.p. Morgan chase & co. tbd
sold 525 W Van Buren street a 522,000 $95,000,000 $181.99 american recovery property trust & northwood investors daymark realty advisors
sold 125 s. Wacker Drive b 518,276 $107,000,000 $206.45 tishman speyer properties Metlife
Uc 550 W. Washington st. a 372,000 $112,000,000 $301.08 beacon capital partners Metlife insurance
Uc 205 W. Wacker Drive b 263,650 undisclosed undisclosed cape horn group undisclosed
nM = new to Market uc = under contract
540 WEST M
ADISON STREET
research report | year-end 2012 | downtown chicago | office
colliers international | p. 24
large blocks of availabilityThe number of available, direct blocks of space 100,000 square feet or greater increased by two during the quarter, bringing the total available to eight. The largest block was a 250,553-square-foot space at 540 W. Madison Street. As part of a recent sale of the property, Bank of America completed a sale leaseback that included the ability to contract their space within the building. Additionally, a 171,370-square-foot space was placed on the market at 111 N. Canal Street. The building was recently purchased by Sterling Bay Properties and will be undergoing a redevelopment. Five of the large blocks reside in Class A properties and of those three reside in high-rise space
sale activityInvestment sales activity continued to be strong in the West Loop with five transactions completed during the eight quarter, split evenly between Class A and B assets. The largest transaction was the sale of 540 W. Madison Street. The property was sold for $350 million ($314.77 per square foot) from Bank of America to David Werner and Joseph Mizrachi. Also during the quarter, 1 S. Wacker Drive was sold for $221 million ($184.91 per square foot) from TIAA-CREF to Harbor Group International. MetLife completed its purchase of 125 S. Wacker Drive for $107 million ($206.45 per square foot) from Tishman Speyer Properties and The American Recovery Property Trust and Northwood Investors created a joint venture to acquire and recapitalize the asset at 525 W. Van Buren Street for $95 milllion ($181.99 per square foot). The property was acquired from Daymark Realty Investors.
During the year, more sales transactions were completed in the West Loop than any other submarket. Twelve properties traded, with the majority consisting of Class B and C assets. The average sales price for the year was $177.15 per square foot, compared to one year ago when seven transactions closed with an average sales price of $247.64 per square foot, as boosted by the sale of several Class A and trophy towers.
large blocks available100,000 + sQuare feet
CLASS A CLASS B CLASS CCentral Loop
West Loop
East Loop
North Mich
River North
CLASS A CLASS B CLASS C
CLASS A CLASS B CLASS C
CLASS A CLASS B CLASS C
CLASS A CLASS B CLASS C
128,622 SF
139,165 SF
146,313 SF
162,517 SF
164,586 SF
174,624 SF
199,132 SF
131 S. DEARBORN
10 S. DEARBORN/21 S. …
11 S. LASALLE ST.
440 S. LASALLE ST
200 N. LASALLE ST.
77 W. WACKER DR.
222 N. LASALLE ST.
110,898 SF
112,000 SF
128,948 SF
155,829 SF
182,782 SF
256,720 SF
306,091 SF
401 S. STATE ST.
333 S. WABASH AVE.
130 E. RANDOLPH ST.
130 E. RANDOLPH ST.
303 E. WACKER DR.
130 E. RANDOLPH ST.
200 E. RANDOLPH ST.
104,990 SF
210,000 SF
214,849 SF
217,569 SF
316,190 SF
350,906 SF
401 N. MICHIGAN AVE.
401-465 E. ILLINOIS
410 N. MICHIGAN AVE.
101 E. ERIE ST.
435-445 N. MICHIGAN AVE.
515 N. STATE ST.
117,101 SF
138,225 SF
600 W. CHICAGO AVE.
350 W. MART CENTER
117,053 SF
125,553 SF
171,370 SF
198,302 SF
214,490 SF
238,778 SF
250,553 SF
285,910 SF
338,131 SF
227 W. MONROE ST.
233 S. WACKER DR.
111 N. CANAL
300 S. RIVERSIDE PLZ.
309-311 W. MONROE
225 W. RANDOLPH ST.
540 W. MADISON ST.
233 S. WACKER DR.
500 W. MONROE ST.
what to expect in 2013 › Following numerous quarters of positive demand, West Loop landlords will likely continue to place
upward pressure on rental rates as 2013 gets underway.
› New construction will not deliver to the submarket during the coming year but announcements regarding the securing of potential anchor tenants to launch one or two new towers are likely.
› Landlords of Class A properties may begin to push back on concessions such as abatement and tenant improvement allowances.
vacancyFor the sixth consecutive quarter the overall vacancy rate in the West Loop posted a decrease, ending the fourth quarter at 13.5 percent, down from 14.4 percent one year prior. Class A vacancy increased slightly during the year to 14.1 percent from 13.6 percent at year-end 2011. Class B vacancy experienced substantial improvement from one year ago as vacancy fell from 14.3 percent to 11.9 percent. Vacancy in the West Loop has fallen 3.6 percent in the past two years.
absorptionNet absorption during the fourth quarter was healthy with positive 284,502 square feet posted, bringing the total for the year to positive 396,107 square feet. The West Loop experienced the most net absorption of any submarket during 2012. However, despite a positive year-end result, the absorption experienced was less than the positive 921,001 square feet reported at the end of 2011.
rentsThe average direct gross asking rate increased for the fourth consecutive quarter in the West Loop, ending the year at $34.62 per square foot. The West Loop experienced the largest escalation in asking rates of any submarket in the CBD with an increase of $1.43 per square foot from $33.19 per square foot at year-end 2011. Class A asking rates currently stand at $38.42 per square foot, up $0.45 from the prior year while Class B rates have increased by $0.56 per square foot to $30.98 per square foot gross.
Squa
re F
oota
ge Vacancy
Source: Costar; Colliers International Research
Source: Costar; Colliers International Research Class B Class C AverageClass A
396,107
921,001
56,972
(756,451)
(478,616)
1,363,754
13.5%14.4%
16.3%16.4%
12.7%11.7%
0.0%
2.0%
4.0%
6.0%
8.0%
10.0%
12.0%
14.0%
16.0%
18.0%
(1,000,000)
(500,000)
0
500,000
1,000,000
1,500,000
201220112010200920082007
Net Absorption & VacancyWest Loop Submarket
Absorption Vacancy
$0.00
$5.00
$10.00
$15.00
$20.00
$25.00
$30.00
$35.00
$40.00
$45.00
201220112010200920082007
Asking Gross Rental RatesWest Loop Submarket
net absorption & vacancy west loop subMarket
Squa
re F
oota
ge Vacancy
Source: Costar; Colliers International Research
Source: Costar; Colliers International Research Class B Class C AverageClass A
396,107
921,001
56,972
(756,451)
(478,616)
1,363,754
13.5%14.4%
16.3%16.4%
12.7%11.7%
0.0%
2.0%
4.0%
6.0%
8.0%
10.0%
12.0%
14.0%
16.0%
18.0%
(1,000,000)
(500,000)
0
500,000
1,000,000
1,500,000
201220112010200920082007
Net Absorption & VacancyWest Loop Submarket
Absorption Vacancy
$0.00
$5.00
$10.00
$15.00
$20.00
$25.00
$30.00
$35.00
$40.00
$45.00
201220112010200920082007
Asking Gross Rental RatesWest Loop Submarketasking gross face rates west loop subMarket
constructionNo new construction was delivered to the West Loop during the fourth quarter. However, Hines intends to break ground on a new 45-story, 900,000-square-foot office tower at 444 W. Lake Street during the first quarter of 2013. The developer obtained $300 million in financing from Ivanhoe Cambridge and the building is anticipated to be delivered in 2016. Several other potential new developments are being explored by developers but no formal announcements regarding their launch have been made.
research report | year-end 2012 | downtown chicago | office
colliers international | p. 25
the information contained in this report was provided by sources deemed to be reliable, however, no guarantee is made as to the accuracy or reliability. as new, corrected or
updated information is obtained, it is incorporated into both current and historical data, which may invalidate comparison to previously issued reports
fourth Quarter 2012 office Market statistics | local standards (includes competitve owner-occupied properties) va c a n c y a b s o r p t i o n r e n t s
classtotal inventory sf
direct sf vacant
sublease sf vacant total vacant sf
direct vacancy rate
sublease vacancy rate
total vacancy rate
total direct net absorption
total sublease net absorption
total net absorption
net absorption ytd sf
asking full service average direct rent per sf
central loop
class a 15,995,601 1,745,761 206,805 1,952,566 10.9% 1.3% 12.2% (39,320) (25,000) (64,320) (344,146) $36.36
class b 17,927,510 2,643,310 201,979 2,845,289 14.7% 1.1% 15.9% 70,877 (39,657) 31,220 440,789 $29.45
class c 4,321,527 615,110 6,141 621,251 14.2% 0.1% 14.4% (44,578) 1,020 (43,558) 85,212 $21.96
research report | year-end 2012 | downtown chicago | office
colliers international | p. 26
fourth Quarter 2012 office Market statistics | colliers international standards (includes all owner-occupied properties)va c a n c y a b s o r p t i o n r e n t s
classtotal inventory sf
direct sf vacant
sublease sf vacant total vacant sf
direct vacancy rate
sublease vacancy rate
total vacancy rate
total direct net absorption
total sublease net absorption
total net absorption
net absorption ytd sf
asking full service average direct rent per sf
central loop
class a 15,995,601 1,752,800 206,805 1,959,605 11.0% 1.3% 12.3% 0 (25,000) (71,359) (351,185) $36.36
class b 22,620,593 2,647,736 201,979 2,849,715 11.7% 0.9% 12.6% 70,877 (39,657) 31,220 442,871 $29.45
class c 6,226,906 689,200 6,141 695,341 11.1% 0.1% 11.2% (46,348) 3,652 (42,696) 102,564 $21.96
the information contained in this report was provided by sources deemed to be reliable, however, no guarantee is made as to the accuracy or reliability. as new, corrected or
updated information is obtained, it is incorporated into both current and historical data, which may invalidate comparison to previously issued reports