CHICO HISTORICAL GEOGRAPHIC INFORMATION SYSTEM INTERACTIVE WEBSITE _________________ A Project Presented to the Faculty of California State University, Chico _________________ In Partial Fulfillment of the Requirements for the Degree Master of Arts In Geography __________________ By Heidi Marie Ogle Fall 2012
Transcript
CHICO HISTORICAL
GEOGRAPHIC INFORMATION SYSTEM
INTERACTIVE WEBSITE
_________________
A Project
Presented
to the Faculty of
California State University, Chico
_________________
In Partial Fulfillment
of the Requirements for the Degree
Master of Arts
In
Geography
__________________
By
Heidi Marie Ogle
Fall 2012
iii
PUBLICATION RIGHTS
No portion of this thesis may be reprinted or reproduced in any manner
unacceptable to the usual copyright restrictions without the written permission of the
author.
iv
DEDICATION
For my mother and father,
Marilyn and Rolla Ogle.
v
ACKNOWLEDGMENTS
This thesis project would have never been attempted nor concluded without
the support of my good friend, mentor, and thesis advisor, Dr. Eugenie Rovai. She
believed in me and saw me through a project that clearly persisted much longer than
anticipated. She never gave up on me and was always willing to spend time making sure
it was all coming together. You are a rock star, Doc! Thanks for being my friend.
I am also grateful for my other two thesis committee members, Dr. Scott
Brady and Pam Figge. Their friendship and guidance could always be counted on and
their trust in my abilities has raised my confidence that this whole effort was truly worth
the time invested.
I raise my glass to a great friend and GIS confidant, Sylvie Cares. The
countless hours spent brainstorming, troubleshooting, and geeking out have meant the
world to me. Love you girl!
I owe a good deal of gratitude to ESRI Product Engineer and all around
Javascript guru, Kelly Hutchins. Having no programming background whatsoever before
biting off significantly more than I could initially chew, Kelly cheered me on and picked
me up when I fell. Thanks Kelly!
An additional debt of gratitude is owed to Candace Grubbs and the good folks
at the Butte County Recorder’s Office. This project is more robust and compelling
thanks to the inclusion of digital images of the deeds. I appreciate your patience and
assistance helping me gather all the images used in this project.
vi
Thanks to Randy Needham at the Geographic Information Center and Cathie
Benjamin at CSU Chico for serving up my geospatial data. I appreciate your patience
and helping me as I waded through this jungle.
The Chico Heritage Associate has given their blessings to include their work
as hyperlinks in this project for which I owe another debt of gratitude. But more
importantly, I’d like to take this opportunity to thank them all for the work they have
done over the past 30 years to preserve the proud heritage and charm of Chico.
Finally, Deb Besnard and George Thompson in Special Collections at CSU
Chico have been incredibly accommodating and helpful throughout this project. Thank
you for opening up your collections and encouraging me through to see this through to its
completion.
vii
TABLE OF CONTENTS
PAGE
Publication Rights ....................................................................................................... iii
Dedication ................................................................................................................... iv
Acknowledgments....................................................................................................... v
List of Tables .............................................................................................................. ix
List of Figures ............................................................................................................. x
Abstract ....................................................................................................................... xi
CHAPTER
I. Introduction to the Study ................................................................................ 1
Project Statement and Objectives ............................................................. 3 Plan of Development ................................................................................. 3 Summary ................................................................................................... 4
II. Review of Literature ....................................................................................... 5
III. Definition and Temporal Resolution of the Project Area ............................... 10
History of Chico ........................................................................................ 12 Historic Preservation Movement in Chico ................................................ 13 Summary ................................................................................................... 14
IV. Selected Source Material ................................................................................ 15
Historical Maps ......................................................................................... 16 Ownership Records ................................................................................... 19 Population Data ......................................................................................... 19
V. Creating the Chico Historical GIS .................................................................. 23
Historical Maps ......................................................................................... 25 Ownership Records ................................................................................... 27 Population Data ......................................................................................... 31 Historical Photographs .............................................................................. 34 Contemporary Historic Resource Documentation .................................... 35 Ancillary Vector Data Layers ................................................................... 36 Summary ................................................................................................... 37
VI. Web Mapping and Visualization .................................................................... 38
Preparing the Chico Historical GIS for the web ....................................... 39 Website Design and Construction ............................................................. 43 Web Map Functionality ............................................................................ 46 Limitations ................................................................................................ 48 Summary ................................................................................................... 48
VII. Conclusions ................................................................................................... 49
A. Definition of Terms .............................................................................. 63 B. Chico Historical GIS website screen captures ..................................... 67
ix
LIST OF TABLES
TABLE PAGE
1. Acquired Sanborn Fire Insurance Maps ............................................................. 18
2. Chico Historical GIS Spatial Data Layers .......................................................... 39
x
LIST OF FIGURES
FIGURE PAGE
1. Location of the project area in Chico, California ............................................... 11
2. Sanborn map example ......................................................................................... 17
3. Chico Historical GIS in an ArcGIS map document ............................................ 24
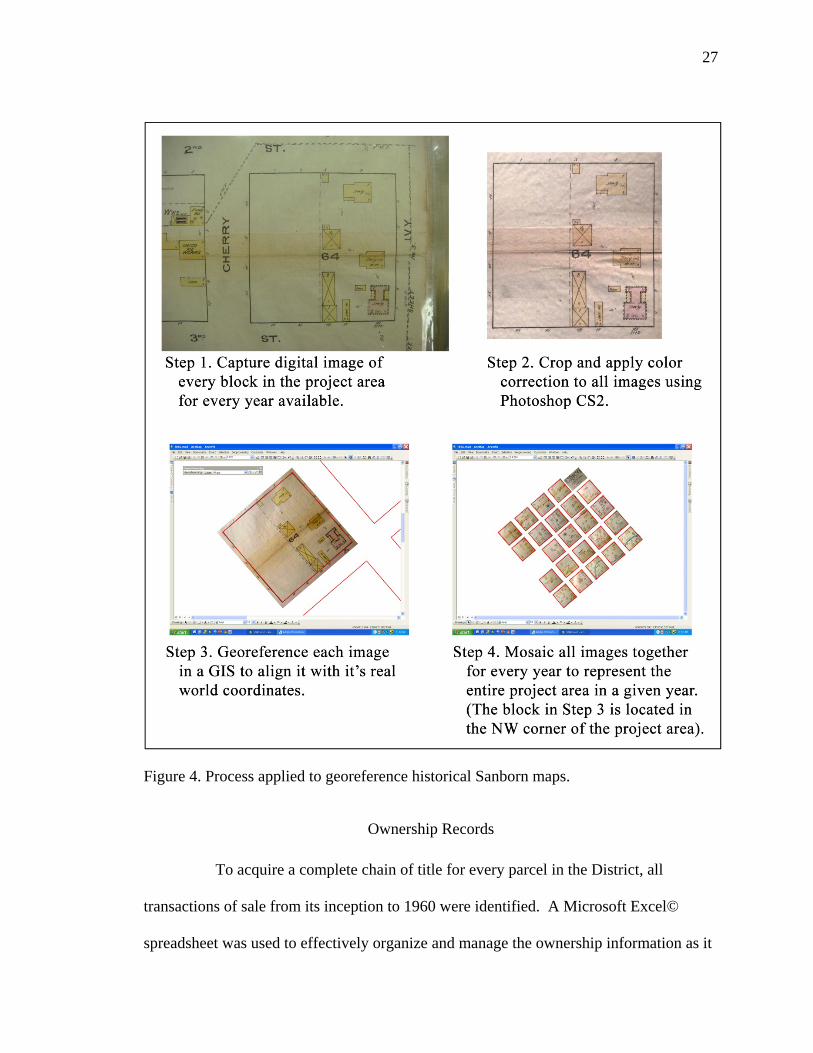
4. Process applied to georeference historical Sanborn maps .................................. 27
5. Ownership records GIS layer derivation ............................................................. 29 6. Reconfiguration of ownership records spreadsheet ............................................ 31 7. Population data GIS layer derivation. ................................................................. 33
8. Time tab .............................................................................................................. 41
9. Web map data publish and retrieval structure. .................................................. 43
10. Developing environment in Notepad++. .......................................................... 45
11. Chico Historical GIS web map page. ................................................................ 47
12. Website visitor flow and usages. ...................................................................... 55
xi
ABSTRACT
CHICO HISTORICAL
GEOGRAPHIC INFORMATION SYSTEM
by
Heidi Marie Ogle
Master of Arts in Geography
California State University, Chico
Fall 2012
Web mapping applications have been emerging throughout the internet in
recent years, crossing disciplinary lines to investigate places from an innovative and
interactive platform. These pioneering endeavors empower the individual to visualize
past places using a dynamic and creative environment. Archival data sources provide a
wealth of information to experienced scholars with proficient historical research skills but
they are rarely used by the general public. This project is an interdisciplinary approach to
research, combining historical scholarship and geospatial technology to examine the past.
The Chico Historical Geographic Information System (GIS) is a time-enabled spatial
analysis research tool that allows public access to historical maps, ownership records,
xii
population data, historical photographs and contemporary historic resource
documentation centralized into one integrated information management system.
Deployed from a cartographic perspective using an interactive and user-friendly website
interface, it is designed and developed for a wide variety of people with varying degrees
of technical skill. The South Campus Historic District, Chico’s original residential
neighborhood and the project area selected for this study, was listed on the National
Register of Historic Places in 1991. The Chico Historical GIS is designed to investigate
the neighborhood history, from its inception when the first lots were sold in 1862 through
to the end of the historic period in 1960. This project discourse describes the techniques
used to cultivate selected source material, create the Chico Historical GIS and visualize
these resources over the internet. This discussion will conclude with a brief analysis of
website visitor use and some future recommendations for further expansion of the
project.
1
CHAPTER I
INTRODUCTION TO THE STUDY
Geographic Information Systems (GIS) are used to manipulate and analyze
spatial data stored in layers that demonstrate both what and where features are located
(Gregory 2003). Adopted by planners and land managers to assess environmental
impacts, model geographical distribution, and investigate landscape pattern, GIS
combines conventional cartography and rich spatial datasets developed from disparate
data sources. The result is an information management system proficient as an effective
research tool for a range of academic disciplines. Recent advances in geographic
information technology are changing the method by which place is examined (Bailey and
Schick 2009).
Social scientists endeavor to encapsulate the essence of place using a myriad
of media. Historians use books, geographers use maps, photographers use images, yet
none of these interpretations entirely explore the story of a place. In much the same way
as a traditional GIS, a historical GIS stores spatially and temporally referenced objects,
integrated to represent landscape change through time. It is ideally suited as a research
tool for historic inquiry because any single event is frequently defined by layers of forces.
A historical GIS employs an interdisciplinary approach to research, combining historical
scholarship and GIS technology to examine the past with an emphasis on the
geographical aspects of research questions (Gregory and Ell 2007). Essentially, a
2
historical GIS adds when to a traditional GIS as landscape change can be examined over
time exposing unknown, unconsidered or unacknowledged processes previously
inconceivable solely within the frameworks of books, maps and images (DeBats and
Gregory 2011). Processes playing out across many scales through complex human
interactions that result in patterns of landscape change can now be visualized and
understood in a historical GIS. The temporal and spatial unification that historical GIS
provides has changed the way we can work with archival data, revealing relationships
that are indistinguishable when textual or graphical resources are analyzed independently
(Audisio, Nigrelli and Lollino 2009, Alhasanat, et al. 2012).
While GIS has enjoyed a central role in planning and land management for
decades, it has largely remained out of reach to the public who are most affected by
decisions made through its use. The development and deployment of a successful GIS is
time and resource intensive and its practitioners are highly skilled specialists who have
invested many years of training (Rodriguez, Sirmans and Parks 1995). While this
continues to be true, GIS data is now being made available to the public through the
internet with no GIS background knowledge required. Web maps are being created by
GIS professionals and employed by popular audiences at astounding rates, enabling them
to understand and make more informed decisions about the world around them (M.
Brovelli, et al. 2012).
The logical transition for any historical GIS is to harness the power of the
internet to make the information available to a wider audience. The development of a
compelling and useful historical GIS is an enormous investment of time that would
largely go unrealized should it remain limited in access to GIS professionals alone.
3
The unparalleled access to information granted by cloud computing coupled with
enhanced efficiency of web maps, public audiences are becoming increasingly adept at
manipulating them.
Project Statement and Objectives
The Chico Historical GIS is an interactive website designed, developed and
deployed in an easily accessible and intuitive mapping platform for a wide variety of
people with varying degrees of technical skills and interests. Its goal is to provide
citizens, researchers, public policy makers and planners with the tools to learn about and
appreciate Chico’s proud heritage. It introduces the audience to a new medium through
which to study the cultural landscape. It brings the historical geography of the study area
to life by exhuming the documents and photographs of its forgotten residents.
Plan of Development
This project discourse covers the creation of the Chico Historical GIS and
discusses how this web mapping technology has empowered the public to explore urban
landscape change. The first chapter introduces the study and provides background
information on historical GIS and web mapping. Chapter II identifies other historical
GIS and web mapping projects and literature relevant to this research. Chapter III
introduces the project area, its history and local preservation achievements. Chapter IV
identifies selected archival source material compiled to develop a comprehensive
collection of historical documentation and Chapter V discusses how those resources are
realized in a historical GIS. Chapter VI discusses how a historical GIS is visualized for
mass consumption on the web and highlights considerations unique to web mapping of a
4
historical GIS. Finally, Chapter VII discusses the conclusions of this study including
some future recommendations. Appendix A contains a list of defined terms and
Appendix B illustrates the final product with website screen captures.
Summary
Advancements in geospatial technology, information management systems,
cartographic visualization and cloud computing can be used to explore landscape change.
Publicly available archival materials are abundant sources of historical information that
can be transformed to create a compelling new model for historical research. This
research project demonstrates how historical GIS and the internet can be combined to
create a new platform from which to investigate an urban landscape throughout its
formative years.
5
CHAPTER II
REVIEW OF LITERATURE
Integration of temporal modeling inside a GIS was slow to develop, so early
adoption of GIS by historical geographers was very rare and web applications developed
through its use were virtually non-existent. Much of the early literature discussed the
concept of studying time and space from a comprehensive framework merely in theory,
concluding with no tangible projects or manuals of instruction for substantive
applications (Cartwright 1997). A secondary influx of literature developed through the
computer science community focused on the physical development of the software (Ott
and Swiaczny 2001). These early compositions brought some awareness to the
development of a new model by which to study landscape change and subsequently
modest projects and research designs began to surface.
Though GIS users were looking to incorporate historical information into their
spatial datasets, often the only available technique was to simply add a time field
whereby a filtering process could be employed to eliminate query results outside the
desired time period. Incremental or transactional dataset archiving was frequently
accomplished using this technique. Analysis was nearly impossible and visualization was
cumbersome and ineffective. Exporting multiple maps presenting an array of time slices
was often the only means by which time could be visualized using a GIS. Christine
Crown (Crown 1995) and Lora Richards (Richards 1999) designed historical GIS
6
projects around the California cities of Chico and Truckee respectively. The former
sought to make the study available to the public through a CD-ROM, an effort inhibited
by proprietary software, while the latter documented her findings in a thesis. Both
pioneering enterprises of their time, visualization of these achievements lacked
illustration and the breadth of the exercise was not fully unrealized.
Attempts to publish historical GIS to the internet was accomplished in tandem
with the advancement of cloud computing. Explicitly titled a historical GIS, the first web
applications to incorporate historical geography and GIS came in the form of large,
national scale historical mapping projects. Secured by funding streams, these projects
were designed to develop large datasets that may be analyzed on the web or downloaded
and manipulated by a GIS specialist. These include the Great Britain Historical GIS
(Gregory and Southall 2002), the China Historical GIS (Bol 2007), and the National
Historical GIS here in the United States (Fitch and Ruggles 2003). Predominantly
focused on serving historical census datasets, the majority of the literature produced
regarding these endeavors concentrated on administrative boundary changes and
aggregated datasets. Largely academic exercises, these early pursuits resulted in little
more than repositories for historical TIGER files, of little practical value to researchers
who lacked training in GIS.
With the innovation of ESRI’s ArcIMS platform in 2000, a few small project-
based historical GIS mapping applications began to surface around the internet. The
Urban Transition Historical GIS Project explored the development of cities at the end of
the 19th century and the early 20th century using census data (Brown University,
Department of Sociology n.d.). The Lewis and Clark Historic Landscape Project was
7
designed to publish all available maps and manuscript information during their journey
across Missouri to the internet using an ArcIMS platform (University of Missouri-
Columbia, Department of Geography n.d.).
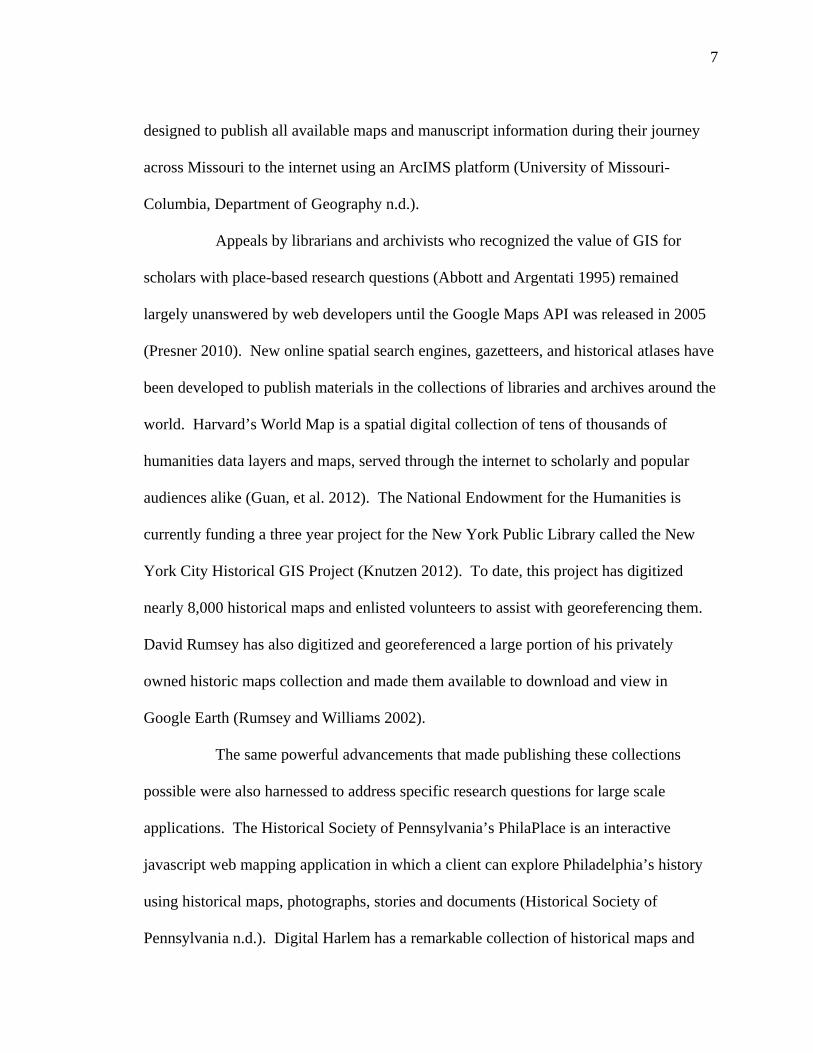
Appeals by librarians and archivists who recognized the value of GIS for
scholars with place-based research questions (Abbott and Argentati 1995) remained
largely unanswered by web developers until the Google Maps API was released in 2005
(Presner 2010). New online spatial search engines, gazetteers, and historical atlases have
been developed to publish materials in the collections of libraries and archives around the
world. Harvard’s World Map is a spatial digital collection of tens of thousands of
humanities data layers and maps, served through the internet to scholarly and popular
audiences alike (Guan, et al. 2012). The National Endowment for the Humanities is
currently funding a three year project for the New York Public Library called the New
York City Historical GIS Project (Knutzen 2012). To date, this project has digitized
nearly 8,000 historical maps and enlisted volunteers to assist with georeferencing them.
David Rumsey has also digitized and georeferenced a large portion of his privately
owned historic maps collection and made them available to download and view in
Google Earth (Rumsey and Williams 2002).
The same powerful advancements that made publishing these collections
possible were also harnessed to address specific research questions for large scale
applications. The Historical Society of Pennsylvania’s PhilaPlace is an interactive
javascript web mapping application in which a client can explore Philadelphia’s history
using historical maps, photographs, stories and documents (Historical Society of
Pennsylvania n.d.). Digital Harlem has a remarkable collection of historical maps and
8
data layers enlightening its users about the everyday lives of Harlem residents between
1915 and 1930 (University of Sydney, Australia, Department of History n.d.). Art
departments from both Columbia University and Vassar College teamed up to publish
Mapping Gothic France, an interactive javascript web mapping and timeline application
comprised of images, texts, charts and historical maps (Columbia University Media Art
Center and Vassar College Art History Department n.d.). This graphically stunning
website invites the user to “explore the parallel stories of gothic architecture and the
formation of France in the 12th and 13th centuries.” Powered by ESRI’s ArcGIS for
positively identified census record was captured to be included in the website.
A new vector data layer titled “Census” was derived from the “Owner” layer.
The “Census” layer was composed of parcels that corresponded to the census entries in
spreadsheets described above. For example, Thomas and Mary Bicknell owned their
home for 40 years from 1897 through 1937 (see figure 7). All matching census entries
33
during those 40 years were merged to the corresponding parcel in the new “Census”
vector data layer. In the example provided in figure 7, the time slider in the Chico
Historical GIS was set to October 1, 1901, during the period in which the Bicknell family
owned the property at the corner of 5th and Hazel streets. This figure illustrates how the
“Census” data layer was derived from the “Owner” data layer.
Figure 7. "Owner" and "Census" data layer entries for Bicknell Family.
34
Irrelevant fields from the “Owner” vector data layer were removed, including
links to the deeds and alphanumeric transaction dates. The date fields from the “Owner”
layer, however, were retained to allow the “Census” layer to become time-enabled and
operate with the time slider. A detailed discussion about how the time slider works will
be addressed in greater detail in the next chapter where web mapping and visualization
will be presented. The spreadsheet was converted to a table and merged with the new
“Census” data layer. Finally, any additional surnames acquired through census research
were added to corresponding owners in the “Owner” vector data layer.
Historical Photographs
Historical photographs of residents and the structures within the District create
visual texture of the neighborhood through time. To find digital images of District
residents, the “Owner” and “Census” vector data layers were merged to provide a
cumulative list of District residents. All names from the two layers were used to search
the Digital Historic Photographs Collection at California State University, Chico. Where
maiden and married names were uncovered through research, both surnames were used in
unique searches to identify photographs associated with the individual. When an image
of a resident was positively identified, an entry was made in a new spreadsheet. This new
spreadsheet contained fields for the name of the resident, the internet address of the
image, the internet address of the image citation and a unique identification number to
match to the corresponding parcel in the GIS.
At the conclusion of the search for all photographs of District residents, the
spreadsheet was merged with the “Owner” and “Census” data layers to create a new
35
“Photo_Person” vector data layer. To enable time on this layer, the date fields were
retained and all other data irrelevant to the personal photographs layer were removed.
Finally, new surnames acquired through this research were incorporated in both the
“Owner” and “Census” vector data layers.
To find historic photographs of structures in the District, a variety of search
techniques were used. Since street address changes occurred across the District
throughout the historic period, photos of structures could not be found simply by
searching by street addresses. The variation of data entry methods and categorical
aggregation techniques applied by Special Collections as well as limited citation
information provided by the image’s author presented challenges for locating images.
All digital photographs from the John Nopel Collection, managed by Special Collections,
were reviewed. Different categorical subheadings were applied to images in the Digital
Historical Photographs Collection. All digital photographs linked to the “Chico, Calif. –
Buildings, Structures, etc. – photographs” subheading were examined. All photographs
linked to the “Dwellings – California – Chico – photographs” subheading were also
surveyed. When a structure was positively identified, an entry was made in a new
spreadsheet. This new “Structures” spreadsheet contained fields for the internet address
of the image, the internet address of the image citation and a unique identification
number matching to the corresponding parcel in a GIS. The APN was used as the unique
identification number to merge the spreadsheet to the Butte County parcel vector data
layer and the entry’s corresponding parcel in a GIS. This merge created the new
“Photo_Structure” vector data layer.
36
Contemporary Historic Resource Documentation
Parcels within the District boundary were selected from the Butte County
parcel vector data layer to create the new “District” vector data layer. This new
“District” layer would come to contain the contemporary historic resource documentation
described in Chapter III. Zoning and other irrelevant fields were removed retaining only
the street address and APN fields. A new attribute field was added and populated with
hyperlinks to digital photos taken by the author on December 25th, 2011. New fields
were also created and populated with corresponding hyperlinks to digital copies of the 41
matching Historic Resource Inventory forms and the 166 National Register nomination
property descriptions. A new field, populated with the historic integrity classification
listed on the National Register nomination property descriptions, was also added for each
structure. Finally, all irrelevant fields were removed maintaining only the address, APN,
classification, hyperlinked photos, hyperlinked HRI forms and hyperlinked National
Register descriptions.
Ancillary Vector Data Layers
Two additional vector data layers were created during construction of the
Chico Historical GIS. The “Boundary” and “Owner_Opaque” vector data layers were
constructed for visual purposes only. Their contributions to the project area described
below and complete the discussion about all data layers created for the Chico Historical
GIS.
The “Boundary” vector data layer was created from a paper map included in
the South Campus Historic District National Register nomination documentation. This
37
layer contains no attribute information and is not time-enabled. It was constructed to
delineate the project area. In all figures in this project discourse and in the Chico
Historical GIS web map, this layer is shown as a red line around the project area.
The “Owner_Opaque” vector data layer was created for functionality in the
web mapping component of this project. It contains the exact same information as the
“Owner” vector data layer but is rendered transparent in both the ArcMap document and
the Chico Historical GIS web map. It was created merely to assist with a programming
complication in javascript.
Summary
Historical Sanborn maps were digitized and georeferenced into 13 raster data
layers that became optional base maps. Seven vector data layers were constructed from
primary and secondary source materials during research and development of the Chico
Historical GIS. Information gleaned from these resources was added to spreadsheets that
were eventually merged into new vector data layers. All 20 of these new data layers were
created from research conducted at a variety of repositories and were integrated into a
GIS to create one centralized information management system. The historical data from
which these data layers were derived have also been made available to the user through
digital copies in hyperlinks. This compilation of data is available nowhere else as it was
created specifically for this project.
38
38
CHAPTER VI
WEB MAPPING AND VISUALIZATION
Archival data sources provide a wealth of information to experienced scholars
with proficient historical research skills but they are rarely used by the general public.
This disparity results from a lack of training and an overwhelming response when
presented with stacks of historic documentation. A key objective of this project has been
to design a comprehensive website for the Chico Historical GIS that could be understood
and navigated by anyone, regardless of their background in historical research
methodology or GIS.
This chapter details the procedures undertaken to visualize and effectively
publish historical GIS data over the internet. The discussion begins with the process by
which the historical Sanborn maps are included. It is followed by addressing how the
“Owner” vector data layer is displayed and how time changes are represented on the web
map. Finally, functionality of the transparent vector data layers, including the “Census”
population layer, the “Photo_Person” and “Photo_Structure” historic photos layers, and
“District” contemporary resource documentation layer, will be addressed. The following
table (table 2) provides an overview of all the data layers created during development.
The table also includes whether or not layers are time-enabled and how they are
displayed in the Chico Historical GIS. This chapter will conclude with a discussion of
website design, construction and functionality.
39
Table 2. Chico Historical GIS geodatabase spatial data layers
Layer Name Data Format Time-Enabled Visible
Boundary Vector No Yes
Photo_Person Vector Yes Transparent
District Vector No Transparent
Census Vector Yes Transparent
Owner_Opaque Vector Yes Transparent
Photo_Structure Vector No Transparent
Owner Vector Yes Yes
Sanborn_1960 Raster No Optional
Sanborn_1957 Raster No Optional
Sanborn_1956 Raster No Optional
Sanborn_1954 Raster No Optional
Sanborn_1952 Raster No Optional
Sanborn_1941 Raster No Optional
Sanborn_1938 Raster No Optional
Sanborn_1921 Raster No Optional
Sanborn_1909 Raster No Optional
Sanborn_1902 Raster No Optional
Sanborn_1890 Raster No Optional
Sanborn_1886 Raster No Optional
Sanborn_1884 Raster No Optional
Preparing the Chico Historical GIS for the web
All data layers incorporated in the Chico Historical GIS geodatabase are
added to a new ArcGIS map document. The Sanborn Fire Insurance Map raster data
layers are added on the bottom with the most current map layer on top (see figure 3).
These raster data layers are not time-enabled as they represent a single point in time and
as such, are not assigned a time span.
40
The “Owner” vector data layer is added just above the 1960 Sanborn map. To
visually delineate the property lines while still allowing for viewing of the Sanborn maps
below, a hollow cartographic representation is applied to all parcels in the “Owner”
vector data layer. This hollow cartographic representation encircles the parcel but does
not obstruct viewing other layers below. Bold primary colors are assigned to parcels
based on sale succession, each one located on the opposite end of the color wheel from
the next. For example, the cartographic representation for the first owner of a parcel is a
hollow purple polygon. The following representation for next owner of the parcel is
brown. The third is blue, and so on. By assigning a stark color variation to parcels
chronologically, the user is visually alerted to a change in ownership.
For each parcel in the “Owner” vector data layer, there is a opening and
closing date for which those parcels are valid. By enabling time on the “Owner” data
layer, the time slider (a tool built into ArcGIS 10.x) can be used to visualize this temporal
data (see figure 8). Since time is enabled on the “Owner” layer, each parcel turns on or
off depending on the time selected by the time slider. For example, Park Henshaw
owned the southern half of Block 69 from June 10, 1902, until July 18, 1916. Because
time is enabled on the “Owner” vector data layer, the parcel associated with that period of
ownership will only be visible when the time slider is set between those two dates. If the
time slider is set before or after those dates, a different parcel will appear, representing a
different ownership.
41
Figure 8. Time tab of the properties dialog box for the "Owner" vector data layer Time is also enabled on the “Census” data layer. As discussed in the previous
chapter, census entries were assigned a time span based on the period of ownership that
corresponded to that census record. For example, since Park Henshaw owned the
southern half of block 69 from 1902 to 1916, the corresponding census record for 1910 is
valid during that same period of ownership from 1902 to 1916, not just during 1910. The
spatial representation of the “Census” vector data layer is transparent, however, results
are still returned when the user clicks one of the parcels.
42
Transparency is also applied to both historic photographs layers
(“Photo_Person” and “Photo_Structure”) though geometry is still active and attribute data
is available by clicking on a parcel. Time is enabled on the “Photo_Person” data layer to
connect the person in the photograph with the “Owner” or “Census” data layers with
which they correspond. Time is disabled on the “Photo_Structure” data layer for two
reasons. First, dates documenting when the photographs were taken are not always
known. Second, users seeking these images are most likely interested in seeing all
available images for a particular structure regardless of time selected on the time slider.
The “District” vector data layer is also transparent but available to a user by
clicking on a parcel. Time was not enabled on this data layer because all documentation
in this layer occurred after the end of the historic period in 1960. As is the case of the
“Photo_Strutcure” vector data layer, users are interested in this information regardless of
the time selected on the time slider.
Finally, on top of all other data layers, the “Boundary” layer is added to
delineate the District using a red line. Time was also not enabled on this data layer and
no data is associated with this data layer. Also, as mentioned in the previous chapter, the
“Owner_Opaque” vector data layer is added. This data layer is a copy of the “Owner”
vector data layer, included for programming purposes in the web map. Transparency is
applied to the layer and it is time enabled.
A map service was generated from the map document and the geodatabase.
By publishing the Chico Historical GIS to a map service, each of these data layers is
available to be pulled into a web mapping application and made publicly accessible on
43
the internet. Figure 9 illustrates how the geographic data is sent to the user through the
ArcMap document and, in turn, a map service.
Figure 9. Method used to publish and retrieve data from the Chico Historical GIS to the web map.
When a user interacts with the web map, the map service requests information from the
ArcMap document and, in turn, the geodatabase and returns that information to the user.
The map service is hosted on a server at the Geographic Information Center, an auxiliary
unit of California State University, Chico.
Website Design and Construction
A folder was created to house the non-spatial data in the root directory on the
main server at California State University, Chico. By hosting the non-spatial data for the
website in the root directory, the website will persist after the author concludes her
studies at the California State University, Chico. The website template was acquired
from the Information Technologies Support Services Department at California State
University, Chico. This template is composed of a HTML text file, a folder containing
CSS style pages and a corresponding images folder. The template is designed to be
flexible, to meet the needs of all departments and organizations across the campus while
maintaining a cohesive and similar style.
44
The template was modified to support supplementary pages of the website.
These supplementary pages include the home page, the background page, the resources
page and the about page (see appendix B). The home page includes text about historical
GIS and general information the website. The background page contains a project area
description, a brief local history and an introduction to the historic preservation
movement in Chico. The resources page provides information about the selected source
material and the about page presents biographical information about the author and those
who assisted in the creation of the project.
A great deal of modification to the template was necessary to create the web
map page. The template was designed to display information using a predetermined pixel
width. Though this design is convenient for developing a template that can be used by a
wide variety of departments, screen availability is wasted on users with large screens. To
maximize users screen availability, the web map page is designed using percentages,
rather than pixels, to instruct the web browser how the information should be presented to
the user. Regardless of the user’s screen size, all the elements on the web map page
difference between two time stamps generated by a user during site navigation between
pages. Page visit duration statistics, therefore, were not generated for the final page
visited by a user. This analytical information would have been most illuminating for the
map page because visit duration could easily indicate the success to which a user was
able to interact with the page and use it as a research tool. Visitors to the map page
54
exited the website entirely 55% of the time concluding their visit; therefore, duration was
not calculated for time spent on the map page.
Figure 12 illustrates a flow chart that examines how users moved through the
website during the first two weeks after it was launched. Of the 248 visits to the website,
219 visitors first arrived at the home page. Of visitors who landed on the home page,
28% left immediately and did not continue to other pages. These drop offs were often
mobile device users or visitors who had received notification about the website and were
simply not intrigued by the subject matter or could not manipulate site to their
satisfaction. The remaining 157 visitors (72%) continued on to visit other pages in the
website. Of continuing visitors, 92 visitors (59%) went directly to the map page, of
which 64% left the site entirely at the conclusion of their research. Forty-nine visitors
(30%) went on to the background page to learn about the history of Chico and 42 of them
continued to the map page. Of those who traversed the website from the home page to
the background page and then to the map page, 44% left the website entirely following
their visit to the map page.
Visitor usage indicates that the objective of this research was achieved and
evidence to support this claim will continue to build as statistics continue to accumulate.
Returning visitation indicates not only interest in the subject matter but understanding of
how this material is organized and presented to the user. Average page visitation of three
pages per visitor indicates the audience is interested in the subject matter and how the
project was constructed.
56
Future Recommendations
A wide variety of additional source material could be digitized, georeferenced
and incorporated into the Chico Historical GIS. Additional population data research
using the 1940 census, now available at the individual household level, would identify
more District residents. The Polk Directories would be an excellent extension as they
contain occupational information about residents in the District. Recently, the Library of
Congress and the National Endowment for the Humanities have begun a monumental
effort to digitize historic American newspapers and make them available over the internet
in a project titled “Chronicling America (Library of Congress n.d.).” This resource could
be researched to capture additional qualitative information about District residents.
A handful of historic neighborhoods in Chico have received little or no
recognition that could foster historic appreciation for these areas and perhaps invigorate
rehabilitation of deteriorating structures. The scalable nature of this project allows for
such development and would be an additional benefit.
A mobile application incorporating research accrued through this project
would be a valuable accessory to this study. A virtual tour guide or treasure hunt could
be deployed by instructors for use in the classroom to develop appreciation for Chico’s
oldest and nationally recognized neighborhood in which so many students live. As
mobile applications continue to become more powerful, interaction with handheld
devices will be an exciting and innovative avenue for exploration.
57
Summary
Historical research conducted during the early stages of this project recovered
a wealth of documentation of the study area. These resources were used to develop
unique spatial datasets served to popular and scholarly audiences using modern web
mapping technologies. The user-friendly website design encouraged visitors with
varying degrees of technical skill to interact with the material and investigate resources
associated with the neighborhood and its residents. Visitor usage results revealed
multiple page visitation and recurring traffic indicating interest and comprehension of the
material as visualized on the Chico Historical GIS website.
REFERENCES
58
REFERENCES
Abbiati, J. Lynn, interview by Heidi Ogle. Research Technician of Institutional Research (October 2012).
Abbott, Lisa, and Carolyn Argentati. "GIS: A New Component of Public Services."
Journal of Academic Librarianship 21, no. 4 (1995): 251-256. Alhasanat, Mahmoud Bashir, Shahid Kabir, Wan Muhd Aminuddin Wan Hussin, and
Erin Addison. "Spatial analysis of a historical phenomenon: using GIS to demonstrate the strategic placement of Umayyad desert palaces." GeoJournal 77 (2012): 343–359.
Audisio, Chiara, Guido Nigrelli, and Giorgio Lollino. "A GIS tool for historical
instability processes data entry: An approach to hazard management in two Italian Alpine river basins." Computers and Geosciences 35 (2009): 1735–1747.
Bailey, Timothy, and James B Schick. "Historical GIS: Enabling the Collision of History
and Geography." Social Science Computer Review 27, no. 3 (2009): 291-296. Bol, Peter K. "Creating a GIS for the History of China." In Placing History: How Maps,
Spatial Data, and GIS Are Changing Historical Scholarship, by Anne Kelly Knowles, 25-57. Redlands, CA: ESRI Press, 2007.
Brewer, William H. Up and Down California in 1860-1864: the Journal of William H.
Brewer. Edited by Francis P. Farquhar. Berkeley, CA: University of California Press, 1975.
Brovelli, Maria, Marco Minghini, Gianluca Giori, and Michele Beretta. "Web
Geoservices and Ancient Cadastral Maps: The Web C.A.R.T.E. Project." Transactions in GIS 16, no. 2 (2012): 125-142.
Brovelli, M. A., M. Minghini, and L. Valentini. "Web services and historical cadastral
maps: The first step in the implementation of the Web C.A.R.T.E. system." In Advances in Cartography and GIScience (Volume 2), by Anne Ruas, 147-161. Berlin: Springer, 2011.
Brown University, Department of Sociology. Urban Transition Historical GIS Project.
n.d. http://www.s4.brown.edu/utp (accessed October 20, 2012).
60
California State University, Chico, Meriam Library, Special Collections. Historical Photographs Collection. n.d. http://www.csuchico.edu/lbib/spc/netpages/hisphotos.html (accessed October 20, 2012).
Cartwright, William. "New Media and Their Application to the Production of Map
(accessed October 20, 2012). City of Chico. "General Plan Update." Draft Environmental Impact Report, Chico, CA,
2010. Columbia University Media Art Center and Vassar College Art History Department.
Mapping Gothic France. n.d. http://mappinggothic.org (accessed October 20, 2012).
Crown, Christine C. Geo-Chico: a geographic information system for historic resources
in downtown Chico. Master’s thesis, Chico: California State University, Chico, 1995.
DeBats, Donald, and Ian N. Gregory. "Introduction to Historical GIS and the Study of
Urban History." Social Science History 35, no. 4 (2011): 455-463. Fitch, Catherine, and Steven Ruggles. "Building the National Historical Geographic
Information System." Historical Methods 36, no. 1 (2003): 41-51. Gillis, Michael J., and Michael F. Magliari. John Bidwell and California: the life and
writings of a pioneer, 1841-1900. Spokane, WA: A. H. Clark Co., 2003. Google. Google Maps Street View. n.d.
http://maps.google.com/intl/en/help/maps/streetview/ (accessed October 20, 2012).
Gregory, Ian N. A Place in History: a Guide to Using GIS in Historical Research.
Oakville, CT: Oxbow Books Ltd, 2003. Gregory, Ian N., and Humphrey R. Southall. "Mapping British population history." In
Past Time, Past Place: GIS for History, by Anne Kelly Knowles, 117-130. Redlands, CA: ESRI Press, 2002.
61
Gregory, Ian N., and Paul S. Ell. Historical GIS: Technologies, Methodologies and Scholarship. Cambridge: Cambridge University Press, 2007.
Grosso, Eric. "Integration of historical geographic data into current georeferenced
frameworks: A user-centred approach." E-Perimetron 5, no. 3 (2010): 107-117. Guan, Weihe Wendy, Matthew Bertrand, Jeffrey Blossom, Peter Bol, Merrick Lex
Berman, and Benjamin Lewis. "WorldMap - a Geospatial Framework for Collaborative Research." Annals of GIS 18, no. 2 (2012): 121-134.
Historical Society of Pennsylvania. PhilaPlace. n.d. http://www.philaplace.org (accessed
October 20, 2012). Hunt, Rockwell D. John Bidwell: price of California pioneers. Caldwell, ID: Caxton
Printers, 1942. Knutzen, Matt. "The New York City Historical GIS Project." New York Public Library
Blog. June 13, 2012. http://www.nypl.org/blog/2012/06/13/nyc-historical-gis-project (accessed October 20, 2012).
LeHigh University, Digital Library. Beyond Steel. n.d.
http://digital.lib.lehigh.edu/beyondsteel/ (accessed October 20, 2012). Library of Congress. Chronicling America. n.d. http://chroniclingamerica.loc.gov/
(accessed October 20, 2012). Moon, Debra. Chico: life and times of a city of fortune. Charleston, SC: Arcadia
Publishing, 2003. National Register of Historic Places. South of Campus Neighborhood Historic District,
Chico, Butte County, California. National Register #91000636., Washington, D.C.: Department of the Interior, 1991.
Ott, Thomas, and Frank Swiaczny. Time-integrative geographic information systems:
management and analysis of spatio-temporal data. Berlin: Springer-Verlag, 2001. Presner, Todd. "Digital Harlem: Everyday Life, 1915-1930/Henry Hudson 400:
Celebrating the History of Hudson." Journal of American History 97, no. 3 (2010): 916-917.
Richards, Lora R. An historical geographic information system for Truckee, California.
Master’s thesis, Chico: California State University, Chico, 1999.
62
Rodriguez, Mauricio, C. F. Sirmans, and Allen P. Parks. "Using GIS to improve real estate analysis." Journal of Real Estate Research 10 (1995): 163-173.
Rumsey, David, and Meredith Williams. "Historical maps in GIS." In Past time, past
place: GIS for history, by Anne Kelly Knowles, 1-18. Redlands, CA: ESRI Press, 2002.
University of Missouri-Columbia, Department of Geography. Lewis and Clark across
Missouri. n.d. http://lewisclark.geog.missouri.edu (accessed October 20, 2012). University of Sydney, Australia, Department of History. Digital Harlem. n.d.
http://acl.arts.usyd.edu.au/harlem (accessed October 20, 2012).
APPENDIX A
64
DEFINITION OF TERMS
APN (Assessor’s Parcel Number): a number assigned to parcels of real property by the tax assessor of a particular jurisdiction for purposes of identification and record-keeping.
ArcGIS: ESRI’s mapping platform for working with maps and geographic information. It is used for: creating and using maps; compiling geographic data; analyzing mapped information; sharing and discovering geographic information; using maps and geographic information in a range of applications; and managing geographic information in a database.
ArcGIS Server: ESRI’s current web map server used to build web mapping applications and publish maps and geographic data to the internet.
ArcIMS: ESRI’s first web map server to publish maps to the internet. It has been
deprecated and replaced by ArcGIS Server. API (Application Programming Interface): a set of programming instructions and
standards for accessing a Web-based application. A software company releases its API to the public so that other software developers can design products that are powered by its service.
Attribute Table: A database or tabular file containing information about a set of
geographic features, usually arranged so that each row represents a feature and each column represents one feature attribute.
Bounce Rate: represents the percentage of visitors to a website who enter the site then
leave rather than continuing on to view other pages within the same site. Browser: platform used to access the World Wide Web – for example, Internet Explorer,
Firefox, Chrome and Safari. CSS (Cascading Style Sheet): used to style web pages written in HTML. Client: software that accesses a remote service on another computer. Cloud computing: the use of hardware and software that are delivered as a service over
the Internet.
65
Control points: One of various locations on a paper or digital map that has known coordinates and is used to transform another dataset—spatially coincident but in a different coordinate system—into the coordinate system of the control point. Control points are used in digitizing data from paper maps, in georeferencing both raster and vector data, and in performing spatial adjustment operations such as rubber sheeting.
ESRI (Environmental Science Research Institute): The industry standard and leading
worldwide supplier of GIS software and geodatabase management applications. Field: a column in a spreadsheet or database table. Gazetteer: a geographical dictionary or directory containing information concerning the
makeup of a county, region or continent as well as social statistics and physical features.
Georeference: to assign coordinates from a known reference system, such as
latitude/longitude, to the page coordinates of an image or a planar map. Google Maps: web mapping service application provided by Google, that powers many
map-based services embedded on many third-party websites. HTML (HyperText Markup Language): the main language for displaying web pages and
other information that can be displayed in a web browser. Historic Resource Inventory (HRI): maintained by Office of Historic Preservation (OHP)
includes only information on historical resources that have been identified and evaluated through one of the programs that OHP administers under the National Historic Preservation Act or the California Public Resources Code.
Hyperlink: a reference to data that the reader can directly follow. Javascript: World Wide Web scripting language supporting object-oriented, imperative,
and functional programming styles. Latency: a measure of the time delay experienced by a user when information is being
relayed from a client to a server and back again. Map Service: a GIS resource that is located on a server and is made available to client
applications through well-known communication protocols such as HTTP.
66
Mosaic: a raster dataset composed of two or more merged raster datasets—for example, one image created by merging several individual images or photographs of adjacent areas.
Python: a general purpose, high-level programming language that supports multiple
programming object-oriented paradigms. Raster: A spatial data model that defines space as an array of equally sized cells arranged
in rows and columns, and composed of single or multiple bands. Each cell contains an attribute value and location coordinates. Unlike a vector structure, which stores coordinates explicitly, raster coordinates are contained in the ordering of the matrix. Groups of cells that share the same value represent the same type of geographic feature.
Snippet: a short reusable piece of computer source code. Symbology: The set of conventions, rules, or encoding systems that define how
geographic features are represented with symbols on a map. A characteristic of a map feature may influence the size, color, and shape of the symbol used.
Time slice: one moment in time, as opposed to a time span that delineates a range of
time. TIGER (Topologically Integrated Geographic Encoding and Referencing): the
nationwide digital database developed for the 1990 census, succeeding the DIME format. TIGER files contain street address ranges, census tracts, and block boundaries.
Vector: A coordinate-based data model that represents geographic features as points,
lines, and polygons. Each point feature is represented as a single coordinate pair, while line and polygon features are represented as ordered lists of vertices. Attributes are associated with each vector feature, as opposed to a raster data model, which associates attributes with grid cells.
APPENDIX B
68
CHICO HISTORICAL GIS WEBSITE SCREEN SHOTS
This is the “Index” page. This is the first page in the series and contains information about GIS, historical GIS and the web map. This page can be found at: http://www.csuchico.edu/chicohistoricalgis/index.html.
69
This is the “Background” page. It contains some brief background information on the history of Chico and its historic preservation movement. It can be found at: http://www.csuchico.edu/chicohistoricalgis/background.html.
70
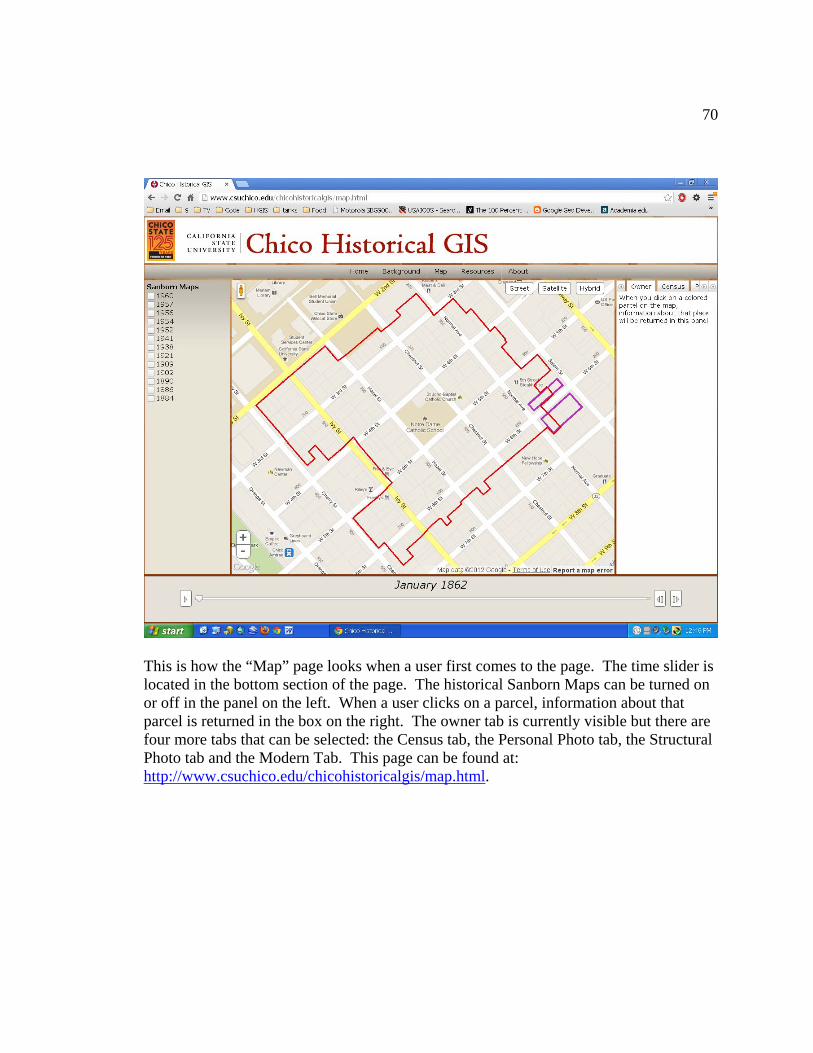
This is how the “Map” page looks when a user first comes to the page. The time slider is located in the bottom section of the page. The historical Sanborn Maps can be turned on or off in the panel on the left. When a user clicks on a parcel, information about that parcel is returned in the box on the right. The owner tab is currently visible but there are four more tabs that can be selected: the Census tab, the Personal Photo tab, the Structural Photo tab and the Modern Tab. This page can be found at: http://www.csuchico.edu/chicohistoricalgis/map.html.
71
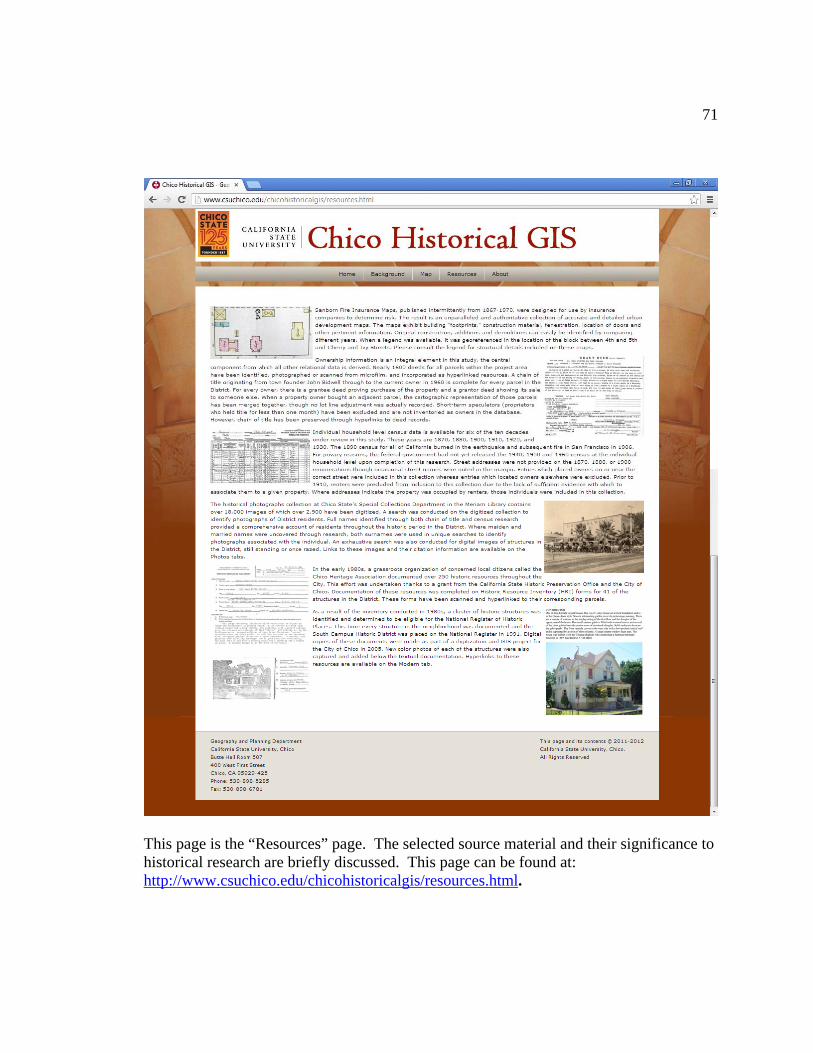
This page is the “Resources” page. The selected source material and their significance to historical research are briefly discussed. This page can be found at: http://www.csuchico.edu/chicohistoricalgis/resources.html.
72
This is the “About” page. Information about the author, faculty, and other contributors are included here. This page can be found at: http://www.csuchico.edu/chicohistoricalgis/about.html.