41
Hunua Quarry, Auckland INVESTOR PRESENTATION Bill Roest Chief Financial Officer October 2012

Hunua Quarry, Auckland
INVESTOR
PRESENTATION
Bill Roest Chief Financial Officer
October 2012

Investor Presentation | Fletcher Building | © October 2012 | Page 2
Disclaimer
This presentation contains not only a review of operations, but also some forward looking statements about Fletcher Building and the environment in which the company operates. Because these statements are forward looking, Fletcher Building’s actual results could differ materially. Media releases, management commentary and analysts presentations, including those relating to the 2012 Annual Results announcement, are all available on the company’s website and contain additional information about matters which could cause Fletcher Building’s performance to differ from any forward looking statements in this presentation. Please read this presentation in the wider context of material previously published by Fletcher Building.

Investor Presentation | Fletcher Building | © October 2012 Results Overview | Page 3
RESULTS OVERVIEW
Investor Presentation
ASB Wynyard Quarter, Auckland
Investor Presentation | Fletcher Building | © October 2012 Results Overview | Page 4
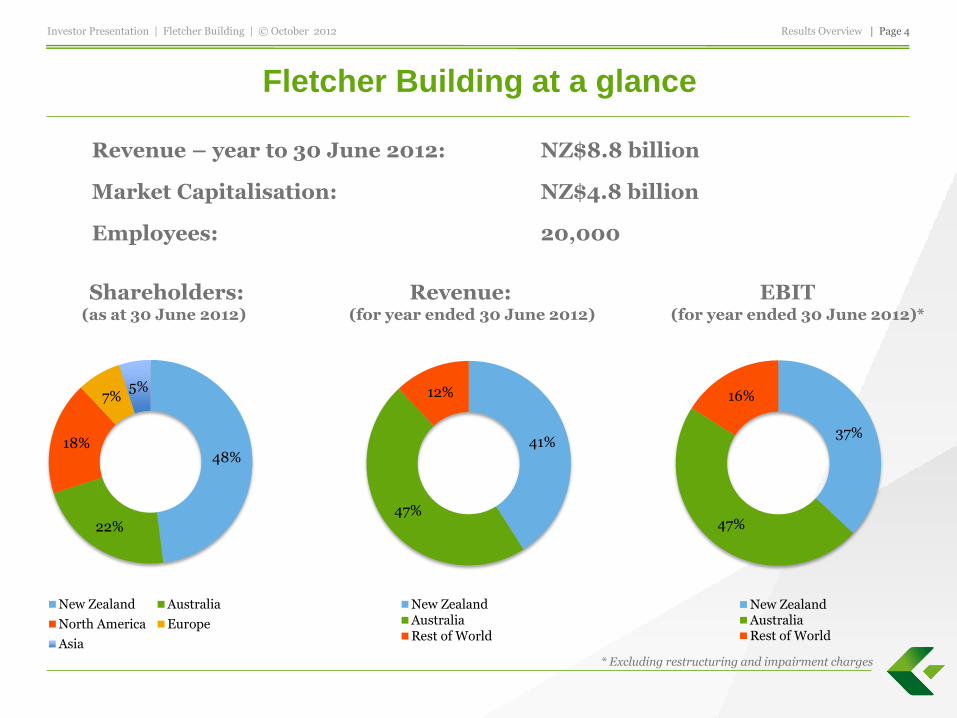
Fletcher Building at a glance
• Revenue – year to 30 June 2012: NZ$8.8 billion
• Market Capitalisation: NZ$4.8 billion
• Employees: 20,000
Shareholders: Revenue: EBIT (as at 30 June 2012) (for year ended 30 June 2012) (for year ended 30 June 2012)*
41%
47%
12%
New ZealandAustraliaRest of World
48%
22%
18%
7% 5%
New Zealand Australia
North America Europe
Asia
37%
47%
16%
New ZealandAustraliaRest of World
* Excluding restructuring and impairment charges

Investor Presentation | Fletcher Building | © October 2012 Results Overview | Page 5
Fletcher Building – key listing information
• Listed on the New Zealand and Australian stock exchanges
New Zealand • Largest listed company by market capitalisation on the NZX
Australia • Ranked #59 on the ASX
• Fletcher Building gained inclusion in the S&P/ASX 200 index in March 2011
US • Level I sponsored American Depository Receipt (ADR) programme launched December 2010
• Citi act as depository bank
• Ticker: FCREY CUSIP: 339305302

Investor Presentation | Fletcher Building | © October 2012 Results Overview | Page 6
Market leading businesses
Coated Steel Long Steel:
Reinforcing bar, mesh and wire
Scrap
Distribution
Construction
Construction
General Construction
Infrastructure Projects
Residential house development
Building Products
Plasterboard Insulation Roof Tiles Single Businesses:
Aluminium Sinkware
Laminates & Panels
Laminex
MDF Particleboard LPM HPL
Formica
HPL
Steel Concrete Crane
Pipelines – Manufacture & Distribution Trade Distribution Australia and NZ
Copper Tube – Manufacture & Distribution
Cement Readymix Aggregates Concrete Products Concrete Pipes Quarries
Distribution
Building Materials Distribution
59 PlaceMakers stores

Investor Presentation | Fletcher Building | © October 2012 Results Overview | Page 7
Residential consents in NZ and US improved whilst Australia
continued to slow
Building Consents
June 2012
12 months
June 2011
12 months
June 2010
12 months
12/11
%Mvmt
New Zealand
Residential Consents 15,414 13,539 16,167 +14
Non Res WPIP ($m)* 4,481 4,798 4,618 -7
Infrastructure WPIP ($m)* 6,823 6,599 5,919 +3
Australia Source: Statistics NZ, Infometrics
Residential Consents 145,057 164,251 171,429 -12
Non Res WPIP (A$Bn)* 31.8 34.8 34.9 -9
Infrastructure WPIP (A$Bn)* 117.6 86.8 76.7 +35
US Source: ABS, BIS Shrapnel
Residential (US$Bn)** 259.9 237.5 239.5 +9
Non Res (US$Bn)** 347.1 333.2 339.0 +4
Infrastructure (US$Bn)** 210.0 207.9 214.9 +1
Source: IHS Global Insight
* FY12 data includes estimate for month of June 2012 ** Information presented for calendar years. 2012 represents forecast position

Investor Presentation | Fletcher Building | © October 2012 Results Overview | Page 8
NZ housing consents – record low levels in the first half of
FY12, modest improvement in second half
12,000
14,000
16,000
Jun-09 Sep-09 Dec-09 Mar-10 Jun-10 Sep-10 Dec-10 Mar-11 Jun-11 Sep-11 Dec-11 Mar-12 Jun-12
Residential Consents 12 month moving average
Source: Statistics NZ

Investor Presentation | Fletcher Building | © October 2012
STRATEGY Investor Presentation
Strategy | Page 9
Crane pipelines (Iplex), Victoria

Investor Presentation | Fletcher Building | © October 2012 Strategy | Page 10
Strategy
Improved earnings reliability through geographic and end-market diversification
Decentralised business model
Portfolio approach that creates value through application of proven operating model
Target attractive industry positions in Australia and NZ
Medium term aim is to grow earnings from existing portfolio of businesses irrespective of the economic cycle
Further opportunities to invest in Australia and NZ will be pursued, along with Formica growth in Asia

Investor Presentation | Fletcher Building | © October 2012 Strategy | Page 11
Fletcher Building has a vertically integrated value chain
Laminates & Panels
Building Products
Shared Distribution
Other Distribution
Markets
Construction
Steel Concrete Other
Manufacturers
Dedicated Distribution
Pipes & Plumbing

Investor Presentation | Fletcher Building | © October 2012 2012 Financial Results | Page 12
2012 FINANCIAL RESULTS
Investor Presentation
Golden Bay Cement, Whangarei (NZ)

Investor Presentation | Fletcher Building | © October 2012 2012 Financial Results | Page 13
Weak NZ and Australian construction markets adversely
impacted earnings
NZ$m
June 2012
12 months
June 2011
12 months
% Change
Sales 8,873 7,416 +20
EBITDA¹ 786 801 -2
EBIT¹ 556 596 -7
Net earnings1 317 359 -12
Restructuring and impairment charges after tax
(132)
(76)
Net earnings 185 283 -35
EPS – cps1 46.5 57.1 -19
Dividend - cps 34.0 33.0 +3
1. EBITDA, EBIT, Net Earnings and EPS all before restructuring and impairment charges
Investor Presentation | Fletcher Building | © October 2012 2012 Financial Results | Page 14
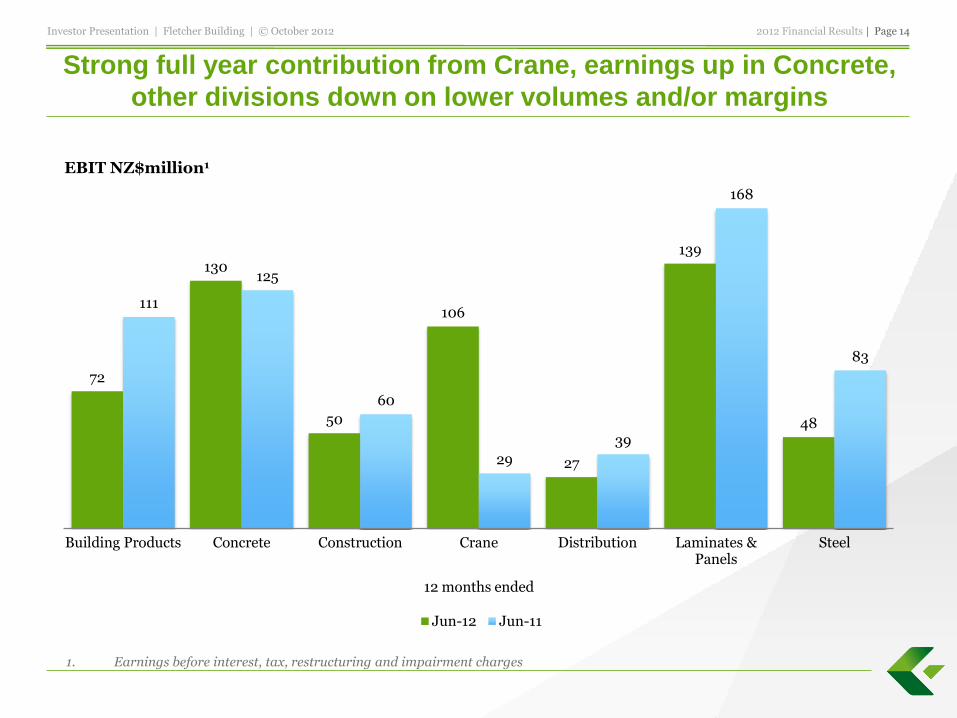
Strong full year contribution from Crane, earnings up in Concrete,
other divisions down on lower volumes and/or margins
72
130
50
106
27
139
48
111
125
60
29
39
168
83
Building Products Concrete Construction Crane Distribution Laminates &Panels
Steel
Jun-12 Jun-11
EBIT NZ$million1
1. Earnings before interest, tax, restructuring and impairment charges
12 months ended

Investor Presentation | Fletcher Building | © October 2012 2012 Financial Results | Page 15
Operating earnings before restructuring and impairment
charges – 1st Half compared with 2nd Half
6 months June 2012
(2nd half)
6 months Dec 2011
(1st half)
NZ$M Revenue EBIT Revenue EBIT
Building Products 315 29 355 43
Concrete 490 70 468 60
Construction 520 25 520 25
Crane 1,164 53 1,229 53
Distribution 411 12 402 15
Laminates & Panels 910 76 939 63
Steel 554 24 596 24
Corporate (10) (6)
Total 4,364 279 4,509 277

Investor Presentation | Fletcher Building | © October 2012 2012 Financial Results | Page 16
Cashflow from operations up 11%
June 2012
12 months
June 2011
12 months
% Change
EBITDA 633 697 -9
Funding costs (152) (122) +25
Cash tax paid (123) (86) +43
Non cash restructuring/impairment charges impact
122 89 +37
Provisions movement/other (23) (28) -18
Working capital movements:
- Debtors
- Creditors
- Stock
- Other
15
(115)
71
20
(9)
(42)
(50)
(52)
(4)
(148)
-136
+130
-237
-600
Cashflow from operations 448 402 +11

Investor Presentation | Fletcher Building | © October 2012 2012 Financial Results | Page 17
Key ratios
42
-43
14
24
14
-27
Jun-07 Jun-08 Jun-09 Jun-10 Jun-11 Jun-12
Total Shareholder Return (TSR) Percentage
1. Earnings before interest, tax, restructuring and impairment charges / average funds
22
40
31 27
34 35
Jun-07 Jun-08 Jun-09 Jun-10 Jun-11 Jun-12
Debt/Debt Plus Equity Percentage
25
19
12 13 13 10
Jun-07 Jun-08 Jun-09 Jun-10 Jun-11 Jun-12
Return on Average Funds Percentage¹

Investor Presentation | Fletcher Building | © October 2012 2012 Financial Results | Page 18
Budgeted capital expenditure to reduce in FY 13
200 207
162
205
230 246*
2011 2012 2013
1. Excludes acquisition of shares in Crane Group Ltd
* Budget
60
96
Growth Stay in business Acquisitions
363
June 12
12 mths
June 11
12 mths % ∆ FY13
Budget
Stay-in-business 207 200 +4 162
Growth¹ 60 51 +18 102
Acquisitions² 96 56 +71 0
Total 363 307 +18 264
Depreciation 230 205 +12 246
1. Forecast includes investment in new Formica plant in China 2. Excludes Crane in 1H11
102
264*
Depreciation
51
56
307
Capital Expenditure
*
Investor Presentation | Fletcher Building | © October 2012 2012 Financial Results | Page 19
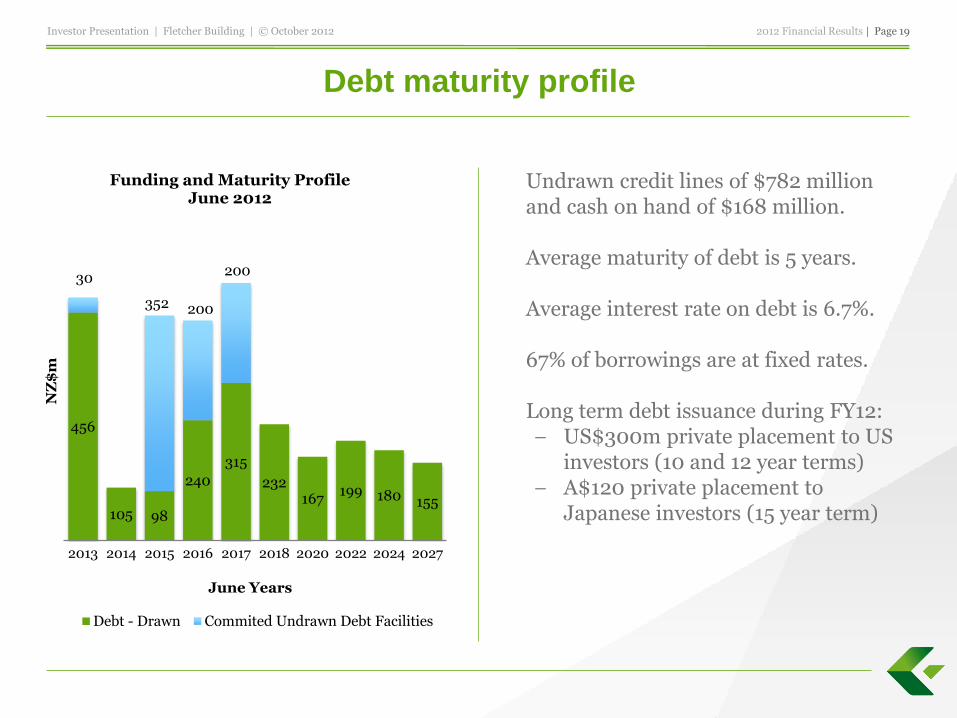
Debt maturity profile
• Undrawn credit lines of $782 million and cash on hand of $168 million.
• Average maturity of debt is 5 years.
• Average interest rate on debt is 6.7%.
• 67% of borrowings are at fixed rates.
• Long term debt issuance during FY12: − US$300m private placement to US
investors (10 and 12 year terms) − A$120 private placement to
Japanese investors (15 year term)
456
105 98
240
315
232 167
199 180 155
30
352 200
200
2013 2014 2015 2016 2017 2018 2020 2022 2024 2027
Funding and Maturity Profile June 2012
Debt - Drawn Commited Undrawn Debt Facilities
NZ
$m
June Years

Investor Presentation | Fletcher Building | © October 2012 2012 Financial Results | Page 20
Canterbury update
• Residential repairs for Earthquake Commission:
• 21 hubs established to carry out repairs
• Over 20,000 home repairs completed to date
• In addition, 45,000 emergency repairs and 16,400 winter heat installations completed
• Target is to have last of the 100,00 repairs completed by end of 2015
• Infrastructure repairs:
• Fletcher Construction one of 5 contractors in the alliance to repair Christchurch infrastructure
• Activity levels have been low due to planning work required, but momentum is now building
• Rebuilding Christchurch City Centre:
• Development plan for the new Christchurch central city area now finalised
• 70% to 80% of CBD buildings will be demolished

Investor Presentation | Fletcher Building | © October 2012 2012 Financial Results | Page 21
Restructuring and impairment charges
Year to 30 June 2012 Restructuring and impairments charges
NZ$ Million Before tax Tax After tax
Laminex restructuring – Australia and New Zealand 54 (16) 38
Formica – Bilbao plant closure 20 0 20
Insulation – adjustment to business asset carrying values
79 (5) 74
Total 153 (21) 132

Investor Presentation | Fletcher Building | © October 2012 2012 Financial Results | Page 22
Strong contribution from Crane in first full year of ownership
• Operating earnings $106 million, up 15% on 2011 result
• Pipelines:
• Operating earnings up 28% to $59 million
• Gross revenues up 17%
• Increased revenues from two coal seam gas contracts
• Demand from resources, civil and rural sectors offset decline in building activity
• Trade Distribution:
• Operating earnings down 31% to $38 million
• Gross revenues down 6% in Australia, flat in NZ
• Performance impacted by decline in residential and commercial building
• Industrial Products:
• Operating earnings slightly higher at $8 million
• Gross revenues down 16%
• Austral Wright Metals and Mico Metals sold at year end, anticipated proceeds of NZ$70m

Investor Presentation | Fletcher Building | © October 2012 Outlook | Page 23
OUTLOOK
Investor Presentation
Formica, Topshop London

Investor Presentation | Fletcher Building | © October 2012 Outlook | Page 24
Outlook FY2013
New Zealand: • Continued modest improvement in new house building
− Assisted by low interest rates and increased activity in Canterbury
• Commercial and infrastructure activity not expected to improve materially in FY13
• FY14 should benefit from several large infrastructure projects
Australia: • Trend in residential activity unclear, risk of further decline
• Commercial construction likely to remain subdued
• Infrastructure expected to remain steady
Trading conditions in North America expected to remain flat to slightly positive
No recovery expected in Europe, but Germany and Scandinavia should remain relatively strong
China, SE Asia and Taiwan: continued growth expected

Investor Presentation | Fletcher Building | © October 2012 Appendix | Page 25
APPENDIX Investor Presentation
Crane Copper Tube, Adelaide

Appendix | Page 26 Investor Presentation | Fletcher Building | © October 2012
Building Products
Business Description
Insulation
Fletcher Insulation in Australia manufactures a wide range of insulation and acoustic products. Tasman Insulation is New Zealand’s only domestic manufacturer of glasswool insulation.
Plasterboard Winstone Wallboards is New Zealand’s sole manufacturer and leading supplier of plasterboard.
Roof Tiles Global manufacturer of metal roof tiles with plants in New Zealand, Malaysia, Hungary, and the USA.
Aluminium Designs and manufactures aluminium windows and door systems in New Zealand.
Sinkware Australia’s only manufacturer of sinkware and accessories.
Key Brands
Summary Financials (NZ$M)
Division Overview
The Building Products division manufactures a broad range of building products. The divisions’ core plasterboard, insulation and metal roof tile businesses have market leading positions and respected brands.
313
178
94
60 25
Insulation Roof Tiles
Plasterboard Aluminium
Sinkware
739
771
798
692
670 148
106 114 111
72
2008 2009 2010 2011 2012
Revenue EBIT (excl restructuring andimpairment charges)
Revenue source FY12

Investor Presentation | Fletcher Building | © October 2012 Appendix | Page 27
Building Products result
Plasterboard operating earnings down 10% due to lower volumes. Insulation continued industry over-supply in Australia and NZ$ and A$ strength adversely impacted earnings. Roof Tiles volume growth in Africa and USA, flat volumes in Asia and down in NZ and Europe.
NZ$m
June 12
12 Mths
June 11
12 Mths % ∆
Sales 670 692 -3
EBITDA¹ 97 138 -30
EBIT¹ 72 111 -35
Restructuring and impairment charges
(79) (80)
EBIT (7) 31
Funds Employed 481 583
EBITDA1/sales % 14.5 19.9
EBIT1/sales % 10.7 16.0
ROFE1 % 15.0 19.0
1. Excluding restructuring and impairment charges

Appendix | Page 28 Investor Presentation | Fletcher Building | © October 2012
Concrete
Key Brands
Summary Financials (NZ$M)
Division Overview
The Concrete division consists of a vertically integrated concrete business in New Zealand and concrete products businesses in Australia.
489 469
Concrete NewZealand
Concrete Australia
Business Description
Firth (NZ)
NZ’s leading national concrete company supplying readymix and masonry products throughout the country.
Winstone Aggregates
(NZ)
NZ’s largest cement manufacturer and distributor of aggregates and sand to roading, readymix concrete and concrete product industries, and other building and civil engineering customers.
Humes (NZ)
NZ’s leading supplier of manufactured concrete infrastructure products to civil contractors, developers, local governments and other authorities.
Golden Bay Cement
(NZ)
NZ’s largest cement manufacturer for readymix producers, concrete product manufacturers, building materials distributors, paving and construction contractors, and other major users
Rocla Pipelines (AUS)
Leading Australian supplier of manufactured concrete infrastructure products to civil contractors, developers, local governments and other authorities.
Rocla Quarry (AUS)
Construction sands manufacturer supplying sands to the building & construction industries throughout Australia.
967
930
857
912
958
250
144 107 125 130
2008 2009 2010 2011 2012
Revenue EBIT (excl restructuring andimpairment charges)
Revenue source FY12

Investor Presentation | Fletcher Building | © October 2012 Appendix | Page 29
Concrete result
NZ Concrete • Revenues 3% higher with most product
volumes similar or slightly up on prior year;
• Cement and masonry volumes lower, cement export margins also lower;
• Market shares for all core products was stable.
Australia Concrete • Earnings contributions from Australian
Construction Products and Atlantic Civil Products acquisitions;
• Pipeline products: pricing initiatives and operational enhancements increased earnings;
• Quarry earnings benefited from favourable sales mix and improved margins.
NZ$m
June 12
12 mths
June 11
12 mths
% ∆
Sales 958 912 +5
EBITDA
Concrete NZ Concrete Aust.
101 91
102 85
-1
+7
Total EBITDA 192 187 +3
EBIT 130 125 +4
Funds Employed 1,071 1,016 +5
EBITDA/sales % 20.0 20.5
EBIT/sales % 13.6 13.7
ROFE % 12.1 12.3

Appendix | Page 30 Investor Presentation | Fletcher Building | © October 2012
Construction
Business Description
Building + Interiors
A leading general constructor of commercial, retail, health, hospitality, education and government buildings. Work undertaken includes both main structures and commercial fitouts.
Earthquake Recovery
Earthquake Recovery is a project-specific division established to manage the $3+ billion repair process of residential homes that the Earthquake Commission is responsible for following the Canterbury earthquakes.
Infrastructure
A leading general contractor operating in transport, energy, water and wastewater, with specialist business units focused on foundations, general infrastructure projects, piles and pipeline rehabilitation.
South Pacific
Undertakes a wide range of projects for local and foreign governments, aid agencies, religious organisations and commercial entities in the South Pacific
Residential Land subdivision and home builder.
Key Brands
Summary Financials (NZ$M)
Division Overview
The Construction division comprises one of New Zealand’s largest general construction contractors Fletcher Construction, and Fletcher Residential, a residential home building business in New Zealand. Also in the division is Fletcher EQR, which is project managing residential earthquake repairs in Canterbury for the Earthquake Commission.
849
191
Construction Residential
890
1122 1163 1140 1040
58 59 57 60 50
2008 2009 2010 2011 2012
Revenue EBIT
Revenue source FY12

Investor Presentation | Fletcher Building | © October 2012 Appendix | Page 31
Construction result
Tighter construction margins in subdued market
Construction backlog increased to $1,094m at end of June
Additional $300m contract for new mens prison concluded in September 2012
In addition, preferred contractor on two projects worth $537m: would positively impact FY14 earnings if they proceed
Residential earnings up 35% due to increased house sales, particularly in Stonefields subdivision in Auckland
NZ$m
June 12
12 mths
June 11
12 mths
% ∆
Sales 1,040 1,140 -9
EBITDA Total EBIT
61
50
70
60
-13
-17
Funds Employed 109 118 -8
EBITDA/sales % 5.9 6.1
EBIT/sales % 4.8 5.3
ROFE % 45.9 50.8

Appendix | Page 32 Investor Presentation | Fletcher Building | © October 2012
Crane
Key Brands
Summary Financials (NZ$M)
Division Overview
Crane is the Australian leader in the manufacturing and distribution of plastic pipelines systems, plumbing in Australia and New Zealand. Previously a listed public company, the business was acquired by Fletcher Building in March 2011.
Business Description
Iplex A leading manufacturer and supplier of plastic pipeline systems in Australia & New Zealand
Crane Distribution
Australia
Includes Tradelink, a leading Australian business in plumbing supplies and bathroom solutions, and Hudson Building Supplies with a strong footprint in timber and building materials and branches across NSW & South East Queensland
Crane Distribution
NZ
Mico, New Zealand’s leading supplier of plumbing and bathroom products and solutions.
Industrial Products
Manufacturer of a wide range of copper plumbing tubes. 791
1123
363
316 Pipelines
Trade Distribution AUS
Trade Distribution NZ
Industrial Products
Revenue source FY12:*
* Gross of $200m intercompany sales

Investor Presentation | Fletcher Building | © October 2012 Appendix | Page 33
Crane – full year earnings overview
FY12
Sales
NZ$M
FY11
Sales
NZ$M¹
FY12
EBIT
NZ$M
FY11
EBIT²
NZ$M¹ % ∆
Pipelines 791 674 59 46 +28
Tradelink 1,123 1,205 38 55 -31
Trade Distribution - NZ 363 371 (1) 3
Industrial Products 316 378 8 7 +14
Intersegment/Unallocated (200) (190) 1 (17)
Total 2,393 2,437 106 92 +15
1. For comparative purposes only. Fletcher Building acquired Crane in March 2011, and its financial results for FY11 included 3 months trading contribution from Crane
2. Before restructuring and impairment charges

Appendix | Page 34 Investor Presentation | Fletcher Building | © October 2012
Distribution
Business Description
PlaceMakers
Is a nationwide supplier of building materials to New Zealand’s commercial and residential markets. It operates 59 stores and 12 frame and truss manufacturing sites. The majority of stores are operated in a joint venture partnership with local owners/operators.
Key Brands Summary Financials (NZ$M)
Division Overview
The Distribution division consists of the PlaceMakers business in New Zealand and supplies building materials to New Zealand’s commercial and residential construction markets. PlaceMakers represents an important distribution network for Fletcher Building Group products.
1083
883 878 856 813
73
30 38 39
27
2008 2009 2010 2011 2012
Revenue EBIT (excl restructuring and impairment charges)

Investor Presentation | Fletcher Building | © October 2012 Appendix | Page 35
2,500
3,000
3,500
4,000
4,500
Ma
r-1
0
Ju
n-1
0
Se
p-1
0
De
c-1
0
Ma
r-1
1
Ju
n-1
1
Se
p-1
1
De
c-1
1
Ma
r-1
2
Ju
n-1
2
Distribution result
• Revenues down 5%, impacted by continued low levels of residential house building
• Increased competitor activity impacted margins in the second half
• Operating costs reduced by 2% and inventory levels down by 8%
NZ$m
June 12
12 Mths
June 11
12 Mths
% ∆
Sales 813 856 -5
EBITDA 35 48 -27
EBIT 27 39 -31
Funds Employed
141 142 -1
EBITDA/sales % 4.3 5.6
EBIT/sales % 3.3 4.6
ROFE % 19.1 27.5
NZ Quarterly housing starts
Source: Statistics NZ
Appendix | Page 36 Investor Presentation | Fletcher Building | © October 2012
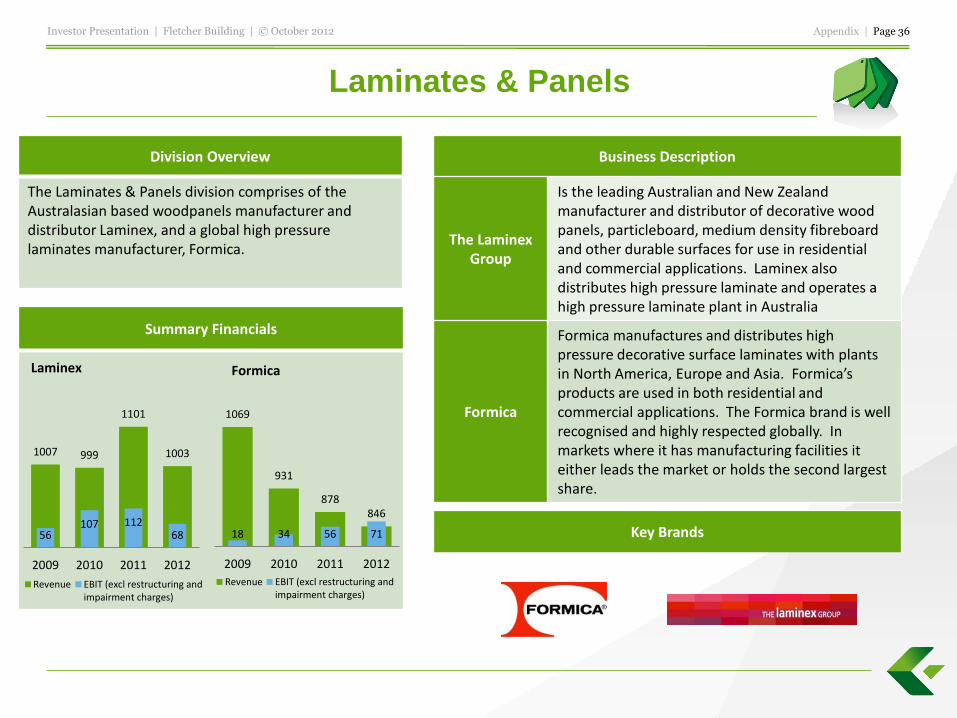
Laminates & Panels
Business Description
The Laminex Group
Is the leading Australian and New Zealand manufacturer and distributor of decorative wood panels, particleboard, medium density fibreboard and other durable surfaces for use in residential and commercial applications. Laminex also distributes high pressure laminate and operates a high pressure laminate plant in Australia
Formica
Formica manufactures and distributes high pressure decorative surface laminates with plants in North America, Europe and Asia. Formica’s products are used in both residential and commercial applications. The Formica brand is well recognised and highly respected globally. In markets where it has manufacturing facilities it either leads the market or holds the second largest share.
Key Brands
Summary Financials
Division Overview
The Laminates & Panels division comprises of the Australasian based woodpanels manufacturer and distributor Laminex, and a global high pressure laminates manufacturer, Formica.
1007 999
1101
1003
56 107 112
68
2009 2010 2011 2012
Revenue EBIT (excl restructuring andimpairment charges)
Laminex
1069
931
878 846
18 34 56 71
2009 2010 2011 2012
Revenue EBIT (excl restructuring andimpairment charges)
Formica
Investor Presentation | Fletcher Building | © October 2012 Appendix | Page 37
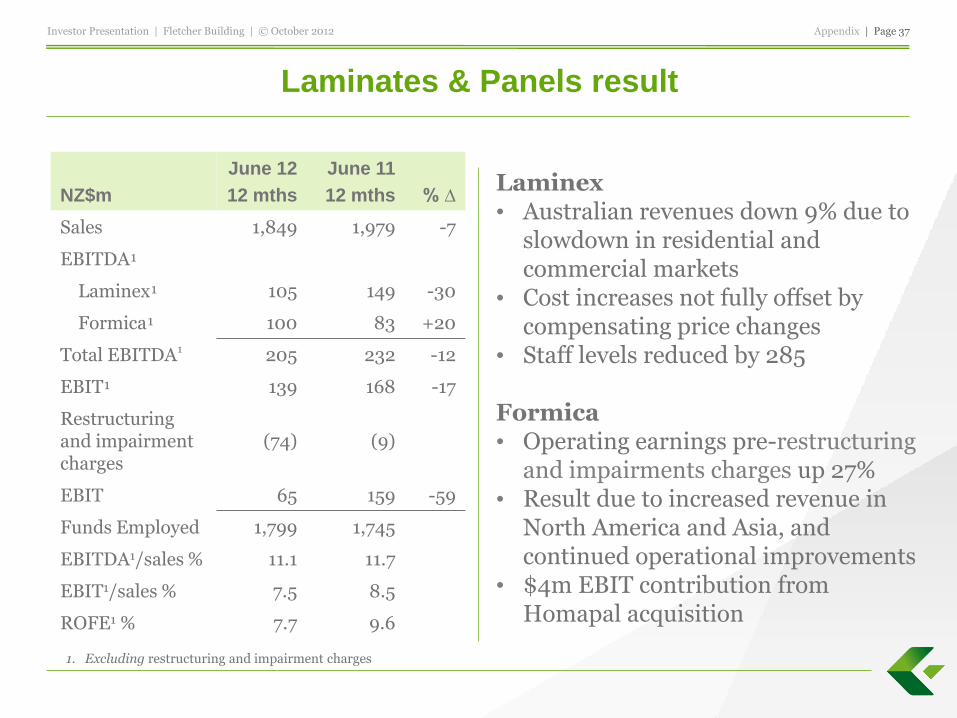
Laminates & Panels result
Laminex • Australian revenues down 9% due to
slowdown in residential and commercial markets
• Cost increases not fully offset by compensating price changes
• Staff levels reduced by 285 Formica • Operating earnings pre-restructuring
and impairments charges up 27% • Result due to increased revenue in
North America and Asia, and continued operational improvements
• $4m EBIT contribution from Homapal acquisition
NZ$m
June 12
12 mths
June 11
12 mths
% ∆
Sales 1,849 1,979 -7
EBITDA¹
Laminex¹ 105 149 -30
Formica¹ 100 83 +20
Total EBITDA¹ 205 232 -12
EBIT¹ 139 168 -17
Restructuring and impairment charges
(74) (9)
EBIT 65 159 -59
Funds Employed 1,799 1,745
EBITDA1/sales % 11.1 11.7
EBIT1/sales % 7.5 8.5
ROFE1 % 7.7 9.6
1. Excluding restructuring and impairment charges

Investor Presentation | Fletcher Building | © October 2012 Appendix | Page 38
Formica: strong growth in operating earnings before restructuring
and impairment charges, driven by Asia and North America
EBIT NZ$m FY12 FY11
% Change
Asia 38 34 +12
North America 34 28 +21
Europe¹ 13 9 +33
Corporate (14) (15) -7
EBIT before restructuring and impairments charges
71 56 +27
Bilbao closure costs (20) 0
EBIT 51 56 -9
1. Includes $4m contribution from Homapal in FY12 (nil in FY11)

Appendix | Page 39 Investor Presentation | Fletcher Building | © October 2012
Key Brands
Steel
Division Overview
The Steel division operates a diversified portfolio of steel businesses across three business lines, primarily in Australia and New Zealand. Each business has a leading market position and widely recognised brands.
Business Description
Coated Steel
•Stramit Building Products: a leading Australian manufacturer of steel building products, including roofing, walling, gutters and fascia's, purlins, flooring structural formworked and roller doors. •CSP Coatings Systems provides metal coating
systems to customers throughout New Zealand. •Dimond: New Zealand’s largest manufacturer of
steel roofing, cladding, structural and rainwater products. •Pacific Coilcoaters pioneered pre-painted metals
products in New Zealand
Long Steel
•Pacific Steel Group; New Zealand’s only manufacturer of wire rod, galvanised wire and reinforcing bar and coil products. •Sims Pacific Metals: NZ’s largest metal recyclers, a
50/50 joint venture between Sims Metal Industries.
Distribution
•Fletcher Easysteel, a major New Zealand processor and distributor of steel and related products. •Fletcher Reinforcing: supplies reinforcing steel
and mesh for concrete foundations and structures.
Summary Financials (NZ$M)
720 217
213
Coated Steel
Long Steel
Distribution and Services
1279
1321
1172
1214
1150 101
154
82 83
48
2008 2009 2010 2011 2012
Revenue EBIT (excl unusuals)
Revenue source FY12

Investor Presentation | Fletcher Building | © October 2012 Appendix | Page 40
Steel result
• Lower rollforming volumes in Australia, margins impacted by increased competition
• Long steel margins impacted by strong NZ$ and A$; NZ volumes up 20%, but export returns lower
• Low volumes and increased competition impacted Distribution margins
NZ$m
June 12
12 Mths
June 11
12 mths
% ∆
Sales 1,150 1,214 -5
EBITDA 73 106 -31
EBIT 48 83 -42
Funds Employed 540 577 -6
EBITDA/sales % 6.3 8.7
EBIT/sales % 4.2 6.8
ROFE % 8.9 14.4

Investor Presentation | Fletcher Building | © October 2012 Appendix | Page 41
Hunua Quarry, Auckland
INVESTOR
PRESENTATION
Bill Roest Chief Financial Officer
October 2012


