88
Child Care Use in Minnesota: Report of the 2009 Statewide Household Child Care Survey November 2010 DHS-6278-ENG 11-10

Child Care Use in Minnesota:Report of the 2009 Statewide Household Child Care Survey
November 2010
DHS-6278-ENG 11-10
Child Care Use in Minnesota Report of the 2009 Statewide Household Child Care Survey
November 2010
Prepared by
Richard Chase and Jennifer Valorose
Wilder Research
451 Lexington Parkway North
St. Paul, MN 55104
(651) 280-2700
www.wilderresearch.org

Child Care Use in Minnesota: November 2010 Report of the 2009 Statewide Household Child Care Survey
Contents Summary ............................................................................................................................. 1
Study Purposes and Methods .......................................................................................... 1
Key findings .................................................................................................................... 2
Recommendations ......................................................................................................... 10
Introduction ....................................................................................................................... 13
Context for child care use in Minnesota ....................................................................... 13
Survey background and purposes ................................................................................. 15
Child care and other definitions in this report .............................................................. 16
Survey methods and samples ........................................................................................ 18
Instrument development ................................................................................................ 20
Strengths and limitations of survey results ................................................................... 21
Report structure ............................................................................................................. 23
Profile of study households and children .......................................................................... 24
Demographics of respondents, households and children .............................................. 24
Availability of support for child care ............................................................................ 32
Use of parenting education and early childhood resources .......................................... 33
Profile of child care use .................................................................................................... 35
Any child care use ......................................................................................................... 35
Number of child care arrangements .............................................................................. 35
Changes in child care arrangements in the past 12 months (continuity of care) .......... 37
All types of child care use ............................................................................................. 37
Primary child care arrangements .................................................................................. 40
Use of Head Start .......................................................................................................... 43
Use of family, friend and neighbor (FFN) care ............................................................ 43
Use of young sibling care or self care ........................................................................... 44
Child care hours and schedules ......................................................................................... 45
Number of hours in child care ...................................................................................... 45
Mean hours per week in child care during the summer ................................................ 46
Mean hours per week in child care during the school year ........................................... 47
Child care schedules ..................................................................................................... 48

Child Care Use in Minnesota: November 2010 Report of the 2009 Statewide Household Child Care Survey
Contents (continued) Child care costs ................................................................................................................. 52
Weekly cost of child care .............................................................................................. 53
Awareness and use of the state Child Care Assistance Program .................................. 55
Other help with child care costs .................................................................................... 56
Selecting child care: awareness, choices and barriers ...................................................... 58
Child care resource and referral .................................................................................... 58
Views about potential child care quality rating system ................................................ 59
How people learned about their primary arrangement ................................................. 60
Reasons for choosing primary arrangement ................................................................. 61
Important considerations in choosing child care .......................................................... 63
Households taking whatever arrangement they could get ............................................ 65
Main reason for ending previous child care arrangement ............................................. 66
Transportation problems ............................................................................................... 69
Child care quality .............................................................................................................. 70
Parents’ quality and satisfaction ratings for primary arrangement ............................... 70
Employment and child care .............................................................................................. 72
Work-related child care problems ................................................................................. 72
Backup child care arrangements ................................................................................... 77
Recommendations ............................................................................................................. 78

Child Care Use in Minnesota: November 2010 Report of the 2009 Statewide Household Child Care Survey
Figures 1. Percentage of children in child care regularly, by age group ..................................... 2
2. Any use of family, friend and neighbor (FFN) care for children 12 and younger ...... 3
3. Primary child care arrangements for children 12 and younger ................................... 4
4. Proportion of annual household income going for child care costs ............................ 7
5. Geographic distribution of completed surveys ......................................................... 20
6. Key methodological differences ............................................................................... 22
7. Respondent demographics ........................................................................................ 25
8. Household demographics .......................................................................................... 26
9. Age of children ......................................................................................................... 27
10. Race ethnicity of randomly-selected children ........................................................... 28
11. Number of children ages 12 or younger in household .............................................. 28
12. Special health care needs of randomly-selected children ......................................... 29
13. Work activities of respondents during the previous week ........................................ 30
14. Employment status of households ............................................................................ 31
15. Household income .................................................................................................... 32
16. Availability of support for child care ........................................................................ 33
17. Number of child care arrangements for all children ages 12 and younger ............... 36
18. Number of child care arrangements by age, summer, selected child ........................ 36
19. Number of child care arrangements by age, school year, selected child .................. 36
20. All types of child care used, summer, selected child ................................................ 38
21. All types of child care used, school year, selected child .......................................... 39
22. Primary child care arrangements for randomly-selected child ................................. 40
23. Primary child care arrangement, summer ................................................................. 42
24. Primary child care arrangement, school year ............................................................ 43
25. Number of hours in child care .................................................................................. 45
26. Mean hours in child care per week, summer ............................................................ 46
27. Mean hours in child care per week, school year ....................................................... 47
28. Child regularly in child care: Percent of randomly-selected children in care by type of schedule and age of child, summer ............................................................... 48
29. Child regularly in child care: Percent of randomly-selected children in care by type of schedule and age of child, school year ......................................................... 49

Child Care Use in Minnesota: November 2010 Report of the 2009 Statewide Household Child Care Survey
Figures (continued) 30. Types of child care during non-standard times, summer .......................................... 50
31. Types of child care during non-standard times, school year .................................... 51
32. Average total weekly cost of child care per household (parents’ out of pocket expenses) ................................................................................................................... 54
33. Average total weekly cost of child care by household income (parents’ out of pocket expenses) ....................................................................................................... 55
34. Types of help with child care costs ........................................................................... 57
35. Helpfulness of child care rating system by age of randomly-selected child ............. 59
36. How people learned about their primary arrangement ............................................. 60
37. Reasons for choosing primary arrangement for randomly-selected child by primary arrangement ................................................................................................. 62
38. Considerations in choosing child care arrangements for randomly-selected child ... 63
39. Very important considerations in choosing child care arrangements by randomly-selected child’s age ................................................................................................... 64
40. Very important considerations in choosing child care arrangements by randomly-selected child’s primary arrangement ....................................................................... 65
41. Households that report they had to take whatever arrangement they could get ...... 66
42. Main reason for ending previous child care arrangement, by age of randomly-selected child ............................................................................................................. 67
43. Main reason for ending previous arrangement, by type of previous arrangement ... 68
44. Percent of households reporting that transportation to and from child care is a problem by age of selected child .............................................................................. 69
45. Percent of households reporting that transportation to and from child care is a problem by travel time .............................................................................................. 69
46. Parents’ quality and satisfaction ratings for randomly-selected child’s primary arrangement ............................................................................................................... 71
47. Work-related child care problems by type of primary arrangement ......................... 74
48. Work related child care problems, by age of child ................................................... 75
49. Kinds of problems that cause loss of time from work by randomly-selected child’s primary child care arrangement .................................................................... 76
50. Backup arrangements for school-age children when there is no school on a regular weekday by primary arrangement ................................................................ 77

Child Care Use in Minnesota: November 2010 Report of the 2009 Statewide Household Child Care Survey
Acknowledgments The Minnesota Department of Human Services and Wilder Research thank the study advisory committee for its assistance in refining the study questions, the sampling design, and the survey instrument and in reviewing the preliminary report. Committee members are:
Sameerah Bilal-Roby, Early Childhood Resource and Training Center
Kristen Boelcke-Stennes, Minnesota Department of Human Services
Susie Brown, Child Care Works (formerly)
Karen Carlson, Minnesota Department of Education
Liz Davis, University of Minnesota
Patrick Gannon, Child Care Resource and Referral, Rochester
Karen Gromala, Minnesota Department of Human Services
Nancy Johnson, early childhood policy consultant
Nancy Jost, West Central Initiative Foundation
Karen Kingsley, Ready4K
Ann McCully, Minnesota Child Care Resource and Referral Network
Carol Miller, Hennepin County
Mariam Mohammed, McKnight Foundation (formerly)
Kelly Monson, Minnesota Department of Health
Brian Siverson-Hall, Minnesota School-Age Care Alliance (formerly)
Carole Specktor, Children’s Defense Fund (formerly)
Deb Swenson-Klatt, Minnesota Department of Human Services
Kathryn Tout, Child Trends
Avisia Whiteman, Minnesota Department of Education
Sandy Williams, Minnesota Tribal Resources for Early Childhood Care
Thank you also to the families who responded to this survey.

Child Care Use in Minnesota: November 2010 Report of the 2009 Statewide Household Child Care Survey
1
Summary
Study Purposes and Methods
This report on a statewide telephone survey describes child care use in Minnesota among households with children 12 and younger. Minnesota has an estimated 908,000 children ages 12 and younger; 24 percent are ages 0 to 2, 24 percent ages 3 to 5, 30 percent ages 6 to 9 and 23 percent ages 10 to 12. Of the nearly 500,000 households with one or more of these children, 28 percent have annual incomes at or below 200 percent of the federal poverty level.1
The survey was conducted for the Minnesota Department of Human Services (DHS), through its Community Partnerships Division, to inform, develop and assess Minnesota’s child care policies and programs, with particular attention to child care use among households with low incomes. It was conducted from April 2009 through March 2010 with a statistically valid random sample of Minnesota families to reflect child care use during the summer and the school year.
Interviewers spoke with one adult in each household who was most knowledgeable about child care arrangements. The survey collected information about all the types of child care used at least once in each of the prior two weeks for one randomly-selected child per household. The study also includes information on reasons for choosing various arrangements, costs of child care, work-related issues and parent satisfaction with current child care arrangements.
The results provide an accurate overview of child care choices, availability, quality and affordability for all families in Minnesota. Similar surveys were completed in 1999 and 2004.
In this study, child care refers to all arrangements other than parents and the regular school time (K-12). It includes informal home-based care by family, friends and neighbors; licensed home-based care; center-based care (including preschool, nursery school and school-age care programs before and after the school day); organized activities such as clubs or sports, and self care by the child.
The study included 1,209 randomly selected households (308 surveyed in the summer and 901 during the school year). The sample was stratified by region (in Greater Minnesota) and
1 U.S. Census Bureau, Intercensal estimates, 2009

Child Care Use in Minnesota: November 2010 Report of the 2009 Statewide Household Child Care Survey
2
by county (in the Twin Cities metropolitan area). The survey has an acceptable response rate of 32.5 percent and an overall sampling error of about plus or minus 2.8 percent.2
Key findings
Profile of child care use, hours and schedules
Most families with children ages 12 and younger use some type of child care.
About three-fourths of Minnesota families (76 percent) with children ages 12 and younger regularly3 use some type of child care arrangement, similar to 2004.
Sixty-five percent of children ages 12 and younger are in some type of child care arrangement regularly. Children ages 3 to 5 are the most likely to be in some type of child care arrangement regularly (82 percent). (See Figure 1.)
On average, households have more than two child care arrangements.
1. Percentage of children in child care regularly, by age group
On average, children spend about 22 hours per week in child care.
Twenty-five percent of children are in child care full time (35 or more hours per week), similar to the survey findings in 1999 and 2004.
During both the summer and the school year, on average, children are in licensed family child care and center-based care more hours than any other type of care.
2 Sub-samples have higher sampling error. For example, the sub-sample of low-income households with a child care subsidy has 52 households and a sampling error of plus or minus 14 percent. The sampling error does not diminish any statistical significance, but should be taken into account when generalizing results or making population estimates. 3 Regular use is defined as at least once a week during each of the last two weeks.
69%
82%
60%50%
65%
0-2 years 3-5 years 6-9 years 10-12 years Total

Child Care Use in Minnesota: November 2010 Report of the 2009 Statewide Household Child Care Survey
3
Children ages 5 and younger spend an average of 27 to 31 hours per week in child care during the school year, while school-age children spend smaller, but still significant amounts of time in child care. (Children ages 6 to 12 spend an average of 15-16 hours in child care.)
2. Any use of family, friend and neighbor (FFN) care for children 12 and younger
Relatives are the primary caregivers overall.
Of households that use child care, 70 percent use some form of family, friend and neighbor (FFN) care on a regular basis; 20 percent use FFN care exclusively, statistically similar to 24 percent in 2004.
The FFN caregivers are mainly grandparents (52 percent) and nonrelatives (32 percent), followed by other relatives (22 percent), and older siblings (20 percent).
For children under age 6, FFN care is more commonly provided by grandparents. For children 6 to 12, FFN care more often is provided by older siblings.
Of those using FFN care, 38 percent pay for it.
Family, friend and neighbor (FFN) care is still the most common type of primary arrangement.
Overall, 43 percent use FFN care as their primary arrangement: in their own home (29 percent) or in someone else’s home (14 percent), similar to 2004.
No regular FFN care
30%
FFN is secondary
29%
FFN is primary
22%
Uses FFN care
exclusively20%

Child Care Use in Minnesota: November 2010 Report of the 2009 Statewide Household Child Care Survey
4
Households with low incomes without a child care subsidy are more likely than those with a subsidy to use FFN care as their primary arrangement (60 percent versus 31 percent, compared with 37 percent for households with higher incomes).
Center-based care is the next most frequent type of primary child care arrangement.
Nearly one-third (31 percent) of households use center-based care as their primary arrangement, including child care centers, preschools, Head Start and before-school and after-school programs.
3. Primary child care arrangements for children 12 and younger
FFN care 43%
Center-based care31%
Self care2%
Licensed family care
13%
Supervised activities
12%
Child care assistance helps families with low incomes gain access to center-based care.
In 2009, 46 percent of households with low incomes receiving CCAP use center-based care as their primary arrangement. That compares with 22 percent of households with low incomes without CCAP and 33 percent for higher income households. These percentages are similar to those reported in 2004.
Fewer families are using center-based care for their preschoolers than in 2004.
Fifty-two percent of children ages 3 to 5 who use child care use center-based care as their primary arrangement and most common arrangement during the school year, which is down from 60 percent in 2004, but still up from 41 percent in 1999.
Fewer children ages 10 to 12 are taking care of themselves during the summer, but self care has not decreased during the school year.
During the school year, 44 percent of children ages 10 to 12 are in self care, compared with 41 percent in 2004 and 26 percent in 1999.

Child Care Use in Minnesota: November 2010 Report of the 2009 Statewide Household Child Care Survey
5
During the summer, 36 percent of children ages 10 to 12 take care of themselves, down from 42 percent in 2004 but still higher than in 1999 (20 percent).
On average, children ages 10 to 12 are in self care 4-5 hours per week, compared with 10 hours in 2004.
During the school year, the types of child care vary by the child’s age.4
More than two-thirds of children are in the care of family, friends or neighbors at least part of the time during the school year (69 percent), followed by center-based care (50 percent), supervised activities (46 percent), licensed family child care (14 percent) and self care (14 percent). During the summer, more children use FFN care (77 percent) and fewer use center-based care (31 percent).
During the school year, FFN care use is highest for children under age 3 (76 percent).
Center-based care use during the school year is highest for 3- to 5-year-olds (76 percent), followed by children ages 6 to 9 (45 percent), and children under age 3 or ages 10 to 12 (34 percent).
Supervised activities during the school year are fairly common child care arrangements for children ages 6 to 9 (58 percent) and those 10 to 12 (63 percent), compared with 47 percent of 3- to 5-year-olds.
Forty-four percent of children ages 10 to 12 are in self care regularly during the school year, compared with 15 percent of children ages 6 to 9. During the summer, 36 percent of children ages 10 to 12 and 15 percent of children ages 6 to 9 are in self care. The percentage in self care for children ages 10 to 12 is similar to the percentage found in the 2004 survey and higher than in 1999 (26 percent school year and 20 percent summer).
Family schedules commonly require child care before and after standard work hours (7 a.m. to 6 p.m.) and on weekends, but less often than in 2004. Fewer families are using FFN during early mornings and weekends.
During the school year, Monday through Friday, between 7 a.m. and 6 p.m., is at least part of the child care schedule for 91 percent of children and is the only schedule for 39 percent.
In addition to standard weekday hours during the school year, 43 percent of children are regularly in non-parental care during weekday evenings (6 p.m. to 10 p.m.), and 33
4 This section reports all the arrangements used during the school for the selected child, so the percentages are duplicated.

Child Care Use in Minnesota: November 2010 Report of the 2009 Statewide Household Child Care Survey
6
percent are regularly in non-parental care on weekends. Seven percent are in non-parental care after 10 p.m. on weekdays, and 9 percent in the early mornings before 7 a.m. Family, friends and neighbors are the usual caregivers during these times.
During the school year, FFN care is the most common type of child care during all non-standard times. FFN providers care for 50 percent of children during the early morning hours before 7 a.m., fewer than in 2004 when 65 percent were in FFN care at those times. On weekends during the school year, 70 percent (down from 77 percent in 2004) of children are cared for by FFN caregivers.
Twenty-four percent of working parents’ work schedules vary from week to week.
Cost of child care
Most of the families using child care pay for it.
Sixty-nine percent of families using child care pay something out-of-pocket for child care, similar to 2004.
Sixty percent of families with low incomes pay something out-of-pocket, compared with 73 percent of higher-income families.
For those paying for child care, the average out-of-pocket weekly expense for all children is $138 ($7,167 per year). On average, metro-area households pay more than Greater Minnesota households per week for all their child care ($155 versus $116).
Child care is still unaffordable for low-income households.
In households with the lowest annual incomes (below $20,000), 29 percent of their income goes for child care expenses, similar to 2004.
In households with low incomes (200% of poverty and below), 20 percent of their income goes for child care expenses.
For higher-income families (above 200% of poverty or above about $44,000 for a family of four), 9 percent of their income goes for child care expenses.
For all families, 12 percent of income goes for child care expenses, similar to 10 percent reported in 2004. (See Figure 4.)

Child Care Use in Minnesota: November 2010 Report of the 2009 Statewide Household Child Care Survey
7
4. Proportion of annual household income going for child care costs
Some families receive help paying for child care through government assistance and tax benefits. Many families with low incomes are not receiving these supports.
Fourteen percent of households with low incomes (at or below 200 percent of federal poverty guidelines) report currently receiving a subsidy through the state Child Care Assistance Program (CCAP).5
Forty-eight percent of households with incomes above 200 percent of poverty claim a tax credit for child care, and 31 percent have child care (pre-tax) expense accounts. (Benefit amounts vary by income and family size.) In comparison, 32 percent of low-income families claim a tax credit for child care, and 12 percent have child care (pre-tax) expense accounts.
Selecting child care: choices and barriers
Parents consider quality important and want information on it.
Location, cost, quality and trust are the most common reasons cited by parents for choosing a primary care arrangement.
5 Eligibility for CCAP is based on family size, family income and participation in authorized employment-related activities by the parents. This survey does not contain information that explains the reasons for not using CCAP or to determine whether the households with low incomes not receiving child care assistance are eligible to receive it under current guidelines.
29%
18%
9%8%
12%
<$20,000 $20,000-$44,999
$45,000-$74,999
$75,000+ Total

Child Care Use in Minnesota: November 2010 Report of the 2009 Statewide Household Child Care Survey
8
From a list of important considerations in choosing child care, “a caregiver who speaks your family’s native language,” and “a caregiver rated high quality” are the top “very important” reasons overall (77 percent).
For households using FFN care, preference for care by a family member is a main reason. The structure and the activities are key to those choosing center-based care and supervised activities.
Eighty-eight percent (similar to 2004) say they would find it helpful if their community had a child care quality rating system that would give them information they could use for selecting the highest quality care.
Parents of color (67 percent versus 51 percent of white parents) and parents with low incomes (61 percent versus 45 percent of parents with higher incomes) are more likely to say a quality rating system would be “very helpful.”
Some parents still lack child care choices.
Twenty-nine percent of all parents and 35 percent of parents with low incomes report taking whatever child care they could get, similar to the percentages in 2004 and up from 21 percent in the 1999 survey.
Among all parents, parents of color are more likely than white parents to report feeling they had to take whatever arrangement they could get (44 percent versus 27 percent), and so are those whose primary language is not English (48 percent versus 29 percent).
Parents with children who have special needs are also more likely to feel that way (38 percent versus 26 percent of parents with no children with special needs).
Improved since 2004, in the 2009 survey, parents using CCAP are similar to parents not using CCAP in this regard (30 percent using CCAP and 29 percent not using CCAP take whatever they can get, compared with 39 using CCAP and 29 percent not using CCAP in 2004).
Child care problems interfere with employment for some parents.
12 percent say child care problems have interfered with getting or keeping a job in the past year, down from 20 percent in 2004.
Child care problems more commonly affect employment for parents of color (25 percent), parents who have a child with a special need (21 percent) and parents with low incomes (20 percent) than other parents by about 2 to 1. This was also the case in 2004.
Child Care Use in Minnesota: November 2010 Report of the 2009 Statewide Household Child Care Survey
9
Parental ratings of child care quality
Most parents give high ratings to the quality of their primary child care arrangement.
Compared to parents using center-based care and licensed family homes as their primary arrangements, parents using FFN care as their primary arrangement tend to be more satisfied with the flexibility of their child care arrangement. Low-income households are more likely to report they usually or always rely on their provider to be flexible about their hours.
Parents using center-based and licensed family homes as their primary arrangements, on the other hand, tend to rate their child care providers’ use of a curriculum and formal education or training higher than those parents using FFN care as their primarily arrangement.
Child care among households with low incomes
On balance, similar to 2004, households with low incomes have more challenges, less choice, and more problems with child care than do households with higher incomes, but child care assistance increases child care options.
Thirty-one percent of households in this study are considered low-income, up from 22 percent in 2004; that is, their annual income is within or below the income range that includes 200 percent of the federal poverty guideline for a household of their size. For example, for a household of four people, 200 percent of the federal poverty guideline is $44,100.
Thirty-five percent of households with low incomes say that in choosing child care they had to take whatever arrangement they could get, compared with 26 percent for higher income households. Households with low incomes are also more likely to report that child care problems have prevented them from accepting or keeping the kind of job they wanted in the past 12 months (20 percent versus 9 percent); low-income households are also more likely to have a child with special needs requiring a lot of extra effort (26 percent versus 17 percent).
Among households with low incomes, those who have child care subsidies are more likely than those without subsidies to be aware of child care resource and referral (CCR&R) services (92 percent versus 64 percent) and to learn about their current primary arrangement through community or CCR&R services (21 percent versus 7 percent).6 Among households with low incomes, those without a child care subsidy are more likely
6 Readers should note that the sub-sample of low-income households with a child care subsidy has 52 households and a sampling error of plus or minus 14 percent. The sampling error does not diminish the statistical significance but should be taken into account when generalizing results or making population estimates.

Child Care Use in Minnesota: November 2010 Report of the 2009 Statewide Household Child Care Survey
10
than those with a subsidy to prefer care by a family member (27 percent versus 10 percent). Households with higher incomes are more likely to choose care based on the hours (17 percent versus 8 percent) and quality of care (21 percent versus 14 percent).
Households with low incomes that receive child care subsidies tend to rate their child care arrangements’ use of curriculum, tracking of children’s learning, helping children in school or prepare for school and formal education higher than low-income households without subsidies. In this way, households receiving subsides are more similar to households with higher incomes.
Recommendations
The results of this statewide survey of randomly-selected households that use child care for children ages 12 and younger provide an accurate overview of child care use, choices and affordability for all families in Minnesota. Based on the results of this study and discussion with the study advisory committee, the researchers recommend the following to ensure that high quality and affordable child care is available for all Minnesota families who need it.
1. Continue public and private efforts to empower parents to make informed child care choices.
Survey results indicate that 88 percent of parents say they would find it helpful if their community had a child care quality rating system. Parents with low incomes and parents of color, in particular, say such a rating system would be “very helpful.” In addition, households with low incomes that receive a child care subsidy, relative to those without a subsidy, more commonly use community or CCR&R services to learn about their primary child care arrangements (21 percent versus 7 percent).
Continue to support efforts to ensure child care information is available to parents through programs and initiatives such as CCR&R services and a quality rating system. Ensure that child care information is accessible in multiple formats and languages.
2. Develop the supply of high-quality child care options.
Survey results indicate that parents choose child care based on quality, especially for children under age 6 (22 percent). In addition, “a caregiver rated as high quality” is a very important consideration in choosing child care for 77 percent of parents, higher than a “reasonable cost” (71 percent).
The supply of high-quality child care options could be developed by supporting the professional development of and specialized training for child care providers, by offering providers incentives to improve the quality of their care and by empowering parents to make informed decisions about their child care choices.

Child Care Use in Minnesota: November 2010 Report of the 2009 Statewide Household Child Care Survey
11
3. Increase public and private ways to help families, especially those with low-incomes, access high-quality child care.
While family, friend and neighbor care is a common child care choice, some parents using that care would prefer center-based programs but cannot afford them. Lack of child care choices is highest for parents with low incomes (35 percent), parents of color (44 percent) and parents whose child has a special need (48 percent). Moreover, families with low incomes in Minnesota continue to pay, on average, 20 percent of their income for child care arrangements. That is more than double the proportion paid by families with higher incomes (9 percent) and double the amount considered to be affordable.
Those able to access and use state child care assistance fare much better with regard to choice, satisfaction and use of licensed child care. For example, 46 percent of families with low incomes receiving a child care subsidy use center-based care as their primary arrangement, compared with 22 percent for families with low incomes without a subsidy and 33 percent for families with higher incomes. However, 86 percent of Minnesota families with lower incomes report not using state child care assistance programs (CCAP).7
Ways to increase access to high-quality child care options include increasing the availability of scholarships to be used in quality early care and education settings, increasing the use of CCAP, increasing incentives that link child care assistance payments to quality settings, ensuring that reimbursement rates for child care reflect the market, developing policies that emphasize continuity of care for children receiving CCAP and increasing the use of earned income tax credits, child care tax credits and pre-tax child care expense accounts through employers.
4. Continue to support and expand ways to improve the quality of family, friend and neighbor caregivers and connect them to appropriate resources.
Families (70 percent) still rely on grandparents and other relatives for affordable, convenient, and trustworthy child care, especially for children under age 3. For example, 38 percent of children ages 2 and younger use FFN care as their only type of child care. To ensure that all children are cared for in language-rich, safe and developmentally-appropriate environments, reach out especially to FFN that provide full-time child care.
7 Eligibility for CCAP is based on family size, family income and participation in authorized employment-related activities by the parents. This survey does not contain information that explains the reasons for not using CCAP or to determine whether the households with low incomes not receiving child care assistance are eligible to receive it under current guidelines.
Child Care Use in Minnesota: November 2010 Report of the 2009 Statewide Household Child Care Survey
12
5. Support programs throughout Minnesota that provide supervised, developmentally appropriate activities for pre-teens.
Youth are at risk in several ways when they are not engaged in structured, supervised activities during non-school hours. Youth may worry, experience loneliness or miss opportunities to develop important social skills or to engage in positive development opportunities. They may also engage in risky behaviors that diminish their success in school.
The relatively high and steady proportion of pre-teens providing self care throughout the year points to the need for more supervised activities and programs for 10- to-12-year-olds during the summer and after school. For example, 44 percent are in self care during the school year (as one of the types regularly used), similar to 41 percent five years ago, and 36 percent are in self care during the summer (down from 42 percent five year ago). Half of the parents who use self care as their primary arrangement for 10 to 12-year-olds say they use it due to cost.

Child Care Use in Minnesota: November 2010 Report of the 2009 Statewide Household Child Care Survey
13
Introduction
Context for child care use in Minnesota
Child care has multiple purposes. It can be a non-profit or for-profit business, a regulated or an informal caretaking service for working parents, an educational opportunity for children to learn and interact with peers and a public assistance program for families with low incomes seeking payment assistance.
Children in Minnesota
Minnesota has an estimated 908,000 children ages 12 and younger; 24 percent are ages 0 to 2, 24 percent ages 3 to 5, 30 percent ages 6 to 9 and 23 percent ages 10 to 12. Of the nearly 500,000 households with one or more of these children, 28 percent have annual incomes at or below 200 percent of the federal poverty level.8
Child care settings
Minnesota has one of the highest labor-force participation rates overall (78.6 percent) and for women ages 16 and over (74 percent),9 necessitating the use of child care for many families. For children ages 12 and younger, when they are not with a parent or at school, child care takes place in various settings, including their own homes or a relative’s home, licensed child care centers, preschools and before and after school programs, and licensed and legal unlicensed family child care homes. According to the Minnesota Child Care Resource and Referral Network (CCR&R), in July 2010, the seven-county Twin Cities metropolitan area had 639 child care centers, 268 preschools, 377 school-age programs, and 4,499 licensed family child care homes; and Greater Minnesota had 324 child care centers, 272 preschools, 187 school-age programs, and 6,993 licensed family child care.10 According to the Minnesota Department of Human Services (DHS), the state has about 7,316 legal non-licensed or registered child care providers who care for children receiving child care subsidies. In addition, an estimated 150,000 households in Minnesota provide informal child care for family, friends or neighbors.11
8 U.S. Census Bureau, Intercensal estimates, 2009 9 Minnesota Compass. Proportion of adults working (16-64) by gender. Retrieved from: www.mncompass.org/economyworkforce/key-measures.php?km=Proportionadultsworking#1-2021-g. 10 Not all license-exempt, school-based, and school-age programs are tracked in the CCR&R database. 11 Chase, R., et al. (2006).

Child Care Use in Minnesota: November 2010 Report of the 2009 Statewide Household Child Care Survey
14
School readiness and child care quality
Awareness about the importance of early brain, cognitive and social/emotional development for school readiness and, ultimately, for a strong future workforce is growing in Minnesota among the general public, community leaders and policymakers. Accordingly, the quality of the child care experience is important to parents in choosing child care arrangements as well as to policymakers as a basis for funding early care and education.
Minnesota is currently piloting the Parent Aware quality rating system in four communities through a partnership involving DHS, the Minnesota Department of Education, the Minnesota Early Learning Foundation, CCR&R, the Assessment and Training Center at the Center for Early Education and Development, and Child Trends Inc.
In addition, Minnesota has been a national leader in viewing family, friend and neighbor child care (FFN) as an integral part of the overall early childhood system. Since 2004, the Minnesota Department of Human Services has funded FFN studies, outreach and support services. In 2007, the Minnesota legislature appropriated $750,000 for a Family, Friend and Neighbor grant program to provide education and support to FFN caregivers in order to improve children’s literacy, health, and school readiness. The grant program was appropriated an additional $750,000 from the federal child care development ARRA funds for fiscal years 2010-11. DHS has also developed a strategic action plan for expanding its work with FFN caregivers.
In 2006 the statute regulating Early Childhood Family Education (ECFE) was amended to allow for relatives, including any relative by blood, marriage, adoption or foster placement, of children birth to kindergarten to participate in ECFE.
Child care subsidies
In Minnesota, the Child Care Assistance Program (CCAP) provides financial subsidies administered by the counties to help families with low incomes pay for child care while parents are working or going to school or in training that will lead to employment. CCAP is funded through federal, state and county money. Families contribute copayments based on their family income. For example, a family of three earning 55 percent of the state median income ($38,551) would have a total bi-weekly child care copayment of $125 for all children in child care.
CCAP consists of 1) Minnesota Family Investment Program (MFIP) Child Care, which is available to families participating in qualifying activities as part of their MFIP or Diversionary Work Program (DWP) employment services plan and families transitioning off the program, and 2) Basic Sliding Fee (BSF) Child Care program, which helps families with incomes less than or equal to 45 percent of the State Median Income and not on MFIP pay for child care. Families are no longer eligible for child care assistance when their earnings

Child Care Use in Minnesota: November 2010 Report of the 2009 Statewide Household Child Care Survey
15
reach 67 percent of the State Median Income. CCAP serves over 31,000 children in an average month, with about 4,000 families on waiting lists for assistance for BSF assistance.
The Child Care Assistance Program (CCAP) encourages eligible families to apply to Head Start but does not reimburse Head Start-only expenses. Families may use child care provided in partnership with Head Start, which may be subsidized through CCAP.
Minnesota has been a leader in linking child care subsidies to quality care. For example, the Minnesota Department of Human Services is piloting the School Readiness Connections program that offers incentives (up to a 25 percent subsidy rate differential) to select high quality programs that provide full day/full year, comprehensive services for families that promote school readiness skills and abilities. This program is serving approximately 220 children ages 5 and younger in 14 programs in licensed centers and homes in metro and Greater Minnesota counties.
Other kinds of subsidies for child care include federal and state Dependent Care Tax Credits, which allow a family to receive a refund on their income taxes for a portion of their child care expenses, and employer pre-tax accounts, which allow employees to pay for child care expenses with pre-tax dollars.
Survey background and purposes
The Minnesota Department of Human Services (DHS), through its Community Partnerships Division, works in partnership with communities and other state agencies to develop high quality and accessible child care options and school readiness services for families, among other initiatives. On a regular basis, DHS commissions a comprehensive statewide household child care survey to obtain credible, accurate and useful data to inform, develop and assess child care policies and programs related to Minnesota’s early childhood and school-age care system at the local and state levels. In particular, survey results are intended to be useful for understanding how to best support the school readiness of young children and improve the quality and availability of child care for low-income families.
In 2009, DHS contracted with Wilder Research to complete the comprehensive statewide household child care survey. Similar to surveys completed for DHS by Wilder Research in 1999 and 2004, this survey documents current early care and education and school-age care use by Minnesota families with children ages 12 and younger, with particular attention to low-income families. A key focus of the survey is the number and the various types of child care used by Minnesota families, including licensed family and center-based care; Head Start; legally unlicensed preschool and school age care; informal care by family, friends and neighbors; and self-care. In addition, the survey includes information about parent employment; age ranges and special needs of children; amount, times and days of

Child Care Use in Minnesota: November 2010 Report of the 2009 Statewide Household Child Care Survey
16
care; cost of care; use of child care subsidies; stability of arrangements; issues regarding choice and parent satisfaction with their arrangement; and knowledge about child care and parenting information and resources.
The survey was conducted from April 2009 through March 2010 with a statistically valid random sample of Minnesota families. One adult responsible for the household and most knowledgeable about the child care arrangements provided information about all the types of child care used at least once in each of the prior two weeks for one randomly-selected child per household.
Child care and other definitions in this report
“Child care” is how children spend time when they are not with a parent or at school during the two weeks prior to the survey. It includes all the times during the day or night. Researchers read respondents a list of different kinds of child care arrangements, programs children attend, and people who care for children. Parents stated which ones they used at least once in each of the last two weeks for a randomly-selected child. If the child was on vacation or home sick during the past two weeks, responses referred to the two weeks before the vacation or illness. The types of care in the survey are:
Center-based care, which includes Head Start, a child care center, a nursery school or preschool, or pre-kindergarten, not including child care or babysitting in either the child’s home or someone else’s home.
A program that provides before-school, after-school or summer care outside the child’s home.
Child care or babysitting in the respondent’s home or the child’s other parent’s home by someone other than the child’s parents. This would include any person ages 13 and over, including a relative, an older sibling, a neighbor or a nanny.
Child care or babysitting in someone else’s home during the day, evening or overnight, either a licensed family child care home or not.
Supervised activities or lessons at a recreation center, library, church, camp, gym or a sports facility. During the summer this included an organized summer program, such as a recreation program, summer day camp or overnight camp.
Self care or whenever children took care of themselves or stayed alone with a brother or sister who is 12 or younger on a regular basis, even for a small amount of time.
Child Care Use in Minnesota: November 2010 Report of the 2009 Statewide Household Child Care Survey
17
In this study, child care excludes care provided by medical or social services, such as personal care attendants, doctors or nurses, group home staff, respite care providers and case managers.
“Family, friend and neighbor (FFN) care” includes informal care in the child’s home or in someone else’s home. Care provided in someone else’s home is defined as FFN care if it is reported as not a licensed family child care home. FFN caregivers include grandparents, aunts, siblings, cousins, nannies and non-relatives 13 or older.
The “primary arrangement” is the type of child care the respondent reported to be used most often for the randomly-selected child at least once a week in each of the last two weeks.
“Regular” means used at least once a week during each of the last two weeks.
“Non-standard schedule” means child care that occurs before 7 a.m., after 6 p.m. or on a weekend.
“Parent” is the survey respondent – the adult in the household most knowledgeable about the children’s care. In some cases the respondent was a grandparent, relative or other caregiver functioning as the primary caregiver for the child, and was included in this report as a “parent.”
Households with “working parents” refers to single parents working full or part time and two-parent households with each parent working at least part time.
“Households with low incomes” are those whose annual income is at or below 200 percent of the federal poverty guideline for a family of their size. Because the survey asked for income in ranges rather than exact income, this is a high estimate of the number of households with low incomes.
“Out-of-pocket expenses” for child care are payments made by the parent or anyone in the household for the care of one or more children during the previous week. Parents who receive a subsidy through the Child Care Assistance Program may have out-of-pocket expenses or co-pays amounting to part but not all of the cost of the care based on their income.12 Other kinds of subsidies, such as the Child Care Dependent Tax Credit, reduce income taxes for eligible families who claim child care expenses. Parents using these types of subsidies have out-of-pocket costs equal to the full cost of care.
“Metro” refers to the seven-county Twin Cities metropolitan region (Hennepin, Ramsey, Anoka, Scott, Carver, Dakota and Washington counties). “Urban” refers to Minneapolis and
12 Some families with a child care subsidy could also have out-of-pocket expenses if the maximum subsidy rate does not cover the full cost of the amount charged by the child care provider.
Child Care Use in Minnesota: November 2010 Report of the 2009 Statewide Household Child Care Survey
18
St. Paul, and “Suburban” refers to the rest of the Metro area. “Greater Minnesota” comprises the 80 counties in the state economic development regions 1 through 10.
Survey methods and samples
The literature in survey research indicates that households that are low-income, younger and minority are less likely to have a landline phone.13 Accordingly, Wilder Research used an address-based sample for this study to ensure representation of all Minnesota families with children ages 12 or younger regardless of their landline or cell phone status.
Wilder purchased a random list of residential addresses stratified by region through a vendor, Marketing Systems Group, who obtains this list from the U.S. Postal Service. Approximately 70 percent of those addresses were matched to phone numbers using public phone number databases. To increase participation in the survey by low-income households in particular, following the approval of the DHS Institutional Review Board to protect confidentiality of families, DHS provided phone numbers for households in our address-based sample without a listed phone number from the DHS Data Warehouse and SSIS Repository. Overall, DHS looked up 9,246 addresses with no listed phone numbers from the sampling vendor and provided 434 phone numbers they could match to those addresses. From these, 23 surveys were completed.
Letters on DHS letterhead were sent to all 9,246 households without listed phone numbers with information on the purpose of the study, the procedures for collecting information, and the risks and benefits to participation. The letter clearly explained that their participation in the study was completely voluntary. It also included a statement about the participant’s right to privacy. All households were given an opportunity to decline or agree to participation in the survey at the time of the phone call. The letter asked households to contact Wilder Research on our toll-free number to be screened and, if eligible, to complete the survey over the phone. The letter informed respondents of a chance to win $100 for households that contacted us and were determined to be ineligible; if eligible, they received a $10 gift card for completing the survey. This approach produced an additional 118 completed surveys (a 12 percent response rate).
In addition, because DHS has particular interest in child care use data for low-income families, in order to increase the response rates among both low-income respondents and respondents without landline phones, households who were contacted by mail were offered $10 incentives to call in to complete the survey.
13 Piekarski, L. (2005, June). Summit Addresses Wireless Challenges to Telephone Sampling, The Frame. Fairfield, Connecticut: Survey Sampling International.

Child Care Use in Minnesota: November 2010 Report of the 2009 Statewide Household Child Care Survey
19
Trained interviewers called each telephone number (nearly 34,000) to determine eligibility (a household with one or more children ages 12 or younger that used any form of child care at least once a week in each of the prior two weeks). Using computer-assisted scheduling, interviewers called each randomly selected number at least 10 times at different times of the day and on different days of the week, including weekends. After making contact, interviewers continued calling until exhausting all reasonable leads. Initial contacts were made in English, Hmong, Somali and Spanish. The survey was translated and conducted in English, Hmong, Somali and Spanish by Wilder’s bilingual Survey Interviewers as preferred by the respondents. Other languages could be accommodated through an interpretation vendor. Overall, 99 percent of the surveys were completed in English. The survey took, on average, approximately 30 minutes.
The original plan involved a method to over-sample low-income households with children ages 12 and younger; however, the method did not have to be employed because the targets for the low-income sample were reached without extra screening or oversampling. The $10 incentive and the economic recession both likely contributed to the higher than expected participation rate by households with low incomes.
A proposed plan to over-sample households within communities of color was not implemented due to lack of funding.
We designed a stratified random sample of households to represent all households in Minnesota with children ages 12 and younger. As in 2004, we stratified the sample proportionately by Governor’s Economic Development Region to ensure the sample was geographically representative of all households with children ages 12 and younger in Minnesota. For example, if 5 percent of the households with children of child care age reside in Region 3, then that proportion of the sample comes from that region. Because Region 11 contains 55 percent of the households with children ages 12 and younger, we sub-stratified that region into Hennepin, Ramsey, Dakota, Washington, Anoka and Carver/ Scott Counties.
The following table shows how the 1,209 completed household surveys are distributed by region, compared with population estimates from the 2006-08 American Community Survey (Public Use Microdata Series, 2008). Of the 1,209 surveys, 308 were completed during the summer and 901 during the school year.

Child Care Use in Minnesota: November 2010 Report of the 2009 Statewide Household Child Care Survey
20
5. Geographic distribution of completed surveys
Region or county
Percent of completed surveys
(N=1,209)
American Community Survey
estimates
Northwest (region 1 and 2) 5% 5%
Arrowhead (region 3) 5% 5%
West Central (regions 4, and 5) 4% 2%
Central (region 7) 14% 16%
Southwest (regions 6, 8 and 9) 9% 7%
Southeast (region10) 10% 11%
Twin Cities (region 11) 54% 55%
Anoka 7% 7%
Carver/Scott 6% 5%
Dakota 8% 8%
Hennepin 20% 21%
Ramsey 8% 9%
Washington 5% 5%
Notes: American Community Survey estimates are the 2006-08 estimated households with children ages 12 and under. Also, US Census Bureau data do not exactly match Minnesota’s economic development regions.
Instrument development
The survey instrument, initially developed by Wilder Research for the 1999 and 2004 Household Child Care Use in Minnesota surveys, was updated and modified with the assistance of an advisory group consisting of state, county and local child care professionals, policymakers and social service representatives (see Acknowledgements). The original instrument drew relevant questions from these national and local child care surveys:
Minnesota Child Care Resource & Referral Outcomes Follow-up Survey
Quality of Care from a Parent’s Point of View (Portland State University)
National Child Care Survey (Urban Institute)
Minnesota Family Investment Program, Longitudinal Study
National Household Education Surveys (National Center for Education Statistics)
Census Bureau, Survey of Income and Program Participation, Child Care Module

Child Care Use in Minnesota: November 2010 Report of the 2009 Statewide Household Child Care Survey
21
National Survey of American Families (Urban Institute)
The survey instrument was pre-tested with 50 parents for final revisions.
Strengths and limitations of survey results
The statewide stratified random sample of 1,209 has a sampling error of about +/- 2.8 percent. Sub-samples have higher sampling errors and should be interpreted with caution, for example:
+/- 5 to 6 percent for the sub-samples of 270 children ages 0 to 2; 358 children ages 3 to 5; 344 children ages 6 to 9; and 237 children ages 10 to 12
+/- 5 percent for the low-income sample of 375 households
For the child’s primary arrangements: +/- 5 percent for 327 center-based, +/- 6 percent for 237 FFN in own home, +/- 8 percent for 147 licensed family homes and 134 FFN in other homes, +/- 12 percent for 66 supervised activities
+/- 14 percent for 52 households with low incomes with a child care subsidy
The higher sampling errors do not diminish the statistical significance but should be taken into account when generalizing results or making population estimates.
The overall response rate is 32.5 percent, which is acceptable given the growing challenges in conducting telephone surveys.14 The response rate is the number of completed surveys divided by the difference of the number of sampled households minus the number determined to be ineligible (no children ages 12 and younger that use child care) or presumed to be ineligible based on known cases. The method for including households based on addresses not landline telephone, the multiple attempts and incentives to encourage participation, and the geographic stratification contribute to the survey strengths.
The respondents include only those who regularly use child care, while the Census data provides points of reference relative to all households with children ages 12 and younger. It appears, however, the sample may slightly under-represent single parents and respondents of color. Households participating in the survey were more likely to be two parent, English-
14 Mealing, N.M., Banks, E., Jorm, L.R., Steel, D. G., Clements, M.S., and Rogers, K. D. (2010). Investigation of relative risk estimates from studies of the same population with contrasting response rates and designs. BMC Medical Research Methodology 10:26.1811-1817. Lee, S., Brown, E.R., Grant, D., Belin, T. R., and Brick, M. (2009). Exploring non-response bias in the health survey using neighborhood characteristics. Survey Research Methods 99:10. Schouten, B., Cobben, F., and Bethlehem, J. (2009, June). Indicators for the representativeness of survey response. Survey Methodology 35:1, pp. 101-113.

Child Care Use in Minnesota: November 2010 Report of the 2009 Statewide Household Child Care Survey
22
speaking households than the overall population of households in Minnesota with children under 13. Compared with the 2004 survey participation, the 2009 survey has about 5 percentage points fewer single parents and respondents of color, primarily fewer Asians and respondents in the other or mixed primary race/ethnicity category.
In the tables, the number of respondents in the total sample being reported is shown with a capital “N,” and the number in component subsamples is shown with a lowercase “n.” That is, if the table shows the figure of 35 percent and N=200, it means that 35 percent of 200 families, or 70 respondents, are represented by that statistic.
Results for the 2004 and 2009 are comparable; however, comparing the results for 2004 and 2009 surveys with the results from the 1999 household child care survey, Child Care Use in Minnesota,15 should be done with caution because of some key methodological differences summarized in Figure 6. The 1999 survey included a somewhat larger sample of 2,450 households with children ages 14 and younger in order to provide results by geographic region and had an overall sampling error of +/-2 percent. It used an open-ended diary format to collect detailed information on child care arrangements and schedules for the youngest child in the family. All this information was then coded and grouped into categories for reporting. This (the 2009) survey and the 2004 survey include only households with children ages 12 and younger that use some form of child care, and respondents chose child care arrangements and schedules from pre-categorized lists for a randomly-selected child, which may or may not be the youngest child. In addition, in the 1999 study, the primary child care arrangement was determined based on the time diary; while in the 2004 and 2009 studies, the primary arrangement is defined by the parent as the one used most often.
6. Key methodological differences
1999 Survey 2004 Survey 2009 Survey
Completed surveys 2,450 1,363 1,209
Main method Diary Telephone interview Telephone interview
Households with Children 14 and younger
Children 12 and under that use child care
Children 12 and under that use child care
Focus of detailed information
Youngest child Randomly-selected child
Randomly-selected child
Coding of child care types
Open coding Pre-categorized and read to respondent
Pre-categorized and read to respondent
15 Chase, R. and Shelton, E. (2001).

Child Care Use in Minnesota: November 2010 Report of the 2009 Statewide Household Child Care Survey
23
Report structure
Depending on the type of question, the report describes results for all households, by age group based on the age of the randomly-selected child within the household, or by type of child care arrangement. Results are rounded and reported as whole numbers.
Researchers tested key variables to see if results differed statistically by these family and child care characteristics: selected child’s age (0-2, 3-5, 6-9, and 10-12), household income (at or below 200 percent of poverty versus above that income level), race/ethnicity (households of color versus white households), geography (seven-county metro versus Greater Minnesota, and within the metro area, cities versus suburbs), working status (households with single parents working full or part time and two-parent households with each parent working at least part time versus households with no parents working outside the home) and, among households with low incomes, whether or not the household receives a government subsidy through the Child Care Assistance Program for the cost of child care (child care subsidy versus no child care subsidy).
The statistically significant differences (p<.05) are indented in this format at the end of each topical section.
Child Care Use in Minnesota: November 2010 Report of the 2009 Statewide Household Child Care Survey
24
Profile of study households and children This study includes only households that reported regularly using any child care. Of the households with children ages 12 and younger identified for this survey, 24 percent reported no regular use of any child care (non-parental, non-school care), and were not interviewed further. In the 2004 survey 26 percent reported no regular child care use and in 1999 survey of households with children ages 14 and younger, 18 percent reported no regular child care use.
This section describes the sample of Minnesota households with children 12 and younger who reported using child care, compared with Census data without the qualifier of child care use.
Demographics of respondents, households and children
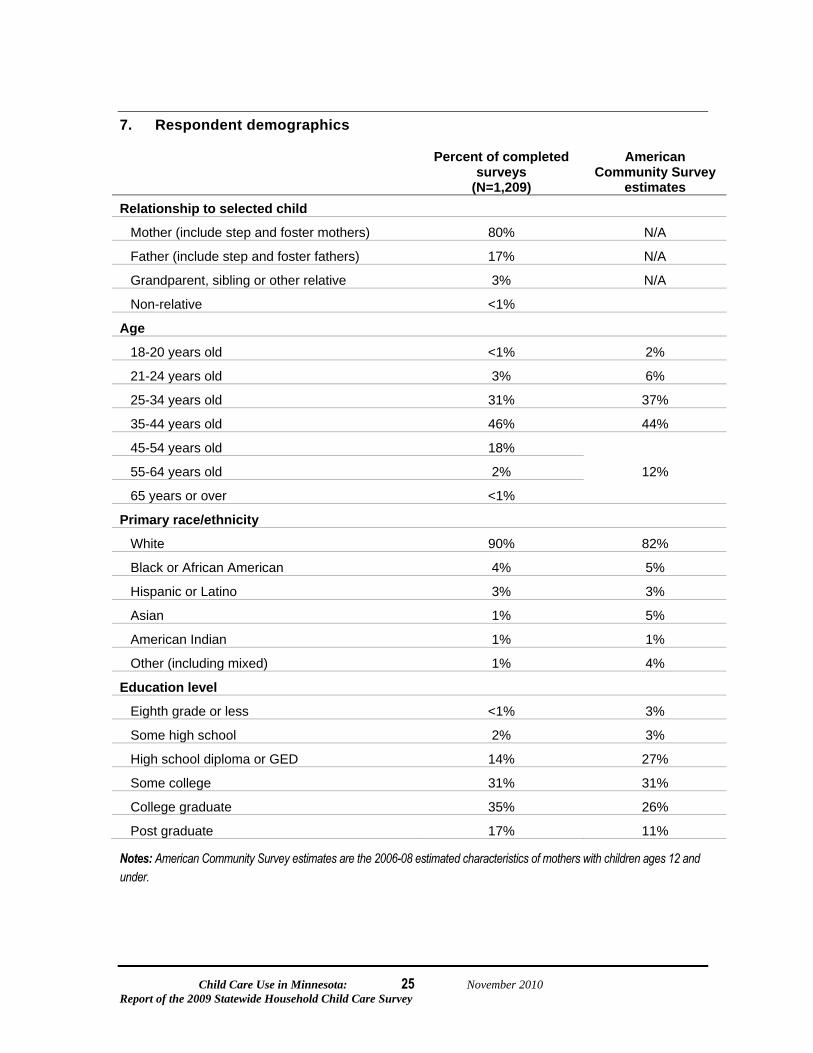
Interviewers asked to speak to the person ages 18 or older who was most knowledgeable about the children’s care. As shown in Figure 7, nearly every respondent (97 percent) is the parent of the randomly-selected child in the household. Eighty percent of the respondents are mothers.
In terms of age, the largest proportion is 35 to 44 (46 percent), followed by 25 to 34 (31 percent).
Ninety percent of respondents identify themselves as white, 4 percent as black or African American, 3 percent as Hispanic or Latino, 1 percent as Asian and 1 percent as American Indian. About 1 percent is of other racial or ethnic identification or of mixed race or ethnicity.
In terms of highest level of education completed, 2 percent of respondents did not complete high school, and 14 percent have a high school education only (diploma or GED). Thirty-one percent have some college education, and 52 percent have a college degree, including 17 percent with post-graduate work or professional school attendance.
Child Care Use in Minnesota: November 2010 Report of the 2009 Statewide Household Child Care Survey
25
7. Respondent demographics
Percent of completed surveys
(N=1,209)
American Community Survey
estimates
Relationship to selected child
Mother (include step and foster mothers) 80% N/A
Father (include step and foster fathers) 17% N/A
Grandparent, sibling or other relative 3% N/A
Non-relative <1%
Age
18-20 years old <1% 2%
21-24 years old 3% 6%
25-34 years old 31% 37%
35-44 years old 46% 44%
45-54 years old 18%
12% 55-64 years old 2%
65 years or over <1%
Primary race/ethnicity
White 90% 82%
Black or African American 4% 5%
Hispanic or Latino 3% 3%
Asian 1% 5%
American Indian 1% 1%
Other (including mixed) 1% 4%
Education level
Eighth grade or less <1% 3%
Some high school 2% 3%
High school diploma or GED 14% 27%
Some college 31% 31%
College graduate 35% 26%
Post graduate 17% 11%
Notes: American Community Survey estimates are the 2006-08 estimated characteristics of mothers with children ages 12 and under.

Child Care Use in Minnesota: November 2010 Report of the 2009 Statewide Household Child Care Survey
26
Eight-five percent of the households surveyed have two parents present, including biological parents, adoptive, foster, or stepparents and the spouse or partner of such parents. The remaining 15 percent are one-parent households.
Most respondents speak English as their primary language in the home (96 percent); 2 percent speak Spanish, and less than 1 percent Hmong. (The survey was translated and conducted in English, Hmong, Somali and Spanish.)
Slightly over half of the respondents (54 percent) live in the seven-county Twin Cities metropolitan area, and 46 percent live in Greater Minnesota.
Ten percent of the households have been at their current residence for less than one year, 26 percent for one to five years, and 64 percent for more than five years.
8. Household demographics
Percent of completed surveys
(N=1,209)
American Community Survey
estimates
Number of parents in household
Two parent household 85% 71%
One parent household 15% 29%
Primary language in the home
English 96% 87%
Hmong <1% 1%
Somali <1% 1%
Spanish 2% 6%
Other 1% 5%
Length of time at current residence
One year or less 10% 16%
13 months to 4 years 26% 38%
5 or more years 64% 46%
Source: American Community Survey estimates are the 2006-08 estimated households with children ages 12 and under.
Overall, in comparison with all households in Minnesota with children ages 12 and younger, the survey respondents may slightly under represent respondents of color, respondents with lower educational levels, single-parent households, and households whose primary language is not English. However, census estimates include all households with children ages 12 and younger; whereas the survey targeted only households that use child care.

Child Care Use in Minnesota: November 2010 Report of the 2009 Statewide Household Child Care Survey
27
Demographics of children in respondent households
Figure 9 shows that, of the randomly-selected children, 22 percent are under age 3, 30 percent ages 3 to 5, 28 percent ages 6 to 9 and 20 percent ages 10 to 12. Overall, randomly-selected children are similar in age to all children in the surveyed households and slightly younger than all children in Minnesota. Compared to children in households that use child care, children in households that don’t use child care are less likely to be under age 3, and much less likely to be ages 3 to 5 and more likely ages 6 to 9 and much more likely ages 10 to 12.
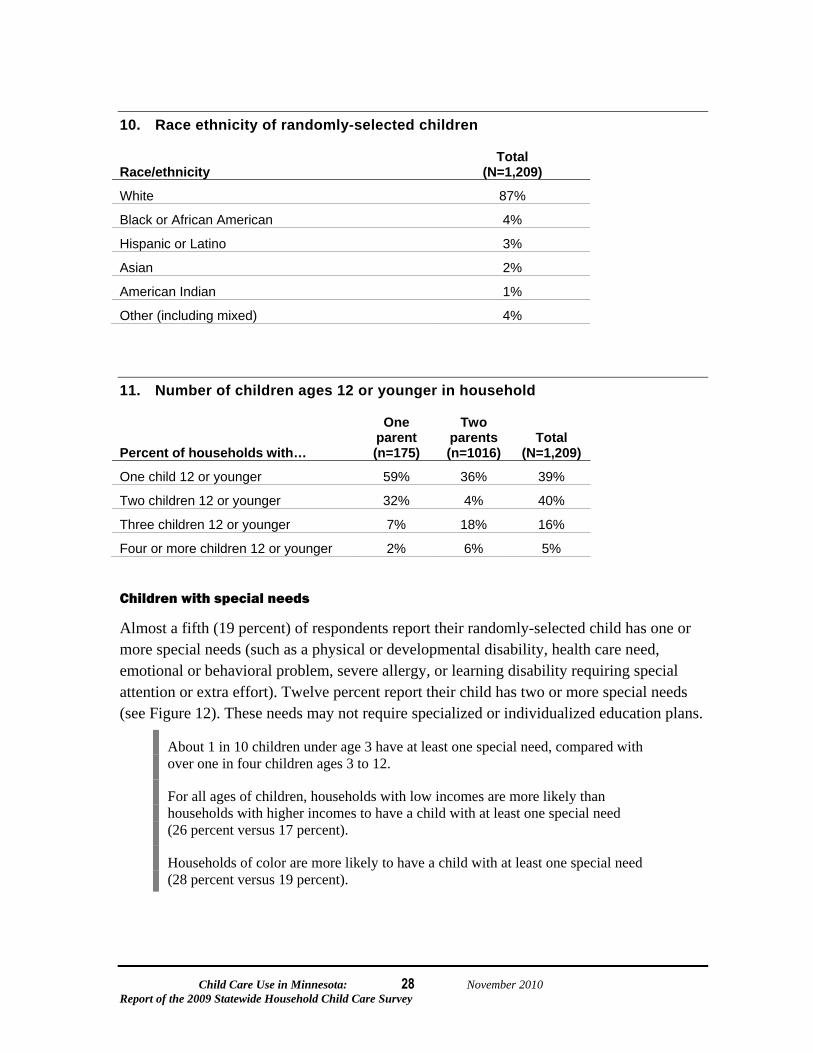
Of the randomly-selected children, 87 percent are white; 4 percent are black, 3 percent Hispanic or Latino, 2 percent Asian, 1 percent American Indian, and 4 percent are multiracial or some other race or ethnicity (see Figure 10). These proportions are similar to those of the adult respondents, with one exception: the proportion of children who are multiracial or some other race or ethnicity (4 percent) is higher than the proportion of adults (1 percent).
Of the households surveyed, 39 percent have one child ages 12 or younger; 40 percent have two children 12 or younger; 16 percent have three children 12 or younger, and 5 percent have four or more children 12 or younger (see Figure 11).
One parent households are more likely to have one child than two parent households (59 percent versus 36 percent).
9. Age of children
Age
Percent of all children in households
screened out, not using child care
(N=531)
Percent of all children in
households using child care
(N=2,279)
Percent of randomly-
selected children in survey (N=1,209)
Percent of all children
in Minnesota
Under 3 17% 21% 22% 24%
3-5 years old 13% 27% 30% 24%
6-9 years old 35% 32% 28% 30%
10-12 years old 35% 20% 20% 23%
Source: American Community Survey estimates are the 2006-08 estimated data.
Child Care Use in Minnesota: November 2010 Report of the 2009 Statewide Household Child Care Survey
28
10. Race ethnicity of randomly-selected children
Race/ethnicity Total
(N=1,209)
White 87%
Black or African American 4%
Hispanic or Latino 3%
Asian 2%
American Indian 1%
Other (including mixed) 4%
11. Number of children ages 12 or younger in household
Percent of households with…
One parent (n=175)
Two parents (n=1016)
Total (N=1,209)
One child 12 or younger 59% 36% 39%
Two children 12 or younger 32% 4% 40%
Three children 12 or younger 7% 18% 16%
Four or more children 12 or younger 2% 6% 5%
Children with special needs
Almost a fifth (19 percent) of respondents report their randomly-selected child has one or more special needs (such as a physical or developmental disability, health care need, emotional or behavioral problem, severe allergy, or learning disability requiring special attention or extra effort). Twelve percent report their child has two or more special needs (see Figure 12). These needs may not require specialized or individualized education plans.
About 1 in 10 children under age 3 have at least one special need, compared with over one in four children ages 3 to 12.
For all ages of children, households with low incomes are more likely than households with higher incomes to have a child with at least one special need (26 percent versus 17 percent).
Households of color are more likely to have a child with at least one special need (28 percent versus 19 percent).

Child Care Use in Minnesota: November 2010 Report of the 2009 Statewide Household Child Care Survey
29
12. Special health care needs of randomly-selected children
0-2 years (n=270)
3-5 years (n=358)
6-9 years
(n=344)
10-12 years
(n=237) Total
(N=1,209)
Child has an IEP, IIIP, or IFSP 4% 8% 12% 15% 9%
Child has special needs that require a lot of extra effort 6% 8% 9% 10% 8%
Child has a physical or developmental disability that requires special attention 5% 8% 9% 8% 8%
Child has an emotional or behavioral issue that requires special attention 3% 6% 11% 10% 7%
Child has a health care need or severe allergy that requires extra attention 4% 9% 5% 10% 7%
Child has a learning disability that requires specialized approaches 2% 5% 9% 13% 7%
Child has a caregiver or provider who quit caring for child because of child’s behavioral problems 1% 2% 4% 4% 3%
Child has a caregiver or provider who quit caring for child because of child’s medical problems <1% <1% 2% 2% 1%
Child has at least one of the above-mentioned special needs 11% 20% 22% 24% 19%
Child has two or more of the above-mentioned special needs 6% 10% 15% 16% 12%
Household employment
Sixty-nine percent of respondents are working for pay at a job (during the week prior to the survey); 4 percent hold a job but were not at work during that week because of vacation, jury duty, sickness or some other temporary reason. Seven percent are looking for work; 5 percent are in school; less than 1 percent are in an unpaid job training program, and 2 percent are unable to work due to a disability. About 21 percent are at home full time (see Figure 13).
Respondents with children ages 5 and under are more likely to be at home full-time (24 percent versus 18 percent) than respondents where the select child is ages 6 to 12.

Child Care Use in Minnesota: November 2010 Report of the 2009 Statewide Household Child Care Survey
30
13. Work activities of respondents during the previous week
0-2 years (n=268)
3-5 years (n=358)
6-9 years
(n=343)
10-12 years
(n=236) Total
(N=1,205)
Working for pay at a job (including self-employed) 67% 65% 73% 73% 69%
Holding a job but not at work (vacation, jury duty, sick) 5% 4% 4% 5% 4%
Looking for work 8% 6% 10% 5% 7%
Going to school 7% 5% 4% 4% 5%
In an unpaid job training program <1% <1% <1% <1% <1%
At home full-time 24% 24% 18% 18% 21%
Unable to work because of disability 2% 3% 2% 3% 2%
Other 5% 6% 2% 1% 4%
Figure 14 shows that 93 percent of households have least one parent in the work force, including 28 percent with all parents in the household working full time and 25 percent with one employed full time and one employed part time.
The proportion of households with single parents employed full time goes up as the child’s age goes up (from 2 percent for under age 3, to 10 percent for ages 10 to 12).

Child Care Use in Minnesota: November 2010 Report of the 2009 Statewide Household Child Care Survey
31
14. Employment status of households
0-2 years (n=268)
3-5 years
(n=353)
6-9 years
(n=337)
10-12 years
(n=226) Total
(N=1,184)
Single parent, employed 40 or more hours/week 2% 3% 7% 10% 6%
Single parent, employed less than 40 hours/week 6% 5% 5% 3% 5%
Single parent, not employed 5% 4% 5% 6% 5%
Two parents, both employed 40 or more hours/week 28% 24% 31% 27% 28%
Two parents, one employed 40 or more hours/week, one employed less than 40 hours/week 26% 24% 25% 24% 25%
Two parents, one employed 40 or more hours/week, one not employed 25% 27% 19% 23% 23%
Two parents, one employed less than 40 hours/week, one not employed 4% 4% 6% 2% 4%
Two parents, both employed less than 40 hours/week 2% 4% 2% 3% 3%
Two parents, neither employed 3% 4% 1% 3% 3%
Percent of households with at least one parent employed 93% 92% 94% 92% 93%
Household income
Figure 15 shows the distribution of household income by the age of the selected child. About a third (31 percent) are considered households with low incomes. That is, their annual income is within or below the income range that includes 200 percent of the federal poverty guideline for a household of their size. For example, for a household of four people, 200 percent of the federal poverty guideline is $44,100. Because the survey asked for income in ranges rather than exact income, this may be a high estimate of the number of households with low incomes.

Child Care Use in Minnesota: November 2010 Report of the 2009 Statewide Household Child Care Survey
32
15. Household income
Age of selected child
Household income, 2009
0-2 years
(n=253) 3-5 years (n=339)
6-9 years
(n=331)
10-12 years
(n=224) Total
(N=1,147)
Under $15,000 8% 6% 7% 7% 7%
$15,000-$19,999 6% 2% 2% 5% 3%
$20,000-$29,999 6% 9% 8% 7% 8%
$30,000-$39,999 11% 8% 9% 9% 9%
$40,000-$49,999 8% 10% 9% 9% 9%
$50,000-$74,999 19% 21% 19% 20% 20%
$75,000-$99,999 23% 20% 20% 18% 20%
Over $100,000 19% 25% 26% 24% 24%
Low income families (at or below 200% of poverty) 33% 31% 29% 32% 31%
Use of Minnesota Family Investment Program (MFIP)
Five percent of households in this survey report currently receiving benefits under the Minnesota Family Investment Program (MFIP), also known as Temporary Assistance for Needy Families (TANF) and welfare. Over half of these households (52 percent) have one child ages 12 or younger; 29 percent have two, 12 percent three, and 6 percent have four or more children.
Use of Earned Income Tax Credit
In this survey of households with children ages 12 and under who use child care, 22 percent of the households report that someone in their household used this tax credit in the past year. Forty-two percent of these households have one child ages 12 or younger; 33 percent have two, 18 percent three, and 7 percent have four or more children.
Availability of support for child care
As shown in Figure 16, 65 percent of respondents have a relative, other than those in the household, who would be available “always,” “usually” or “sometimes” to care for their child or children on a regular basis. About 52 percent know of an individual such as a neighbor or friend who might be available “always,” “usually” or “sometimes” to care for their children. Seventy-nine percent say they “always,” “usually” or “sometimes” have at least one relative, neighbor or friend available to provide child care on a regular basis.
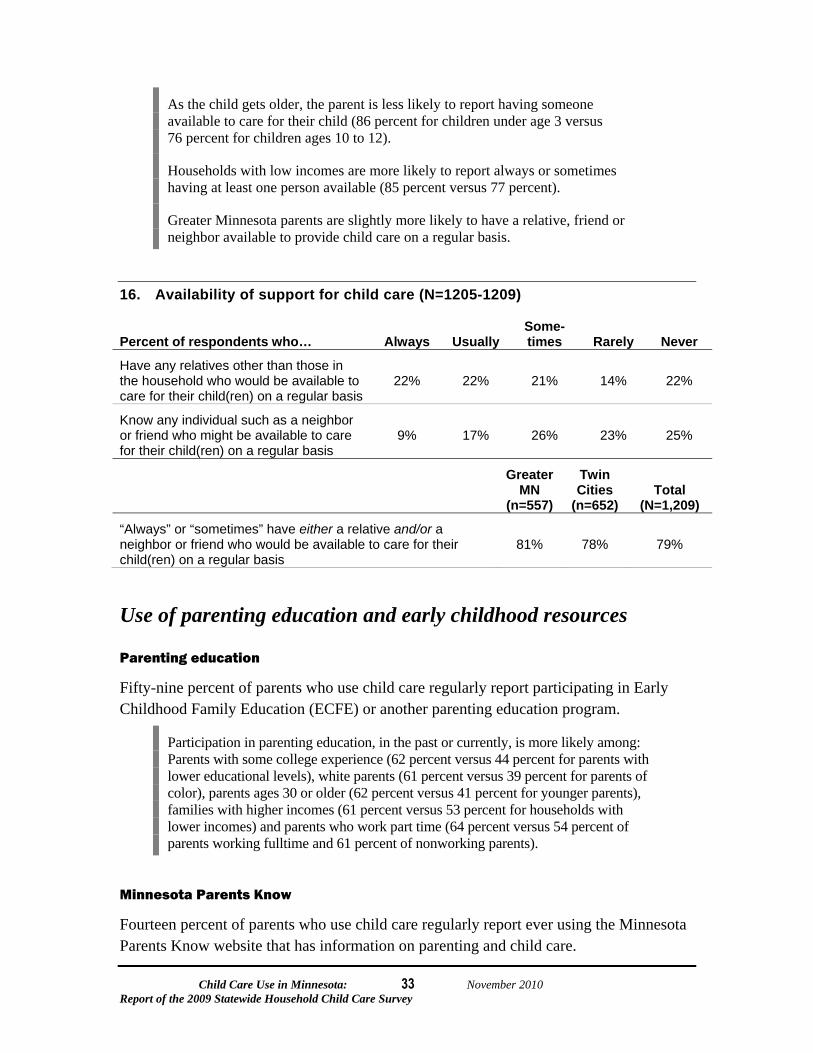
Child Care Use in Minnesota: November 2010 Report of the 2009 Statewide Household Child Care Survey
33
As the child gets older, the parent is less likely to report having someone available to care for their child (86 percent for children under age 3 versus 76 percent for children ages 10 to 12).
Households with low incomes are more likely to report always or sometimes having at least one person available (85 percent versus 77 percent).
Greater Minnesota parents are slightly more likely to have a relative, friend or neighbor available to provide child care on a regular basis.
16. Availability of support for child care (N=1205-1209)
Percent of respondents who… Always Usually Some-times Rarely Never
Have any relatives other than those in the household who would be available to care for their child(ren) on a regular basis
22% 22% 21% 14% 22%
Know any individual such as a neighbor or friend who might be available to care for their child(ren) on a regular basis
9% 17% 26% 23% 25%
Greater MN
(n=557)
Twin Cities
(n=652) Total
(N=1,209)
“Always” or “sometimes” have either a relative and/or a neighbor or friend who would be available to care for their child(ren) on a regular basis
81% 78% 79%
Use of parenting education and early childhood resources
Parenting education
Fifty-nine percent of parents who use child care regularly report participating in Early Childhood Family Education (ECFE) or another parenting education program.
Participation in parenting education, in the past or currently, is more likely among: Parents with some college experience (62 percent versus 44 percent for parents with lower educational levels), white parents (61 percent versus 39 percent for parents of color), parents ages 30 or older (62 percent versus 41 percent for younger parents), families with higher incomes (61 percent versus 53 percent for households with lower incomes) and parents who work part time (64 percent versus 54 percent of parents working fulltime and 61 percent of nonworking parents).
Minnesota Parents Know
Fourteen percent of parents who use child care regularly report ever using the Minnesota Parents Know website that has information on parenting and child care.
Child Care Use in Minnesota: November 2010 Report of the 2009 Statewide Household Child Care Survey
34
Reported use of Minnesota Parents Know is similar for lower and higher income households, white respondents and those of color, and households in Greater Minnesota and the metro area.
Early Childhood Screening
Ninety-four percent of parents who use child care regularly report knowing about Early Childhood Screening (sometimes called preschool or kindergarten screening), which is available through public school districts and helps identify challenges that families can get help with before their child starts school.
Among households that use child care, some are more aware of Early Childhood Screening than other households. These include households in Greater Minnesota (96 percent) and the suburbs (93 percent) versus those in the cities of Minneapolis and St. Paul (86 percent), white households (95 percent versus 84 percent of households of color), and parents with children ages 3 and older (93-99 percent versus 86 percent for children ages 2 and younger).
Other resources
Eighty-six percent report having regular Internet access at home; 7 percent say they have it somewhere else, and 7 percent report no regular Internet access.
Fifty-nine percent of survey respondents say they are interested in receiving electronic information about high-quality child care: 48 percent via email, 21 percent via social networking sites, 14 percent via podcasts, 10 percent via mobile web browsers, 10 percent via Wiki web page, and 9 percent via YouTube.
More parents of children ages five and under are interested in receiving information than those of children ages 6 to 12 (63 percent versus 51 percent). Households with low incomes are less interested in receiving electronic information (52 percent versus 60 percent), and households in the metro area are more interested (62 percent versus 52 percent).
Child Care Use in Minnesota: November 2010 Report of the 2009 Statewide Household Child Care Survey
35
Profile of child care use This section presents information on the number of different arrangements used by families and types of care used, including information on the arrangements used most often and information about all types of care for children with more than one arrangement.
Any child care use
As mentioned, this survey includes only households that report regularly using child care. Of the households with children ages 12 and younger identified for this survey, 76 percent report regular use of any child care. (Regular child care is defined as non-parental, non-school care used at least once a week during each of the last two weeks.)
Of the children ages 12 and younger in the households identified for this survey, 65 percent are in some type of child care arrangement regularly.
Children ages 3 to 5 are the most likely to be in some type of child care arrangement regularly (82 percent), followed by children ages 0 to 2 (69 percent), children ages 6 to 9 (60 percent) and children ages 10 to 12 (50 percent).
Number of child care arrangements
Respondents were asked how many child care arrangements their household used for all their children. Researchers adjusted this number if additional arrangements were reported for the randomly-selected child. A fifth (20 percent) of households who use child care regularly use just one arrangement for all their children; 40 percent use two, 27 percent use three, and 14 percent use four or more. On average, households use 2.4 child care arrangements for all their children (see Figure 17).
Households of color are more likely than white households to have only one child care arrangement (30 percent versus 19 percent).

Child Care Use in Minnesota: November 2010 Report of the 2009 Statewide Household Child Care Survey
36
17. Number of child care arrangements for all children ages 12 and younger
Number of regular child care arrangements
Percent of all households
(N=1,209)
One 20%
Two 40%
Three 27%
Four to six 14%
Mean number of arrangements, including all children 2.4
Figures 18 and 19 show the average number of child care arrangements for the randomly-selected child, which is similar during the summer and school year.
Combining the summer and school year use, children ages 2 and younger are more likely than those ages 3 and older to have only one child care arrangement (47 percent versus 25 percent).
18. Number of child care arrangements by age, summer, selected child
Number of arrangements
0-2 years (n=75)
3-5 years (n=83)
6-9 years (n=81)
10-12 years (n=69)
Total (N=308)
One 43% 28% 24% 28% 30%
Two 32% 47% 44% 35% 40%
Three 24% 21% 20% 26% 22%
Four to six 1% 5% 12% 12% 8%
Mean number of arrangements, randomly-selected child 1.8 2.0 2.2 2.2 2.1
19. Number of child care arrangements by age, school year, selected child
Number of arrangements
0-2 years
(n=195)
3-5 years
(n=275)
6-9 years
(n=263)
10-12 years
(n=168) Total
(N=901)
One 49% 22% 29% 25% 30%
Two 36% 43% 40% 41% 40%
Three 13% 26% 24% 24% 22%
Four to six 2% 9% 8% 11% 7%
Mean number of arrangements, randomly-selected child 1.7 2.2 2.1 2.2 2.1

Child Care Use in Minnesota: November 2010 Report of the 2009 Statewide Household Child Care Survey
37
Changes in child care arrangements in the past 12 months (continuity of care)
Three-quarters of the respondents report they have not ended a child care arrangement for the randomly-selected child in the past 12 months.16 About 17 percent have had just one previous arrangement, and just 7 percent had two or more arrangements that ended in the last year. The mean number of other arrangements in the past year is less than one for all children. For children who did have an arrangement end in the last 12 months, the mean number of previous arrangements is 1.5. This profile of continuity of care is similar to the 2004 profile. The number of previous arrangements is not related to income or use of child care subsidies.
All types of child care use
Summer child care use
Figure 20 shows all the arrangements used during the summer for the selected child; the totals do not equal 100 percent since families may have more than one arrangement. Overall, when they are not cared for by their parents, 77 percent of children ages 12 and younger are cared for during the summer by family, friends and neighbors (FFN), mainly grandparents (41 percent), followed by non-relatives (24 percent), other relatives (21 percent), and older siblings (16 percent). Forty-nine percent are in supervised activities, 31 percent in center-based programs, 13 percent in licensed family homes and 14 percent in self care, which includes care by a sibling under age 13.
During the summer, FFN care is more commonly provided by grandparents for children under age 6 than for children ages 10 to 12 (56 percent for under age 3 and 43 percent for ages 3 to 5 versus 26 percent for ages 10 to 12). For children ages 6 to 12, the FFN care more often includes older siblings (36 percent).
Center-based care is higher for children under age 6 (40 percent for children under age 3 and 39 percent for children ages 3 to 5 compared with 25 percent for children ages 6 to 9 and 17 percent for children ages 10 to 12).
Supervised activities, including day camps, are fairly common for children ages 6 to 9 (77 percent) and those ages 10 to 12 (65 percent), compared with 40 percent of children ages 3 to 5. Overall, use of supervised activities during the summer is higher than in 2004 (49 percent, up from 31 percent).
16 In center-based child care settings, this does not preclude turnover among staff within the arrangement during that time but merely that the overall child care program has remained the same.

Child Care Use in Minnesota: November 2010 Report of the 2009 Statewide Household Child Care Survey
38
Thirty-six percent of children ages 10 to 12 are in self care during the summer, compared with 15 percent of children ages 6 to 9.
20. All types of child care used, summer, selected child
Types of child care
Age of child
0-2 years (n=75)
3-5 years (n=83)
6-9 years (n=81)
10-12 years (n=69)
Total (N=308)
FFN care 83% 75% 73% 78% 77%
Child’s grandparent 56% 43% 36% 26% 41%
Non-relative 21% 29% 26% 17% 24%
Another relative (aunt, cousin, etc.) 29% 19% 16% 20% 21%
Child’s sibling ages 13+ 4% 10% 17% 36% 16%
Licensed family child care 19% 18% 10% 3% 13%
Center-based care 40% 39% 25% 17% 31%
Child care center, nursery school/ preschool 40% 35% - - 19%
School-age care program - - 25% 17% 10%
Head Start - 4% - - 1%
Self care 1% 5% 15% 36% 14%
Supervised activities 13% 40% 77% 65% 49%
Note: Shows all types of care used at least once per week in each of the last two weeks. Children may be listed in multiple categories. Figures in bold are unduplicated totals of any subcategories shown below them.
School year child care use
Figure 21 shows all the arrangements used during the school year for the selected child; the totals do not equal 100 percent since families may have more than one arrangement. Overall, when they are not cared for by their parents or in school, 69 percent of children ages 12 and younger are cared for by family, friends and neighbors (FFN), mainly grandparents (35 percent) and non-relatives (22 percent), followed by older siblings (13 percent) and other relatives (13 percent). Fifty percent are in center-based programs, 46 percent in supervised activities, 14 percent in licensed family homes, and 14 percent in self care, which includes care by a sibling under age 13.
During the school year, FFN care use is highest for children under age 3 (76 percent), provided most commonly by grandparents (51 percent). For children ages 6 to 12, the FFN care more commonly includes older siblings (22 percent).

Child Care Use in Minnesota: November 2010 Report of the 2009 Statewide Household Child Care Survey
39
Center-based care is highest for children ages 3 to 5 (76 percent), followed by 45 percent for children ages 6 to 9 and 34 percent for children ages 0 to 2 and ages 10 to 12.
Supervised activities are fairly common for children ages 6 to 9 (58 percent) and those ages10 to 12 (63 percent), compared with 47 percent of children ages 3 to 5.
During the school year, licensed family child care use is highest for children under age 3 (25 percent), followed by children ages 3 to 5 (18 percent) and children ages 6 to 9 (9 percent).
Forty-four percent of children ages 10 to 12 are in self care during the school year, compared with 15 percent of children ages 6 to 9.
21. All types of child care used, school year, selected child
Types of child care
Age of child
0-2 years
(n=195)
3-5 years
(n=275)
6-9 years
(n=263)
10-12 years
(n=168) Total
(N=901)
FFN care 76% 68% 68% 65% 69%
Child’s grandparent 51% 35% 30% 27% 35%
Non-relative 22% 25% 24% 16% 22%
Child’s sibling ages 13+ 3% 6% 18% 29% 13%
Another relative (aunt, cousin, etc.) 17% 15% 13% 6% 13%
Licensed family child care 25% 18% 9% 5% 14%
Center-based care 34% 76% 45% 34% 50%
Child care center, nursery school/ preschool 34% 62% - - 26%
Before or after school program - 5% 45% 34% 21%
Kindergarten - 14% - - 4%
Head Start 2% 8% - - 3%
Self care 2% 4% 15% 44% 14%
Supervised activities 12% 47% 58% 63% 46%
Note: Shows all types of care used at least once per week in each of the last two weeks for one randomly-selected child per household. Children may be listed in multiple categories. Figures in bold are unduplicated totals of any subcategories shown below them.

Child Care Use in Minnesota: November 2010 Report of the 2009 Statewide Household Child Care Survey
40
Primary child care arrangements
In this study, the primary child care arrangement is defined as the one the parent says is used most often for the randomly-selected child (at least once a week in each of the last two weeks). For 88 percent of the households, the primary arrangement is also the arrangement with the most reported hours of use in the previous week. Because the survey instrument used the primary arrangement defined by the parent as a reference point in numerous follow-up questions, that same arrangement is used in the statistical analyses, rather than redefining primary arrangement based on most hours.
Overall, 43 percent use FFN care in their own home (29 percent) or in someone else’s home (14 percent) as their primary arrangement (see Figure 22). The next most often used type of care is center-based (31 percent), followed by licensed family child care (13 percent), supervised activities (12 percent) and self care (2 percent). Similar proportions use FFN care (43 percent) and formal care, either licensed family home- or center-based (44 percent).
22. Primary child care arrangements for randomly-selected child
Type of child care used most often
Percent of all households
N=1,209
FFN care 43%
FFN care – own home 29%
FFN care – someone else’s home 14%
Center-based care 31%
Licensed family child care 13%
Supervised activities 12%
Self care 2%
FFN care in their own home as the primary arrangement is more common in summer than during the school year (33 percent versus 27 percent). So are supervised activities (17 percent versus 10 percent). Center-based care is more common during the school year (34 percent versus 20 percent).
FFN care in someone else’s home is more likely in Greater Minnesota (16 percent) than in the metro area suburbs (12 percent).
Licensed family care is more commonly the primary arrangement in Greater Minnesota than in the metro area (15 percent versus 11 percent) and more likely in the suburbs than in the Minneapolis and St. Paul (12 percent versus 6 percent).

Child Care Use in Minnesota: November 2010 Report of the 2009 Statewide Household Child Care Survey
41
Among households with low incomes, those with a child care subsidy are more likely than those without a subsidy to use center-based care as their primary arrangement (46 percent versus 22 percent, compared with 33 percent for households with higher incomes).
Households with low incomes without a child care subsidy are more likely than those with a subsidy to use FFN care as their primary arrangement (60 percent versus 31 percent, compared with 37 percent for households with higher incomes).
Among households with low incomes, those with a child care subsidy are more likely than those without a subsidy to use licensed family homes as their primary arrangement (17 percent versus 5 percent, compared with 15 percent for households with higher incomes).
White households are more likely than households of color to use licensed family child care (13 percent versus 7 percent).
Households with working parents are more likely to use licensed family child care (15 percent versus 6 percent) and center-based (33 percent versus 26 percent) and less likely to use FFN in own home (27 percent versus 33 percent) and supervised activities as primary arrangements (10 percent versus 16 percent).
Primary child care arrangements in the summer
As shown in Figure 23, during the summer, 50 percent use FFN care in their own home (33 percent) or in someone else’s home (17 percent) as their primary arrangement. The next most popular type of care is center-based, which includes child care centers, nursery schools or preschools, Head Start and before and after-school programs (20 percent), followed by supervised activities (17 percent), licensed family child care (11 percent) and self care (2 percent).
Center-based care is used as a primary arrangement in the summer most commonly for children ages 0 to 2 (27 percent) and ages 3 to 5 (27 percent), followed by 19 percent for children ages 6 to 9.
Unlike in 2004, Greater Minnesota households are more likely than metro area households to use center-based care in the summer (25 percent versus 15 percent).
Supervised activities are fairly common primary arrangements for children ages 6 to 9 (30 percent) and those ages 10 to 12 (32 percent), up from 18 percent and 23 percent in 2004.
Six percent of respondents use self care in the summer as the primary arrangement for children ages 10 to 12.

Child Care Use in Minnesota: November 2010 Report of the 2009 Statewide Household Child Care Survey
42
23. Primary child care arrangement, summer
Type of child care used most often
0-2 years (n=75)
3-5 years (n=83)
6-9 years (n=81)
10-12 years (n=69)
Total (N=308)
FFN care 56% 47% 45% 54% 50%
FFN care – own home 36% 29% 31% 39% 33%
FFN care – someone else’s home 20% 18% 14% 15% 17%
Center-based care 27% 27% 19% 7% 20%
Supervised activities - 7% 30% 32% 17%
Licensed family child care 17% 17% 7% 1% 11%
Self care - 2% - 6% 2%
Primary child care arrangements during the school year
As shown in Figure 24, during the school year, 41 percent use either FFN care at home (27 percent) or at someone else’s home (14 percent) as the primary child care arrangement for the randomly-selected child, followed by center-based care (34 percent), licensed family child care (13 percent), supervised activities (10 percent) and self care (2 percent).
Children ages 3 to 5 are the least likely to have FFN care at home as their primary child care arrangement during the school year (15 percent).
Center-based care is the most frequent primary arrangement during the school year for children ages 3 to 5 (52 percent, down from 60 percent in 2004), followed by 30 percent for children ages 6 to 9, 25 percent for children under age 3, and 22 percent for children ages 10 to 12.
Supervised activities are the primary arrangements during the school year for 15 percent of children ages 6 to 9 and 24 percent of those ages 10 to 12.
Licensed family homes are fairly common primary arrangements during the school year for children under age 3 (25 percent), followed by children ages 3 to 5 (16 percent).
Eleven percent use self care during the school year as their 10- to 12-year-olds’primary arrangement.

Child Care Use in Minnesota: November 2010 Report of the 2009 Statewide Household Child Care Survey
43
24. Primary child care arrangement, school year
Type of child care used most often
0-2 years
(n=195)
3-5 years
(n=275)
6-9 years
(n=263)
10-12 years
(n=168) Total
(N=901)
FFN care 48% 29% 46% 40% 41%
FFN care – someone else’s home 19% 14% 13% 7% 14%
FFN care – own home 29% 15% 33% 33% 27%
Center-based care 25% 52% 30% 22% 34%
Licensed family child care 25% 16% 8% 3% 13%
Supervised activities 2% 2% 15% 24% 10%
Self care - <1% 1% 11% 2%
Use of Head Start
Ten percent of households with low incomes with children ages 5 and younger, based on the selected child, report using Head Start. Of these households, 28 percent report receiving a child care subsidy for another type of child care arrangement for times when the child is not being served by Head Start.
Use of family, friend and neighbor (FFN) care
Altogether, 70 percent of households that use child care use some form of FFN care on a regular basis. Twenty percent use FFN care exclusively; 22 percent use FFN as their primary arrangement but also use other types of care; 29 percent use other types of care as their primary arrangement but also use FFN care; and 30 percent of households do not use FFN care on a regular basis. Of those using FFN care, 38 percent pay for it.
Characteristics of households more likely to only use FFN care include households with children under age 3 (38 percent versus 14 percent), households of color (31 percent versus 18 percent), households with low incomes (30 percent versus 15 percent) and households with no working parents (25 percent versus 17 percent).
Among low-income households, those without child care subsidies were more likely to only use FFN care (33 percent versus 14 percent); however, those with child care subsidies are more likely to use FFN as secondary care (44 percent versus 24 percent). In addition, households with higher incomes are more likely than households with low incomes to not use FFN care (35 percent versus 18 percent).

Child Care Use in Minnesota: November 2010 Report of the 2009 Statewide Household Child Care Survey
44
No regular FFN use is also more likely during the school year (32 percent versus 24 percent in the summer), and among households with no children with special needs (31 percent versus 25 percent for households with a child with special needs). In addition, households with working parents (32 percent versus 23 percent) and higher incomes (35 percent versus 18 percent) are more likely to have no FFN care.
Forty percent of children under age 3 are in FFN care as their primary arrangement compared to 25 percent of children ages 3-5.
Children exclusively in FFN care are in child care 16 hours per week, on average.
Use of young sibling care or self care
Researchers asked parents if, during the last month, any of their children stayed alone or with a sibling ages 12 or younger on a regular basis, even for a small amount of time.
Parents report that 3 percent of children ages 2 or younger were watched or cared for on a regular basis by siblings ages 12 or younger, and 4 percent of children ages 3 to 5 stayed alone or were watched or cared for on a regular basis by siblings ages 12 or younger, even for a short amount of time. The percentage goes up to 14 percent for children ages 6 to 9 and to 43 percent for children ages 10 to 12.
For those staying alone or being watched by siblings ages 12 or younger, 40 percent of the children have had babysitting or home safety training, such as that offered by the Red Cross or community education.

Child Care Use in Minnesota: November 2010 Report of the 2009 Statewide Household Child Care Survey
45
Child care hours and schedules This section describes the number of hours children spend in child care of various types, as well as the times of day and week that care is used, including standard weekday times, early mornings, evenings and overnights, and weekends.
It is important to document use of more than just full-time child care in formal, regulated settings to ensure that policy is based on an accurate understanding of actual patterns of use for all types of arrangements. In addition, since some policies are based on the assumption that parents can rely on relatives, friends and neighbors to care for their children when needed, this section sheds some light on actual patterns of family, friend and neighbor (FFN) care use.
It is also helpful to examine patterns of care for older children for whom state-regulated forms of care are unavailable (family child care homes are only licensed to care for children up to age 10), and when self care is an option.
Number of hours in child care
About 13 percent of the randomly-selected children are in child care less than five hours per week, 19 percent five to nine hours per week, 25 percent 10 to 19 hours per week, 18 percent 20 to 34 hours per week, 12 percent 35 to 44 hours per week, and 13 percent 45 hours per week or more. On average, the randomly-selected children are in child care nearly 22 hours per week, similar to 24 hours per week in 2004 (see Figure 25).
25. Number of hours in child care
Number of hours per week that randomly-selected child spent in regular child care, previous week
Percent of all households
N=1,199
Four or less 13%
Five to less than 10 19%
10 to less than 20 25%
20 to less than 35 18%
35 to less than 45 12%
45 hours or more 13%
Mean number of hours in child care, selected child, all care 21.9
Note: Excluding self care and kindergarten, the median hours children are in child care is 16.

Child Care Use in Minnesota: November 2010 Report of the 2009 Statewide Household Child Care Survey
46
Mean hours per week in child care during the summer
This section and the next one about child care during the school year report the mean hours per week in arrangements that are used every week for at least five hours per week. This is in order to screen out occasional play dates with grandparents or at friends’ houses or other brief activities.
As shown in Figure 26, including all ages of children and all types of care, children spend 31 hours, on average, in child care per week during the summer, up from 28 hours in 2004. On average, children in each of the four age groups spend about the same number of hours in child care during the summer.
Children in licensed care in the summer tend to be in care more hours per week on average than those in FFN care (26 to 28 hours versus 13 to 14 hours). Among children ages 10 to 12, those in FFN care and supervised activities in the summer tend to be in care more hours per week on average than those in self care (14 to 18 hours versus 5 hours).
On average, children ages 10 to 12 are in self care fewer hours per week than in 2004 (5 hours, down from an average of 10 hours in 2004).
26. Mean hours in child care per week, summer
Type of arrangement
0-2 years (n=66)
3-5 years (n=76)
6-9 years (n=74)
10-12 years (n=58)
Total (N=274)
FFN care – own home n=45 n=44 n=41 n=27 N=167
13.3 11.8 10.8 15.1 12.7
FFN care – someone else’s home n=19 n=27 n=27 n=18 N=91
15.2 12.4 11.9 17.7 13.9
Licensed family child care n=13 n=15 n=* n=* N=38
29.5 32.1 * * 27.8
Center-based care n=29 n=30 n=20 n=11 N=90
24.8 24.0 30.2 24.4 25.7
Self care n=* n=* n=12 n=23 N=37
* * 2.8 5.0 4.7
Supervised activities n=* n=31 n=58 n=40 N=138
* 6.6 13.5 13.9 11.3
Mean total 30.4 30.1 31.5 31.9 30.9
Note: Figures show average weekly time in each type of child care. Children can be in multiple types of care. Includes only children who regularly receive a total of five or more hours per week of child care. Asterisk (*) indicates fewer than 10 children in the category. In addition, readers should use caution in interpreting the figures because of small sub-sample sizes.

Child Care Use in Minnesota: November 2010 Report of the 2009 Statewide Household Child Care Survey
47
Mean hours per week in child care during the school year
As shown in Figure 27, children average 23 hours per week in child care during the school year, lower than the average of 31 hours in the summer. Children from birth through age 5 spend more time, on average, in child care during the school year (27 to 31 hours) than children ages 6 to 9 (16 hours) and children ages 10 to 12 (15 hours). Children are in licensed family child care homes for more hours per week (average 28 hours) than any other form of care.
Among children ages 5 and younger, those in licensed care during the school year tend to be in care more hours per week on average than those in FFN care (18 to 38 hours versus 10 to 16 hours).
27. Mean hours in child care per week, school year
Type of arrangement
0-2 years
(n=171)
3-5 years
(n=264)
6-9 years
(n=219)
10-12 years
(n=129) Total
(N=783)
FFN care – own home n=94 n=131 n=122 n=71 N=418
11.5 10.2 8.8 7.7 9.6
FFN care – someone else’s home n=57 n=75 n=72 n=35 N=239
15.5 10.4 8.3 8.6 10.7
Licensed family child care n=47 n=48 n=22 n=* N=125
37.9 27.6 13.0 * 28.0
Center-based care n=64 n=192 n=109 n=53 N=418
24.4 17.5 8.8 6.7 14.9
Self care n=* n=* n=31 n=60 N=102
* * 3.3 4.1 3.7
Supervised activities n=23 n=126 n=133 n=85 N=367
3.1 2.2 3.1 5.1 3.2
Mean total 31.4 26.9 15.6 15.4 22.9
Note: Figures show average weekly time in each type of child care. Children can be in multiple types of care. Includes only children who regularly receive a total of five or more hours per week of child care. Asterisk (*) indicates fewer than 10 children in the category. In addition, readers should use caution in interpreting the figures because of small sub-sample sizes.

Child Care Use in Minnesota: November 2010 Report of the 2009 Statewide Household Child Care Survey
48
Child care schedules
Children regularly in child care: Percent in care by type of schedule and age, summer
Figure 28 shows the times of the day and week children are in care during the summer, including regular arrangements (used in each of the previous two weeks) and only children who regularly spend at least five hours per week in care.
During the summer, the standard weekday – Monday through Friday, 7 a.m. to 6 p.m. – is at least part of the child care schedule for 92 percent of children and the only schedule for 44 percent of them. In addition to the standard weekday, during the summer, 44 percent of children are regularly cared for by someone other than a parent during weekday evenings (6 p.m. to 10 p.m.), and 18 percent are cared for by someone other than a parent during weekends (down from 35 percent in 2004). Thirteen percent are cared for by someone other than a parent after 10 p.m. on weekdays, and 15 percent in the early mornings before 7 a.m.
28. Child regularly in child care: Percent of randomly-selected children in care by type of schedule and age of child, summer
Child care schedule
0-2 years (n=67)
3-5 years (n=76)
6-9 years (n=74)
10-12 years (n=59)
Total (N=276)
Child care only during standard weekday (Monday-Friday, 7 a.m.- 6 p.m.) 46% 47% 47% 34% 44%
Percent of all children in child care whose care schedule includes:
Standard weekday (7 a.m.-6 p.m.) 91% 95% 92% 92% 92%
Evenings (6 p.m.-10 p.m.) 42% 40% 43% 54% 44%
Weekends 19% 17% 16% 19% 18%
Early mornings (before 7 a.m.) 15% 8% 16% 20% 15%
Nights (after 10 p.m.) 10% 15% 10% 17% 13%
Note: Includes only children who regularly receive a total of five or more hours per week of child care. Each child may be included in multiple categories (except standard weekday schedule only).
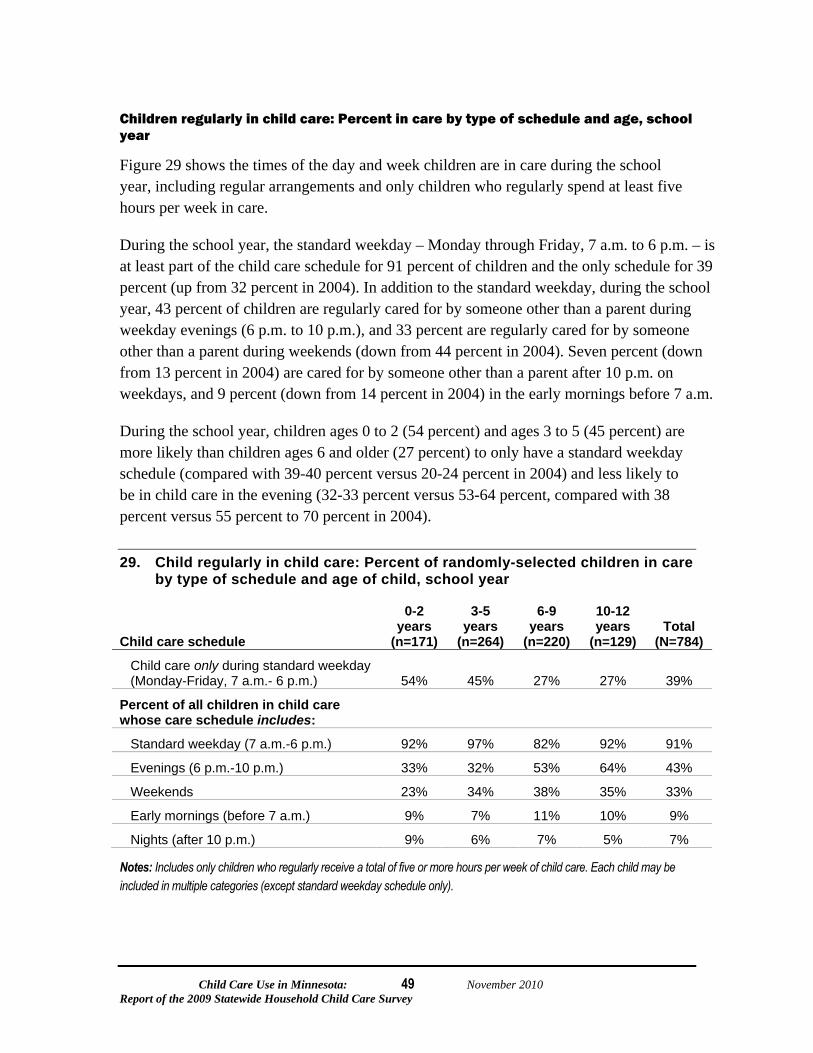
Child Care Use in Minnesota: November 2010 Report of the 2009 Statewide Household Child Care Survey
49
Children regularly in child care: Percent in care by type of schedule and age, school year
Figure 29 shows the times of the day and week children are in care during the school year, including regular arrangements and only children who regularly spend at least five hours per week in care.
During the school year, the standard weekday – Monday through Friday, 7 a.m. to 6 p.m. – is at least part of the child care schedule for 91 percent of children and the only schedule for 39 percent (up from 32 percent in 2004). In addition to the standard weekday, during the school year, 43 percent of children are regularly cared for by someone other than a parent during weekday evenings (6 p.m. to 10 p.m.), and 33 percent are regularly cared for by someone other than a parent during weekends (down from 44 percent in 2004). Seven percent (down from 13 percent in 2004) are cared for by someone other than a parent after 10 p.m. on weekdays, and 9 percent (down from 14 percent in 2004) in the early mornings before 7 a.m.
During the school year, children ages 0 to 2 (54 percent) and ages 3 to 5 (45 percent) are more likely than children ages 6 and older (27 percent) to only have a standard weekday schedule (compared with 39-40 percent versus 20-24 percent in 2004) and less likely to be in child care in the evening (32-33 percent versus 53-64 percent, compared with 38 percent versus 55 percent to 70 percent in 2004).
29. Child regularly in child care: Percent of randomly-selected children in care by type of schedule and age of child, school year
Child care schedule
0-2 years
(n=171)
3-5 years
(n=264)
6-9 years
(n=220)
10-12 years
(n=129) Total
(N=784)
Child care only during standard weekday (Monday-Friday, 7 a.m.- 6 p.m.) 54% 45% 27% 27% 39%
Percent of all children in child care whose care schedule includes:
Standard weekday (7 a.m.-6 p.m.) 92% 97% 82% 92% 91%
Evenings (6 p.m.-10 p.m.) 33% 32% 53% 64% 43%
Weekends 23% 34% 38% 35% 33%
Early mornings (before 7 a.m.) 9% 7% 11% 10% 9%
Nights (after 10 p.m.) 9% 6% 7% 5% 7%
Notes: Includes only children who regularly receive a total of five or more hours per week of child care. Each child may be included in multiple categories (except standard weekday schedule only).

Child Care Use in Minnesota: November 2010 Report of the 2009 Statewide Household Child Care Survey
50
Types of child care during non-standard times, summer
During the summer, FFN care is the most common type of child care during non-standard times of the day and week (see Figure 30). Sixty-eight percent of children in care in the early mornings (before 7 a.m.) are cared for by FFN providers, as are 91 percent of children late at night (after 10 p.m.). In the evenings (between 6 and 10 p.m.), 78 percent of children are cared for by FFN providers, and 80 percent of children are in this type of care on weekends (Saturday or Sunday).
30. Types of child care during non-standard times, summer
Of children in child care during the time shown, distribution by type(s) of care:
Early morning (< 7 a.m.)
(n=40)
Evening (6-10 p.m.)
(n=122)
Late night (>10 p.m.)
(n=35)
Weekend (Sat or Sun)
(N=49)
FFN care – own home 38% 53% 34% 45%
FFN care – someone else’s home 30% 25% 57% 35%
Supervised activities 13% 29% 3% 14%
Center-based care 13% 3% 0% 4%
Self care 5% 7% 3% 4%
Licensed family child care 0% 4% 3% 2%
Notes: Shows type(s) of care used regularly during the different schedules shown. Children may be included in multiple schedule categories. Does not include children in overnight camp or in kindergarten or children who are in child care a total of four hours per week or less.
Types of child care during non-standard times, school year
During the school year, FFN care is the most common type of child care during all non-standard times (see Figure 31). Thirty percent of children are cared for by FFN providers in their own home, and 20 percent in someone else’s home during the early morning hours before 7 a.m. During these early morning times, another 39 percent of children are in center-based care (child care centers or before-school programs). Relative to 2004, fewer children are in FFN care in the early mornings (65 percent in 2004) and more are in center-based care (30 percent in 2004).
During school-year evenings, after FFN care (71 percent), children are most commonly in activities (46 percent, up from 37 percent in 2004).
About half (47 percent, down from 57 percent in 2004) of children cared for after 10 p.m. are cared for by FFN providers in the children’s own homes, and 51 percent are in the FFN’s home.

Child Care Use in Minnesota: November 2010 Report of the 2009 Statewide Household Child Care Survey
51
On weekends during the school year, 70 percent (down from 77 percent in 2004) of children are cared for by FFN providers, and 46 percent (up from 39 percent in 2004) are in activities.
31. Types of child care during non-standard times, school year
Of children in child care during the time shown, distribution by type(s) of care:
Early morning (< 7 a.m.)
(n=71)
Evening (6-10 p.m.)
(n=340)
Late night (>10 p.m.)
(n=53)
Weekend (Sat or Sun)
(N=259)
Supervised activities 6% 46% 2% 46%
FFN care – own home 30% 49% 47% 43%
FFN care – someone else’s home 20% 22% 51% 27%
Self care 3% 7% 0% 6%
Center-based care 39% 8% 4% 2%
Licensed family child care 14% 2% 2% 1%

Child Care Use in Minnesota: November 2010 Report of the 2009 Statewide Household Child Care Survey
52
Child care costs Given the importance of child care to the care and education of children and working parents, it is important to understand the amount of money Minnesota families are currently paying for child care, which families might need help paying for child care and how they might be helped to afford it. This section provides information on how many families pay for child care; what families pay for all children in their family and for the randomly-selected child; average costs per hour for different kinds of care and sources of help for child care costs.
The Minnesota Child Care Resource and Referral Network reports the average weekly rates charged for full-time care for various types of child care. As of July 2010, for example, the average weekly rates of licensed family child care in Greater Minnesota were $128 for infants, $122 for toddlers and $117 for preschoolers. In the Metro area, those rates were $166 for infants, $156 for toddlers and $146 for preschoolers. The average weekly rates for child care centers in Greater Minnesota were $187 for infants, $167 for toddlers and $154 for preschoolers. In the Metro area, the average rates in centers go up to $288 for infants, $244 for toddlers and $216 for preschoolers. Rates for part-time and drop-in care may be higher.
Since 1998, the Administration for Children and Families of the U.S. Department of Health and Human Services set the benchmark for affordability at 10 percent of income spent on child care, citing the opinion of “most experts” that this percent of income is “the limit of affordability.” Parents who spend more than this amount may have more difficulties maintaining safe or stable child care and, as a result, may have more trouble getting or keeping a job.17
17 Department of Health and Human Services, Office of Inspector General. (1998). States’ Child Care Certificate Systems: An Early Assessment of Vulnerabilities and Barriers. Washington, D.C.: author.

Child Care Use in Minnesota: November 2010 Report of the 2009 Statewide Household Child Care Survey
53
Weekly cost of child care
Average total weekly cost of child care per household
Overall, 69 percent of households that use child care have out-of-pocket expenses.
Families with low incomes are less likely than families with higher incomes to pay something out-of-pocket (60 percent versus 73 percent).
Figure 32 shows the average amount paid out-of-pocket by the parent (after subsidy through the Child Care Assistance Program, but before benefits from the Child Care Dependent Tax Credit and employer pre-tax accounts) for child care for all children in the family in the previous week.18 For families who had child care costs, the average weekly cost is $138 (or $7,167 annually). This figure includes all families using child care, including those whose child care is only part time. It should not be interpreted as representing the cost of full-time care.
Child care costs are lower for a family whose selected child is at least age 6 and in school. The costs drop for school-age children but do not disappear, suggesting that the costs for care before and after school remain substantial for those relying on paid arrangements.
Based on the amounts parents report paying for the randomly-selected child, the average weekly amounts go down as the age of the child goes up, from, on average, $154 per week for children ages 2 and younger and children ages 3 to 5, to $122 for children ages 6 to 9, to $102 for children ages 10 to 12.
Although the rates charged by licensed providers of infant care are known to be higher than for other age groups, many families use less costly FFN care, resulting in lower average costs overall. Households who pay for care are receiving more hours of care.
The average weekly cost of all child care per household is higher in the metro area than in Greater Minnesota ($155 versus $116). The largest difference is for households with three children. Metro area households pay, on average, $186 per week compared with an average of $135 per week for Greater Minnesota households.
Among households who pay for child care, the selected child is cared for by someone other than a parent or sibling over 60 percent more hours than the selected child in households that do not pay for child care (25 hours compared with 15 hours).
18 Specifically, families were asked: “Please think about how much your household paid or will pay for last week, Monday through Sunday, for all of your child care expenses, for all of your children ages 12 and younger? We are only interested in how much last week’s hours cost you, not whether you actually made the payment last week, or pay by the week, month, or some other period of time.”

Child Care Use in Minnesota: November 2010 Report of the 2009 Statewide Household Child Care Survey
54
Households in which the selected child is cared for by someone other than a parent or sibling full time (35 hours or more a week) pay more in child care than those in which the selected child is in care part time ($143 compared with $111).
32. Average total weekly cost of child care per household (parents’ out of pocket expenses)
All respondent households 1 child (n=474)
2 children (n=477)
3 children (n=190)
4 or more children (n=61)
Total (N=1,202)
Mean weekly payment $63 $115 $127 $100 $95
Calculated annual cost $3,257 $5,970 $6,592 $5,226 $4,961
Households who paid for child care
(N=297) (N=346) (N=151) (N=38) (N=832)
Mean weekly payment $100 $158 $160 $161 $138
Calculated annual cost $5,199 $8,231 $8,295 $8,388 $7,167
Weekly cost of child care by household income
Of the households that use child care, 31 percent of all households and 40 percent of households with low incomes pay nothing out-of-pocket for child care. This may be because they are in free FFN care, self-care, or receive CCAP and do not have a co-pay. Including only those with child care payments, the overall average is $138 per week. Among all households, those with low incomes pay less, on average, than higher income families, $62 versus $111 per week (see Figure 33).
Households that pay for child care are paying 12 percent, on average, of their annual household income. However, households with low incomes (200% of poverty and below) that pay for child care pay a much higher percentage of their annual income for child care costs (20 percent).
The percentage of annual income that pays for child care decreases as household income rises. Among households that pay for child care, those with annual incomes below $20,000 pay 29 percent of their income, and those with incomes from $20,000 to $44,999 pay 18 percent, compared with 9 percent for those with incomes from $45,000 to $74,999 and 8 percent for those with household incomes of $75,000 and above.

Child Care Use in Minnesota: November 2010 Report of the 2009 Statewide Household Child Care Survey
55
33. Average total weekly cost of child care by household income (parents’ out of pocket expenses)
All respondent households Low-income
(n=373) Higher-income
(n=829) All households
(N=1,202)
$0 40% 27% 31%
$1-$50 24% 21% 22%
$51-$100 14% 15% 14%
$101-$200 16% 21% 19%
$201-$300 5% 9% 8%
Over $300/week 1% 8% 6%
Mean weekly payment $62 $111 $95
Calculated annual cost $3,200 $5,753 $4,961
Households that paid for child care (N=224) (N=608) (N=832)
Mean weekly payment $102 $151 $138
Calculated annual cost $5,329 $7,845 $7,167
Annual expense as percent of income 20% 9% 12%
Awareness and use of the state Child Care Assistance Program
Awareness of Child Care Assistance Program
More than half (56 percent) of respondents in the survey are aware of the availability of “state subsidy programs to help pay for child care costs” (i.e., the Child Care Assistance Program, described in the introduction to this section).
Households with low incomes, for whom this program is intended, are more likely to be aware of CCAP (72 percent versus 49 percent for households with incomes above 200 percent of poverty).
Awareness of the availability of child care subsidies tends to be higher among: parents in Greater Minnesota than in the metro area (63 percent versus 51 percent), families with children who have special needs (64 percent versus 54 percent), younger parents compared with those ages 30 and older (71 percent versus 53 percent) and single-parent households than two-parent families (79 percent versus 52 percent).

Child Care Use in Minnesota: November 2010 Report of the 2009 Statewide Household Child Care Survey
56
Use of CCAP
Six percent of all households in the survey, and 14 percent of households with low incomes report currently receiving a subsidy through CCAP, compared with statistically similar 19 percent of households with low incomes in 2004. Eligibility for CCAP is based on family size, family income and participation in authorized employment-related activities by the parents. This survey does not contain information that explains the reasons for not using CCAP or to determine whether the households with low incomes not receiving child care assistance are eligible to receive it under current guidelines.
Single-parent households are more likely to receive child care subsidies than two parent households (23 percent versus 3 percent). So are households of color relative to white households (13 percent versus 5 percent).
Other help with child care costs
Besides the state Child Care Assistance Program, 42 percent of households claim a federal or state income tax credit for child care (whether they claim a tax credit from the federal or state government cannot be differentiated), and 31 percent use a child care expense account or employer plan that allows them to purchase child care with pre-tax dollars (see Figure 34).
Households with incomes above 200 percent of poverty (48 percent) and households with low incomes with a child care subsidy (54 percent) are more likely than households with low incomes without subsidies (28 percent) to claim the tax credit for child care. So are white households relative to households of color (44 percent versus 33 percent) and parents with children under age 10 (43-50 percent versus 28 percent for children ages 10-12).
Child care expense accounts are more common among white households (32 percent versus 20 percent for households of color), households in the metro area (35 percent versus 27 percent in Greater Minnesota), households with higher incomes (31 percent versus 12 percent for households with low incomes), among those with children ages 3 to 6 (17 percent versus 7 percent of children under 3 and 11 percent of for children ages 6 to 12), and among households with working parents (i.e., single parents working full or part time and two-parent households with each parent working at least part time).
Thirty-percent of those households who receive other types of help paying for child care would not be able to maintain their current child care arrangement without the help they receive.
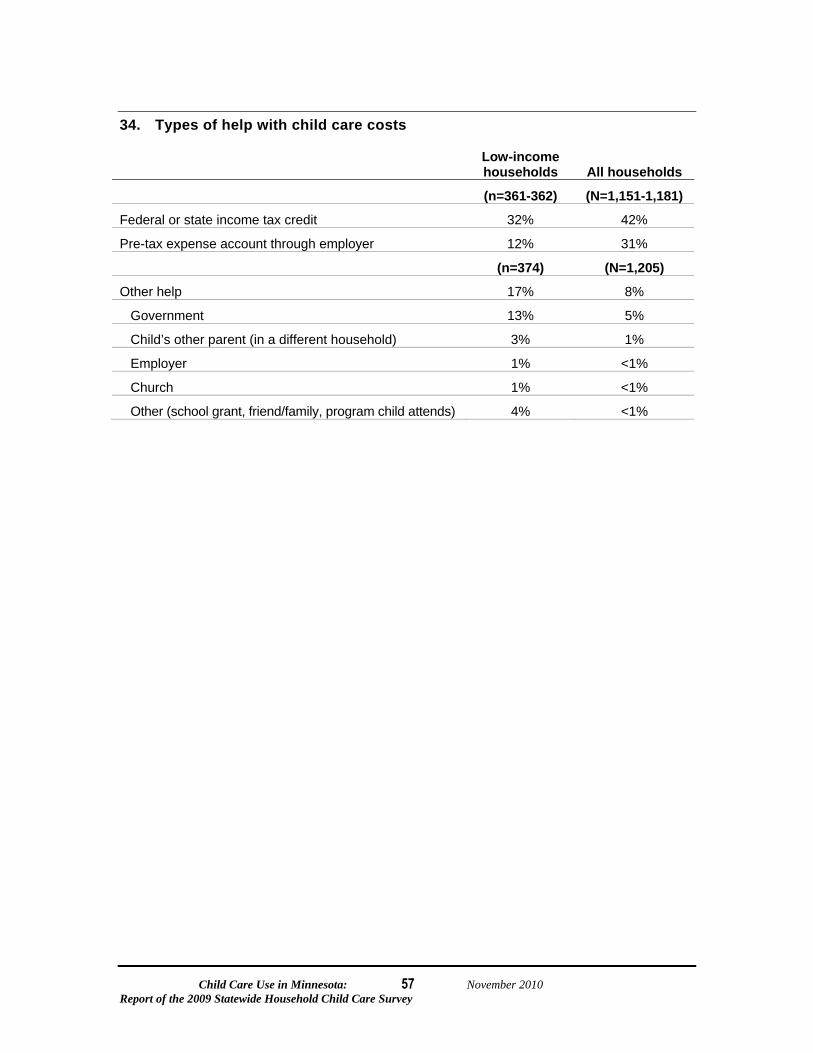
Child Care Use in Minnesota: November 2010 Report of the 2009 Statewide Household Child Care Survey
57
34. Types of help with child care costs
Low-income households All households
(n=361-362) (N=1,151-1,181)
Federal or state income tax credit 32% 42%
Pre-tax expense account through employer 12% 31%
(n=374) (N=1,205)
Other help 17% 8%
Government 13% 5%
Child’s other parent (in a different household) 3% 1%
Employer 1% <1%
Church 1% <1%
Other (school grant, friend/family, program child attends) 4% <1%

Child Care Use in Minnesota: November 2010 Report of the 2009 Statewide Household Child Care Survey
58
Selecting child care: awareness, choices and barriers This section explores the extent to which parents are able to find care that meets their needs for quality, cost and convenience, as well as what parents look for in determining quality. Knowing that the quality of care may affect children’s emotional, social and intellectual development, it is important to understand how parents select child care.
Currently, the state funds a statewide network of child care resource and referral agencies that help parents identify and select child care in their communities. These agencies, known as CCR&Rs, work with providers and communities to improve the quality and availability of care for young children.
The findings in this section of the report will help policymakers understand how most parents identify potential child care providers, how they choose among alternatives and the extent to which parents have a choice or simply must take whatever care is available.
Child care resource and referral
Two-thirds (67 percent) of all respondents are aware of a child care resource and referral service in their community to help them find child care.
Some households are more aware of CCR&R services than other households. These include households in Greater Minnesota (73 percent versus 61 percent in the metro area), white households (68 percent versus 56 percent of households of color), households with a mother in the work force (69 percent versus 62 percent) and households with a child ages 3 to 5 (70 percent versus 64 percent).
Among households with low incomes, those who have child care subsidies are more likely than those without them to be aware of CCR&R services (92 percent versus 64 percent). Households with low incomes without child care subsidies are similar to households with higher incomes in this regard.
Households using licensed child care homes (79 percent) and centers (72 percent) as their primary arrangement are more likely than those using FFN care (61 percent) to be aware of child care resource and referral.

Child Care Use in Minnesota: November 2010 Report of the 2009 Statewide Household Child Care Survey
59
Views about potential child care quality rating system
Researchers asked parents how helpful it would be if their community had a child care rating system with information they could use for selecting quality care. As shown in Figure 35, 88 percent say such a system would be “very helpful” (53 percent) or “somewhat helpful” (35 percent).
Parents who are more likely to say a quality rating system would be “very helpful” include those whose primary language at home is not English (72 percent versus 52 percent of those whose primary language is English); parents of color (67 percent versus 51 percent of white parents); and parents with low incomes (61 percent versus 45 percent of parents with higher incomes).
35. Helpfulness of child care rating system by age of randomly-selected child
How helpful would it be if your community had a child care rating system that would give you information you could use for selecting quality care?
Age of child
0-2 years
(n=269)
3-5 years
(n=358)
6-9 years
(n=343)
10-12 years
(n=233) Total
(N=1,203)
Very helpful 59% 53% 49% 51% 53%
Somewhat helpful 31% 36% 38% 34% 35%
Not very helpful 4% 5% 8% 7% 6%
Not helpful at all 6% 5% 5% 9% 6%
Parent Aware
Ten percent of survey respondents are aware of the child care quality rating system called “Parent Aware” that is being tested in Minneapolis, St. Paul, Wayzata School District and Blue Earth and Nicollet counties.19
Some households are more aware of Parent Aware than other households. These include households of color (17 percent versus 9 percent of white households) and households with lower incomes (13 percent versus 9 percent for households with higher incomes). Among households with low incomes, those who have child care subsidies are more likely than those without them to be aware of Parent Aware (25 percent versus 11 percent).
In addition, households in Minneapolis and St. Paul (17 percent) and the Southwest Region (15 percent), where Parent Aware was piloted, are more aware of Parent Aware than the overall population (10 percent).
19 Respondents were asked if they were specifically aware of “Parent Aware” by name.

Child Care Use in Minnesota: November 2010 Report of the 2009 Statewide Household Child Care Survey
60
How people learned about their primary arrangement
Households using FFN care by relatives and self care as their primary arrangements skipped this question. In response to the open-ended question, with responses grouped into categories, 48 percent of the other families report they either already knew their main child care provider (11 percent) or were referred to the provider by someone they knew (37 percent). Sixteen percent learned about their current primary arrangement through schools, and community services, such as child care resource and referral (CCR&R) services, helped 10 percent of families find their current primary arrangements (see Figure 36).
A greater proportion of parents learned about licensed family homes through personal contacts (48 percent) and CCR&R (20 percent); while schools were the source of information for a higher proportion of parents using center-based care (21 percent) or supervised activities (35 percent) as their primary arrangement.
Among households with low incomes, those receiving a child care subsidy are more likely than those not receiving a subsidy to learn about their current primary arrangement through community or CCR&R services (21 percent versus 7 percent). Households with low incomes without a child care subsidy are similar to households with incomes above 200 percent of poverty in how they learn about their primary arrangement (10 percent).
36. How people learned about their primary arrangement
Referral source
Child’s primary arrangement
Non-relative
care own home (n=49)
Non-relative care
someone else’s home
(n=27)
Licensed family child
care (n=122)
Center-based care
(n=323)
Supervised activities
(n=66) Total
(N=587)
Referred by personal contacts 43% 56% 48% 34% 18% 37%
Public or private school 2% 4% - 21% 35% 16%
Already knew provider 14% 33% 7% 10% 6% 11%
Community service, CCR&R 4% - 20% 7% 11% 10%
Newspaper, advertisements, yellow pages 4% - 7% 5% 5% 5%
Internet search 4% - 7% 5% - 5%
Church, synagogue, other place of worship 6% 4% - 4% 6% 3%
Public bulletin boards, flyers - - - 2% 12% 3%
Note: Responses to open-ended question, grouped into categories. Question not asked of families whose primary arrangement was relative care or self care. “Primary arrangement” is the one households use most often. Percents do not total 100 percent because sources are included only if used by at least 5 percent for any arrangement. In addition, readers should use caution in interpreting the figures because of small sub-sample sizes.

Child Care Use in Minnesota: November 2010 Report of the 2009 Statewide Household Child Care Survey
61
Reasons for choosing primary arrangement
In open-ended responses grouped into categories, as shown in Figure 37, respondents most commonly report choosing their primary arrangement due to the convenient location (33 percent), the cost (25 percent), the quality of care (21 percent) and trusting the provider (20 percent).
For FFN care, the main reasons also include preference of care by a family member (35 percent). For center-based care, the main reasons also include structure and activities (17 percent).
Based on the age of the selected child, parents of children ages 5 and younger are more likely than parents of children ages 6 to 12 to choose their primary arrangement due to the quality of the care (22 percent versus 14 percent) and trust of the provider (23 percent versus 16 percent); and less likely due to the location (39 percent versus 29 percent) or hours (19 percent versus 12 percent).
Among households with low incomes, those with a child care subsidy are more likely than those without a subsidy to choose a provider based on trust (38 percent versus 20 percent).
Among households with low incomes, those without a child care subsidy are more likely than those with a subsidy to prefer care by a family member (27 percent 10 percent) and to choose care based on cost (31 percent by 10 percent) and quality (15 percent versus 8 percent).
Households with higher incomes are more likely to choose care based on the hours (17 percent versus 8 percent) and quality of care (21 percent versus 14 percent).

Child Care Use in Minnesota: November 2010 Report of the 2009 Statewide Household Child Care Survey
62
37. Reasons for choosing primary arrangement for randomly-selected child by primary arrangement
Reason for choosing primary arrangement
Child’s primary arrangement
FFN care home
(n=237)
FFN care someone
else’s home(n=134)
Licensed family
child care(n=147)
Center-based care
(n=327) Self care
(n=14)
Supervised activities
(n=66) Total
(N=925)
Convenient location 40% 21% 26% 38% 36% 29% 33%
Cost 37% 28% 22% 15% 50% 18% 25%
Quality of care given 18% 12% 22% 28% 0% 15% 21%
Parent knows/trusts them 18% 40% 25% 14% 7% 8% 20%
Prefer care by family member 32% 40% 4% 2% 0% 2% 15%
Convenient and flexible hours 15% 13% 8% 19% 7% 15% 15%
Structure and activities 1% 1% 5% 17% 0% 44% 10%
Availability (had an opening) 7% 10% 7% 4% 0% 2% 6%
Training/experience of provider 2% 4% 8% 9% 0% 2% 6%
References/used before 1% 1% 14% 6% 0% 3% 5%
Number of children in the home/center; ratio 2% 1% 11% 7% 0% 2% 5%
Interaction between child and provider 4% 6% 6% 4% 0% 3% 5%
Personality of provider 1% 4% 14% 3% 0% 2% 4%
Safety issues 3% 4% 3% 5% 14% 3% 4%
Other children/socialization 0% 4% 4% 6% 0% 11% 4%
Prefer home care 8% 1% 3% 0% 7% 2% 3%
Licensed or accredited 0% 1% 5% 3% 0% 0% 2%
Special needs of child 4% % 1% 2% 0% 3% 2%
Appearance of the home/ center 1% 1% 3% 3% 0% 0% 2%
Culture, values, language 0% 1% 1% 2% 0% 2% 1%
Assistance with school work 0% 0% 1% 2% 0% 3% 1%
Note: Responses to open-ended question, grouped into categories. Includes both first and second reasons when given; total exceeds 100 percent due to multiple responses. Question was not asked of those whose selected child is in kindergarten or whose primary arrangement is less than five hours per week.

Child Care Use in Minnesota: November 2010 Report of the 2009 Statewide Household Child Care Survey
63
Important considerations in choosing child care
As shown in Figure 38, from a list of important considerations in choosing child care, the top “very important” reasons at 77 percent are “a caregiver who speaks your family’s native language,” and “a caregiver rated high quality,” followed by a caregiver helps your child do well or prepare for school, has special training for caring for children and is a reasonable cost, each at 71 percent.
Households with low incomes are more likely than households with higher incomes to say that “a reasonable cost” is “very important” in choosing child care (84 percent versus 66 percent). Among low-income households, households with a subsidy are more likely to say a caregiver with special training in caring for young children is important (92 percent versus 75 percent).
Households in Minneapolis and St. Paul (83 percent) are more likely than those in Greater Minnesota (72 percent) and the suburbs (68 percent) to say that caregivers that help their children do well in school is “very important.”
White households are more likely than households of color to say that a caregiver who speaks their family’s native language is “very important” (80 percent versus 62 percent).
A caregiver that is a family member was “very important” to a larger proportion of households of color (59 percent versus 29 percent). That factor is also more likely to be “very important” for households in Minneapolis and St. Paul (41 percent) than in Greater Minnesota (32 percent) and the suburbs (31 percent). Non-working parents also rated this factor more important (39 percent versus 29 percent).
38. Considerations in choosing child care arrangements for randomly-selected child (N=1,205-1,209)
Considerations in choosing child care arrangements
Very important
Somewhat important
Not important
A caregiver that is rated high quality 77% 20% 2%
A caregiver who speaks your family’s native language 77% 19% 4%
A caregiver that helps your child do well in school or when they start school 71% 26% 3%
A caregiver who has special training in caring for children 71% 26% 3%
A reasonable cost 71% 26% 2%
A place close to home 67% 30% 4%
A small number of children in the same class, home or group 53% 40% 7%
A caregiver who is a relative or family member 32% 41% 27%

Child Care Use in Minnesota: November 2010 Report of the 2009 Statewide Household Child Care Survey
64
As shown in Figure 39, parents of children ages five and younger are more likely to consider “A caregiver that helps your child do well in school or when they start school,” and “A caregiver who has special training in caring for children” very important compared with parents of children ages 6 to 12 (77 percent versus 65 percent).
For those using FFN care, “a caregiver that is a relative or family member” is very important, whereas a high-quality provider and school help or readiness is very important for those who use licensed family child care or center-based care (see Figure 40).
39. Very important considerations in choosing child care arrangements by randomly-selected child’s age
Considerations in choosing child care arrangements
Age of child
0-2 years
(n=270)
3-5 years
(n=358)
6-9 years
(n=344)
10-12 years
(n=237) Total
(N=1,209)
A caregiver who speaks your family’s native language 80% 77% 75% 79% 77%
A caregiver that is rated high quality 81% 79% 76% 72% 77%
A caregiver that helps your child do well in school or when they start school 76% 76% 68% 64% 71%
A caregiver who has special training in caring for children 74% 77% 67% 62% 71%
A reasonable cost 72% 69% 73% 72% 71%
A place close to home 31% 31% 37% 32% 30%
A small number of children in the same class, home or group 56% 58% 47% 50% 53%
A caregiver who is a relative or family member 36% 33% 29% 32% 32%

Child Care Use in Minnesota: November 2010 Report of the 2009 Statewide Household Child Care Survey
65
40. Very important considerations in choosing child care arrangements by randomly-selected child’s primary arrangement
Considerations in choosing child care arrangements
Child’s primary arrangement
FFN care own
home (n=345)
FFN care someone
else’s home(n=174)
Licensed family
child care(n=152)
Center-based care
(n=371)
Self care
(n=27)
Supervised activities (n=140)
Total (N=1,209)
A caregiver who speaks your family’s native language 79% 74% 81% 78% 74% 72% 77%
A caregiver that is rated high quality 77% 72% 81% 82% 63% 72% 77%
A caregiver that helps your child do well in school or when they start school 67% 66% 77% 78% 67% 66% 71%
A caregiver who has special training in caring for children 64% 65% 73% 79% 44% 71% 71%
A reasonable cost 75% 75% 70% 67% 74% 71% 71%
A place close to home 70% 71% 68% 65% 63% 54% 65%
A small number of children in the same class, home or group 55% 52% 50% 52% 56% 56% 53%
A caregiver who is a relative or family member 37% 51% 16% 25% 37% 32% 32%
Note: “Primary arrangement” is the one the households uses most often.
Households taking whatever arrangement they could get
Twenty-nine percent of all parents and 35 percent of parents with low incomes say that in choosing child care for the selected child, they feel they “sort of,” “yes,” or “definitely” had to take whatever arrangement they could get (see Figure 41).
Parents of color are more likely than white parents to report feeling they had to take whatever arrangement they could get (44 percent versus 27 percent), and so are those whose primary language is not English (48 percent versus 29 percent).
Parents with children who have special needs are also more likely to feel they had to take whatever arrangement they could get (38 percent versus 26 percent of parents whose children have no special-needs).
Unlike in 2004, parents choosing child care for children ages 6 to 12 were no more likely than those choosing child care for younger children to feel they had to take whatever arrangement they could get.

Child Care Use in Minnesota: November 2010 Report of the 2009 Statewide Household Child Care Survey
66
Unlike in 2004, parents using CCAP were no more likely to feel they had to take whatever arrangement they could get compared with parents not using CCAP (30 percent and 29 percent, respectively, had to take whatever they could get).
Households whose primary arrangement is supervised activities are least likely to report they took whatever arrangement they could get (20 percent versus 30 percent for all other arrangements).
41. Households that report they had to take whatever arrangement they could get
N Percent
All households 1,194 29%
Low-income households 370 35%
Selected child has special needs 231 38%
Non-white households 116 44%
Non-English speaking households 40 48%
Note: Table shows percent reporting “definitely,” “yes,” or “sort of” in response to the statement, “In choosing child care for [randomly selected] child, I’ve felt I had to take whatever I could get.”
Main reason for ending previous child care arrangement
In an open-ended question, parents were asked for the main reason their last arrangement (before their current ones) ended, and their responses were grouped by category (see Figures 42 and 43). The most common reasons parents report ending a previous arrangement because it was seasonal (24 percent) or temporary (15 percent), or “the provider closed or stopped providing care” (12 percent).
More parents of preschool age children (ages 5 or younger) than of school-age children (age 6 or older) report having ended a previous arrangement because the provider stopped providing care (18 percent versus 6 percent); whereas parents of school-age children (ages 6 to 12) were more likely to report their previous child care arrangement ended because it was seasonal (35 percent versus 12 percent).
FFN care is more likely than other types of care to end because “it was meant to be temporary” (25 percent). Previous arrangements with licensed family child care homes ended mostly frequently because the provider stopped providing care (15 percent) or for financial reasons (17 percent).

Child Care Use in Minnesota: November 2010 Report of the 2009 Statewide Household Child Care Survey
67
42. Main reason for ending previous child care arrangement, by age of randomly-selected child
Main reason for ending previous arrangement
Age of child
0-2 years n=51
3-5 years n=86
6-9 years n=84
10-12 years n=64
Total N=285
Arrangement was seasonal 2% 17% 33% 38% 24%
Arrangement was temporary 18% 15% 14% 16% 15%
Provider closed/stopped providing care 27% 13% 5% 8% 12%
Financial reasons 12% 8% 7% 5% 8%
Parent or child unhappy with program 6% 7% 5% 3% 5%
Parent changed job/schedule 6% 2% 4% 6% 4%
Preferred program became available 8% 8% 0% 2% 4%
Child exceeded age of old program 0% 5% 2% 9% 4%
Parent wanted to stay with children or was staying home with other dependent 4% 3% 6% 2% 4%
Child reached age for new program 4% 2% 5% 2% 3%
Parent stopped working/finished school 0% 7% 2% 2% 3%
Transportation/location 2% 1% 2% 2% 2%
Respondent/child moved 2% 1% 4% 2% 2%
Provider moved 4% 1% 2% 0% 2%
Other 6% 7% 7% 3% 6%
Respondent did not answer question 0% 1% 1% 3% 1%
Note: Response to an open-ended question, grouped by category. Totals may not equal 100 percent due to rounding.

Child Care Use in Minnesota: November 2010 Report of the 2009 Statewide Household Child Care Survey
68
43. Main reason for ending previous arrangement, by type of previous arrangement
Main reason for ending previous arrangement
Type of previous arrangement
FFN care (n=107)
Licensed family
child care(n=46)
Center-based care
(n=45) Activities
(n=58) Other(n=28)
Total (N=284)
Arrangement was seasonal 18% 4% 18% 50% 32% 24%
Arrangement was temporary 25% 9% 4% 17% 4% 15%
Provider closed/stopped providing care 16% 15% 2% 2% 29% 12%
Financial reasons 2% 17% 18% 7% 4% 8%
Parent or child unhappy with program 4% 9% 7% 5% 4% 5%
Parent changed job/schedule 4% 7% 0% 5% 7% 4%
Preferred program became available 5% 7% 7% 0% 4% 4%
Child exceeded age of old program 3% 7% 9% 3% 0% 4%
Parent wanted to stay with children or was staying home with other dependent 5% 9% 2% 2% 0% 4%
Child reached age for new program 1% 7% 9% 0% 4% 3%
Parent stopped working/finished school 2% 2% 9% 3% 0% 3%
Transportation/location 1% 4% 4% 0% 0% 2%
Respondent/child moved 5% 2% 0% 0% 0% 2%
Provider moved 4% 0% 0% 0% 4% 2%
Other 7% 2% 7% 3% 11% 6%
Respondent did not answer question 1% 0% 4% 2% 0% 1%
Note: Response to an open-ended question, grouped by category. Totals may not equal 100 percent due to rounding. No respondent identified self care as the type of their most recent previous arrangement. Readers should use caution in interpreting the figures because of small sub-sample sizes.

Child Care Use in Minnesota: November 2010 Report of the 2009 Statewide Household Child Care Survey
69
Transportation problems
As shown in Figure 44, 5 percent of respondents report that transportation keeps them from using the type of care they prefer, up from 2 percent in 2004. Eleven percent report it is sometimes a problem, and 85 percent report it is not a problem.
Households with low incomes are more likely to report transportation prevents them from using the type of care they prefer (23 percent versus 12 percent), as are households of color (31 percent versus 14 percent).
Households that receive care at home or someone besides parent provides transportation, and those whose primary arrangement adds more than 20 minutes to their commute are more likely to report transportation keeps them from using the type of care they prefer (22 percent and 25 percent versus 13 percent).
44. Percent of households reporting that transportation to and from child care is a problem by age of selected child
Do transportation problems keep you from using the type of care you prefer?
Age of child
0-2 years
(n=269)
3-5 years
(n=358)
6-9 years
(n=343)
10-12 years
(n=237) Total
(N=1,207)
Yes 3% 6% 3% 7% 5%
Sometimes 8% 10% 11% 15% 11%
No 89% 84% 86% 79% 85%
Note: Question asked of all respondents, concerning transportation to and from child care for all their children ages 12 and younger.
45. Percent of households reporting that transportation to and from child care is a problem by travel time
Do transportation problems keep you from using the type of care you prefer?
Minutes travel time adds to one-way trip to work
None (N=207)
5 or less
(N=280)
More than 5 but less than 10 (N=137)
10 to 20 (N=200)
More than 20 (N=65)
Yes 8% 3% 4% 6% 11%
Sometimes 15% 9% 7% 11% 14%
No 77% 88% 89% 84% 75%
Note: None combines households that receive care at home or in which someone else besides parent provides transportation.

Child Care Use in Minnesota: November 2010 Report of the 2009 Statewide Household Child Care Survey
70
Child care quality Quality child care can be found in home-based and center-based settings. Factors commonly associated with quality care include small group size, low child-adult ratios, continuity and stability of the staffing, provider responsiveness to individual child and family concerns and values, and providers with formal training or education in child development.
This section presents parents’ reports of the quality of the selected child’s current primary arrangement and their satisfaction with that arrangement. In surveys of parent satisfaction, parents tend to report high levels of satisfaction with their child care when they are asked general questions. This has been found even when trained observers visiting the same providers have determined that quality was marginal. However, when parents are asked more probing questions (e.g., “What one thing would you change about this arrangement?”), they generally reveal more dissatisfaction. Presenting both kinds of responses, while they may appear contradictory, helps to document a more balanced account of parents’ perceptions about the quality of their child care. This is important, since current policy relies heavily on parents to make well-informed choices on the quality of the care they select; and quality rating and improvement systems, a strategy of interest to policymakers, are designed to provide parents the information they need to make well-informed choices.
Parents’ quality and satisfaction ratings for primary arrangement
Parents tend to express strong satisfaction with the quality of their primary child care arrangements. Characteristics on which arrangements are rated highest include “my child feels safe and secure” (99 percent said “always” or “usually”), and “the caregiver provides a warm and caring environment” (95 percent). Ninety-five percent say if they had it to do all over they would “always” or “usually” choose the same care again (see Figure 46).
Parents rate caregivers or providers lowest in “uses a curriculum or planning tool for teaching,” and “tracks my child’s learning and development using an assessment tool” (46 percent and 30 percent said “always” or “usually,” respectively).
Low-income households are more likely to report they usually or always rely on their provider to be flexible about their hours (70 percent versus 57 percent).
Among low-income households, those with a child care subsidy are more likely to report their provider usually or always uses a curriculum (70 percent versus 44 percent), tracks their child’s learning (56 percent versus 31 percent), helps their child in school or prepare for school (88 percent versus 74 percent) and has enough education to work with young children (98 percent versus 72 percent).

Child Care Use in Minnesota: November 2010 Report of the 2009 Statewide Household Child Care Survey
71
Households which use licensed family child care or center-based care are more likely to report their provider has education to work with young children (91 percent versus 62 percent), and uses a curriculum (71 percent versus 17 percent) than those who use FFN care; whereas households that use FFN care are more likely to report their provider is more flexible about the hours (79 percent versus 50 percent).
46. Parents’ quality and satisfaction ratings for randomly-selected child’s primary arrangement (N=908-910)
Always UsuallySome-times Rarely Never
Don’t know
My child feels safe and secure 90% 9% <1% <1% <1% -
The caregiver or provider creates a warm and caring environment between teachers and caregivers and children 80% 15% 4% <1% <1% <1%
If I had it to do over, I would choose this care again 86% 9% 3% <1% <1% <1%
The caregiver and I share information about my child 75% 17% 6% 2% <1% -
There has been too much turnover in my child’s caregivers at this arrangement <1% 1% 6% 13% 79% <1%
The caregiver provides activities that are just right for my child 66% 25% 8% <1% <1% -
The caregiver or provider helps my child get along with other children 72% 19% 6% <1% 1% 1%
The caregiver or provider needs more help with the children 2% 2% 10% 23% 63% <1%
The caregiver or provider has a lot of books and learning materials 64% 14% 14% 2% 4% 2%
The caregiver or provider has enough education and training to work with young children 57% 19% 11% 2% 8% 3%
The caregiver or provider helps my child do well in school or be prepared when he/she starts school 52% 20% 17% 4% 6% 2%
I rely on my caregiver to be flexible about my hours 41% 20% 16% 8% 14% 1%
The caregiver or provider uses a curriculum or planning tool for teaching 34% 12% 17% 6% 26% 4%
The caregiver or provider tracks my child’s learning and developing using an assessment tool 22% 8% 13% 9% 42% 7%
Child Care Use in Minnesota: November 2010 Report of the 2009 Statewide Household Child Care Survey
72
Employment and child care Parents use child care for other reasons than providing care while they are at work. Some non-working parents choose various types of care to give children social opportunities or enrichment and development experiences. However, Minnesota continues to lead the nation in the percentage of women in the work force; consequently, a large proportion of child care use is necessary to support parents’ employment. Moreover, Minnesota’s “work-first” model of public assistance discourage the use of public funds to help parents stay home, and provides funds to support child care so parents can work.
This section presents findings from the household survey concerning the work activities of Minnesota parents that might shape their child care needs; the ways in which child care issues affect parents’ work; and parents’ ability to handle child care problems that arise during work hours.
This information will help policymakers assess the impact of combining parenting activities with employment. It will also be useful to child care resource and referral agencies helping parents plan for contingencies, and it will help employers support their employees’ attendance and productivity.
Work-related child care problems
A quarter (24 percent) of working parents report their work schedule varies from week to week.
Thirty-five percent of respondents report they or their spouse or partner had one or more of the work-related issues listed in Figure 47 within the past six months because of a problem with child care (not including occasions when the child was sick). For example, 20 percent worked fewer hours; 18 percent were late for work or left early; 18 percent changed shifts or hours; and 16 percent missed an entire day of work.
Of respondents who have lost time from work, 8 percent say such problems have happened “often” in the last six months; 29 percent say they had happened “sometimes,” and 64 percent say “rarely.”
Households with low incomes are more likely to report these type of problems occur sometimes or often occur (45 percent versus 32 percent for households with higher incomes).

Child Care Use in Minnesota: November 2010 Report of the 2009 Statewide Household Child Care Survey
73
Twelve percent of respondents report that child care problems have prevented them from accepting or keeping the kind of job they wanted in the past 12 months, compared with 20 percent in 2004.
The percentage reporting that child care problems have prevented them from accepting or keeping the kind of job they wanted in the past 12 months was higher for households with low incomes (20 percent versus 9 percent). The percentage also goes down as household income goes up (from 30 percent for households with incomes under $20,000, to 15 percent for incomes of $20,000 to $44,999, to 12 percent for incomes of $45,000 to $74,999, to 8 percent for incomes of $75,000 or more). This was also true for households of color (25 percent versus 11 percent); and households with a child with special needs (21 percent versus 10 percent).
Sixty-five percent of parents say it is “rarely” or “never” difficult to deal with child care problems that arise during working hours. Eleven percent say it is “always” or “usually” difficult.

Child Care Use in Minnesota: November 2010 Report of the 2009 Statewide Household Child Care Survey
74
47. Work-related child care problems by type of primary arrangement
Child’s primary arrangement
FFN care own
home (n=343)
FFN care someone
else’s home
(n=174)
Licensed family
child care(n=151)
Center-based care
(n=370)
Self care
(n=27)
Supervised activities (n=140)
Total (N=1,205)
In the past six months, how often did the following occur for the respondent, spouse, or partner due to a problem with child care (does not include child being sick)?
Worked fewer hours 20% 14% 26% 22% 22% 18% 20%
Late for work or left early 21% 14% 21% 18% 30% 9% 18%
Changed shifts or schedule 22% 10% 20% 18% 22% 14% 18%
Missed an entire day of work 16% 15% 26% 17% 7% 6% 16%
Could not work overtime 15% 10% 16% 17% 19% 10% 14%
Quality of work suffered worrying about your child 7% 3% 3% 7% 19% 9% 6%
Quit job or was fired 2% 2% 1% 3% 4% 1% 2%
Did not get a raise or promotion 3% 2% 0% 3% 0% <1% 2%
Any of the above 35% 29% 44% 27% 48% 26% 35%
Prevented from accepting or keeping a job you want 16% 10% 5% 13% 19% 7% 12%
Of households who had these problems, how often in the past six months?
Rarely 63% 71% 67% 62% 54% 65% 64%
Sometimes 26% 28% 28% 30% 29% 30% 29%
Often 12% 2% 5% 8% 8% 5% 8%
(For those who are working) How difficult is it for you to deal with child care problems that arise during working hours?
Always difficult 6% 3% 6% 6% 0% 6% 5%
Usually difficult 7% 7% 4% 6% 0% 2% 6%
Sometimes difficult 24% 24% 28% 23% 24% 24% 24%
Rarely difficult 30% 34% 28% 34% 33% 30% 31%
Never difficult 34% 32% 34% 32% 43% 39% 34%
Note: “Primary arrangement” is the one in which the randomly-selected child spends the most time. Columns may not equal 100 percent due to rounding. Second question about losing time from work was only asked if respondent said “yes” to any one of the questions above.
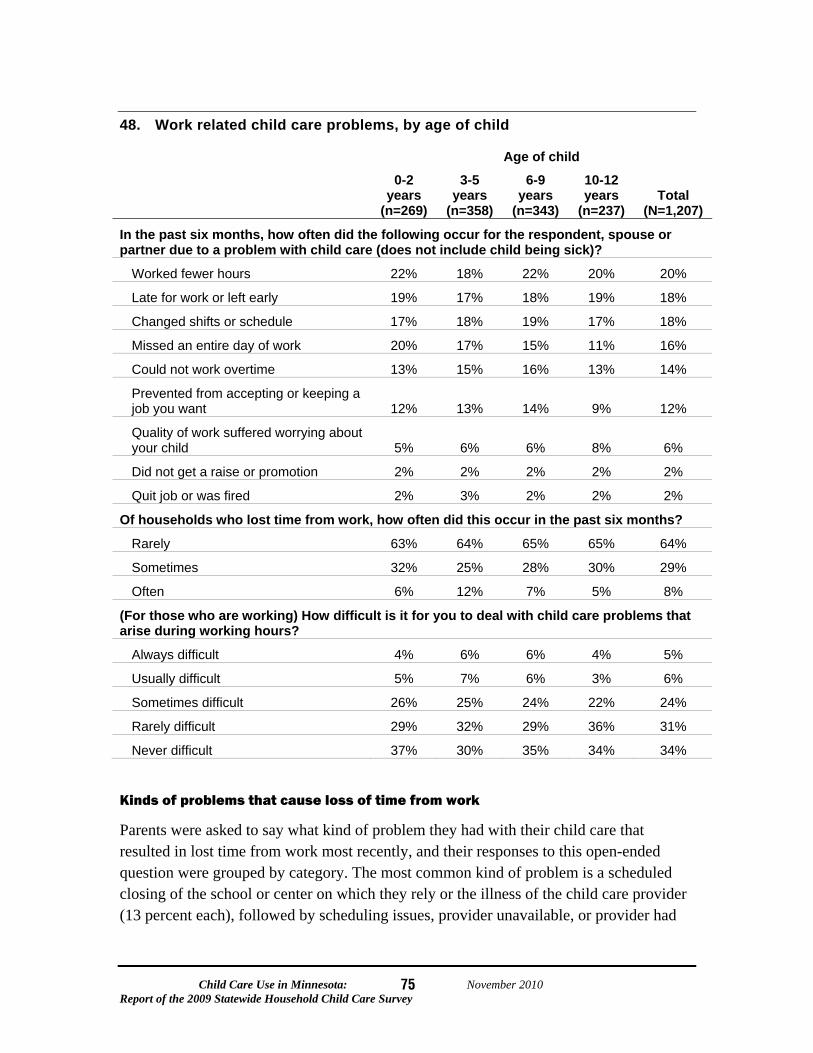
Child Care Use in Minnesota: November 2010 Report of the 2009 Statewide Household Child Care Survey
75
48. Work related child care problems, by age of child
Age of child
0-2 years
(n=269)
3-5 years
(n=358)
6-9 years
(n=343)
10-12 years
(n=237) Total
(N=1,207)
In the past six months, how often did the following occur for the respondent, spouse or partner due to a problem with child care (does not include child being sick)?
Worked fewer hours 22% 18% 22% 20% 20%
Late for work or left early 19% 17% 18% 19% 18%
Changed shifts or schedule 17% 18% 19% 17% 18%
Missed an entire day of work 20% 17% 15% 11% 16%
Could not work overtime 13% 15% 16% 13% 14%
Prevented from accepting or keeping a job you want 12% 13% 14% 9% 12%
Quality of work suffered worrying about your child 5% 6% 6% 8% 6%
Did not get a raise or promotion 2% 2% 2% 2% 2%
Quit job or was fired 2% 3% 2% 2% 2%
Of households who lost time from work, how often did this occur in the past six months?
Rarely 63% 64% 65% 65% 64%
Sometimes 32% 25% 28% 30% 29%
Often 6% 12% 7% 5% 8%
(For those who are working) How difficult is it for you to deal with child care problems that arise during working hours?
Always difficult 4% 6% 6% 4% 5%
Usually difficult 5% 7% 6% 3% 6%
Sometimes difficult 26% 25% 24% 22% 24%
Rarely difficult 29% 32% 29% 36% 31%
Never difficult 37% 30% 35% 34% 34%
Kinds of problems that cause loss of time from work
Parents were asked to say what kind of problem they had with their child care that resulted in lost time from work most recently, and their responses to this open-ended question were grouped by category. The most common kind of problem is a scheduled closing of the school or center on which they rely or the illness of the child care provider (13 percent each), followed by scheduling issues, provider unavailable, or provider had

Child Care Use in Minnesota: November 2010 Report of the 2009 Statewide Household Child Care Survey
76
personal problems (10 percent each). As shown in Figure 49, the kinds of problems vary by type of arrangement.
49. Kinds of problems that cause loss of time from work by randomly-selected child’s primary child care arrangement
Problems that cause loss of time from work
Child’s primary arrangement
FFN care own
home (n=110)
FFN care someone
else’s home (n=46)
Licensed family
child care(n=63)
Center-based care
(n=124)
Self care
(n=10)
Supervised activities
(n=29) Total
(N=382)
School or center closed (scheduled closing) 4% 7% 29% 16% 10% 17% 13%
Provider was ill 14% 20% 19% 10% 10% 7% 13%
Schedule issues 9% 7% 3% 13% 20% 21% 10%
Provider unavailable (unspecified) 18% 11% 0% 7% 10% 17% 10%
Provider had personal problems 13% 7% 13% 10% 10% 0% 10%
Provider’s family was ill 4% 4% 16% 7% 0% 3% 7%
School or center closed (unscheduled closing) 4% 4% 10% 9% 0% 3% 6%
Provider had other business/ appointments 7% 11% 5% 2% 0% 0% 5%
Can’t leave child home alone for that long 6% 0% 0% 2% 10% 3% 3%
Transportation issues 3% 9% 2% <1% 0% 0% 2%
Child’s behavioral issues 2% 2% 0% 2% 10% 3% 2%
Respondent did not answer question 18% 17% 5% 15% 20% 21% 15%
Note: Response to open-ended question, grouped by category. Percents may not total to 100 due to rounding. Because many children have multiple arrangements, the primary arrangement is not necessarily the arrangement that caused the loss of time from work. Readers should use caution in interpreting the figures because of small sub-sample sizes.

Child Care Use in Minnesota: November 2010 Report of the 2009 Statewide Household Child Care Survey
77
Backup child care arrangements
Parents of school-age children were asked what usually happens when there is no school on a regular weekday. Half report they or a spouse or partner either stay or go home to care for the child; in some cases they take turns staying home, change their work schedule to be at home or have the same days off as their child. Eighteen percent say a relative cares for the child, up from 13 percent in 2004. Eleven percent report that their child goes to their regular child care (non-school) arrangement, down from 21 percent in 2004 (see Figure 50).
50. Backup arrangements for school-age children when there is no school on a regular weekday by primary arrangement
Backup arrangements when there is no school on a regular weekday
Child’s primary arrangement
FFN care own
home (n=188)
FFN care someone
else’s home (n=70)
Licensed family
child care(n=51)
Center-based care
(n=214)
Self care
(n=21)
Supervised activities
(n=82) Total
N=626)
Parent (or spouse/partner) stays home or goes home 47% 37% 59% 50% 52% 66% 51%
Relative cares for child 19% 34% 10% 15% 10% 15% 18%
Child goes to regular arrangement (other than school) 9% 10% 20% 14% 0% 5% 11%
Older child stays home to watch child 10% 1% 4% 2% 19% 4% 5%
Neighbor or friend cares for child 5% 6% 4% 2% 5% 2% 4%
Stay-at-home parent 4% 4% 0% 4% 14% 6% 4%
Special (school-sponsored) arrangements 1% 0% 0% 3% 0% 0% 1%
Child cares for self <1% 1% 0% 0% 14% 0% <1%
Take child to work <1% 0% 0% 1% 0% 1% <1%
Hire sitter 0% 1% 0% <1% 0% 1% <1%
Other 4% 4% 4% 7% 0% 0% 4%
Respondent did not answer
Note: Response to open-ended question, grouped by category. Percents may not total 100 due to rounding. “Primary arrangement” is the one in which the child spends the most time. Readers should use caution in interpreting the figures because of small sub-sample sizes.

Child Care Use in Minnesota: November 2010 Report of the 2009 Statewide Household Child Care Survey
78
Recommendations The results of this statewide survey of randomly-selected households that use child care for children ages 12 and younger provide an accurate overview of child care use, choices and affordability for all families in Minnesota. Based on the results of this study and discussion with the study advisory committee, the researchers recommend the following to ensure that child care, of high quality and affordable, is available for all Minnesota families who need it.
1. Continue public and private efforts to empower parents to make informed child care choices.
Survey results indicate that 88 percent of parents say they would find it helpful if their community had a child care quality rating system. Parents with low incomes and parents of color, in particular, say such a rating system would be “very helpful.” In addition, households with low incomes that receive a child care subsidy, relative to those without a subsidy, more commonly use a community or CCR&R services to learn about their primary child care arrangements (21 percent versus 7 percent).
Continue to support efforts to ensure child care information is available to parents through programs and initiatives such as CCR&R services and a quality rating system. Ensure that child care information is accessible in multiple formats and languages.
2. Develop the supply of high-quality child care options.
Survey results indicate that parents choose child care based on quality, especially for children under age 6 (22 percent). In addition, “a caregiver rated as high quality” is a very important consideration in choosing child care for 77 percent of parents, higher than a “reasonable cost” (71 percent).
The supply of high-quality child care options could be developed by supporting the professional development of and specialized training for child care providers, by offering providers incentives to improve the quality of their care and by empowering parents to make informed decisions about their child care choices.

Child Care Use in Minnesota: November 2010 Report of the 2009 Statewide Household Child Care Survey
79
3. Increase public and private ways to help families, especially those with low-incomes, access high-quality child care.
While family, friend and neighbor care is a common child care choice, some parents using that care would prefer center-based programs but cannot afford them. Lack of child care choices is highest for parents with low incomes (35 percent), parents of color (44 percent) and parents whose child has a special need (48 percent). Moreover, families with low incomes in Minnesota continue to pay, on average, 20 percent of their income for child care arrangements. That is more than double the proportion paid by families with higher incomes (9 percent) and double the amount considered to be affordable.
Those able to access and use state child care assistance fare much better with regard to choice, satisfaction and use of licensed child care. For example, 46 percent of families with low incomes receiving a child care subsidy use center-based care as their primary arrangement, compared with 22 percent for families with low incomes without a subsidy and 33 percent for families with higher incomes. However, 86 percent of Minnesota families with lower incomes report not using state child care assistance programs (CCAP).20
Ways to increase access to high-quality child care options include increasing the availability of scholarships to be used in quality early care and education settings, increasing the use of CCAP, increasing incentives that link child care assistance payments to quality settings, ensuring that reimbursement rates for child care reflect the market, developing policies that emphasize continuity of care for children receiving CCAP and increasing the use of earned income tax credits, child care tax credits and pre-tax child care expense accounts through employers.
4. Continue to support and expand ways to improve the quality of family, friend and neighbor caregivers and connect them to appropriate resources.
Families (70 percent) still rely on grandparents and other relatives for affordable, convenient, and trustworthy child care, especially for children under age 3. For example, 38 percent of children ages 2 and younger use FFN care as their only type of child care. To ensure that all children are cared for in language-rich, safe and developmentally-appropriate environments, reach out especially to FFN that provide full-time child care.
20 Eligibility for CCAP is based on family size, family income and participation in authorized employment-related activities by the parents. This survey does not contain information that explains the reasons for not using CCAP or to determine whether the households with low incomes not receiving child care assistance are eligible to receive it under current guidelines.
Child Care Use in Minnesota: November 2010 Report of the 2009 Statewide Household Child Care Survey
80
5. Support programs throughout Minnesota that provide supervised, developmentally appropriate activities for pre-teens.
Youth are at risk in several ways when they are not engaged in structured, supervised activities during non-school hours. Youth may worry, experience loneliness or miss opportunities to develop important social skills or to engage in positive development opportunities. They may also engage in risky behaviors that diminish their success in school.
The relatively high and steady proportion of pre-teens providing self care throughout the year points to the need for more supervised activities and programs for 10- to-12-year-olds during the summer and after school. For example, 44 percent are in self care during the school year (as one of the types regularly used), similar to 41 percent five years ago, and 36 percent are in self care during the summer (down from 42 percent five year ago). Half of the parents who use self care as their primary arrangement for 10 to 12-year-olds say they use it due to cost.

This information is available in alternative formats to individuals with disabilities by calling (651) 431-4671. TTY users can call through Minnesota Relay at (800) 627-3529. For Speech-to-Speech, call (877) 627-3848. For additional assistance with legal rights and protections for equal access to human services programs, contact your agency’s ADA coordinator.
ADA4 (5-09)
Attention. If you want free help translating this information, ask your worker or call the number below for your language.
kMNt’sMKal’ ebIG~kcg’VnCMnYybkE¨bBtámanenHedayminKit«f sUmsYrG~kkan’sMNuMerOgrbs’G~k É TUrs&BæeTAelx
1-888-468-3787 .
Pažnja. Ako vam je potrebna besplatna pomoć za prevod ove informacije, pitajte vašeg radnika ili nazovite 1-888-234-3785.
Ceeb toom. Yog koj xav tau kev pab txhais cov xov no rau koj dawb, nug koj tus neeg lis dej num (worker) lossis hu 1-888-486-8377.
ໂປຼດຊາບ.ຖ້າຫາກທ່ານຕ້ອງການການຊ່ວຍເຫຼືອໃນການແປຂໍ້ຄວາມດ ັ່ງກ່າວນີ້ຟຣີ,ຈ ົ່ງຖາມນຳພນກັງານຊ່ວຍວຽກຂອງທ່ານຫຼືໂທຣ໌ຫາຕາມເລກໂທຣ໌1-888-487-8251.
Hubaddhu. Yoo akka odeeffannoon kun sii hiikamu gargaarsa tolaa feeta ta’e, hojjataa kee gaafaddhu ykn lakkoofsa kana bilbili 1-888-234-3798.
Внимание: если вам нужна бесплатная помощь в переводе этой информации, обратитесь к своему социальному работнику или позвоните по следующему телефону: 1-888-562-5877.
Ogow. Haddii aad dooneyso in lagaa kaalmeeyo tarjamadda macluumaadkani oo lacag la’aan ah, weydii hawl-wadeenkaaga ama wac lambarkan 1-888-547-8829.
Atención. Si desea recibir asistencia gratuita para traducir esta información, consulte a su trabajador o llame al 1-888-428-3438.
Chú Ý. Nếu quý vị cần dịch thông tin nầy miễn phí, xin gọi nhân-viên xã-hội của quý vị hoặc gọi số 1-888-554-8759.
LB2-0001 (10-09)


