1. Child labour in Bolivia: a comparison of estimates from MECOVI and MICS survey instruments L. Guarcello S. Lyon January 2004 Understanding Children’s Work Project Working Paper Series, January 2004 43922 Public Disclosure Authorized Public Disclosure Authorized Public Disclosure Authorized Public Disclosure Authorized Public Disclosure Authorized Public Disclosure Authorized Public Disclosure Authorized Public Disclosure Authorized
Transcript
1.
Child labour in Bolivia:a comparison of estimates from
MECOVI and MICS surveyinstruments
L. GuarcelloS. Lyon
January 2004
Und
erst
andi
ng C
hild
ren’
s Wor
k Pr
ojec
t Wor
king
Pap
er S
erie
s, Ja
nuar
y 20
04
43922
Pub
lic D
iscl
osur
e A
utho
rized
Pub
lic D
iscl
osur
e A
utho
rized
Pub
lic D
iscl
osur
e A
utho
rized
Pub
lic D
iscl
osur
e A
utho
rized
Pub
lic D
iscl
osur
e A
utho
rized
Pub
lic D
iscl
osur
e A
utho
rized
Pub
lic D
iscl
osur
e A
utho
rized
Pub
lic D
iscl
osur
e A
utho
rized
Child labour in Bolivia:a comparison of estimates from MECOVI and MICS survey
instruments
L. Guarcello*
S. Lyon*
Working Paper January 2004
Understanding Children’s Work (UCW) Project
University of Rome “Tor Vergata” Faculty of Economics
V. Columbia 2 00133 Rome Tor Vergata
Tel: +39 06.7259.5618 Fax: +39 06.2020.687
Email: [email protected] As part of broader efforts toward durable solutions to child labor, the International Labour Organization (ILO), the United Nations Children’s Fund (UNICEF), and the World Bank initiated the interagency Understanding Children’s Work (UCW) project in December 2000. The project is guided by the Oslo Agenda for Action, which laid out the priorities for the international community in the fight against child labor. Through a variety of data collection, research, and assessment activities, the UCW project is broadly directed toward improving understanding of child labor, its causes and effects, how it can be measured, and effective policies for addressing it. For further information, see the project website at www.ucw-project.org. This paper is part of the research carried out within UCW (Understanding Children's Work), a joint ILO, World Bank and UNICEF project. The views expressed here are those of the authors' and should not be attributed to the ILO, the World Bank, UNICEF or any of these agencies’ member countries.
* UCW-Project and University of Rome “Tor Vergata”
Child labour in Bolivia:a comparison of estimates from MECOVI and MICS survey
instruments
Working Paper January 2004
ABSTRACT
Child labour in Bolivia is analysed applying two recent surveys, MECOVI 2000 (World Bank) and MICS 2000 (UNICEF). The analysis aims at contrasting and comparing the survey findings relating to the incidence and characteristics of children’s work. The extent to which the findings are survey-dependent is assessed and implications for the design and implementation for future surveys for the analysis of child labour is discussed.
Child labour in Bolivia:a comparison of estimates from MECOVI and MICS survey
instruments
Working Paper January 2004
CONTENTS
1. Introduction ........................................................................................................................... 1 2. Survey characteristics ............................................................................................................ 3 3. Measurement of children’s activities .................................................................................. 5 4. Characteristics of children’s work ....................................................................................... 9 5. Effects of involvement in economic activity .................................................................. 13 6. Factors associated with children’s work .......................................................................... 15 7. Conclusion ............................................................................................................................ 19 8. References ............................................................................................................................. 20 Annex A: Descriptive tables ............................................................................................................ 21
1 UCW WORKING PAPER SERIES, JANUARY 2004
1. INTRODUCTION 1. World Bank multipurpose household surveys,1 UNICEF MICS surveys,2 and ILO SIMPOC surveys3 are particularly important instruments for generating information on child labour in developing countries. Datasets from these surveys, based on comprehensive interviews with a stratified sample of households, provide information on the incidence and key characteristics of children’s work, as well as the links between children’s work, child age and sex, household income levels, mothers’ education and a range of other factors (see Table 1). 2. How do the results generated by these survey instruments compare? And to what extent are child labour estimates survey-dependent? This paper compares the results of a World Bank multi-purpose survey and a UNICEF MICS survey in Bolivia in an attempt to address these questions. It builds on a previous comparison of World Bank and ILO survey results in Zambia,4 and constitutes part of a broader effort to improve the quality and consistency of child labour data collected through the agencies’ main survey instruments. 3. Bolivia provides a good opportunity for this survey comparison because a World Bank Living Standards Measurement Study5 and a UNICEF MICS survey were both conducted there during 2000, meaning that discrepancies in the survey findings are likely due to methodological differences rather than to longitudinal changes in the actual child labour situation. 4. This paper looks specifically at the degree to which the findings on child labour are consistent across the two Bolivia surveys, and therefore have similar implications for policy. The paper focuses on the 7-14 years age group. The upper bound of 14 years is consistent with the ILO Convention No. 138 on Minimum Age,6 which states that the minimum age for admission to employment or work should not be less than 15 years (Art. 2.3), and is the age at which compulsory schooling ends in Bolivia.7 The lower bound of seven years was that used in the employment module of the MECOVI survey.8 5. The paper is structured as follows. Section 2 provides background information on the two surveys and the sampling methodology employed for each. Sections 3, 4 and 5 then examine survey findings relating to the 1 Principally, the Living Standards Measurement Study/Integrated Survey series and the Priority Survey series. 2 Multiple Indicator Cluster Surveys. 3 Statistical Information and Monitoring Programme on Child Labour. 4 Blunch N.H., Dar A., Guarcello L., Lyon S., Ritualo A.R. and Rosati F.C., Children's Work in Zambia: A Comparative Study of Survey Instruments, UCW Project working paper, September 2002. 5 Entitled: ‘Encuesta continua de hogares (programa MECOVI)’, referred to hereafter as MECOVI 2000. 6 In countries where the economy and educational facilities are insufficiently developed the Convention sets a minimum age of not less than 14 years for general work, and 12 years for light work, for an initial period. In Bolivia, the minimum working age is 14 years, with the exception of apprentices. Children less than 18 years of age are prohibited from work that could retard their physical growth, that requires great strength, or that is dangerous (Ley General del Trabajo, del 8 de dicembre de 1942, Decreto Supremo del 4 de agosto de 1940). 7 It should be noted that the stipulations contained in ILO Conventions Nos. 138 and 182 relating to hazardous work, excessively long work hours and unconditional worst forms, also extend to children aged 15-17 years. The two surveys, however, do not collect information on these issues. 8 MICS, on the other hand, collected information on child labour for the 5-14 years age group.
2 CHILD LABOUR IN BOLIVIA: A COMPARISON OF ESTIMATES FROM
MECOVI AND MICS SURVEY INSTRUMENTS
incidence, characteristics and impact of children’s work. For each, the two surveys are compared in terms of how key variables are constructed and in terms of results generated. Section 6 looks at key correlates children’s work, and their consistency across the two surveys. Section 7 concludes.
3 UCW WORKING PAPER SERIES, JANUARY 2004
2. SURVEY CHARACTERISTICS 6. The Bolivia Living Conditions Survey (Encuesta continua de hogares), referred to hereafter as MECOVI, was carried out in 2000 by the National Statistical Office. The survey, part of the regional MECOVI programme, 9 was aimed at improving and extending information on household living conditions, information needed for the effective formulation and evaluation of poverty reduction programmes. The survey questionnaire covered a wide range of socio-economic and demographic variables in an effort to capture the various dimensions of poverty and living conditions. 7. The MECOVI survey sample comprised 4,875 households and 20,815 persons, representing 1,906,668 households and an expanded population of 8,274,803 individuals. The survey was addressed to all households, excluding people living in collective housing (hospitals, etc.). A stratified sample design was used, based on the Probability Proportional to Size method for the PSU (primary sample unit) and for the households in the second stage, building a sample representative at the national as well as regional, urban and rural levels. Questions relating to children aged seven years and older were addressed directly to the children. 8. The Bolivia Multiple Indicator Cluster Survey, referred to hereafter as MICS, was also carried out in 2000 by the National Statistical Office. The survey was undertaken as part of the UNICEF global MICS programme10, and was designed to assess progress on the end-decade goals set at the 1990 United Nations World Summit for Children. These goals related to nutrition, health and education, as well as to birth registration, family environment, knowledge of HIV/AIDS, and child labour. 9. The Bolivia MICS survey followed the design, planning and implementation methodologies of the global MICS survey programme. A stratified sample design was employed, building a national probabilistic sample, stratified by geographic area, department and residence (urban-rural).11 The survey sample comprised 4,312 households. The survey questionnaire targeted male and female children under 17 years of age (household questionnaire module), women of child-bearing age (women questionnaire module), and children aged less than five years (child questionnaire). Questions in the household module relating to children were addressed to caretakers rather than to children themselves.
9 A regional programme of technical assistance for statistical capacity building to improve household surveys to measure living conditions and poverty in Latin America and the Caribbean region. a joint initiative of IDB, World Bank and UN-ECLAC. 10 With in mind the purpose of obtaining comparable information at international level, the division of Evaluation, Policy and Planning of UNICEF, in cooperation with UNESCO, USAID, OMS and DHS, has developed the Multiple Indicator Cluster Survey (MICS) programme, for implementation in a wide numbers of countries. 11 Due to inaccessibility were excluded from the sample the rural areas of the departments of Beny and Pando, accounting for 1.5 percent of the National population.
4 CHILD LABOUR IN BOLIVIA: A COMPARISON OF ESTIMATES FROM
MECOVI AND MICS SURVEY INSTRUMENTS
10. As illustrated in Table 1, the two surveys differed somewhat in terms of scope and variables examined. While both surveys collected information on children at work in economic activity, only MICS looked at child involvement in household chores. Although international labour standards provide for exceptions for household chores performed in a child’s own household, household chores can pose risks to children’s health, and can affect children’s ability to attend and benefit from schooling, in the same ways as work in economic activity. Consideration of household chores is there also important to a general understanding of child labour. 11. Both surveys provided information on the intensity and modality of work, but only MECOVI looked in detail at the type (i.e., sector and sub-sector) of work performed by children, and children’s specific work functions. MECOVI was also unique in collecting information on illness and injury among the 7-14 years age group. These variables are all critical to assessing the hazardousness of work, and the extent to which children’s work constitutes child labour for elimination. Neither survey offered information concerning children’s involvement in unconditional worst forms of work, an area for which large-scale household surveys are ill-suited.12 12. MECOVI provided a much wider range of background household and community variables for use in analysing the determinants of child labour. In addition to the background variables provided by MICS (i.e., mothers’ education, water availability and household wealth), MECOVI collected information on electricity access, schooling costs, electricity availability, household expenditures and employment of household head, all of which are potentially important to understanding household decisions concerning children’s work.
12 It is very unlikely, for example, that unconditional worst forms of work would be reported by a household member to a survey interviewer, even if the child in question were still part of the household. And frequently the concerned children do not belong to a household, having either run away or been abandoned, orphaned, displaced or even sold. Alternative survey tools and methodologies are needed for generating statistical information on these children.
Table 1.- Availability of data relating to child labour
Indicator area MICS MECOVI
Work in economic activity
School attendance
Work in household chores x
Hazardous work x x
Unconditional worst forms x x
Work modality
Work sector x
Work intensity (hrs. worked)
Learning achievement x x
Reported illness/injury x
Mothers’ education
Schooling expenditures x
Household income/wealth
Water availability
Electricity availability x
Exposure to shock x x
Access to credit x x
Access to land x x
5 UCW WORKING PAPER SERIES, JANUARY 2004
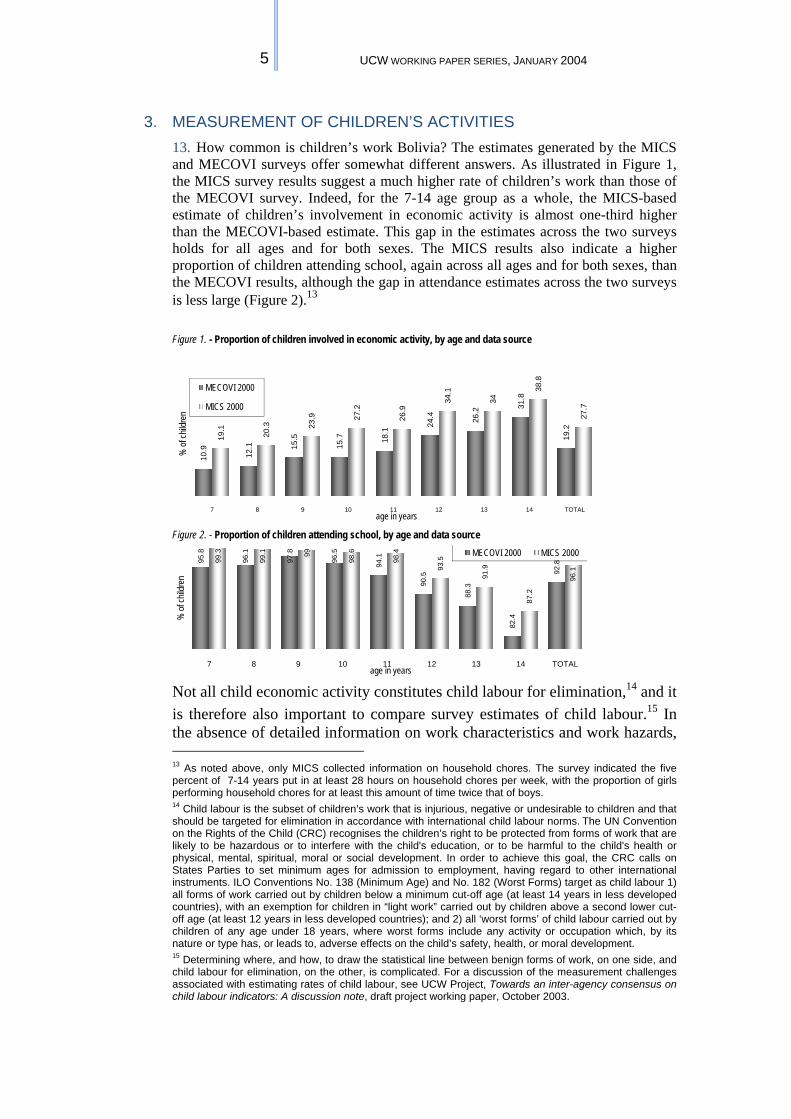
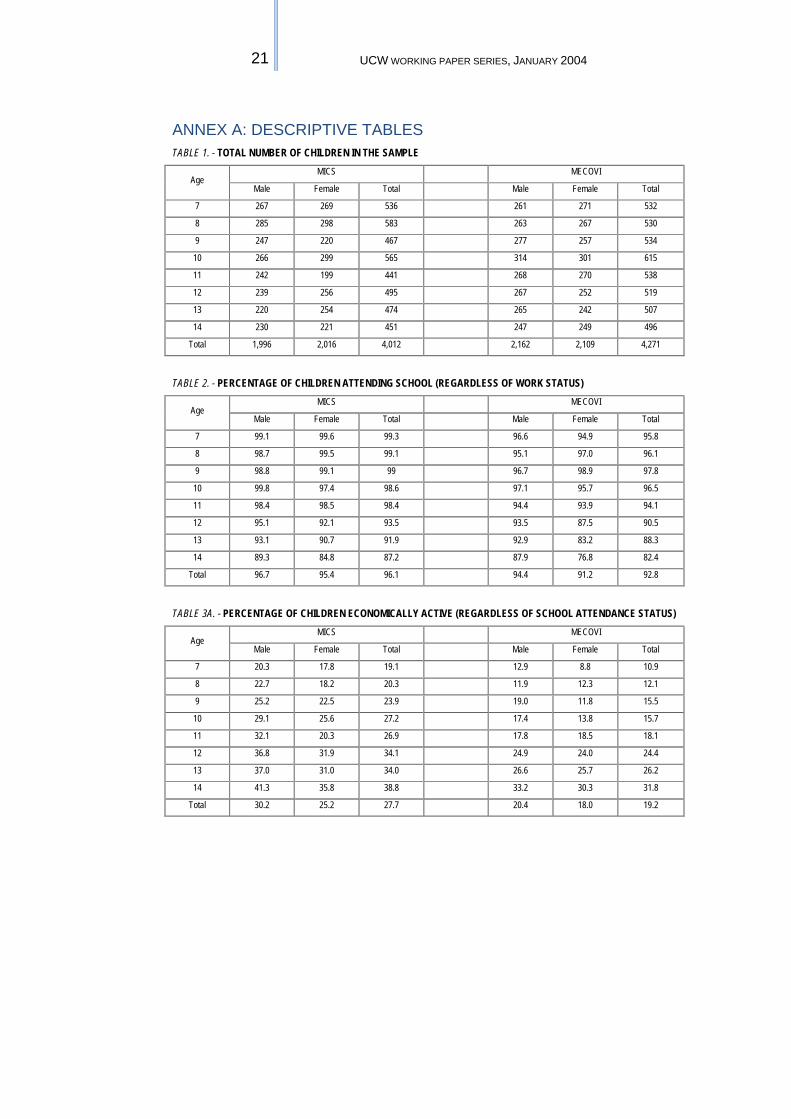
3. MEASUREMENT OF CHILDREN’S ACTIVITIES 13. How common is children’s work Bolivia? The estimates generated by the MICS and MECOVI surveys offer somewhat different answers. As illustrated in Figure 1, the MICS survey results suggest a much higher rate of children’s work than those of the MECOVI survey. Indeed, for the 7-14 age group as a whole, the MICS-based estimate of children’s involvement in economic activity is almost one-third higher than the MECOVI-based estimate. This gap in the estimates across the two surveys holds for all ages and for both sexes. The MICS results also indicate a higher proportion of children attending school, again across all ages and for both sexes, than the MECOVI results, although the gap in attendance estimates across the two surveys is less large (Figure 2).13 Figure 1. - Proportion of children involved in economic activity, by age and data source
Figure 2. - Proportion of children attending school, by age and data source
Not all child economic activity constitutes child labour for elimination,14 and it is therefore also important to compare survey estimates of child labour.15 In the absence of detailed information on work characteristics and work hazards, 13 As noted above, only MICS collected information on household chores. The survey indicated the five percent of 7-14 years put in at least 28 hours on household chores per week, with the proportion of girls performing household chores for at least this amount of time twice that of boys. 14 Child labour is the subset of children’s work that is injurious, negative or undesirable to children and that should be targeted for elimination in accordance with international child labour norms. The UN Convention on the Rights of the Child (CRC) recognises the children’s right to be protected from forms of work that are likely to be hazardous or to interfere with the child's education, or to be harmful to the child's health or physical, mental, spiritual, moral or social development. In order to achieve this goal, the CRC calls on States Parties to set minimum ages for admission to employment, having regard to other international instruments. ILO Conventions No. 138 (Minimum Age) and No. 182 (Worst Forms) target as child labour 1) all forms of work carried out by children below a minimum cut-off age (at least 14 years in less developed countries), with an exemption for children in “light work” carried out by children above a second lower cut-off age (at least 12 years in less developed countries); and 2) all ‘worst forms’ of child labour carried out by children of any age under 18 years, where worst forms include any activity or occupation which, by its nature or type has, or leads to, adverse effects on the child’s safety, health, or moral development. 15 Determining where, and how, to draw the statistical line between benign forms of work, on one side, and child labour for elimination, on the other, is complicated. For a discussion of the measurement challenges associated with estimating rates of child labour, see UCW Project, Towards an inter-agency consensus on child labour indicators: A discussion note, draft project working paper, October 2003.
10.9
12.1 15
.5
15.7 18
.1
24.4 26
.2 31.8
19.2
19.1
20.3 23
.9 27.2
26.9
34.1
34
38.8
27.7
7 8 9 10 11 12 13 14 TOTAL
% of
child
ren
age in years
MECOVI 2000
MICS 2000
95.8
96.1
97.8
96.5
94.1
90.5
88.3
82.4
92.899
.3
99.1 99
98.6
98.4
93.5
91.9
87.2
96.1
7 8 9 10 11 12 13 14 TOTAL
% of
child
ren
age in years
MECOVI 2000 MICS 2000
6 CHILD LABOUR IN BOLIVIA: A COMPARISON OF ESTIMATES FROM
MECOVI AND MICS SURVEY INSTRUMENTS
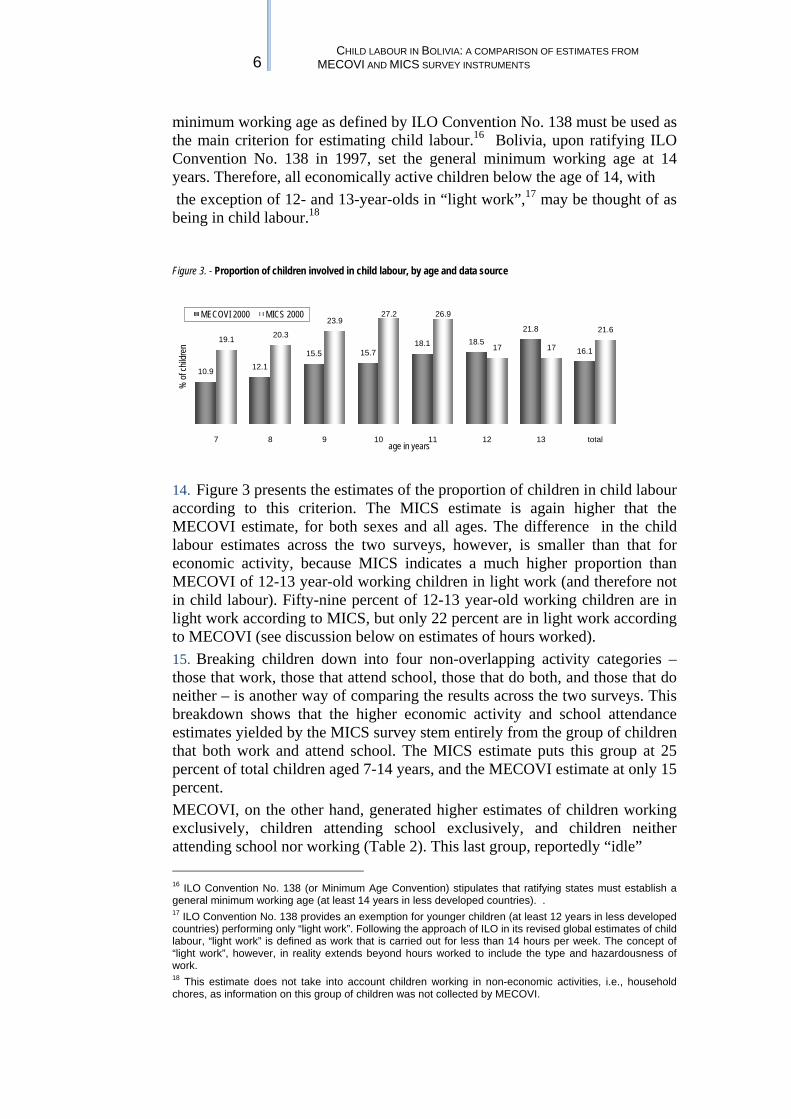
minimum working age as defined by ILO Convention No. 138 must be used as the main criterion for estimating child labour.16 Bolivia, upon ratifying ILO Convention No. 138 in 1997, set the general minimum working age at 14 years. Therefore, all economically active children below the age of 14, with the exception of 12- and 13-year-olds in “light work”,17 may be thought of as being in child labour.18
Figure 3. - Proportion of children involved in child labour, by age and data source
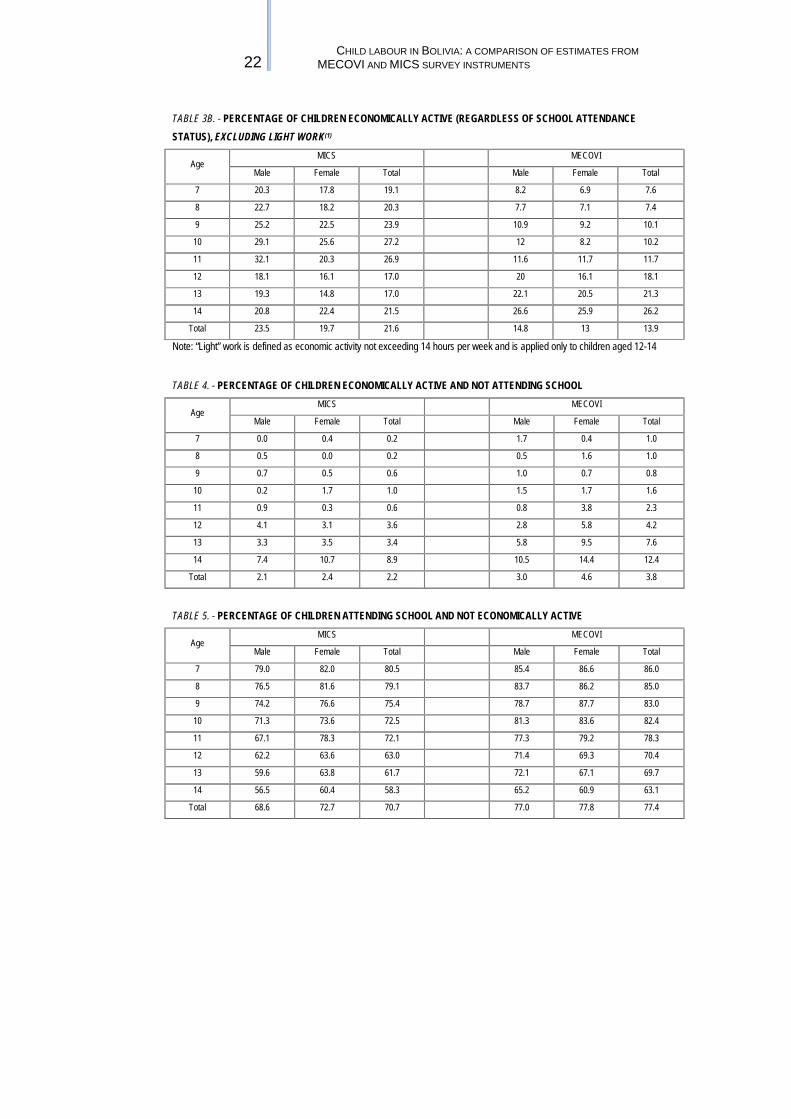
14. Figure 3 presents the estimates of the proportion of children in child labour according to this criterion. The MICS estimate is again higher that the MECOVI estimate, for both sexes and all ages. The difference in the child labour estimates across the two surveys, however, is smaller than that for economic activity, because MICS indicates a much higher proportion than MECOVI of 12-13 year-old working children in light work (and therefore not in child labour). Fifty-nine percent of 12-13 year-old working children are in light work according to MICS, but only 22 percent are in light work according to MECOVI (see discussion below on estimates of hours worked). 15. Breaking children down into four non-overlapping activity categories – those that work, those that attend school, those that do both, and those that do neither – is another way of comparing the results across the two surveys. This breakdown shows that the higher economic activity and school attendance estimates yielded by the MICS survey stem entirely from the group of children that both work and attend school. The MICS estimate puts this group at 25 percent of total children aged 7-14 years, and the MECOVI estimate at only 15 percent. MECOVI, on the other hand, generated higher estimates of children working exclusively, children attending school exclusively, and children neither attending school nor working (Table 2). This last group, reportedly “idle” 16 ILO Convention No. 138 (or Minimum Age Convention) stipulates that ratifying states must establish a general minimum working age (at least 14 years in less developed countries). . 17 ILO Convention No. 138 provides an exemption for younger children (at least 12 years in less developed countries) performing only “light work”. Following the approach of ILO in its revised global estimates of child labour, “light work” is defined as work that is carried out for less than 14 hours per week. The concept of “light work”, however, in reality extends beyond hours worked to include the type and hazardousness of work. 18 This estimate does not take into account children working in non-economic activities, i.e., household chores, as information on this group of children was not collected by MECOVI.
10.9 12.115.5 15.7
18.1 18.521.8
16.119.1 20.3
23.927.2 26.9
17 17
21.6
7 8 9 10 11 12 13 total
% of
child
ren
age in years
MECOVI 2000 MICS 2000
7 UCW WORKING PAPER SERIES, JANUARY 2004
Table 2. - Child activity status, by sex and data source
Activity status
% children aged 7-14 year
MICS 2000 MECOVI 2000
Male Female Total Male Female Total
Working(1) 30.1 25.1 27.6 20.4 18.0 19.2
Attending school 96.7 95.4 96.1 94.4 91.2 92.8
Working, not attending school 2.1 2.4 2.2 3.0 4.6 3.8
Attending school, not working 68.7 72.7 70.7 77.0 77.8 77.4
Working and attending school 28.0 22.7 25.4 17.4 13.4 15.4
Not working, not attending school 1.3 2.2 1.7 2.6 4.2 3.4
Notes: (1) refers to work in economic activity
children also constitute an important policy concern – they not only do not go to school but are also the category of children most at-risk of entering work when households are exposed to individual or collective shocks.19 16. What might account for these differences in estimates across the two surveys, and in particular the higher estimate for child economic activity generated by the MICS survey? 17. Differences in the design of the survey questionnaires might provide at least part of the answer (Table 3). The fact that the MICS questionnaire, unlike that for MECOVI, specifically targeted children’s work, might have helped focus respondents’ attention on the children in the household at work, leading to less under-reporting of children’s involvement in work.20 On the other hand, the absence of follow-up questions in the MICS questionnaire to control for factors such as temporary absence from work due to vacation or illness meant that some economically-active children were likely missed in the MICS survey. 18. Survey respondents were different in the two surveys, also possibly influencing the survey results. As noted above, the survey respondent in the MICS survey was the caretaker, while MECOVI was administered directly to children aged seven years and older. But any bias in responses would presumably be in the same direction for these two groups, i.e., towards overstating school attendance and understating work involvement.
19 See, for example, UCW Project, Understanding Children’s Work in Guatemala, Guatemala, April 2003. 20 But a Zambia study comparing the results of another survey specifically targeting child labour (SIMPOC) with those of a more general living conditions survey (LSMS), did not show a similar difference in estimates of child economic activity. For further details, see Blunch N.H., Dar A., Guarcello L., Lyon S., Ritualo A.R. and Rosati F.C., Children's Work in Zambia: A Comparative Study of Survey Instruments, UCW Project working paper, September 2002.
8 CHILD LABOUR IN BOLIVIA: A COMPARISON OF ESTIMATES FROM
MECOVI AND MICS SURVEY INSTRUMENTS
Table 3. - Questions used to determine work status of children
a. MICS
b. MECOVI
19. Seasonality likely played the largest role in explaining the differences in the survey estimates. Field work for the MICS survey took place from mid-August to mid-September, a period overlapping with the sugar cane harvest. Other studies indicate that children are frequently used in this harvest.21 Field work for MECOVI took place in November and December, outside the harvest season for sugar cane and other crops.22 The fact that the MICS survey was conducted earlier in the school year23 also may at least partially account for the different school attendance estimates generated by the two surveys.
21 See, for example, Dávalos G., Child Labour in Sugarcane: A Rapid Assessment, International Labour Organization, International Programme on the Elimination of Child Labour (IPEC), Bolivia, May 2002, Geneva. 22 However, neither survey overlapped with harvest seasons for other major crops. Wheat, barley, maize, rice, soybeans and potatoes are harvested from March to May, and sweet potatoes from mid-May to mid-August (FAO, 1999). The brazil nut harvest, also reportedly involving children, begins in January. 23 The school year runs from March to December in Bolivia.
9 UCW WORKING PAPER SERIES, JANUARY 2004
4. CHARACTERISTICS OF CHILDREN’S WORK 20. Both surveys collected data on work modality an important indicator of the nature of children’s work. MICS data permitted a breakdown of child workers by those in paid work, those in non-paid work and those that work for their family. MECOVI provided greater detail, distinguishing between children that are in wage work, self-employed, employers (paid and unpaid), part of a cooperative, and working within the family unit (Table 4). Both MICS and MECOVI indicated
Table 4. - Questions used to determine modality of work
a. MICS
b. MECOVI
that by far the largest proportion of working children – nine out of 10 – work for their families (Table A23). 21. Data on children’s total labour supply (i.e., average total hours worked) were also collected by both surveys. These data are critical to determining how much children’s labour contributes to household income and welfare. They are also very important to determining the intensity of work, and offer insight into its possible health and developmental consequences. A limited amount of time spend on light work is not necessarily bad for a child’s health, and need not interfere with formal education. Long working hours, on the
10 CHILD LABOUR IN BOLIVIA: A COMPARISON OF ESTIMATES FROM
MECOVI AND MICS SURVEY INSTRUMENTS
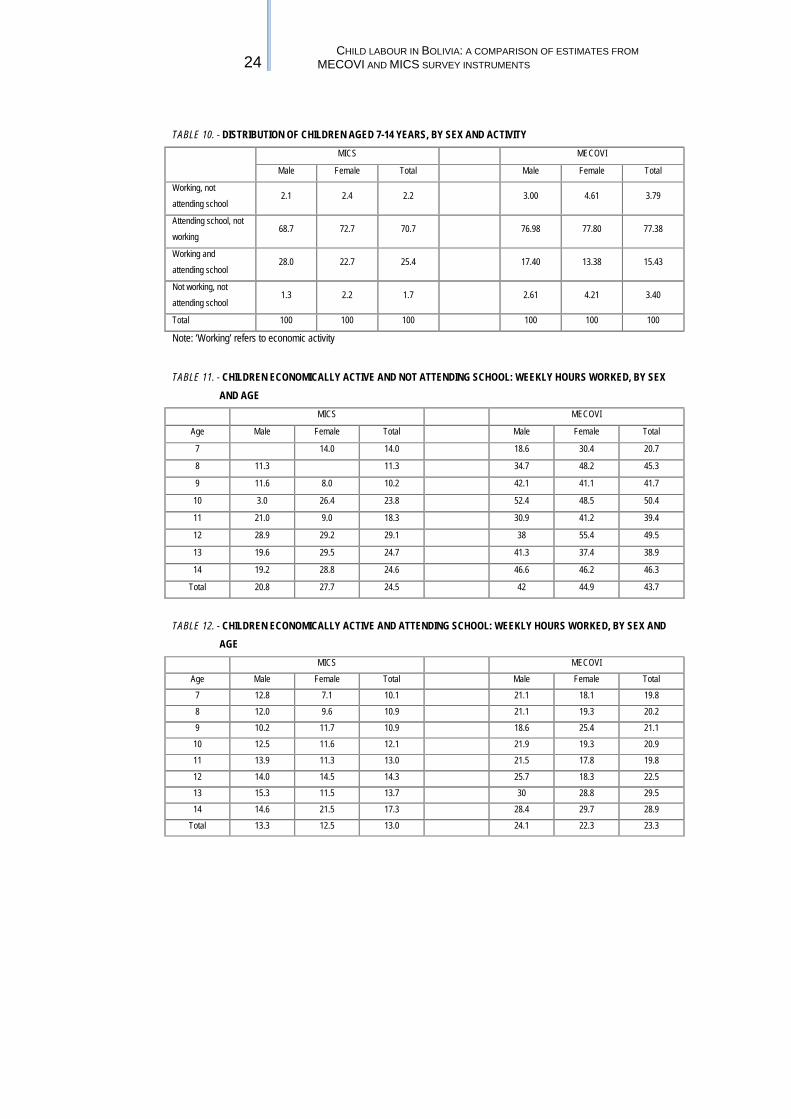
other hand, are likely to have more serious health and developmental consequences on the child. 22. Both surveys indicate that older children work longer hours than younger children (Figure 4), and that working hours differ little by sex (Table A13). 23. Both also indicate, not surprisingly, that children combining school and work put in fewer hours than those working exclusively, though the hours logged by the former group are by no means insignificant (Table A12). 24. The two surveys, however, generate dramatically different estimates of total hours worked. According to MICS, working children put in an average of only about 14 hours per week, while according to MECOVI, by contrast, they put in an average of over 27 hours per week. Estimates of hours worked differ both for children that work exclusively (38 hours per week according to MECOVI and 25 hours per week according to MICS), and for children that combine school and work (23 hours per week according to MECOVI and 13 hours per week according to MICS). This has important implications for Figure 4. - Average weekly hours of work in economic activity, by age and data source
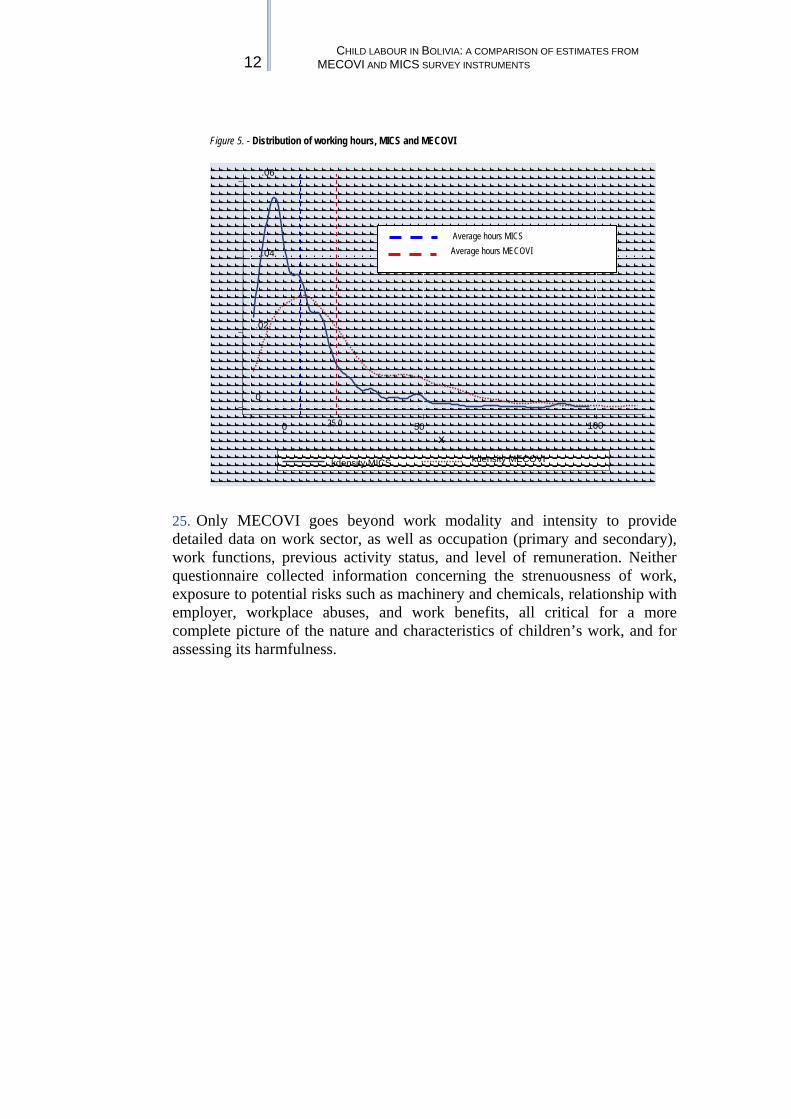
estimates of child labour for elimination (see previous section), for which hours worked is an important criterion (Tables A3B). The reasons for this large discrepancy are not clear and require further investigation. But again, at least part of the explanation likely lies in the way the survey questions were formulated (Table 5). MICS asked only about the number of hours worked during the reference week in family and non-family work, while MECOVI asked more specifically about the number of days worked in the reference week, and hours worked for each. These formulations, though similar, could nonetheless have led to different interpretations on the part of respondents. The frequency distribution for hours worked for the two surveys is shown in Figure 5.
19.922.4 22.2 23.9 22.3
27.232.2
35.8
27.4
10.4 11.4 10.8 12.6 13.115.7 15.3
19.314.1
7 8 9 10 11 12 13 14 TOTAL
% of
child
ren
age in years
MECOVI 2000 MICS 2000
11 UCW WORKING PAPER SERIES, JANUARY 2004
Table 5. - Questions used to determine the working hours of children
a. MICS
b. MECOVI
12 CHILD LABOUR IN BOLIVIA: A COMPARISON OF ESTIMATES FROM
MECOVI AND MICS SURVEY INSTRUMENTS
Figure 5. - Distribution of working hours, MICS and MECOVI
25. Only MECOVI goes beyond work modality and intensity to provide detailed data on work sector, as well as occupation (primary and secondary), work functions, previous activity status, and level of remuneration. Neither questionnaire collected information concerning the strenuousness of work, exposure to potential risks such as machinery and chemicals, relationship with employer, workplace abuses, and work benefits, all critical for a more complete picture of the nature and characteristics of children’s work, and for assessing its harmfulness.
0
.02
.04
.06
0 50 100x
kdensity MICS kdensity MECOVI
425.0
Average hours MICS Average hours MECOVI
13 UCW WORKING PAPER SERIES, JANUARY 2004
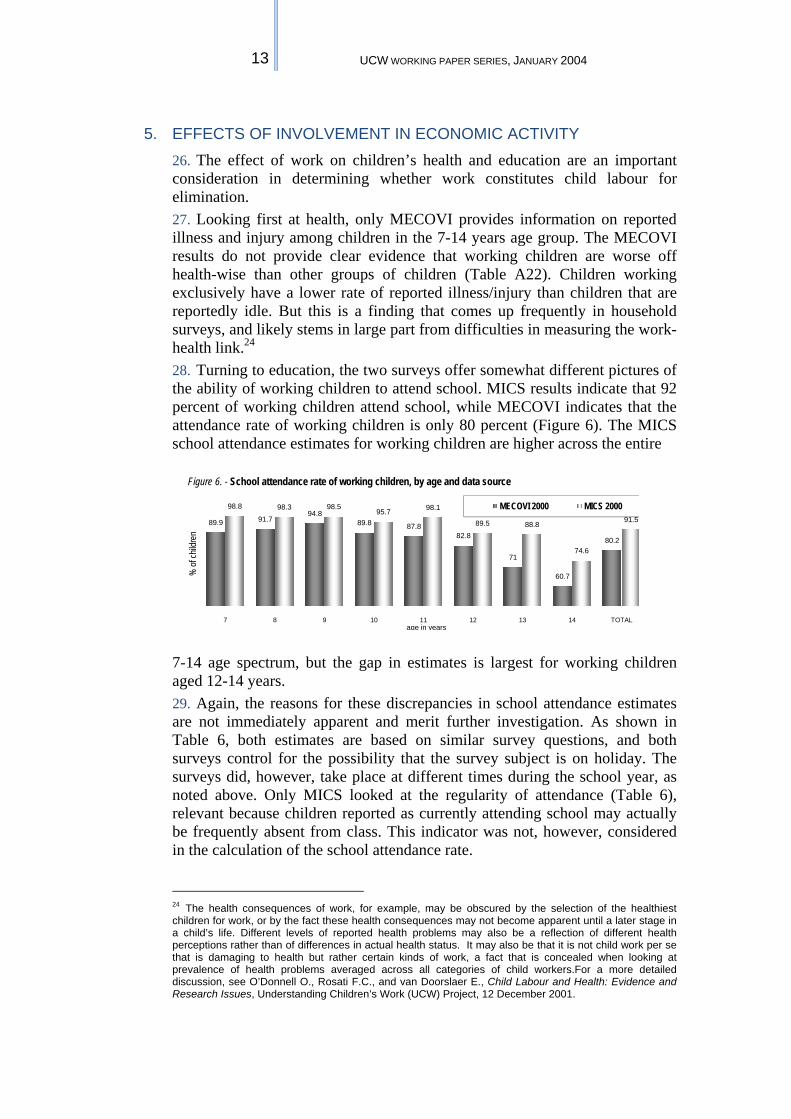
5. EFFECTS OF INVOLVEMENT IN ECONOMIC ACTIVITY 26. The effect of work on children’s health and education are an important consideration in determining whether work constitutes child labour for elimination. 27. Looking first at health, only MECOVI provides information on reported illness and injury among children in the 7-14 years age group. The MECOVI results do not provide clear evidence that working children are worse off health-wise than other groups of children (Table A22). Children working exclusively have a lower rate of reported illness/injury than children that are reportedly idle. But this is a finding that comes up frequently in household surveys, and likely stems in large part from difficulties in measuring the work-health link.24 28. Turning to education, the two surveys offer somewhat different pictures of the ability of working children to attend school. MICS results indicate that 92 percent of working children attend school, while MECOVI indicates that the attendance rate of working children is only 80 percent (Figure 6). The MICS school attendance estimates for working children are higher across the entire
7-14 age spectrum, but the gap in estimates is largest for working children aged 12-14 years. 29. Again, the reasons for these discrepancies in school attendance estimates are not immediately apparent and merit further investigation. As shown in Table 6, both estimates are based on similar survey questions, and both surveys control for the possibility that the survey subject is on holiday. The surveys did, however, take place at different times during the school year, as noted above. Only MICS looked at the regularity of attendance (Table 6), relevant because children reported as currently attending school may actually be frequently absent from class. This indicator was not, however, considered in the calculation of the school attendance rate. 24 The health consequences of work, for example, may be obscured by the selection of the healthiest children for work, or by the fact these health consequences may not become apparent until a later stage in a child’s life. Different levels of reported health problems may also be a reflection of different health perceptions rather than of differences in actual health status. It may also be that it is not child work per se that is damaging to health but rather certain kinds of work, a fact that is concealed when looking at prevalence of health problems averaged across all categories of child workers.For a more detailed discussion, see O’Donnell O., Rosati F.C., and van Doorslaer E., Child Labour and Health: Evidence and Research Issues, Understanding Children’s Work (UCW) Project, 12 December 2001.
Figure 6. - School attendance rate of working children, by age and data source
89.9 91.794.8
89.8 87.882.8
71
60.7
80.2
98.8 98.3 98.595.7 98.1
89.5 88.8
74.6
91.5
7 8 9 10 11 12 13 14 TOTAL
% of
child
ren
age in years
MECOVI 2000 MICS 2000
14 CHILD LABOUR IN BOLIVIA: A COMPARISON OF ESTIMATES FROM
MECOVI AND MICS SURVEY INSTRUMENTS
Table 6. - Questions used to determine the school attendance status of children
a. MICS
b. MECOVI
30. The impact of work on schooling of course extends beyond attendance. The data from both surveys suggest that working children who attend school must nonetheless cope with long working hours (Table A12), leaving little time or energy for studies, and undoubtedly affecting their ability to derive educational benefit from schooling. MICS indicated that children combining school and work put in an average of 13 hours of work per week, and MECOVI indicated that this group works 23 hours per week. Data on links between work and learning achievement, however, were not collected for either survey.
15 UCW WORKING PAPER SERIES, JANUARY 2004
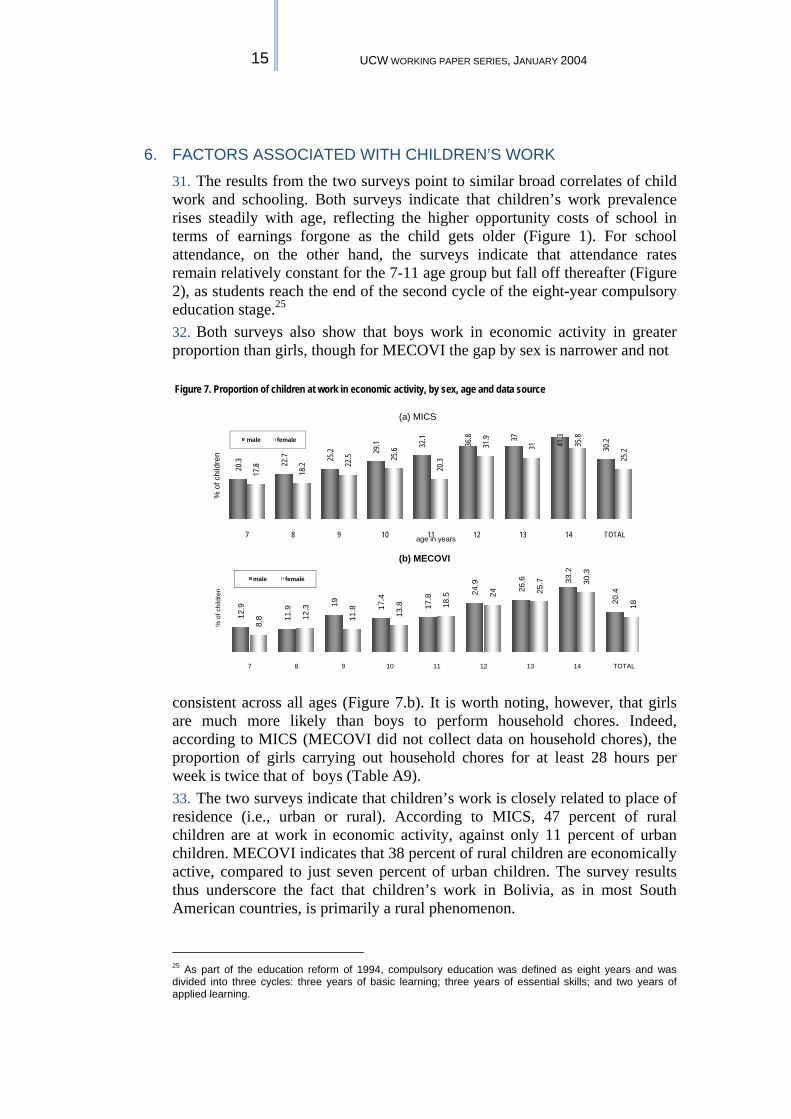
6. FACTORS ASSOCIATED WITH CHILDREN’S WORK 31. The results from the two surveys point to similar broad correlates of child work and schooling. Both surveys indicate that children’s work prevalence rises steadily with age, reflecting the higher opportunity costs of school in terms of earnings forgone as the child gets older (Figure 1). For school attendance, on the other hand, the surveys indicate that attendance rates remain relatively constant for the 7-11 age group but fall off thereafter (Figure 2), as students reach the end of the second cycle of the eight-year compulsory education stage.25 32. Both surveys also show that boys work in economic activity in greater proportion than girls, though for MECOVI the gap by sex is narrower and not
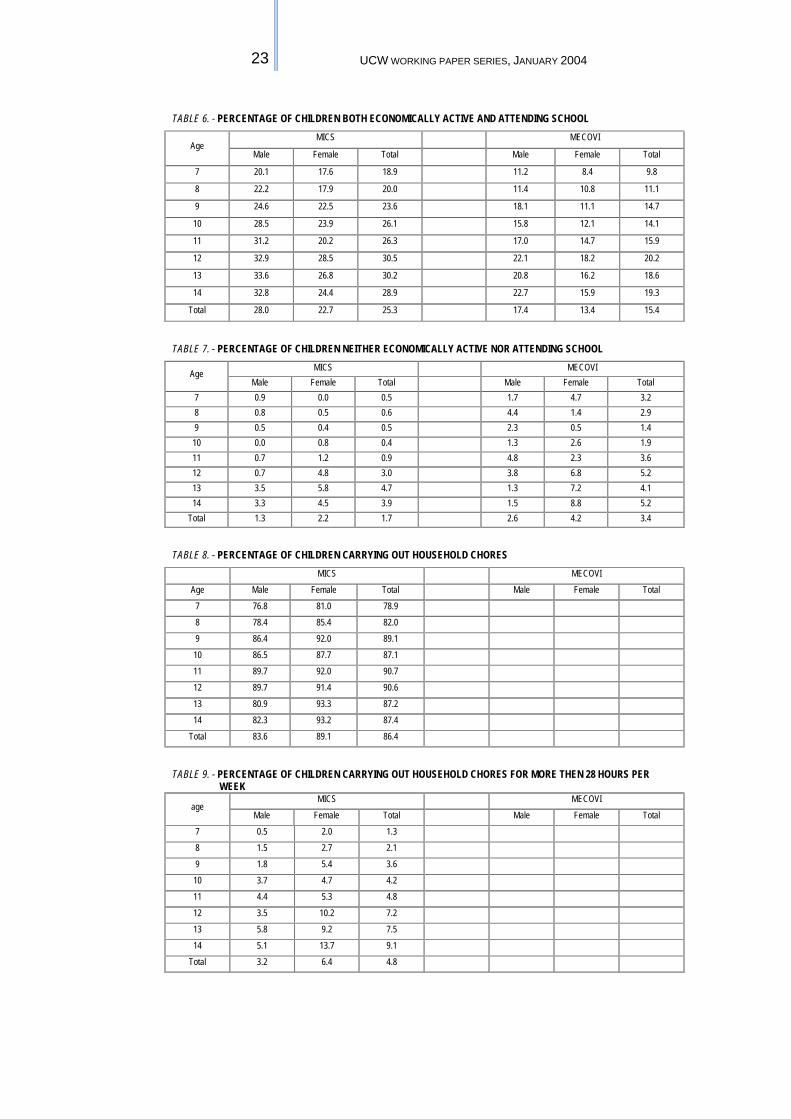
consistent across all ages (Figure 7.b). It is worth noting, however, that girls are much more likely than boys to perform household chores. Indeed, according to MICS (MECOVI did not collect data on household chores), the proportion of girls carrying out household chores for at least 28 hours per week is twice that of boys (Table A9). 33. The two surveys indicate that children’s work is closely related to place of residence (i.e., urban or rural). According to MICS, 47 percent of rural children are at work in economic activity, against only 11 percent of urban children. MECOVI indicates that 38 percent of rural children are economically active, compared to just seven percent of urban children. The survey results thus underscore the fact that children’s work in Bolivia, as in most South American countries, is primarily a rural phenomenon.
25 As part of the education reform of 1994, compulsory education was defined as eight years and was divided into three cycles: three years of basic learning; three years of essential skills; and two years of applied learning.
Figure 7. Proportion of children at work in economic activity, by sex, age and data source
(a) MICS
(b) MECOVI
20.3 22
.7 25.2 29
.1 32.1
36.8 37 41.3
30.2
17.8
18.2 22
.5 25.6
20.3
31.9
31 35.8
25.2
7 8 9 10 11 12 13 14 TOTAL
% o
f chi
ldre
n
age in years
male female
12.9
11.9 19 17
.4
17.8 24
.9
26.6 33
.2
20.4
8.8 12
.3
11.8 13.8 18
.5 24 25.7 30
.3
18
7 8 9 10 11 12 13 14 TOTAL
% o
f chi
ldre
n
i
male female
16 CHILD LABOUR IN BOLIVIA: A COMPARISON OF ESTIMATES FROM
MECOVI AND MICS SURVEY INSTRUMENTS
34. A strong relationship between household wealth, on the one hand, and children’s work and school attendance, on the other, is also apparent from the two surveys. The survey results indicate that children who mainly work come from low-wealth households, whereas children who mainly attend school come from households with higher levels of wealth, evidence for the oft-cited role of poverty in the decision to make children work. The results show child work decreasing, and schooling increasing, as household wealth rises (Figures 8 and 9). Figure 8. - Proportion of children in economic activity by household wealth/income level and data source
Figure 9. - Proportion of children attending school by household wealth/income level and data source
MICS data, however, permit only construction of a wealth index based on housing characteristics, while MECOVI data also permit the measure of household wealth based on household expenditures.26
26 Several studies call into question the relevance of an asset index as a proxy for living standards and poverty. For further information on the construction of the wealth index, see: Filmer D. and Pritchett L., Estimating wealth effects without expenditure data -- or tears: An application to educational enrolments in States of India, World Bank Policy Research Working Paper No. 1994, Washington, 1998; Filmer D. and Pritchett L., The effect of household wealth on educational attainment: Evidence from 35 countries, Population and Development Review, vol.25, no.1, pages 85-120, March 1999; and Filmer D. and Pritchett L., The effect of household wealth on educational attainment around the world: Demographic and Health Survey evidence, World Bank Policy Research Working Paper No. 1980, Washington, 1998.
MECOVI 2000 HH income quintilesMICS 2000 HH wealth index levels
17 UCW WORKING PAPER SERIES, JANUARY 2004
Figure 10. - Proportion of children involved in economic activity, by mothers’ education level and data source
Figure 11. - Proportion of children attending school, by mothers’ education level and data source
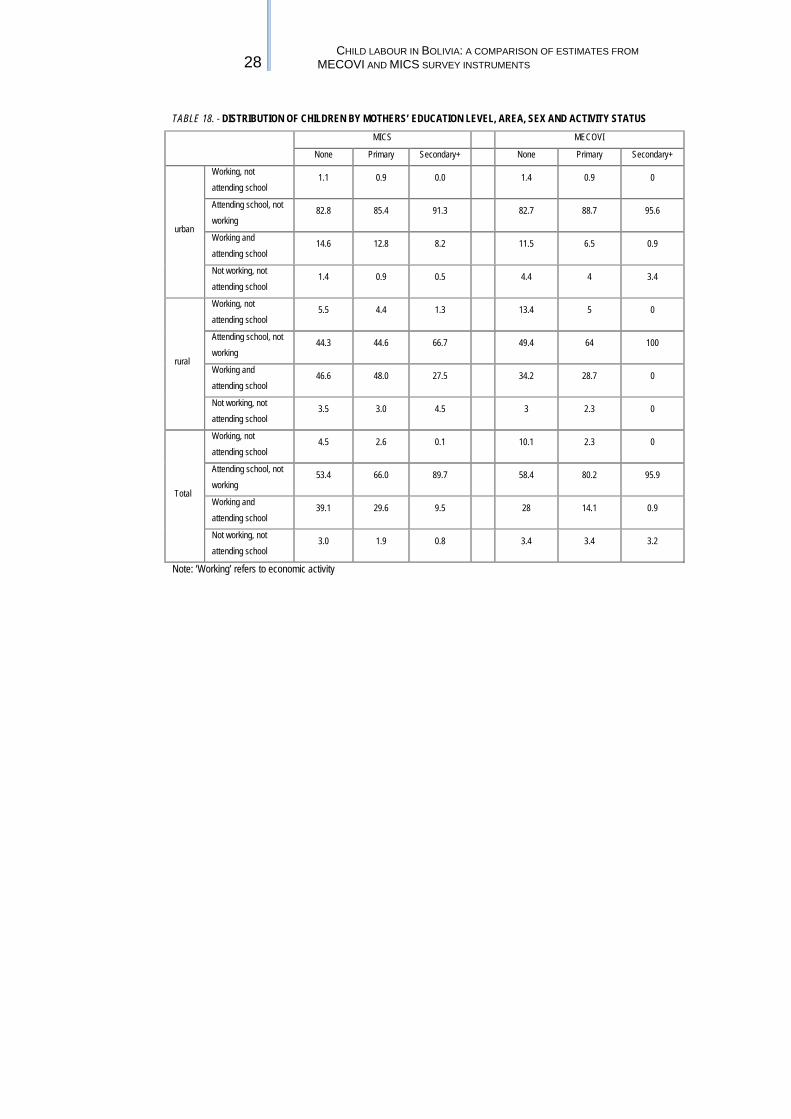
35. The education level of mothers appears to be another important correlate of children’s work prevalence and school attendance. Both surveys indicate that children’s work is most common in households in which the mother has no schooling, and least common in households in which the mother has at least a secondary education (Figure 10). The surveys indicate that the relationship between school attendance and education of the mother is the reverse, i.e., attendance is highest in households in which the mother is educated, and lowest in households in which the mother is not educated (Figure 11). This pattern is likely in part the result of a disguised income effect.27 It is also possible that education confers on the mother greater weight (moral authority or, if education translates into income, bargaining power) in family decisions, or that mother’s time is an input into the education (production of human capital) of their children, and that the mother's own level of education raises the productivity of this input.28
27 I.e., mothers with higher levels of education are also likely to have higher levels of income, and therefore less need to involve their children in work. 28 For a more complete discussion of the role of mothers’ education in decisions concerning children’s work, see Cigno A., Rosati F.C., and Tzannatos Z., Child Labor Handook, World Bank SP Discussion Paper No. 0206, May 2002.
35
18.7
1.7
43.6
32.2
9.6
none primary only secondary or higher
% of
child
ren
MOTHERS' EDUCATION LEVEL
MECOVI 2000
MICS 2000
86.8
93.396.9
92.595.6
99.2
none primary only secondary or higher
% of
child
ren
MOTHERS' EDUCATION LEVEL
MECOVI 2000
MICS 2000
18 CHILD LABOUR IN BOLIVIA: A COMPARISON OF ESTIMATES FROM
MECOVI AND MICS SURVEY INSTRUMENTS
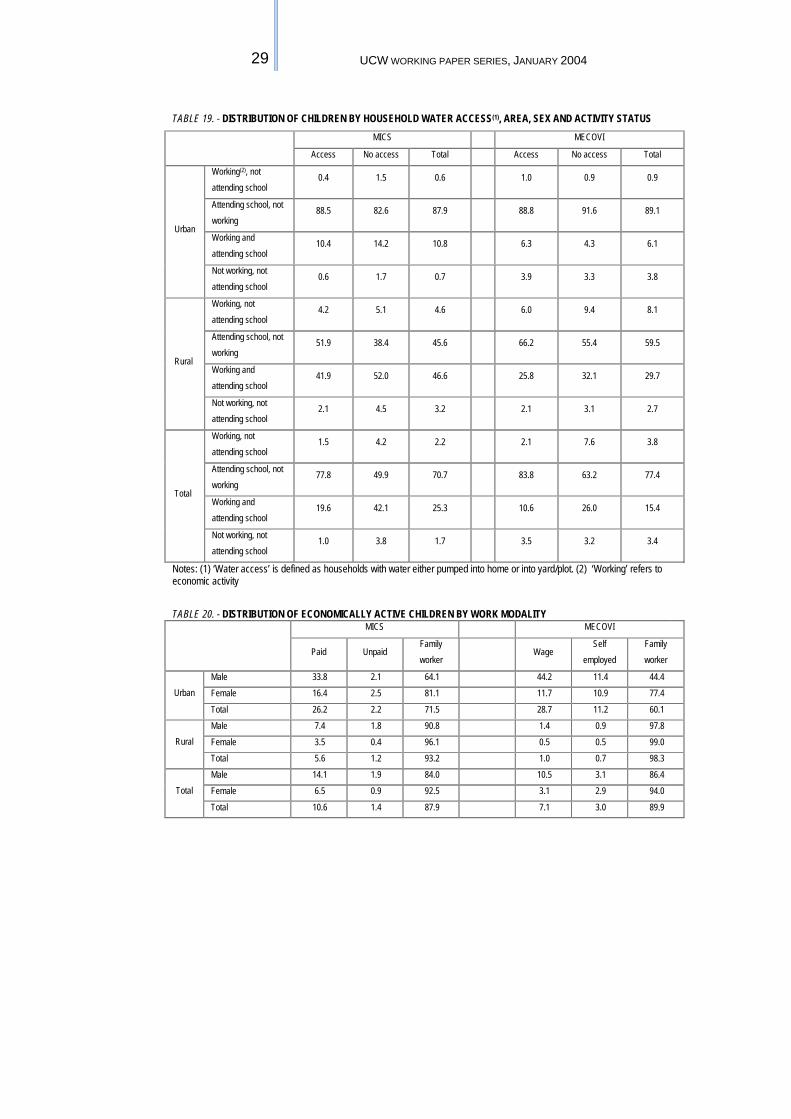
36. Finally, the two surveys suggest a close relationship between involvement in work, school attendance and household water access. The results from both surveys indicate that the rate of children’s work is much higher, and the rate of school attendance slightly lower, in households without ready water access (Figure 10). This undoubtedly reflects the fact that a lack of water access can raise the value of children’s time in non-schooling activities, as children are needed to undertake responsibility for water collection or to help cover the
cost of purchasing water.29
29 For a more detailed discussion of the role of basic infrastructure availability in household decisions concerning children’s work, see Guarcello L., Mealli F. and Rosati F.C., Child labour and access to basic services: Evidence from five countries, Understanding Child Work Project, unpublished draft, November 2003
Figure 10. - School attendance and economic activity rates, by household water access and data source
94.4
12.7
97.4
21.1
89.2
33.6
92
46.3
school attendance work prevalence school attendance work prevalence
% of
child
ren
MECOVI MICS
HH with water access
HH without water access
19 UCW WORKING PAPER SERIES, JANUARY 2004
7. CONCLUSION 37. This study compared and contrasted the World Bank MECOVI 2000 survey and the UNICEF MICS 2000 survey, and assessed the extent to which findings relating to child labour were consistent across the two surveys. 38. The study uncovered large differences in the estimates of several key variables relating to children’s work across the two surveys, with concomitant differences in implications for policy. In particular, the MICS-based estimate of children’s work prevalence was almost one-third higher than that based on MECOVI, while the MICS-based estimate of weekly hours worked was just half of the estimate yielded by MECOVI. The MICS survey also generated significantly higher estimates of school attendance than the MECOVI survey, both for 7-14 year-old working children and for the overall 7-14 years age group. As the surveys were conducted in the same year, these differences cannot be explained by longitudinal changes in actual work and school attendance rates between the survey dates. 39. The study found that the correlations between children’s work and key background variables (i.e., child age and sex, residence, house socio-economic level, mothers’ education and household water access) were consistent across the two surveys. The study did not, however, include a bivariate estimation of child labour and schooling, owing to the limited number of variables in the MICS dataset for inclusion in such an estimation. Causal links between children’s work and various background variables, and the relative strength of these links across the two surveys, were therefore not examined. 40. The reasons for the large differences in estimates of children’s work, school attendance and hours worked across the two surveys are not immediately clear and merit further investigation. There is also a need to examine whether these differences in the World Bank and UNICEF survey estimates are unique to Bolivia or also occur elsewhere, in which case they would likely reflect underlying differences in the survey instruments. The fact that World Bank multi-purpose household surveys and UNICEF MICS surveys are the two most common sources of information on child labour makes understanding the differences in their results especially important.
20 CHILD LABOUR IN BOLIVIA: A COMPARISON OF ESTIMATES FROM
MECOVI AND MICS SURVEY INSTRUMENTS
8. REFERENCES Blunch N.H., Dar A., Guarcello L., Lyon S., Ritualo A.R. and Rosati F.C., “Children's Work in Zambia: A Comparative Study of Survey Instruments”, World Bank, SP Discussion Paper, No, (December 2002). Cigno A., Rosati F.C., and Tzannatos Z., “Child Labor Handbook”, World Bank SP Discussion Paper No. 0206, (May 2002). Dávalos G., “Child Labour in Sugarcane: A Rapid Assessment”, International Labour Organization, International Programme on the Elimination of Child Labour (IPEC), Bolivia, (May 2002), Geneva. Filmer D. and Pritchett L., “The effect of household wealth on educational attainment: Evidence from 35 countries”, Population and Development Review, vol.25, no.1, pages 85-120, (March 1999). Filmer D. and Pritchett L., “Estimating wealth effects without expenditure data -- or tears: An application to educational enrolments in States of India”, World Bank Policy Research Working Paper No. 1994, Washington, (1998). Filmer D. and Pritchett L., “The effect of household wealth on educational attainment around the world: Demographic and Health Survey evidence”, World Bank Policy Research Working Paper No. 1980, Washington, (1998). Guarcello L., S.Lyon and Rosati F.C., “Child labour and access to basic services: Evidence from five countries”, Understanding Child Work Project, unpublished draft, (November 2003). O’Donnell O., Rosati F.C., and van Doorslaer E., “Child Labour and Health: Evidence and Research Issues”, Understanding Children’s Work (UCW) Project, (12 December 2001).
21 UCW WORKING PAPER SERIES, JANUARY 2004
ANNEX A: DESCRIPTIVE TABLES TABLE 1. - TOTAL NUMBER OF CHILDREN IN THE SAMPLE
Age MICS MECOVI
Male Female Total Male Female Total
7 267 269 536 261 271 532
8 285 298 583 263 267 530
9 247 220 467 277 257 534
10 266 299 565 314 301 615
11 242 199 441 268 270 538
12 239 256 495 267 252 519
13 220 254 474 265 242 507
14 230 221 451 247 249 496
Total 1,996 2,016 4,012 2,162 2,109 4,271
TABLE 2. - PERCENTAGE OF CHILDREN ATTENDING SCHOOL (REGARDLESS OF WORK STATUS)
Age MICS MECOVI
Male Female Total Male Female Total
7 99.1 99.6 99.3 96.6 94.9 95.8
8 98.7 99.5 99.1 95.1 97.0 96.1
9 98.8 99.1 99 96.7 98.9 97.8
10 99.8 97.4 98.6 97.1 95.7 96.5
11 98.4 98.5 98.4 94.4 93.9 94.1
12 95.1 92.1 93.5 93.5 87.5 90.5
13 93.1 90.7 91.9 92.9 83.2 88.3
14 89.3 84.8 87.2 87.9 76.8 82.4
Total 96.7 95.4 96.1 94.4 91.2 92.8
TABLE 3A. - PERCENTAGE OF CHILDREN ECONOMICALLY ACTIVE (REGARDLESS OF SCHOOL ATTENDANCE STATUS)
Age MICS MECOVI
Male Female Total Male Female Total
7 20.3 17.8 19.1 12.9 8.8 10.9
8 22.7 18.2 20.3 11.9 12.3 12.1
9 25.2 22.5 23.9 19.0 11.8 15.5
10 29.1 25.6 27.2 17.4 13.8 15.7
11 32.1 20.3 26.9 17.8 18.5 18.1
12 36.8 31.9 34.1 24.9 24.0 24.4
13 37.0 31.0 34.0 26.6 25.7 26.2
14 41.3 35.8 38.8 33.2 30.3 31.8
Total 30.2 25.2 27.7 20.4 18.0 19.2
22 CHILD LABOUR IN BOLIVIA: A COMPARISON OF ESTIMATES FROM
MECOVI AND MICS SURVEY INSTRUMENTS
TABLE 3B. - PERCENTAGE OF CHILDREN ECONOMICALLY ACTIVE (REGARDLESS OF SCHOOL ATTENDANCE STATUS), EXCLUDING LIGHT WORK(1)
Age MICS MECOVI
Male Female Total Male Female Total
7 20.3 17.8 19.1 8.2 6.9 7.6
8 22.7 18.2 20.3 7.7 7.1 7.4
9 25.2 22.5 23.9 10.9 9.2 10.1
10 29.1 25.6 27.2 12 8.2 10.2
11 32.1 20.3 26.9 11.6 11.7 11.7
12 18.1 16.1 17.0 20 16.1 18.1
13 19.3 14.8 17.0 22.1 20.5 21.3
14 20.8 22.4 21.5 26.6 25.9 26.2
Total 23.5 19.7 21.6 14.8 13 13.9
Note: “Light” work is defined as economic activity not exceeding 14 hours per week and is applied only to children aged 12-14
TABLE 4. - PERCENTAGE OF CHILDREN ECONOMICALLY ACTIVE AND NOT ATTENDING SCHOOL
Age MICS MECOVI
Male Female Total Male Female Total
7 0.0 0.4 0.2 1.7 0.4 1.0
8 0.5 0.0 0.2 0.5 1.6 1.0
9 0.7 0.5 0.6 1.0 0.7 0.8
10 0.2 1.7 1.0 1.5 1.7 1.6
11 0.9 0.3 0.6 0.8 3.8 2.3
12 4.1 3.1 3.6 2.8 5.8 4.2
13 3.3 3.5 3.4 5.8 9.5 7.6
14 7.4 10.7 8.9 10.5 14.4 12.4
Total 2.1 2.4 2.2 3.0 4.6 3.8
TABLE 5. - PERCENTAGE OF CHILDREN ATTENDING SCHOOL AND NOT ECONOMICALLY ACTIVE
Age MICS MECOVI
Male Female Total Male Female Total
7 79.0 82.0 80.5 85.4 86.6 86.0
8 76.5 81.6 79.1 83.7 86.2 85.0
9 74.2 76.6 75.4 78.7 87.7 83.0
10 71.3 73.6 72.5 81.3 83.6 82.4
11 67.1 78.3 72.1 77.3 79.2 78.3
12 62.2 63.6 63.0 71.4 69.3 70.4
13 59.6 63.8 61.7 72.1 67.1 69.7
14 56.5 60.4 58.3 65.2 60.9 63.1
Total 68.6 72.7 70.7 77.0 77.8 77.4
23 UCW WORKING PAPER SERIES, JANUARY 2004
TABLE 6. - PERCENTAGE OF CHILDREN BOTH ECONOMICALLY ACTIVE AND ATTENDING SCHOOL
Age MICS MECOVI
Male Female Total Male Female Total
7 20.1 17.6 18.9 11.2 8.4 9.8
8 22.2 17.9 20.0 11.4 10.8 11.1
9 24.6 22.5 23.6 18.1 11.1 14.7
10 28.5 23.9 26.1 15.8 12.1 14.1
11 31.2 20.2 26.3 17.0 14.7 15.9
12 32.9 28.5 30.5 22.1 18.2 20.2
13 33.6 26.8 30.2 20.8 16.2 18.6
14 32.8 24.4 28.9 22.7 15.9 19.3
Total 28.0 22.7 25.3 17.4 13.4 15.4
TABLE 7. - PERCENTAGE OF CHILDREN NEITHER ECONOMICALLY ACTIVE NOR ATTENDING SCHOOL
TABLE 8. - PERCENTAGE OF CHILDREN CARRYING OUT HOUSEHOLD CHORES
MICS MECOVI
Age Male Female Total Male Female Total
7 76.8 81.0 78.9
8 78.4 85.4 82.0
9 86.4 92.0 89.1
10 86.5 87.7 87.1
11 89.7 92.0 90.7
12 89.7 91.4 90.6
13 80.9 93.3 87.2
14 82.3 93.2 87.4
Total 83.6 89.1 86.4
TABLE 9. - PERCENTAGE OF CHILDREN CARRYING OUT HOUSEHOLD CHORES FOR MORE THEN 28 HOURS PER
WEEK
age MICS MECOVI
Male Female Total Male Female Total
7 0.5 2.0 1.3
8 1.5 2.7 2.1
9 1.8 5.4 3.6
10 3.7 4.7 4.2
11 4.4 5.3 4.8
12 3.5 10.2 7.2
13 5.8 9.2 7.5
14 5.1 13.7 9.1
Total 3.2 6.4 4.8
24 CHILD LABOUR IN BOLIVIA: A COMPARISON OF ESTIMATES FROM
MECOVI AND MICS SURVEY INSTRUMENTS
TABLE 10. - DISTRIBUTION OF CHILDREN AGED 7-14 YEARS, BY SEX AND ACTIVITY
MICS MECOVI
Male Female Total Male Female Total
Working, not attending school
2.1 2.4 2.2 3.00 4.61 3.79
Attending school, not working
68.7 72.7 70.7 76.98 77.80 77.38
Working and attending school
28.0 22.7 25.4 17.40 13.38 15.43
Not working, not attending school
1.3 2.2 1.7 2.61 4.21 3.40
Total 100 100 100 100 100 100
Note: ‘Working’ refers to economic activity
TABLE 11. - CHILDREN ECONOMICALLY ACTIVE AND NOT ATTENDING SCHOOL: WEEKLY HOURS WORKED, BY SEX
AND AGE MICS MECOVI
Age Male Female Total Male Female Total
7 14.0 14.0 18.6 30.4 20.7
8 11.3 11.3 34.7 48.2 45.3
9 11.6 8.0 10.2 42.1 41.1 41.7
10 3.0 26.4 23.8 52.4 48.5 50.4
11 21.0 9.0 18.3 30.9 41.2 39.4
12 28.9 29.2 29.1 38 55.4 49.5
13 19.6 29.5 24.7 41.3 37.4 38.9
14 19.2 28.8 24.6 46.6 46.2 46.3
Total 20.8 27.7 24.5 42 44.9 43.7
TABLE 12. - CHILDREN ECONOMICALLY ACTIVE AND ATTENDING SCHOOL: WEEKLY HOURS WORKED, BY SEX AND
AGE MICS MECOVI
Age Male Female Total Male Female Total
7 12.8 7.1 10.1 21.1 18.1 19.8
8 12.0 9.6 10.9 21.1 19.3 20.2
9 10.2 11.7 10.9 18.6 25.4 21.1
10 12.5 11.6 12.1 21.9 19.3 20.9
11 13.9 11.3 13.0 21.5 17.8 19.8
12 14.0 14.5 14.3 25.7 18.3 22.5
13 15.3 11.5 13.7 30 28.8 29.5
14 14.6 21.5 17.3 28.4 29.7 28.9
Total 13.3 12.5 13.0 24.1 22.3 23.3
25 UCW WORKING PAPER SERIES, JANUARY 2004
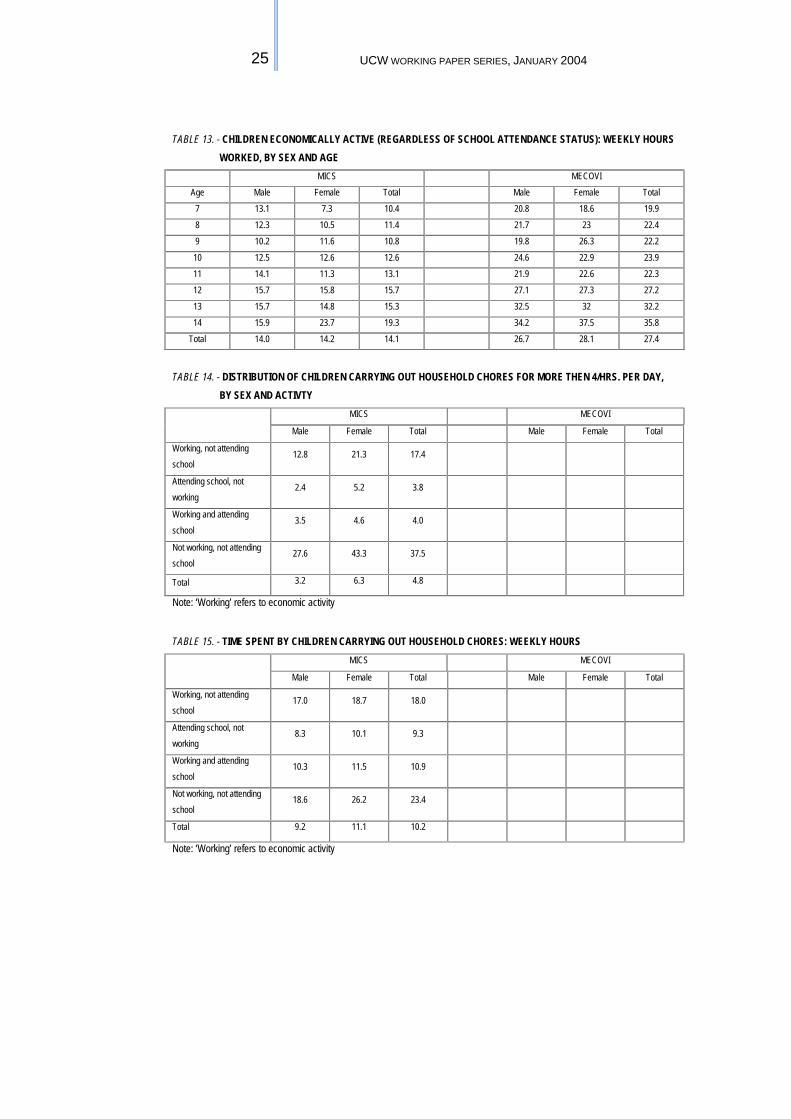
TABLE 13. - CHILDREN ECONOMICALLY ACTIVE (REGARDLESS OF SCHOOL ATTENDANCE STATUS): WEEKLY HOURS
WORKED, BY SEX AND AGE MICS MECOVI
Age Male Female Total Male Female Total
7 13.1 7.3 10.4 20.8 18.6 19.9
8 12.3 10.5 11.4 21.7 23 22.4
9 10.2 11.6 10.8 19.8 26.3 22.2
10 12.5 12.6 12.6 24.6 22.9 23.9
11 14.1 11.3 13.1 21.9 22.6 22.3
12 15.7 15.8 15.7 27.1 27.3 27.2
13 15.7 14.8 15.3 32.5 32 32.2
14 15.9 23.7 19.3 34.2 37.5 35.8
Total 14.0 14.2 14.1 26.7 28.1 27.4
TABLE 14. - DISTRIBUTION OF CHILDREN CARRYING OUT HOUSEHOLD CHORES FOR MORE THEN 4/HRS. PER DAY,
BY SEX AND ACTIVTY
MICS MECOVI
Male Female Total Male Female Total
Working, not attending school
12.8 21.3 17.4
Attending school, not working
2.4 5.2 3.8
Working and attending school
3.5 4.6 4.0
Not working, not attending school
27.6 43.3 37.5
Total 3.2 6.3 4.8
Note: ‘Working’ refers to economic activity
TABLE 15. - TIME SPENT BY CHILDREN CARRYING OUT HOUSEHOLD CHORES: WEEKLY HOURS
MICS MECOVI
Male Female Total Male Female Total
Working, not attending school
17.0 18.7 18.0
Attending school, not working
8.3 10.1 9.3
Working and attending school
10.3 11.5 10.9
Not working, not attending school
18.6 26.2 23.4
Total 9.2 11.1 10.2
Note: ‘Working’ refers to economic activity
26 CHILD LABOUR IN BOLIVIA: A COMPARISON OF ESTIMATES FROM
MECOVI AND MICS SURVEY INSTRUMENTS
TABLE 16. - DISTRIBUTION OF CHILDREN AGED 7-14 BY AREA, SEX AND ACTIVITY MICS MECOVI
Male Female Total Male Female Total
urban
Working, not attending school
0.7 0.4 0.6 1.0 0.9 0.9
Attending school, not working
86.7 89.0 87.9 89.8 88.5 89.1
Working and attending school
12.1 9.6 10.8 6.2 5.9 6.1
Not working, not attending school
0.5 1.0 0.7 3.0 4.7 3.8
rural
Working, not attending school
4.0 5.2 4.6 6.1 10.2 8.1
Attending school, not working
42.0 49.2 45.6 57.5 61.5 59.5
Working and attending school
51.5 41.7 46.6 34.4 24.8 29.7
Not working, not attending school
2.5 4.0 3.2 2.0 3.5 2.7
Total
Working, not attending school
2.1 2.4 2.2 3.0 4.6 3.8
Attending school, not working
68.6 72.7 70.7 77.0 77.8 77.4
Working and attending school
28.0 22.7 25.3 17.4 13.4 15.4
Not working, not attending school
1.3 2.2 1.7 2.6 4.2 3.4
Note: ‘Working’ refers to economic activity
27 UCW WORKING PAPER SERIES, JANUARY 2004
TABLE 17. - DISTRIBUTION OF CHILDREN BY HOUSEHOLD INCOME LEVEL, ACTIVITY STATUS AND SEX
MICS (Weath index) MECOVI (Expenditure quintiles)
1 2 3 4 5 1 2 3 4 5
Male
Working, not attending school
0.0 0.0 2.9 2.5 4.0 7.2 4.2 3.5 0.4 0.1
Attending school, not working
2.1 88.2 88.2 73.7 54.8 3.0 52.8 73.7 82.1 85.6
Working and attending school
44.1 68.6 11.8 11.7 22.7 89.4 77.0 39.1 19.1 11.7
Not working, not attending school
39.5 49.7 28.0 0.0 0.1 10.0 8.3 17.4 0.9 3.0
Female
Working, not attending school
0.7 3.2 2.2 1.3 0.4 2.7 3.9 2.3 2.6 14.4
Attending school, not working
0.0 2.0 3.3 5.8 2.4 3.9 1.5 1.7 2.8 4.6
Working and attending school
88.1 89.9 78.7 61.6 48.3 54.6 76.1 87.0 81.6 87.6
Not working, not attending school
72.7 11.2 9.0 17.6 31.2 77.8 27.7 15.3 10.0 8.3
Total
Working, not attending school
42.1 22.7 0.3 1.0 1.6 7.7 13.4 3.3 4.7 1.4
Attending school, not working
3.9 3.9 2.2 0.2 0.0 8.3 1.8 4.2 10.5 4.1
Working and attending school
2.5 2.9 4.9 2.2 88.2 2.6 1.1 1.4 3.8 53.6
Not working, not attending school
89.1 76.1 58.4 46.1 70.7 74.9 84.4 83.6 88.5 77.4
Note: ‘Working’ refers to economic activity
28 CHILD LABOUR IN BOLIVIA: A COMPARISON OF ESTIMATES FROM
MECOVI AND MICS SURVEY INSTRUMENTS
TABLE 18. - DISTRIBUTION OF CHILDREN BY MOTHERS’ EDUCATION LEVEL, AREA, SEX AND ACTIVITY STATUS
MICS MECOVI
None Primary Secondary+ None Primary Secondary+
urban
Working, not attending school
1.1 0.9 0.0 1.4 0.9 0
Attending school, not working
82.8 85.4 91.3 82.7 88.7 95.6
Working and attending school
14.6 12.8 8.2 11.5 6.5 0.9
Not working, not attending school
1.4 0.9 0.5 4.4 4 3.4
rural
Working, not attending school
5.5 4.4 1.3 13.4 5 0
Attending school, not working
44.3 44.6 66.7 49.4 64 100
Working and attending school
46.6 48.0 27.5 34.2 28.7 0
Not working, not attending school
3.5 3.0 4.5 3 2.3 0
Total
Working, not attending school
4.5 2.6 0.1 10.1 2.3 0
Attending school, not working
53.4 66.0 89.7 58.4 80.2 95.9
Working and attending school
39.1 29.6 9.5 28 14.1 0.9
Not working, not attending school
3.0 1.9 0.8 3.4 3.4 3.2
Note: ‘Working’ refers to economic activity
29 UCW WORKING PAPER SERIES, JANUARY 2004
TABLE 19. - DISTRIBUTION OF CHILDREN BY HOUSEHOLD WATER ACCESS(1), AREA, SEX AND ACTIVITY STATUS
MICS MECOVI
Access No access Total Access No access Total
Urban
Working(2), not attending school
0.4 1.5 0.6 1.0 0.9 0.9
Attending school, not working
88.5 82.6 87.9 88.8 91.6 89.1
Working and attending school
10.4 14.2 10.8 6.3 4.3 6.1
Not working, not attending school
0.6 1.7 0.7 3.9 3.3 3.8
Rural
Working, not attending school
4.2 5.1 4.6 6.0 9.4 8.1
Attending school, not working
51.9 38.4 45.6 66.2 55.4 59.5
Working and attending school
41.9 52.0 46.6 25.8 32.1 29.7
Not working, not attending school
2.1 4.5 3.2 2.1 3.1 2.7
Total
Working, not attending school
1.5 4.2 2.2 2.1 7.6 3.8
Attending school, not working
77.8 49.9 70.7 83.8 63.2 77.4
Working and attending school
19.6 42.1 25.3 10.6 26.0 15.4
Not working, not attending school
1.0 3.8 1.7 3.5 3.2 3.4
Notes: (1) ‘Water access’ is defined as households with water either pumped into home or into yard/plot. (2) ‘Working’ refers to economic activity TABLE 20. - DISTRIBUTION OF ECONOMICALLY ACTIVE CHILDREN BY WORK MODALITY
MICS MECOVI
Paid Unpaid Family worker
Wage Self
employed Family worker
Urban Male 33.8 2.1 64.1 44.2 11.4 44.4
Female 16.4 2.5 81.1 11.7 10.9 77.4
Total 26.2 2.2 71.5 28.7 11.2 60.1
Rural Male 7.4 1.8 90.8 1.4 0.9 97.8
Female 3.5 0.4 96.1 0.5 0.5 99.0
Total 5.6 1.2 93.2 1.0 0.7 98.3
Total Male 14.1 1.9 84.0 10.5 3.1 86.4
Female 6.5 0.9 92.5 3.1 2.9 94.0
Total 10.6 1.4 87.9 7.1 3.0 89.9
30 CHILD LABOUR IN BOLIVIA: A COMPARISON OF ESTIMATES FROM
MECOVI AND MICS SURVEY INSTRUMENTS
TABLE 21. - DISTRIBUTION OF HOUSEHOLDS BY TYPE OF WATER CONNECTION MICS MECOVI
Urban Rural Total Urban Rural Total
Piped into dwelling 44.49 11.3 33.22 Public network 90.01 35.59 70.17
Piped into yard or plot 46.58 40.75 44.6 Public basin 2.83 7.7 4.6
Public tap 1.37 6.96 3.27 Water tank 2.1 0.12 1.38
Tubewell, borehole with pump 0.67 5.29 2.24 Well with pump 1.3 3.91 2.25
Protected dug well 1.49 5.65 2.91 Well without pump 1.99 16.94 7.44
Protected spring 0.05 0.62 0.25 River 0.45 32.54 12.15
Unprotected dug well 0.78 7.45 3.04 Lake 0 1.14 0.42
Unprotected spring 0.06 3.55 1.24 Other 1.32 2.06 1.59
Pond, river or stream 0.05 10.67 3.66
Tanker-truck, vendor 1.76 0.13 1.21
Other 2.69 7.63 4.37
Total 100 100 100 Total 100 100 100
TABLE 22. - RATE OF REPORTED INJURY/ILLNESS, BY SEX AND ACTIVITY STATUS
MICS MECOVI
Male Female Total Male Female total
Working(2), not attending school 20.1 8.7 13.3
Attending school, not working 9.5 10.4 10.0
Working and attending school 15.3 20.1 17.4
Not working, not attending school 22.1 9.8 14.6
Notes: ‘Working’ refers to economic activity
TABLE 23. - DISTRIBUTION OF ECONOMICALLY-ACTIVE CHILDREN BY MODALITY OF EMPLOYMENT AND SEX MICS MECOVI
Male Female Total Male Female Total
Paid 14.07 6.55 10.64 Wage employ 10.5 3.1 7.1
Unpaid 1.89 0.91 1.45 Self Employ 3.1 2.9 3.0
Family 84.04 92.54 87.92 Family employ 86.4 94.0 89.9