Full Terms & Conditions of access and use can be found at https://www.tandfonline.com/action/journalInformation?journalCode=vjxe20 The Journal of Experimental Education ISSN: 0022-0973 (Print) 1940-0683 (Online) Journal homepage: https://www.tandfonline.com/loi/vjxe20 Children’s and Adults’ Math Attitudes Are Differentiated by Number Type Pooja G. Sidney, Clarissa A. Thompson, Charles Fitzsimmons & Jennifer M. Taber To cite this article: Pooja G. Sidney, Clarissa A. Thompson, Charles Fitzsimmons & Jennifer M. Taber (2019): Children’s and Adults’ Math Attitudes Are Differentiated by Number Type, The Journal of Experimental Education, DOI: 10.1080/00220973.2019.1653815 To link to this article: https://doi.org/10.1080/00220973.2019.1653815 View supplementary material Published online: 12 Sep 2019. Submit your article to this journal Article views: 9 View related articles View Crossmark data
Transcript
Full Terms & Conditions of access and use can be found athttps://www.tandfonline.com/action/journalInformation?journalCode=vjxe20
Children’s and Adults’ Math Attitudes AreDifferentiated by Number Type
Pooja G. Sidney, Clarissa A. Thompson, Charles Fitzsimmons & Jennifer M.Taber
To cite this article: Pooja G. Sidney, Clarissa A. Thompson, Charles Fitzsimmons & JenniferM. Taber (2019): Children’s and Adults’ Math Attitudes Are Differentiated by Number Type, TheJournal of Experimental Education, DOI: 10.1080/00220973.2019.1653815
To link to this article: https://doi.org/10.1080/00220973.2019.1653815
Children’s and Adults’ Math Attitudes Are Differentiatedby Number Type
Pooja G. Sidneya� , Clarissa A. Thompsonb� , Charles Fitzsimmonsb, andJennifer M. Taberb
aUniversity of Kentucky, Lexington, KY, USA; bKent State University, Kent, OH, USA
ABSTRACTPeople’s attitudes toward mathematics are multifaceted. Across four stud-ies, we found that children and adults have different attitudes about math-ematics when asked specifically about whole numbers, as opposed tofractions. The vast majority of children and adults reported negative atti-tudes toward fractions despite having positive attitudes toward wholenumbers. Across both children and adults, the difference in fraction andwhole-number attitudes was present across levels of math achievement,indicating that it was not just participants who were worse at math whoseattitudes differed by number type. These findings may have importantimplications for how children and adults engage with numerical informa-tion when presented as fractions.
KEYWORDSAttitudes; fractions;individual differences;integrated theory of wholenumber and fractionsdevelopment; mathematicsattitudes; mathematicseducation; wholenumber bias
PEOPLE ENCOUNTER FRACTIONS in many everyday contexts. Reasoning with fractions andother ratios underlies common tasks including measuring and scaling (e.g., when calculating adiscount, measuring a length, or following a recipe) and is often necessary for complex decisionmaking (e.g., evaluating health-risk information at the doctor’s office or comparing interest ratesat the bank). Furthermore, fractions are an essential facet of the development of mathematicalskills. Fraction proficiency uniquely predicts concurrent academic achievement in the sixth andeighth grades (Torbeyns, Schneider, Xin, & Siegler, 2015), students’ readiness to learn Algebra I(the “gatekeeper” to higher mathematics; Booth & Newton, 2012), and high school mathematicsachievement (over and above early whole number skills and general cognitive ability, Siegleret al., 2012). Despite their importance, fractions are difficult for children to master (e.g., Siegler,Fazio, Bailey, & Zhou, 2013), and these difficulties can persist into adulthood (e.g., Fazio,DeWolf, & Siegler, 2016; Opfer & DeVries, 2008).
Given the importance of fractions in everyday life and mathematics development, a great dealof research has focused on the cognitive-developmental aspects of fraction understanding (e.g.,Fazio, Kennedy, & Siegler, 2016; Fuchs, Malone, Schumacher, Namkung, & Wang, 2016; Hamdan& Gunderson, 2017; Siegler et al., 2013; Torbeyns et al., 2015) and adults’ competency with ratiosin probability tasks (e.g., Cuite, Weinstein, Emmons, & Colditz, 2008; Lipkus, 2007; Sinayev,Peters, Tusler, & Fraenkel, 2015; Waters, Fagerlin, & Zikmund-Fisher, 2016). However, students’attitudes toward mathematics in general are tightly linked to their mathematics achievement(Denissen, Zarrett, & Eccles, 2007; Ma & Kishor, 1997; Singh, Granville, & Dika, 2002), yet little
CONTACT Pooja G. Sidney [email protected] Department of Psychology, University of Kentucky, 012E Kastle Hall,Lexington, KY 40506.�These authors contributed equally to this work and share the first author position.
Supplemental data for this article is available online at https://doi.org/10.1080/00220973.2019.1653815.
� 2019 Taylor & Francis Group, LLC
THE JOURNAL OF EXPERIMENTAL EDUCATIONhttps://doi.org/10.1080/00220973.2019.1653815
is known about students’ attitudes toward fractions, specifically. Furthermore, adults need bothsufficient competence and motivation to use given numeric information to make complex deci-sions in everyday contexts (e.g., Etchegary & Perrier, 2007; see also Petty & Bri~nol, 2014).
In the current studies, we examined the relationships between the attitudes of children andadult toward mathematics in general, their specific attitudes toward highly familiar and well-prac-ticed numbers (i.e., whole numbers, Alibali & Sidney, 2015), and their specific attitudes towardfractions. People’s specific attitudes toward fractions may predict when and how they engage infraction learning and reasoning in the classroom and in everyday contexts. We sought, as a firststep toward understanding the role of fraction attitudes in fraction learning and reasoning, toexamine whether children’s and adults’ attitudes toward fractions diverged from their attitudestoward mathematics in general and mathematics with whole numbers. Second, we examinedwhether there was variability in the extent to which children’s and adults’ attitudes concerningfractions diverged from their attitudes toward other facets of mathematics. Finally, we examinedthe relationships between children’s and adults’ specific attitudes and other math-related individ-ual differences.
Math attitudes, learning, and proficiency
Researchers have long been interested in measuring students’ attitudes toward mathematics withthe goal of better understanding the role of attitudes in children’s mathematics learning (e.g.,Alken, 1974; Fennema & Sherman, 1976; Neale, 1969). To date, most studies examining children’sand adults’ attitudes toward mathematics focus on attitudes toward mathematics in general—forexample, “How much do you like doing math?” “How important is it to you to get good gradesin math?” (Cooper, Sidney, & Alibali, 2018; Eccles & Wigfield, 1995). This body of work hasdemonstrated that holding more-positive attitudes toward mathematics in general is related tohigher general mathematics achievement among children (e.g., Ma & Kishor, 1997; Singh et al.,2002) and improved learning and problem-solving among adults (e.g., Cooper et al., 2018;Hattikudur, Sidney, & Alibali, 2016). Students with more-positive attitudes toward a learningdomain, or a specific topic, are more interested in new learning (Ainley & Ainley, 2011); take bet-ter advantage of cognitive supports during learning and problem-solving (Cooper et al., 2018;Hattikudur et al., 2016); and persist in the face of difficulty (Ainley, Hidi, & Berndorff, 2002;Pajares & Graham, 1999).
Little research has directly examined how people’s attitudes toward mathematics in general arerelated to their attitudes about specific facets of mathematics, such as attitudes toward fractionsor whole numbers. Attitudes more strongly predict specific behaviors when they are measuredwith a comparable level of specificity (e.g., Ajzen & Fishbein, 2005; Davidson & Jaccard, 1979;Pajares, 1996; Weigel, Vernon, & Tognacci, 1974). For example, students’ beliefs about solvingmathematical problems are a better predictor of their actual problem-solving success than beliefsabout other mathematical activities (Pajares, 1996). Similarly, the first aim of the current researchwas to assess whether children’s and adults’ attitudes toward mathematics differed by numbertype (whole numbers versus fractions versus percentages). If this were the case, then measuringmathematics attitudes with greater specificity may better elucidate the relationships betweenchildren’s and adults’ attitudes about critically important facets of numerical cognition, such asfractions, and their developing proficiency in those domains.
Prior research does suggest that attitudes about academics are multifaceted. In this briefreview, we have considered “attitudes” in a general sense, however, academic attitudes includemultiple distinct motivational constructs that predict student behavior in unique ways. In workingto understand how students’ attitudes toward and beliefs about mathematics affect learning andmotivation, several researchers examined the factor structures of broad measures of mathematicsattitudes (Cooper et al., 2018; Eccles, Wigfield, Harold, & Blumenfeld, 1993) and found that these
2 P. G. SIDNEY ET AL.
broad measures do indeed include multiple distinct motivational constructs. Attitudes towardmathematics include people’s preferences and interest (Ainley et al., 2002), as well as self-perceived abilities, expectations of success, and their values (Wigfield & Eccles, 2000). These con-structs have different developmental patterns (Eccles et al., 1993) and have separable effects onmathematics problem solving (Cooper et al., 2018). For example, Cooper and colleagues arguethat interest and value beliefs may affect trigonometry problem solving through distinct, thoughoverlapping, mechanisms. A full theoretical account of how students’ attitudes toward mathemat-ics affects mathematics achievement must attend to these distinct constructs and their individ-ual mechanisms.
However, although these motivational constructs are theoretically and empirically distinct, wedid not seek to predict behavior from attitudes in the current study. In this first foray into therelations between general and specific attitudes about math, we had no specific hypothesis abouthow general and specific attitudes may vary by motivational construct (i.e., interest, perceivedability, and value). To adequately represent the overarching construct of attitudes, we includedquestions tapping all three distinct constructs in our measure of mathematics attitudes to capturethese multiple components of attitudes when examining the relationships between attitudes aboutmathematics in general and attitudes toward specific facets of mathematics.
Integration of knowledge and attitudes about fractions and whole numbers
Here, we focus primarily on specific attitudes toward two facets of mathematical knowledge:math with fractions and math with whole numbers. The primary reason for focusing on child-ren’s and adults’ attitudes toward fractions concerns their importance in the development ofmathematical skills and in understanding ratios in everyday contexts, as described above.Furthermore, we suggest that examining the extent to which people’s attitudes toward fractionsare similar to or differ from their attitudes toward whole numbers may reveal whether fractionand whole-number concepts and beliefs are sufficiently integrated.
One foundational aspect of mathematics development is understanding the fundamental simi-larities between whole-number concepts and fraction concepts (e.g., Fazio, Bailey, Thompson, &Siegler, 2014; Siegler, Thompson, & Schneider, 2011). For instance, according to the integratedtheory of whole number and fractions development (Siegler, 2016; Siegler et al., 2011), one funda-mental achievement in mathematics development is realizing that whole numbers and fractionsrepresent magnitudes that can be placed together on a single number line. However, children’smathematical reasoning reveals two ways in which their whole-number and fraction concepts arepoorly integrated: they often incorrectly rely on their whole-number knowledge in mathematicaltasks (whole-number bias errors, e.g., Ni & Zhou, 2005), and they sometimes incorrectly treatwhole numbers and fractions as distinct categories of numbers (Sidney & Alibali, 2015;Vamvakoussi, Christou, Mertens, & Van Dooren, 2011; Vamvakoussi & Vosniadou, 2010).
Whole-number bias errors are errors in reasoning according to which people overextend theirknowledge of whole numbers in tasks that necessitate knowledge of other types of numbers.These errors are pervasive across the lifespan; both adults and children exhibit whole-numberbias errors in fraction reasoning tasks when they claim that 1/5 is greater 1/3 because 5 is greaterthan 3 (Fazio, DeWolf, et al., 2016; Sidney, Thalluri, Buerke, & Thompson, 2018; Siegler &Thompson, 2014; Siegler et al., 2011); when they add across numerators to choose an answer of19, or add across denominators to choose an answer of 21 for the problem 12/13þ 7/8(Carpenter, Corbitt, Kepner, Lindquist, & Reys, 1980; Lortie-Forgues, Tian, & Siegler, 2015); orwhen they indicate that there is just one fraction, 1/5, that falls between 1/4 and 1/6 (Brown,Donovan, & Alibali, 2016; Van Hoof, Verschaffel, & Van Dooren, 2015). Adolescents also demon-strate overreliance on whole-number knowledge when asked to think generally about mathemat-ics. For example, when eighth grade students were asked to verify arithmetic operation
THE JOURNAL OF EXPERIMENTAL EDUCATION 3
statements containing inequalities (e.g., xþ 4< x; x/4< x), they often used substitution to checkaccuracy, but were much more likely to substitute positive whole numbers and almost neverattempted to substitute zero, rational numbers, or negative numbers into multiplication and div-ision equations (Van Hoof, Vandewalle, Verschaffel, & Van Dooren, 2015; Van Hoof, Verschaffel,et al., 2015).
One potential source of such errors stems from people attempting to think about mathematicsin a general way, wherein their knowledge of natural whole numbers is strongly activated andtheir other mathematical knowledge is not (see Alibali & Sidney, 2015, for a related discussion).There is preliminary evidence that some children may view whole numbers and fractions as beingfundamentally dissimilar or even belonging to two different categories of number, perhaps signal-ing poorly integrated knowledge. For example, when asked to order a set of numbers, manyyoung children separate natural numbers and fractions into two separate groups rather thanordering numbers by their magnitude (Hartnett & Gelman, 1998). Similarly, older children oftensort arithmetic problems into two groups according to number type (i.e., containing a fraction ornot) without considering conceptual similarities such as arithmetic operation (Sidney & Alibali,2015). Students’ reasoning about numerical density can also differ by the type of numbers theyare asked to reason about, signaling poorly integrated knowledge (Vamvakoussi et al., 2011)—some students who accurately believed that there is an infinite set of numbers between two wholenumbers still inaccurately believed that there is a finite set of numbers between two fractions. Incontrast, children and adults who consistently avoid demonstrating the whole-number bias andfocus less on differences between whole-number and fraction arithmetic (i.e., in a sorting task;Sidney & Alibali, 2015) may do so because their whole-number and fraction knowledge are betterintegrated, allowing them to both appreciate the key conceptual similarities between fraction andwhole number arithmetic and to treat mathematics with all numbers as a single, interrelatedsystem of mathematics.
Although here we argue that the extent to which people’s attitudes about fractions divergefrom their attitudes toward whole numbers, or math in general, may indicate poorly integratedknowledge, it is important to note that attitudes may reflect more than just knowledge. If peopledo hold very different attitudes toward fractions than to other facets of math, or math in general,this may reflect the underlying structure of their number concepts (i.e., that fractions knowledgeis represented separately from other mathematical knowledge). However, it could also reflectother aspects of people’s mathematical experience, including perceptions of difficulty. Peopleexperience persistent difficulty with fractions, as compared to whole numbers (see Fazio et al.,2014; Thompson & Opfer, 2010; Sidney et al., 2018; and Siegler & Opfer, 2003, for comparativeevidence from number line estimation). For example, it takes people longer to estimate fractionsthan to estimate whole numbers likely because they are employing strategies for fractions thattake time to accurately execute. People may be aware of this fluency difference and interpret frac-tions as being more difficult because responses are less automatic than for whole numbers. Thus,differences in attitudes could be a function of differential difficulty. We investigated this alterna-tive hypothesis by examining whether individual differences in performance on fraction andwhole-number tasks could account for individual differences in the extent to which attitudestoward fractions are different from attitudes toward whole numbers.
Individual differences in students’ attitudes
In addition to examining the relationships between people’s general attitudes toward math andtheir specific attitudes toward fractions and whole numbers, we sought to explore the relation-ships between key individual differences and the nature of people’s attitudes. Here, we focused oneducational achievement and gender. First, the nature of children’s attitudes toward mathematicsdoes change with increased experience in formal schooling across elementary and middle school
4 P. G. SIDNEY ET AL.
(Eccles et al., 1993; Wigfield et al., 1991, 1997). Furthermore, a preliminary cross-sectional study(Sidney & Alibali, 2015) provided suggestive evidence that students’ number concepts (i.e., whole-number and fraction arithmetic concepts) become increasingly integrated with increased educa-tional experience. For example, Sidney and Alibali found that although children in sixth gradewere more likely to differentiate mathematics equations based on number type (i.e., whole-num-ber versus fraction equations), adults were more likely to categorize based on operational struc-ture (e.g., division equations) without differentiating by number type. Similarly, whole-numberbias errors also decrease with educational experience (Braithwaite & Siegler, 2018; Vamvakoussi& Vosniadou, 2010). Although we did not have a strong hypothesis about how educationalexperience may be related to variability in students’ specific attitudes, we expected that attitudesamong people with high levels of education should reflect integrated number concepts.
Furthermore, we sought to explore whether gender would be related to variability in people’sspecific attitudes given that several academically relevant facets of students’ attitudes, beliefs, andmotivation appear to differ by gender. Although girls and boys’ mathematics performance tendsto be similar in early elementary and middle school (Hyde, Fennema, & Lamon, 1990), some fac-ets of children’s attitudes toward mathematics often differ by gender at these same ages (Wigfieldet al., 1997). For example, in their longitudinal examination of children’s mathematics attitudesand beliefs, Wigfield and colleagues (1997) found that boys tend to have more-positive beliefsabout their competence and ability in mathematics than girls, and this difference is stable acrosselementary and early middle school. Gender differences in mathematics performance do emergein high school (Hyde et al., 1990), along with differences in course-taking and career expectationsthat may be shaped, in part, by students’ attitudes (see Halpern et al., 2007). For example,Lauermann, Tsai, and Eccles (2017) demonstrated that boys in high school are more likely toaspire to math- and science-related careers than girls, even after controlling for mathematics abil-ity. Differences in high school course-taking shape later observed differences in women’s andmen’s pursuit of science- and mathematics-related careers (Webb, Lubinski, & Benbow, 2002).Although this prior research reflects a diversity of attitudinal constructs, they all indicate ways inwhich differences between girls’ and boys’ socialization during K–12 education in the UnitedStates may contribute to less positive attitudes toward math, including self-evaluations of abilityand expectancies for success, that in turn affects later performance and attainment. Thus, giventhese early gender differences in general mathematics attitudes, we examined whether genderplays a role in children’s and adults’ specific attitudes as well.
Finally, given that students’ middle school fraction understanding uniquely predicts highschool mathematics achievement above and beyond other facets of children’s mathematics know-ledge (Siegler et al., 2012), gender differences in specific attitudes toward fractions could contrib-ute to later gender differences in mathematics achievement. Although we did not have a stronghypothesis about the role of gender in the relationships between specific attitudes toward frac-tions and whole numbers, we sought to explore the role of gender in specific attitudes given theprior evidence of gender differences in general mathematics attitudes, beliefs, and performance.In doing so, we aimed to contribute to the growing literature that describes gender differencesthat may relate to disparities in socialization between girls and boys.
Current studies
Here, we report four studies investigating people’s specific attitudes toward fractions and wholenumbers. We propose that people’s attitudes toward mathematics may show evidence of poorlyintegrated knowledge; specific attitudes toward fractions may be separable from their attitudestoward whole numbers. To measure differences in attitudes by number type, we created the MathAttitude Questionnaire to assess attitudes toward mathematics in general, whole numbers specif-ically, and fractions specifically. Critically, this measure included multiple motivational constructs
THE JOURNAL OF EXPERIMENTAL EDUCATION 5
that underlie attitudes toward mathematics. In Study 1, we examined attitudes among children inthe fifth and sixth grades. Fraction symbols are introduced as early as third grade, and fractionarithmetic instruction typically begins in fifth grade and continues into sixth grade (see CommonCore State Standards, National Governors Association Center for Best Practices, Council of ChiefState School Officers, 2010). Thus, both fifth- and sixth-graders have experience representing andsolving problems with fractions, but sixth-graders have considerably more experience with frac-tions and related math topics. In Studies 2 and 3, we examined attitudes in a sample of adults inthe community using an online survey. In Study 4, we examined attitudes among college-agedadults using an in-person survey.
First, given the persistent difficulty that people often have with fractions (see Fazio et al., 2014;Sidney et al., 2018; Siegler & Opfer, 2003; Thompson & Opfer, 2010), we hypothesized that child-ren’s and adults’ attitudes toward fractions would be less positive than their attitudes towardwhole numbers (Hypothesis [H] 1). We expected differential attitudes toward whole numbers andfractions to emerge between fifth and sixth grade, as children gain more experience with fractionsduring intensive fraction arithmetic instruction. Second, we explored the relationships betweenchildren’s and adults’ specific attitudes about different number types and their general attitudesabout mathematics. We expected that specific attitudes toward fractions would be related to, butdistinct from, attitudes toward math in general (H2).
Third, across Studies 1 and 2 we explored whether variability in the differences between child-ren’s and adults’ fraction and whole-number attitudes were related to several key individual dif-ferences in mathematics development: mathematics performance or standardized mathematicsachievement, educational attainment or grade level, and gender (H3). These analyses were strictlyexploratory, as we had no strong a priori hypotheses; we examined whether individual differencesin factors related to mathematics attitudes could also elucidate who may be more likely to havenegative attitudes toward fractions than to have negative attitudes toward whole numbers.
Finally, in Studies 3 and 4, we aimed to replicate our findings for H1 in two new adult sam-ples. In Study 3, we used a revised Math Attitude Questionnaire to better capture the full rangeof attitudes toward fractions and whole numbers and extend our findings to a new, related num-ber type: percentages. In Study 4, we aimed to replicate our findings for H1 when specific atti-tudes were assessed between, rather than within, subjects.
Study 1
Method
All study procedures were reviewed and approved by the Kent State University institutionalreview board under Protocol #14-471 entitled “Understanding of Rational Numbers.”
ParticipantsParticipants were 119 children (45% girls, M age ¼ 11.4 years, SD¼ 1.1 years, 75% non-HispanicWhite, 4% Hispanic, 1% Black or African-American, 1% East or Southeast Asian, 5% of mixedracial descent, and 18% not reported by parent). Children were recruited from both the sixthgrade (who completed the study in the Fall 2017; n¼ 51) and the fifth grade (who completed thestudy in late Spring 2018; n¼ 68) from one public intermediate school in [blinded] to assess chil-dren at different points during fraction arithmetic instruction. Children in fifth grade participatedafter fraction addition and subtraction with unlike denominators had been introduced in theircurrent math classroom but before they completed formal classroom lessons on fraction division.Thus, the sixth-graders had more experience with fraction arithmetic instruction than fifthgraders. Approximately 20% of children at this school qualified for the free and reduced-pricelunch program.
6 P. G. SIDNEY ET AL.
Written parental consent and child assent was obtained for each child prior to participation.Children were recruited as part of a larger study on children’s use of diagrams and completed anassessment of their specific math attitudes at the end of an approximately 40-minute individualsession including another mathematics task involving drawing diagrams to represent fractionproblems. Each participating child received a $10 gift card at the conclusion of the larger study.The sample size was driven by the between-subjects experimental design of the larger study.
Tasks and procedureWe designed the Math Attitude Questionnaire (MAQ) to include three sections with five ques-tions in each (15 items total). The sections, pertaining to self-perceived ability, preference, and per-ceived frequency of use, were designed to reflect the multifaceted nature of attitudes towardmathematics (e.g., Cooper et al., 2018; Eccles & Wigfield, 1995), and each included questionsabout mathematics in general, whole numbers specifically, and fractions specifically (seeAppendix A). Each section began with one question about mathematics in general, then theremaining four questions alternated between whole number and fraction questions. Thus, two ofthe remaining four questions within each section asked specifically about whole numbers (e.g.,How good are you at thinking about how big whole numbers [numbers like 34 or 57] are?) andtwo about fractions (e.g., How good are you at thinking about how big fractions [numbers like 3/4 or 5/7] are?). Examples were consistent across questions to control for familiarity of digits (i.e.,3, 4, 5, and 7). For each question, responses were on a four-point scale with higher scores indicat-ing more-favorable attitudes. We calculated children’s attitudes toward mathematics in general asan average of their responses to the three general questions on the MAQ (MAQ-General: ItemsG1–G3, Cronbach’s A ¼ .74). Next, we calculated children’s overall attitudes toward fractions asan average of their responses to the six fraction questions (MAQ-Fraction: Items F1–F6,Cronbach’s A ¼ .82). Finally, we calculated children’s attitudes toward whole numbers as an aver-age of their responses to the six whole-number questions (MAQ-Whole Number: Items W1–W6,Cronbach’s A ¼ .74).
Children’s grade, age, gender, and race/ethnicity were reported by parents at time of consent.We obtained standardized mathematics achievement data from the previous year’s end-of-yearassessment for 109 participants; missing data was primarily from children who had not completeda standardized assessment since transferring into the district.
Results and discussion
Differences in specific attitudes (H1)Overall, children’s attitudes toward mathematics were somewhat positive, M¼ 3.08, with more-positive attitudes toward whole numbers, M¼ 3.19, than fractions, M¼ 2.66 (see Table 1). Asexpected, the majority of children (92/119) reported less positive attitudes toward fractions thanwhole numbers (see Table 2). The remaining children reported either equivalent attitudes (4/119)or more-positive attitudes toward fractions (23/119). Interestingly, most of the children who
Table 1. Study 1 descriptive statistics and correlations.
Note. Correlation coefficients (in boldface) are significant at p < .05. MAQ scores can range from 1 to 4.
THE JOURNAL OF EXPERIMENTAL EDUCATION 7
reported more-positive attitudes toward fractions were fifth-graders (19/23), potentially becausethey had not yet been introduced to the most difficult aspect of fraction arithmetic, fraction div-ision (Siegler et al., 2011). A dependent samples t test on children’s fraction and whole-numberattitude scores revealed that their attitudes toward fractions were significantly less favorable thantheir attitudes toward whole numbers, MDiff ¼ �0.53, SE ¼ .06, t(118) ¼ �9.18, p < .001, d ¼�0.89 (Borenstein, 2009; Lenhard & Lenhard, 2016). Since the MAQ includes questions spanningmultiple distinct constructs (self-perceived ability, preference, and perceived frequency of use), wealso examined the differences in specific attitudes within each construct. The magnitude of thisdifference was similar within each section (consisting of two items each), ps < .01, demonstratingthat children believe they are less competent with fractions (MDiff ¼ �0.49), like fractions less(MDiff ¼ �0.53), and believe that fractions are less useful (MDiff ¼ �0.54) than whole numbers.Given the similarities in attitude differences across specific attitude constructs, we do not reportfindings separately by specific construct in subsequent sections within Study 1.
Relationships with general attitudes (H2)We also examined the relationships between children’s general attitudes toward mathematics—their average responses to the four general questions on the math attitude questionnaire (MAQ-General)—and their specific attitudes toward whole numbers and fractions. Children’s fractionattitudes, r¼ 0.59, and whole number attitudes, r¼ 0.58, were correlated with general attitudestoward mathematics, ps < .001, and each other, r¼ 0.45. The correlations between specific atti-tudes and general attitudes did not differ by number type, z ¼ �.29, p ¼ .83, r-to-z for depend-ent correlation coefficients (Lee & Preacher, 2013; Steiger, 1980). Furthermore, in a regressionmodel predicting children’s general attitudes (MAQ-General) from fraction attitudes (MAQ-Fraction) and whole-number attitudes (MAQ-Whole Number), together, the predictors accountedfor about half of the variance in general attitudes, total R2 ¼ 47%. Additionally, each predictoraccounted for unique variance in attitudes, ps < .001; whole number attitudes uniquely predictedabout 12% of variance in general attitudes, b¼ 0.45, DR2 ¼ 12%, and fraction attitudes uniquelypredicted about 14% of variance in general attitudes, b¼ 0.39, DR2 ¼ 14%. Taken together, thesefindings suggest that while children’s attitudes toward fractions and whole numbers are related totheir attitudes about math in general, neither children’s fraction attitudes nor their whole-numberattitudes were close to perfectly correlated with their general attitudes, and together fraction andwhole-number attitudes predicted less than half of the variability in general attitudes. SeeAppendix B for all regression results for all studies.
Individual differences (H3)Finally, we examined whether children’s different attitudes toward fractions and whole numberswere related to standardized math achievement, level of current education (i.e., grade), and gen-der. We conceptualized the difference between children’s attitudes toward fractions and wholenumbers as a within-subject effect of number type (fractions versus whole numbers) on children’sattitude reports and, thus, sought to examine whether achievement, grade, or gender moderatedthis within-subject effect of number type on attitude reporting. In other words, we examined, forexample, whether the effect of number type on attitude reporting on the MAQ was greater among
Table 2. Distribution of relative attitudes among children and adults.
Prefers fractions Equal attitudes Prefers whole numbers Total N
children in the fifth or in the sixth grade (effect of grade on the number-type effect). To examinethese interactions, we followed a statistical approach described by Judd, McClelland, and Ryan(2009) for examining interactions between a two-level–within-subject variable (number type: frac-tions versus whole numbers) and between-subjects predictors within a regression framework. AsJudd and colleagues demonstrate, the overall effect of a two-level–within-subject variable on acontinuous dependent variable can be modeled by regression of a difference score variable, com-prising the scores from one level subtracted from the scores from the other level, on the depend-ent variable. The statistical test of the intercept in such a regression model is equivalent to theeffect of the within-subject variable on the dependent variable. When a between-subjects predictoris added to the regression model, the regression coefficient can be interpreted as the effect of thebetween-subjects predictor on the effect of the within-subject variable; in other words, the test ofthis coefficient is equivalent to testing whether the between-subjects variable moderates thewithin-subject variable (see Judd et al., 2009, Chapters 11 and 12). Note that we did not includethe distinct attitudinal constructs (self-perceived ability, preference, and perceived frequency ofuse) as a second within-subject variable, because patterns in specific attitudes were similar acrossconstructs and we did not aim to examine whether the effects of number type are moderated byattitude construct.
In line with the procedure described by Judd et al. (2009), we examined whether children’s dif-ferent attitudes were related to individual differences by regressing difference scores ((MAQ-Whole Numbers) � (MAQ-Fractions)) on our predictors: achievement, grade, and gender.Greater difference scores reflect more-positive attitudes toward whole numbers relative to atti-tudes toward fractions. To further explore differences and similarities across the relationshipsbetween each predictor and MAQ-Whole Numbers and MAQ-Fractions, we ran two additionalmodels regressing MAQ-Whole Numbers and MAQ-Fractions on all predictors. Note that thisanalysis is equivalent to testing the simple effects of each predictor on attitudes for each type ofnumber (Judd et al., 2009). Grade was dummy coded, with fifth grade as the reference category;gender was coded, with girls as the reference category. The math achievement variable wasrescaled for interpretation such that M¼ 0, SD¼ 1. Missing achievement data was handled withcasewise deletion from the analysis. For each analysis, we report unstandardized regressioncoefficients.
Math achievementChildren’s overall math achievement did not predict different attitudes, b ¼ �.05, SE¼ 0.06,t(104) ¼ �0.78, p ¼ .44, DR2 ¼ 1%, controlling for grade and gender. Math achievement wasrelated to both fraction attitudes, p < .01, DR2 ¼ 13%, and whole number attitudes, p < .01,DR2 ¼ 14%, such that students with higher levels of math achievement also held more-positiveattitudes. However, differences in fraction and whole-number attitudes were present across levelsof math achievement. Students with relatively low achievement in math were just as likely tohave different attitudes by number type as students with relatively high achievement in math.
GenderChildren’s gender also did not predict different attitudes, b¼ 0.03, SE¼ 0.12, t(104) ¼ 0.28, p ¼.78, DR2 ¼ 0%, controlling for achievement and grade level. In other words, girls were just aslikely as boys to have less positive attitudes toward fractions compared to their attitudes towardwhole numbers. Furthermore, there was no effect of gender on fraction attitudes or whole-num-ber attitudes; girls’ and boys’ attitudes toward fractions were similarly positive, p ¼ .84, DR2 ¼0%, and their attitudes toward whole numbers were similarly positive, p ¼ .55, DR2 ¼ 0%.
THE JOURNAL OF EXPERIMENTAL EDUCATION 9
Grade levelChildren’s current grade level however was related to attitude differences, b¼ 0.35, SE¼ 0.12,t(104) ¼ 2.83, p ¼ .006, DR2 ¼ 7%, such that fifth-graders had considerably smaller attitude dif-ferences on average, M ¼ .36, SD ¼ .62, than sixth-graders, M ¼ .75, SD ¼ .57, controlling forgender and achievement. As shown in Table 2, one source of this effect is that a greater propor-tion of fifth-graders than sixth graders reported more-favorable attitudes toward fractions.Furthermore, among those children with more favorable attitudes toward fractions, the magnitudeof that difference was smaller among sixth-graders, MDiff ¼ 0.21, than fifth-graders, MDiff ¼ 0.35(though note that ns are quite low, see Table 2) In contrast, among children who reported lessfavorable attitudes toward fractions, the magnitude of that difference was larger among sixth-graders, MDiff ¼ �0.86, than fifth-graders, MDiff ¼ �0.67. These patterns suggest that differencesin specific math attitudes begin to emerge in the middle grades, as children gain more experiencewith fractions. Many children in fifth grade, who have some formal classroom experience withfractions and fraction arithmetic, already have more-negative attitudes toward fractions thanother, more familiar aspects of math. However, in sixth grade after intensive fraction arithmeticinstruction has finished, a greater proportion of sixth-graders report negative attitudes towardfractions as compared to fifth-graders, p ¼ .01, Fisher’s exact test.
Study 2
In Study 2, we adapted the MAQ for use with a large, online sample of adult participants. Thegoal of Study 2 was to assess whether adults, like children, showed differential attitudes towardwhole numbers and fractions. As with the children, we also explored whether important individ-ual differences, such as level of educational attainment and gender, predicted different attitudesbased on number type. Furthermore, we assessed adults’ fraction and whole-number performancewith a range of math tasks and with general math anxiety to examine their relationships with spe-cific attitudes and to allow us to control for performance and anxiety when estimating relation-ships with educational attainment and gender. We added a measure of anxiety given recentstudies linking adults’ general math anxiety to fraction magnitude comparison and number-lineestimation performance (Sidney et al., 2018). Finally, we investigated whether specific attitudesabout fractions uniquely predicted performance on fraction number-line estimation and fractionarithmetic (see Supplemental Materials).
Method
All study procedures were reviewed and approved by the Kent State University institutionalreview board under Protocol #17-432 entitled “Effects of Attitudes and Emotions about Numberon Decision-Making.”
ParticipantsThe full sample included 374 participants recruited through Amazon’s Mechanical Turk (MTurk)who met our inclusion criteria: located in the United States, completion of at least 100 previousHuman Intelligence Tasks (HITs) on MTurk, and at least 95% approval from other requestors forpreviously completed HITs. Three participants were excluded for poor quality data (see below).Of the remaining 371 participants, 54% self-identified as women, 45% identified as men, 1% iden-tified as neither or declined to respond. Ages ranged from 21 to 76, M¼ 37.4 years, SD¼ 11.4years. The sample was 79.9% non-Hispanic White, 5.3% Hispanic, 5.1% Black or African-American, 4.5% East or Southeast Asian, and 3.5% of mixed racial descent; 1.6% declined torespond. Most participants reported having college experience: 13.9%, a postgraduate degree;
47.1%, a college degree; 23.0%, some college experience; 0.8%, post–high school training otherthan college; 11.5% reported having finished high school, 0.3% reported having some high schooleducation, and none reported having had fewer than 8 years of education; and 2.7% declinedto respond.
Upon accepting the HIT, MTurk workers were given a link to the Qualtrics survey. The surveytook on average 45minutes, M¼ 45.21m, SD¼ 20.92m. Participants received $6 in their MTurkaccount for completing the survey.
Design and tasksParticipants completed a series of tasks on Qualtrics that measured their attitudes, math anxiety,and mathematics performance. Participants provided electronic consent and took the survey ontheir own computers or mobile devices. The survey included four sections: (a) attitudes and mathanxiety, (b) mathematics performance, (c) decision-making, and (d) demographic characteristics.Attitude, anxiety, and performance measures were always completed in the first two sections; halfof the participants were randomly assigned to complete the attitude and anxiety measures first.The primary goal of this study was to examine relationships between our math attitude question-naire (see below), anxiety, and performance and the secondary goal was to pilot new rational-number–decision-making tasks. Here, we report our results with a subset of attitude, anxiety, per-formance, and demographic measures.
Math attitude questionnaireThe MAQ from Study 1 was adapted for use with adults. The ability section was identical to thechild version of the survey. In the preference section, children were asked about liking learningadults were asked about thinking. In the frequency section, children were asked about use outsideof school and asked to predict usefulness as an adult; adults were asked about work. Finally, weinclude a new section on the adult questionnaire assessing adults’ perceived importance of mathin general, of fractions, and of whole numbers (see Appendix A). The reliability of the expandedadult questionnaire was higher than the child version for each component: general attitudes(MAQ-General: Items G1–G4, Cronbach’s A ¼ .75), fraction attitudes (MAQ-Fraction: ItemsF1–F8, Cronbach’s A ¼ .91), and whole-number attitudes (MAQ-Whole Number: Items W1–W8,Cronbach’s A ¼ .87).
Math anxiety measureTo measure math anxiety, participants were asked, “On a scale of 1 to 10, with 10 being the mostanxious, how math anxious are you?” (Ashcraft, 2002). Response options ranged from 1 (not anx-ious) to 10 (very anxious).
Whole-number competenceWe measured two aspects of participants’ whole-number competence: understanding of numericalmagnitude and arithmetic knowledge. Numerical magnitude understanding was assessed with anumber-line task adapted from Landy, Charlesworth, and Ottmar (2017) and Opfer and Siegler(2007). In 22 trials, participants placed a number on a number line ranging from 0 to 1 billion(e.g., Landy et al., 2017). The set of 22 numbers was created by multiplying the set of numbersused in Opfer and Siegler (2007) in Experiment 1, which included numbers between 0 and 1,000,by 1,000,000. Numbers ranged from 2 million to 948 million. In the number-line task, partici-pants’ performance was assessed by calculating percent absolute error (PAE ¼ (jParticipants’
THE JOURNAL OF EXPERIMENTAL EDUCATION 11
Answer�Correct Answerj)/Number Line Scale) � 100. For each participant, we averaged PAEsacross all 22 trials; lower PAEs indicated smaller deviation from the correct location on the line.
We measured participants’ whole-number arithmetic performance with the CalculationFluency Test (Sowinski, Dunbar, & LeFevre, 2014), which measures the number of two-digitwhole-number arithmetic problems completed within three minutes. The assessment included 180problems: 60 addition, 60 subtraction, and 60 multiplication. Participants answered as manyproblems as they could in each section within one minute. Participants’ scores were the totalnumber of problems completed correctly.
Fraction performanceAs with whole-number performance, we measured participants’ understanding of fraction magni-tudes and knowledge of fraction arithmetic. Fraction magnitude understanding was measuredwith two number-line tasks, a 0 to 1 number-line task adapted from Siegler and Thompson(2014) and a 0 to 5 number-line task adapted from Fazio, DeWolf, et al. (2016). For each task,we calculated participants’ average PAE, as described above. Additionally, we administered a frac-tion magnitude comparison task, adapted from Fazio, DeWolf, et al. (2016), in which participantswere presented with two fractions and asked to choose the larger one; percent accuracywas calculated.
We measured participants’ fraction arithmetic performance across 24 fraction arithmetic prob-lems. Participants completed six problems in each of four sections: addition, subtraction, multipli-cation, and division. Participants were given three minutes to solve each set of six problems. Twoproblems in each section involved two fraction operands (stimuli from Siegler et al., 2011) andfour problems involved a whole number and a fraction (stimuli from Sidney & Alibali, 2017).Participants’ scores were the total number of problems completed correctly.
Demographic informationAt the end of the survey, participants reported their age, gender (coded as male identity or not,such that the two participants who reported nonbinary identities are categorized with thewomen), race/ethnicity, and highest grade or level of education completed (1 ¼ less than 8 years,2 ¼ 8–11 years, 3 ¼ 12 years or completed high school, 4 ¼ post–high school training other thancollege, 5 ¼ some college, 6 ¼ college graduate, 7 ¼ postgraduate [treated as a continuous variablein the analysis]).
Exclusion criteriaWe evaluated participants’ engagement in the tasks. On the number-line tasks, participants whosestandard deviation was less than 10% of the length of the number line were flagged as respondingwith a similar location to all stimuli. On the arithmetic-knowledge tasks, participants who gaveno responses or who correctly answered all questions on the Calculation Fluency Test wereflagged. No participants correctly answered all questions on the Calculation Fluency Test, whichhelps to rule out the likelihood of calculator use on performance tasks. On the magnitude com-parison task, participants who chose the option presented on one side of the screen in at least 27out of 32 trials were flagged. Three participants were flagged in at least four of six tasks and wereexcluded from analysis.
Results and discussion
Overall, participants’ attitudes toward mathematics were somewhat positive, with more positiveattitudes toward whole numbers than fractions (see Table 3 for means, SDs, and correlations
12 P. G. SIDNEY ET AL.
among variables). Participants’ performance on the fraction magnitude tasks was in line withprior work, suggesting that participants in the MTurk sample put forth an amount of effort simi-lar to other samples from the literature. Average fraction number-line estimation performance inthe 0–5 range from the current MTurk sample (see Table 3) was similar to performance in priorcollege student samples (PAE ¼ 10%, Fazio, DeWolf, et al., 2016; PAE ¼ 12% and 14%, Sidneyet al., 2018) as was magnitude-comparison accuracy (M¼ 96%, Fazio, DeWolf, et al., 2016;M¼ 91% and 91%, Sidney et al., 2018).
Differences in specific attitudes (H1 and H2)First, we examined whether adults’ attitudes toward fractions were reliably less positive than theirattitudes toward whole numbers (H1). As with the children, the vast majority of adults (306/371)reported less positive attitudes toward fractions than whole numbers. Some adults’ (46/371) scoreson fraction questions were equal to their scores on whole-number questions, and some adults(16/371) reported more-positive attitudes toward fractions than whole numbers (Table 2). Wetested whether adults’ fraction attitudes differed from their whole-number attitudes with adependent samples t test. Indeed, in line with the attitudes among children, adults’ attitudestoward fractions, M¼ 2.15, were significantly less positive than their attitudes toward whole num-bers, M¼ 2.74, MDiff ¼ �0.59, SE¼ 0.03, t(370) ¼ �23.45, p < .001, d ¼ �0.84. Again, we exam-ined the patterns of attitudes within each specific construct (self-perceived ability, preference,perceived frequency of use, and perceived importance). The observed pattern held within eachsection (consisting of two items each), ps < .001, demonstrating that adults believe they are lesscompetent with fractions than with whole numbers (MDiff ¼ �0.70), report liking fractions lessthan whole numbers (MDiff ¼ �0.53), believe that they use fractions less often (MDiff ¼ �0.78)and believe that fractions are less important for being accurate when using mathematics in every-day life (MDiff ¼ �0.34). Again, given the similarities in attitude differences across specific atti-tude constructs, we do not report findings separately by specific construct in subsequent sectionswithin Study 2.
Second, we examined the relationships between adults’ general attitudes toward mathematicsand their specific attitudes toward whole numbers and fractions. Both fraction attitudes, r¼ 0.78,and whole-number attitudes, r¼ 0.86, were significantly correlated with general attitudes towardmathematics. However, contrary to results for the children in Study 1, in which fraction andwhole number attitudes were similarly correlated with general math attitudes, among adults thecorrelation of general math attitudes with whole numbers was significantly larger than the correl-ation with fractions, z¼ 4.54, p < .01, r to z for dependent correlation coefficients (Lee &Preacher, 2013; Steiger, 1980).
Table 3. Study 2 descriptive statistics and correlations.
Note. Correlation coefficients (in boldface) are significant at p < .05. MAQ scores can range from 1 to 4.
THE JOURNAL OF EXPERIMENTAL EDUCATION 13
In a regression model predicting general attitudes (MAQ-General) from fraction attitudes(MAQ-Fractions) and whole-number attitudes (MAQ-Whole Number) separately, both predictorsaccounted for unique variance in attitudes, ps < .01, and together accounted for most of the vari-ance, total R2 ¼ 78%. This suggests that when we asked adults about their mathematics attitudes,in general, their responses draw on their attitudes about whole numbers, fractions, and likelyother aspects of mathematics. However, in contrast to results for the children, the relationshipbetween whole-number attitudes and general mathematics attitudes among adults was stronger,b¼ 0.63, DR2 ¼ 17%, than the relationship between fraction attitudes and general mathematicsattitudes, b¼ 0.29, DR2 ¼ 4%. Taken together, these results suggest that when asked about theirattitudes toward mathematics, such as how they feel about mathematics and how much they likemathematics, adults may be thinking more about whole numbers than fractions.
Individual differences (H3)Third, we examined whether different attitudes toward fractions and whole numbers were relatedto math performance, math anxiety, level of education, and gender. As in Study 1, we conceptual-ized differential attitudes as the within-subject effect of number type on attitude responses andemployed a procedure described by Judd et al. (2009) for examining the moderating effects ofbetween-subjects predictors on a two-level, within-subject factor. We did this by regressing differ-ence scores ((MAQ-Whole Numbers) � (MAQ-Fractions)) on all of our predictors: math anxiety;the two whole-number performance measures; the four fraction performance measures; level ofeducation; gender; and order condition (attitude measures first or performance measures first).This analysis allowed us to examine whether variability in the magnitude of the differencebetween adults’ whole-number and fraction attitudes was related to variability on each individualdifference variable.
Given the inclusion of multiple, overlapping predictors (see Table 3 for correlations), weassessed the multicollinearity of our predictors. VIF values ranged from 1.03 to 2.69, with thegreatest overlap across the fraction predictors (VIFNL01 ¼ 2.69, VIFNL05 ¼ 2.33, VIFMagComp ¼2.47, VIFFrArith ¼ 1.94), suggesting low-to-moderate correlations across these predictors that allmeasure fraction-magnitude knowledge to some degree (see Sidney et al., 2018; Siegler et al.,2011). Due to this overlap, we do not interpret the effects of individual performance measures;instead, we assess “whole number performance” and “fraction performance” as a set of predictorsusing comparison of nested models. Missing data was handled with casewise deletion from theanalysis. For each analysis, we report unstandardized regression coefficients.
Order conditionFirst, we examined whether there were effects of our task-order manipulation. Different attitudestoward fractions and whole numbers were not related to order condition, b¼ 0.04, SE¼ 0.05,t(350) ¼ 0.88, p ¼ .38. Both whole-number attitudes, b¼ 0.24, SE¼ 0.06, t(350) ¼ 4.30, p < .001,and fraction attitudes, b¼ 0.20, SE¼ 0.06, t(350) ¼ 3.27, p ¼ .001, were more positive when atti-tudes were assessed before performance. In other words, completing mathematics tasks firstcaused adults to report less positive attitudes toward mathematics across both number types anddid not differently affect whole-number and fraction attitudes.
PerformanceThe difference score analysis revealed that neither whole-number performance, F(2, 350) ¼ 2.25(comparison of nested models), p ¼ .11, nor fraction performance, F(4, 350) ¼ 1.25 (comparisonof nested models), p ¼ .29, predicted different attitudes toward fractions and whole numbers.Indeed, both whole-number performance, F(2, 350) ¼ 5.97, p ¼ .003, DR2 ¼ 2%, and fraction
14 P. G. SIDNEY ET AL.
performance, F(4, 350) ¼ 3.41, p ¼ .009, DR2 ¼ 2%, were significantly related to adults’ whole-number attitudes (MAQ-Whole Numbers). Both whole-number performance, F(2, 350) ¼ 3.77,p ¼ .02, DR2 ¼ 1%, and fraction performance, F(4, 350) ¼ 3.78, p ¼ .005, DR2 ¼ 3%, weresignificantly related to adults’ fraction attitudes (MAQ-Fractions). In general, participants withhigher performance on whole-number and fraction tasks had more-positive attitudes about wholenumbers and fractions. Together with the difference-score analysis, this suggests that adults’ lesspositive attitudes toward fractions relative to whole numbers cannot be attributed to differencesin mathematics performance.
Math anxietyThe difference-score analysis also revealed that adults’ math anxiety did not predict different atti-tudes toward fractions and whole numbers, b ¼ .01, SE¼ 0.01, t(350) ¼ 1.13, p ¼ .26. Indeed,math anxiety predicted both whole-number attitudes, b ¼ �0.09, SE¼ 0.01, t(350) ¼ �7.78, p <.001, DR2 ¼ 10%, and fraction attitudes, b ¼ �0.10, SE¼ 0.01, t(350) ¼ �8.15, p < .001, DR2 ¼11%. In both cases, adults who reported greater math anxiety also reported less positive attitudestoward mathematics, regardless of number type.
EducationDifferent attitudes toward fractions and whole numbers were uniquely predicted by level of edu-cation, b ¼ �0.05, SE¼ 0.02, t(350) ¼ �2.15, p ¼ .03, DR2 ¼ 1%. In other words, controlling forperformance, anxiety, gender, and order condition, participants with more years of education hadsmaller differences between (i.e., more similar) whole-number and fraction attitudes. Education isrelated to adults’ whole-number attitudes, b¼ 0.06, SE¼ 0.02, t(350) ¼ 2.53, p ¼ .01, DR2 ¼ 1%,and fraction attitudes, b¼ 0.11, SE¼ 0.01, t(350) ¼ 4.13, p < .001, DR2 ¼ 3%. Together, theseresults suggest that although continued education is related to more-positive attitudes towardboth whole numbers and fractions, continued education is more strongly related to fraction atti-tudes than whole number attitudes and is thus related to a smaller “gap” between attitudestoward fractions and whole numbers.
GenderIn contrast to the findings with children, different attitudes toward fractions and whole numberswere uniquely predicted by gender, b ¼ �0.18, SE¼ 0.05, t(350) ¼ �3.45, p < .001, DR2 ¼ 3%.The gender difference in whole-number attitudes, b ¼ �0.06, SE¼ 0.06, t(350) ¼ �1.05, p ¼ .29,was smaller than the gender difference in fraction attitudes, b¼ 0.11, SE¼ 0.06, t(350) ¼ 1.87,p ¼ .06. Together, these findings reveal that women are more likely than men to hold different atti-tudes, and this can be partially attributed to less positive attitudes toward fractions among womenthan among men. Importantly, these analyses control for mathematics performance and anxiety.The findings suggest that, given a man and a woman with equal mathematics performance andanxiety, the woman may be more likely to hold negative attitudes specifically toward fractions.
Study 3
Study 3 had two aims. First, we aimed to replicate our findings that adults held different attitudesabout fractions and whole numbers (H1) in a second sample with an adapted version of theMath Attitude Questionnaire. One limitation of the MAQ used in Studies 1 and 2 was that thefour response options (e.g., not at all good, OK, good, very good) asked only about the extent ofpositive attitudes (e.g., OK, good, very good) and absence of positive attitudes (e.g., not at allgood), rather than directly asking about negative attitudes. We decided not to measure explicitly
THE JOURNAL OF EXPERIMENTAL EDUCATION 15
negative attitudes toward math in children because we did not want to suggest to children thatthey could or should “hate math” or identify as “very bad” at math at a time when their attitudestoward math, fractions, and whole numbers may still be developing (see Gunderson, Ramirez,Levine, & Beilock, 2012, for a review). However, using the MAQ from Studies 1 and 2, we couldnot differentiate whether participants’ less positive ratings for fractions reflected truly negativeattitudes. This distinction is important because negative attitudes may be more detrimental topeople’s engagement in math tasks than less positive attitudes. Thus, in Study 3, we changed theresponse options to a six-point scale (e.g., very bad, bad, slightly bad, slightly good, good, verygood) so that we could explicitly ask adults about their negatively valenced attitudes (e.g., verybad, bad, slightly bad), rather than an absence of their positive attitudes. Conceptually, we choosethese options to retain three levels of positive attitudes and substituted three levels of negativeattitudes for the leftmost endpoint of the original scale (e.g., not at all good).
Second, in Study 2, we found that the relationship between whole-number attitudes and generalattitudes was stronger than the relationship between fraction attitudes and general attitudes amongadults. These findings were in line with whole-number bias studies suggesting that when adults areasked about math in general, whole numbers are the types of numbers that likely come to mind (e.g.,Van Hoof, Vandewalle, et al., 2015). In Study 3, we extended the question of whether asking partici-pants about general attitudes captured some variability in their attitudes toward any number typesother than whole numbers by examining attitudes toward percentages. Percentages are also commonin daily life (e.g., 25% off sale) and central to other measures of adults’mathematics self-perceived abil-ity, preference, and values (Fagerlin et al., 2007). Because of the dearth of developmental research onchildren and adults’ understanding of percentages (see Tian & Siegler, 2018), it was unclear whetherpeople would consider percentages to be more similar to whole numbers because of their perceptualsimilarities (e.g., 25% and 25 involve the same numerals) or to fractions because of their conceptualsimilarities (e.g., 1/4 and 25% are equivalent).
Our primary aim for Study 3 was to replicate H1 and H2, so we set our sample size to haveadequate power to test the differential attitudes between whole numbers and fractions (H1) andthe r to z transformation analyses (i.e., Is the correlation between whole number attitudes andgeneral attitudes stronger than the correlation between fraction attitudes and general attitudes?;H2). Thus, we focus on relationships between fraction and whole-number attitudes and do notreport relationships with the individual differences variables mentioned in Study 1 (e.g., gender,educational attainment, math anxiety, competency) because we did not power for these analyses.
Method
All study procedures were reviewed and approved by the Kent State University InstitutionalReview Board under Protocol #17-432 entitled “Effects of Attitudes and Emotions About Numberon Decision-Making.”
ParticipantsThe full sample included 76 participants recruited through Amazon’s MTurk who met the sameinclusion criteria as described in Study 2. Participants who completed Study 2 were not eligible tocomplete Study 3. Applying the criteria described in Study 2, no participants were excluded forpoor quality data. In this sample, 30 participants self-identified as women and 46 identified asmen. Ages ranged from 18 to 68, M¼ 37.5 years, SD¼ 11.7 years. The sample was 78.9% non-Hispanic White, 3.9% Hispanic, 3.9% Black or African-American, 5.3% East or Southeast Asian,and 6.6% of mixed racial descent; 1.3% declined to respond concerning race/ethnicity. In termsof educational experience the sample was similar to the Study 2 sample. As in Study 2, partici-pants received $6 in their MTurk account after completing the survey.
16 P. G. SIDNEY ET AL.
Design and tasksParticipants completed a subset of the Qualtrics survey questions used in Study 2: attitudes andmath anxiety, mathematics performance, and demographic characteristics. The MAQ used inStudy 3 had three main differences: (a) participants rated their responses on a six-point scaleinstead of a four-point scale; (b) participants rated their attitudes about percentages in additionto mathematics in general, whole numbers, and fractions (percentage questions always followedfraction questions within each subsection of the MAQ, see Appendix A); and (c) all participantsreceived performance tasks before attitude tasks, given that order did not affect the relationshipbetween whole-number and fraction attitudes. As in Studies 1 and 2, we calculated participants’attitudes toward mathematics in general (MAQ-General: Items G1–G4, Cronbach’s A ¼ .79),participants’ attitudes toward fractions (MAQ-Fraction: Items F1–F8, Cronbach’s A ¼ .90), andparticipants’ attitudes toward whole numbers (MAQ-Whole Number: Items W1–W8, Cronbach’sA ¼ .89). Additionally, we calculated participants’ attitudes toward percentages as the average ofparticipants’ attitudes on the eight percentage questions (MAQ-Percentage: Items P1–P8,Cronbach’s A ¼ .91).
Performance measures were always completed before the attitudes and anxiety measurebecause we found that there was no effect of order in Study 2 on the relationship between partic-ipants’ whole-number and fraction attitudes.
Results and discussion
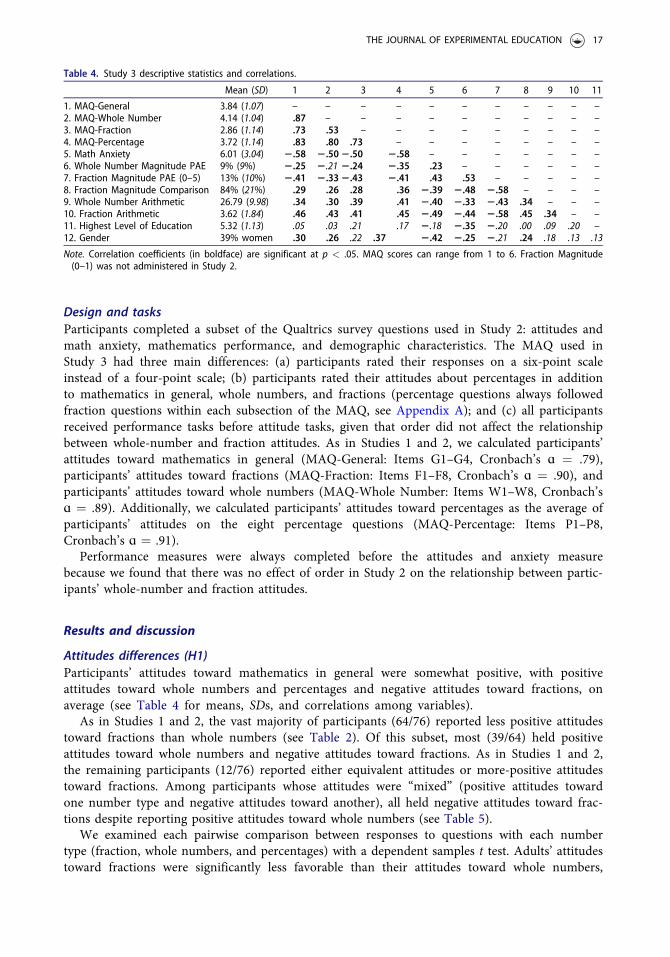
Attitudes differences (H1)Participants’ attitudes toward mathematics in general were somewhat positive, with positiveattitudes toward whole numbers and percentages and negative attitudes toward fractions, onaverage (see Table 4 for means, SDs, and correlations among variables).
As in Studies 1 and 2, the vast majority of participants (64/76) reported less positive attitudestoward fractions than whole numbers (see Table 2). Of this subset, most (39/64) held positiveattitudes toward whole numbers and negative attitudes toward fractions. As in Studies 1 and 2,the remaining participants (12/76) reported either equivalent attitudes or more-positive attitudestoward fractions. Among participants whose attitudes were “mixed” (positive attitudes towardone number type and negative attitudes toward another), all held negative attitudes toward frac-tions despite reporting positive attitudes toward whole numbers (see Table 5).
We examined each pairwise comparison between responses to questions with each numbertype (fraction, whole numbers, and percentages) with a dependent samples t test. Adults’ attitudestoward fractions were significantly less favorable than their attitudes toward whole numbers,
Table 4. Study 3 descriptive statistics and correlations.
Note. Correlation coefficients (in boldface) are significant at p < .05. MAQ scores can range from 1 to 6. Fraction Magnitude(0–1) was not administered in Study 2.
THE JOURNAL OF EXPERIMENTAL EDUCATION 17
MDiff ¼ �1.29, SE¼ 0.12, t(75) ¼ 10.60, p < .001, d ¼ �1.18, and attitudes toward percentageswere significantly less favorable than attitudes toward whole numbers, MDiff ¼ �0.42, t(75) ¼5.26, SE¼ 0.08, p < .001, d ¼ �0.35. Furthermore, participants’ attitudes toward fractionswere significantly less favorable than their attitudes toward percentages, MDiff ¼ �0.87, SE¼ 0.10,t(75) ¼ 9.03, p < .001, d ¼ �0.76. Notably, the effect size estimates indicate that the differencebetween fraction and whole number attitudes in Study 3 was greater than in Study 2. This sug-gests that the six-point scale allowed us to measure greater differences between fraction andwhole-number attitudes, as we had aimed to do. As in Studies 1 and 2, attitude differencesbetween whole-number and fraction items were similar across attitude constructs, self-perceivedability, MDiff ¼ �1.38, preference, MDiff ¼ �1.18, frequency of use, MDiff ¼ �1.56, and perceivedimportance, MDiff ¼ �1.03.
Second, we aimed to replicate our finding (H2) from Study 2 that adults’ general attitudestoward mathematics were more closely related to adults’ attitudes toward whole numbers than toadults’ attitudes toward fractions. As in Study 2, both fraction attitudes, r¼ 0.73, and whole-num-ber attitudes, r¼ 0.87, were significantly correlated with general attitudes toward mathematics.However, the correlation with whole numbers was significantly larger, z¼ 2.77, p < .01, r to z fordependent correlation coefficients (Lee & Preacher, 2013; Steiger, 1980). Adults’ attitudes towardpercentages were also closely related to both general attitudes, r¼ 0.83, and whole-number atti-tudes, r¼ 0.80, suggesting the possibility that adults think about percentages as being highly simi-lar to whole numbers. The correlation between percentage attitudes and general attitudes was notsignificantly different than the correlation between whole number and general attitudes, z¼ 1.20,p ¼ .23.
Finally, we fit a regression model predicting general attitudes (MAQ-General) from fractionattitudes (MAQ-Fraction) and whole-number attitudes (MAQ-Whole Number) separately. Bothpredictors account for unique variance in attitudes, ps < .001, and together account for most ofthe variance, total R2 ¼ 85%. However, as in Study 2, the relationship between whole-numberattitudes and general mathematics attitudes was considerably stronger, b¼ 0.69, DR2 ¼ 32%, thanthe relationship between fraction attitudes and general mathematics attitudes b¼ 0.36, DR2 ¼10%. Adding adults’ attitudes toward percentages explains no additional variance; adults’ percent-age attitudes did not have any unique relationship with their general attitudes over and abovethe other predictors, whole number: b¼ 0.62, p < .001, DR2 ¼ 13%; fraction: b¼ 0.31, p < .001,DR2 ¼ 5%; percentage: b¼ 0.10, p ¼ .24, DR2 ¼ 0%.
Study 4
Although we found in Studies 1, 2, and 3 that both children and adults have less positive atti-tudes toward fractions than whole numbers, we considered the possibility that differences in atti-tudes were at least in part a function of the order of items within the MAQ. One possibility isthat participants rated fractions differently than whole numbers simply because questions that dif-fered only by number type (e.g., about fractions versus about whole numbers) appeared togetherin a fixed order within the MAQ. To examine this possibility, we administered a portion of theMAQ to college-aged adult participants (age range: 18 to 25 years, Mage¼ 19.24 years, SD¼ 1.54 y;
Table 5. Relative attitudes toward fractions and whole numbers.
Relative Attitude Both Negative Mixed Both Positive Total
Note. Mixed¼ positive attitudes toward one number type with negative attitudes toward another (when fraction and wholenumber attitudes are equivalent, mixed attitudes cannot be observed). No participant reported negative attitudes towardwhole numbers with positive attitudes toward fractions.
18 P. G. SIDNEY ET AL.
80% women; 76% White) who were recruited through psychology courses at a selective universityin the southeastern United States.
Participants rated their attitudes at the end of another study about adults’ diagram drawing.The tasks in the other study were similar to the tasks completed by children in Study 1 prior toreceiving the MAQ and involved drawing diagrams to represent fraction division problems.
Some (n¼ 43) participants answered only MAQ questions about whole numbers, and otherparticipants (n¼ 33) answered only MAQ questions about fractions. Each group answered ques-tions just about self-perceived ability and preference on the same six-point scale used in Study 3.Because each group received questions about only one number type, this provides a more strin-gent test of whether adults’ attitudes toward fractions are reliably more negative than their atti-tudes toward whole numbers.
Indeed, even when number type was manipulated across participants, rather than within par-ticipants, adults’ attitudes toward fractions were less positive than their attitudes toward wholenumbers, MFractions ¼ 3.49, MWhole Numbers ¼ 4.76, MDiff ¼ �1.26, SE¼ 0.24, t(74) ¼ 5.23, p <.001, d ¼ �1.22. Thus, the magnitude of mean differences between adults’ attitudes toward frac-tions and whole numbers was similar to differences observed with the same scale in Study 3(MDiff ¼ �1.29). As in Study 3, attitude differences were observed for each measured attitudeconstruct, self-perceived ability, MDiff ¼ �1.04, and preference, MDiff ¼ �1.49.
Thus, it does appear that differential attitudes toward fractions and whole numbers is not theresult of a demand characteristic of the MAQ, which juxtaposes questions about whole numbersand questions about fractions within the same scale. Our results suggest that fractions attitudeswere not rated less favorably than whole numbers just because participants saw both types ofquestions together within the same scale and inferred that they should respond differently to eachtype of question. However, there are some important limitations to consider when comparing thefindings from the adults in Study 4 to the adults in Studies 2 and 3. In contrast to Studies 2 and3, we did not recruit a community sample. Thus, the adults in Study 4 differ in many ways fromthe adults in Studies 2 and 3, including distributions of age, gender, and educational attainment.Their higher levels of education (i.e., all currently enrolled at a selective university) may be onereason why they held more-positive attitudes toward both fractions and whole numbers, thoughthe “gap” in attitudes was similar in magnitude. Finally, all participants rated their attitudes aftercompleting a challenging fraction problem-solving task, so this may have negatively impactedtheir attitudes about fractions. However, results from Study 2 (see “Order condition” sectionabove) suggest that this is unlikely to be the case since both whole-number and fraction attitudeswere less positive after completing earlier math tasks than if rated before math taskswere completed.
General discussion
Early-emerging differences in specific attitudes (H1)
Across four studies, we found that both children and adults often held less favorable attitudestoward fractions than whole numbers. They believed they were less competent with fractions,they reported that they liked fractions less, and they thought fractions were less important anduseful in daily life than whole numbers (Studies 1, 2, and 44) and percentages (Study 3).Furthermore, in Study 3, we demonstrated that adults’ fraction attitudes were not just less posi-tive, but quite negative, despite many adults holding positive attitudes toward whole numbers. InStudy 4, we demonstrated that the observed differential attitudes were not simply a function ofsequentially answering questions about fractions after questions about whole numbers (and thuslikely directly contrasting the different types of numbers), suggesting that our findings in Studies1, 2, and 3 reflect true differences in people’s attitudes toward fractions and whole numbers.
THE JOURNAL OF EXPERIMENTAL EDUCATION 19
Importantly, the fifth- and sixth-graders who participated in our research had differingamounts of formal fraction arithmetic experience, yet even the fifth-graders who had less formalfraction arithmetic experience already showed differential attitudes between whole numbers andfractions. However, the differences in attitudes were significantly greater among children in sixthgrade. Not only was the average difference between whole-number and fraction attitudes largeramong sixth-graders than fifth-graders, but many more sixth-graders held differential attitudes.That is, sixth-graders were more likely to hold very positive attitudes toward whole numbers, andmath in general, but held considerably less positive attitudes toward fractions. The magnitude ofthe difference between participants’ whole-number and fraction attitudes was quite similar amongchildren and adults who held less favorable attitudes toward fractions.
The specific direction of the differences between whole-number attitudes and fraction atti-tudes—that people feel more negatively toward fractions—may have significant developmentaland practical implications. Developmentally, negative attitudes toward fractions are concerningbecause of the importance of fraction understanding in mathematics development and highereducational attainment more broadly: Early fraction learning is a critical predictor of success inalgebra (Siegler et al., 2012), the “gatekeeper” to higher mathematics (Booth & Newton, 2012).Although lower mathematics achievement was related to less positive attitudes overall, we did notfind that children’s relative mathematics achievement before beginning fraction instruction pre-dicted different attitudes toward fractions and whole numbers at the end of the school year.More research is necessary to determine whether the attitude differences that emerge in sixthgrade contribute to poorer fraction competency at the end of sixth grade and, in turn, less successin later grades.
These findings also have important implications for how we assess attitudes toward mathemat-ics in contexts with and without fractions and other rational numbers. One fortunate implicationof the high correlation between whole number and fraction attitudes is that when researchers askadults about their mathematics attitudes, which are closely aligned with whole-number attitudes,they can capture some of the variability in adults’ attitudes toward fractions as well. However, forcontexts in which attitudes toward fractions may be especially important, such as when explainingdifferences in adults’ decision-making when given ratio information (for example, when evaluat-ing the difference between the 1 in 16,400 risk of SIDS when sharing a bed with one’s infant ver-sus the 1 in 46,000 risk if not sharing a bed; Doucleff, 2018), asking directly about fractionattitudes has the potential to provide a more focused measure that should predict adults’ propen-sity to engage deeply with or avoid numeric information of this type. Given the variability withwhich adults’ fraction attitudes are in line with their whole number and general attitudes, askingsimply about “mathematics” may fail to capture negative attitudes among people who have other-wise favorable attitudes toward mathematics.
Furthermore, it may be important to ask about attitudes toward both whole numbers and frac-tions, to index the degree to which children and adults have negative attitudes toward fractionsdespite positive attitudes toward whole numbers or mathematics in general. Asking people abouttheir attitudes toward multiple subdomains of mathematics allows researchers to distinguish thosewith attitudes that differ by subdomain from those who feel negatively or positively toward math-ematics overall. Measuring differences in specific attitudes, as we have here, may offer moreinsight into children and adults who may differentially engage in numeric tasks, both in and outof school, depending on whether the numeric information is presented as fractions, whole num-bers, or in other numeric formats.
Are number concepts integrated? (H2)
Children’s and adults’ attitudes about math in general were correlated with both their attitudesabout fractions and their attitudes about whole numbers. However, there was variability in the
20 P. G. SIDNEY ET AL.
extent to which people’s attitudes were aligned across whole-number and fraction questions. Tothe extent that differences in attitudes may indicate differences in underlying number concepts,divergence in children’s and adults’ attitudes toward fractions and whole numbers may indicatepoorly integrated fraction and whole-number knowledge. According to the integrated theory ofwhole number and fractions development (Siegler et al., 2011), one key component in the devel-opmental trajectory of mathematical cognition is understanding that all rational numbers, includ-ing whole numbers, fractions, percentages, decimals, and other types of numbers belong to thesame mathematical system and have fundamental commonalities. It remains an open question asto whether instructional practices that emphasize these commonalities (e.g., whole numbers andfractions are similar because they possess magnitudes that can be placed on number lines) wouldlead people to better integrate their knowledge and attitudes about whole numbers and fractions.
Furthermore, adults’ attitudes about math in general appeared to differ from children’s atti-tudes in two ways. First, the correlations between adults’ general attitudes and their specific atti-tudes were much higher overall, potentially indicating that children’s specific attitudes were moredistinct from their general attitudes toward math compared with adults’specific attitudes.Children’s concepts of what math encompasses may be more differentiated than adults’ concepts.When asked about “math in general,” children may think about various aspects of math in add-ition to whole-number and fraction arithmetic, such as geometry, data and statistics, and pattern-ing, which are other aspects of elementary and middle grades curricula (see National GovernorsAssociation Center for Best Practices, Council of Chief State School Officers, 2010). Alternatively,adults’ attitudes may have been more strongly correlated simply because many adults had justcompleted a broad range of fraction and whole-number tasks (whereas the children had just com-pleted a single diagram-drawing task) or because the measure was more reliable among adults.
Second, when asked about attitudes toward mathematics generally, adults appear to be think-ing more about whole numbers than fractions (Studies 2 and 3). This evidence from adults’ atti-tudes is in line with other evidence of a whole-number bias (e.g., Ni & Zhou, 2005; Van Hoof,Verschaffel, et al., 2015), in which people who are asked to think generally about numbers (e.g.,evaluating the accuracy of the statement xþ 4< x) often think specifically about whole numbersand fail to think about other types of numbers, such as fractions. These findings from the adultstudies suggest that the differences in specific attitudes toward fractions and whole numbers mayreflect the extent to which their fraction concepts remain poorly integrated with their other mathconcepts. Interestingly, adults’ attitudes toward whole numbers were more closely aligned withtheir attitudes toward percentages than fractions. This may indicate that many adults perceivepercentages as if they were whole numbers, ignoring the percentage sign entirely, an error com-monly observed in studies of children’s reasoning (see Parker & Leinhardt, 1995). Lending sup-port to this interpretation, we found that percentage attitudes were very highly correlated withwhole-number attitudes and that adding percentage attitudes to our regression model of generalattitudes explained no additional variance over and above whole-number and fraction attitudes.Only a handful of adults in our Study 3 sample (n¼ 10) reported positive attitudes toward wholenumbers but negative attitudes toward percentages.
In line with our interpretation, Moss and Case (1999) have argued that percentages serve as abridge between whole numbers and fractions and have designed an educational interventionaimed at teaching children about rational numbers by introducing percentages first. They arguethat children are more familiar with percentage contexts in their everyday experiences (e.g., a fileloading), and thus, starting rational-number instruction with percentages allows learners toengage with ratios in a context that is both highly familiar and that allows children to draw ontheir whole-number knowledge (e.g., 25% is less than 50% because 25 is less than 50). Moreresearch is needed to better understand the developmental trajectory of percentage knowledgeand attitudes and how percentages are perceived to be similar to and different from whole num-bers and fractions (Tian & Siegler, 2018).
THE JOURNAL OF EXPERIMENTAL EDUCATION 21
Attitudes, performance, and gender (H3)
In Study 2, we collected data with a large sample of adults and included measures of specific fac-ets of fraction and whole-number performance to explore the relationships between specific atti-tudes, math performance, educational attainment, and gender. First, we found that educationalattainment and gender predicted how much less favorable adults’ attitudes toward fractions werein comparison to their whole number attitudes (H3). Adults with higher educational attainmentfelt more similarly toward fractions and whole numbers than adults with less educational attain-ment. Experience in higher education may help people to rate fractions less negatively, peoplewho rate fractions more positively may be more likely to continue in higher education, or both.However, these correlational findings prohibit insight into causal direction.
Also, we observed that women’s attitudes toward whole numbers and fractions tend to differmore than men’s attitudes toward whole numbers and fractions. It is important to note the pre-liminary nature of this finding, as no prior research has directly indicated that women’s or girls’attitudes are likely to be more differentiated than men’s or boys’. However, given the importanceof fraction understanding in the development of mathematics knowledge (e.g., Siegler et al.,2012), this finding raises questions about whether women’s negative attitudes toward fractionsmight be implicated in gender differences in mathematics achievement in adolescence and adult-hood (e.g., Halpern et al., 2007; Hyde et al., 1990). When people have negative attitudes towardfractions, they may disengage with mathematics tasks involving fractions. For instance, in arecent, unpublished survey of college students’ fraction problem-solving ability conducted as anexperiment in a research methods course, one undergraduate participant answered the mathemat-ics problem 3/4þ 2/3 ¼ ___ by typing, “This is my worst nightmare.” Negative attitudes towardfractions may contribute to some women’s disengagement from mathematics, regardless of theiractual mathematics performance or even anxiety (see Lauermann et al., 2017; Wang, Eccles, &Kenny, 2013). However, we did not observe gender differences in attitudes among fifth- andsixth-graders, raising questions about when stronger, specific fraction attitudes emerge amonggirls or, alternatively, when the “gap” between fraction and whole-number attitudes closesamong boys.
Gender differences in mathematics performance is a contentious topic, both in the research lit-erature and in public debate. The current study makes an incremental contribution toward amore robust understanding of the possible mechanisms (i.e., disengagement from rational-num-ber instruction) that could contribute to later observed gender differences in achievementand attainment.
Limitations and future directions
First, one limitation of the current line of studies is our adoption of a broad characterization of“mathematics attitudes” that subsumes multiple distinct attitudinal constructs, self-perceived abil-ity, preference, and perceived frequency of use. Over the past several decades, a rich history ofresearch linking facets of students’ attitudes and their academic goals, performance, and achieve-ment (e.g., Ainley et al., 2002; Cooper et al., 2018; Eccles et al., 1993; Wigfield & Eccles, 2000)has demonstrated that mathematics attitudes comprise theoretically and empirically distinct con-structs. In many cases, these constructs have been shown to have unique, separable effects ondevelopment, learning, and problem-solving, and thus, it is useful to distinguish between them,both in theory and practice. However, here, we have not focused on how number type mightaffect the measurement of children’s and adults’ self-perceived ability, preference, and perceivedfrequency of use, and we have not measured the effects of attitude differences on targeted behav-ioral outcomes. Thus, we are unable to conclude whether people’s negative attitudes toward frac-tions may matter more for some attitudinal constructs than others. Given that each construct
22 P. G. SIDNEY ET AL.
may have unique effects on student mathematics performance and engagement, one importantfuture direction is to directly examine the roles that attitudes toward specific facets of mathemat-ics may play in these unique pathways.
Second, the open questions about the relationships between gender, attitudes, mathematicalperformance, and educational attainment reveal a limitation: Because of the correlational natureof our data, we are unable to address whether different attitudes toward fractions and wholenumbers directly affect mathematics learning, development, or engagement or, conversely,whether mathematical performance directly affects attitudes. Rather, this study is a first step indemonstrating relationships among children’s and adults’ attitudes about specific types of num-bers and their mathematical performance. We acknowledge that it was necessary for us to con-duct many analyses across four studies, though we note that our main hypothesis was supportedacross all studies with a variety of samples (i.e., less favorable/more negative attitudes about frac-tions than other types of numbers). Further work is needed to assess the developmental trajectoryof gender differences in fraction attitudes; whether these attitudes are malleable; specifically whenfraction performance is improved; and what role these attitude differences might play in mathem-atics engagement.
Third, one may wonder whether negative attitudes about fractions stem from the fact thatfraction tasks are accurately perceived as more difficult and requiring more effort than wholenumber tasks to complete. Adults are often less accurate and precise in fraction tasks than theyare with similar whole-number tasks (e.g., Fazio et al., 2014; Sidney et al., 2018; Siegler & Opfer,2003; Thompson & Opfer, 2010, for evidence from number-line estimation), even though adultsare far removed from direct instruction on either of these facets of mathematics. This difficultywith fractions may lead to both greater math anxiety and more negative attitudes toward fractionsspecifically. However, it is important to note that in our current sample, fraction performance didnot predict differences in attitudes for whole numbers versus fractions in Study 2. We found thatdifferences in attitudes cannot be attributed to differences in performance; our data suggest thatgiven two people who are equally good with fractions, one may have very similar attitudes towardfractions and whole numbers, and one may have very different attitudes toward fractions andwhole numbers. Thus, these differences in attitudes are not solely a function of the objective diffi-culty of whole-number and fraction tasks, though it is an open question as to whether partici-pants’ perceived effort on whole-number versus fraction tasks predicts differential attitudes aboutfractions and whole numbers. Furthermore, there was no effect of task order on attitude differen-ces in our data. That is, even when participants in Study 2 completed our fraction performancemeasures before rating their mathematics attitudes, they did not report less positive attitudestoward fractions (relative to whole numbers) than if they rated their attitudes before completingthe challenging fraction performance tasks.
Fourth, the current study does not shed light on the role that familiarity with fractions mayplay in attitudes toward fractions. Experience with numbers in everyday life may impact familiar-ity with numbers and thus attitudes about different number types. The Common Core StateStandards indicates that children begin learning about whole numbers prior to learning aboutfractions, therefore, people may be more familiar with whole numbers than fractions, which maytranslate to more-positive attitudes about whole numbers than fractions. Interestingly, recentwork has indicated that familiarity plays a role in adults’ equivalent fraction number-line estima-tion performance (Fitzsimmons, Thompson, & Sidney, 2019). That is, they are more familiar,more confident, and more precise with small component fractions (1/2) than with equivalentlarge component fractions (15/30).
Familiarity with rational numbers may explain some of the seemingly discrepant results thatwe identified in our data. For example, there was a bigger difference in fraction and whole-num-ber attitudes for sixth-graders than for fifth graders. However, our results suggested that withincreasing years of formal education, this led to a smaller gap in attitudes for adults. Why might
THE JOURNAL OF EXPERIMENTAL EDUCATION 23
this be the case? With increasing years of formal classroom instruction on fractions, children maybegin to recognize that this topic is particularly difficult; they may be exposed to teachers’ and/orparents’ negative attitudes toward fractions; and they may be more capable of monitoring theirown fraction competency. For adults, we do not have data on the types of majors/professionsthat they pursued, so it could be possible that our highly educated adults chose majors/profes-sions that required them to use fractions and other rational numbers in their daily lives, resultingin greater familiarity. However, it may be the case that simple familiarity with fractions wouldnot explain differences in attitudes, as adults may encounter fractions on a daily basis (e.g., fol-lowing recipes, interpreting nutrition labels, measuring distance and length, filling up gas tanks,reasoning about fractional units of time and money). Future research will be necessary to teaseapart the role of familiarity and experience in math attitudes.
Finally, given that children and adults report different attitudes for different facets of mathem-atics and that people find some facets of mathematics to be more difficult than others, one futuredirection of research may be to extend this finding to mathematics anxiety. Some topics in math-ematics may elicit anxiety in different ways than others. For example, there is some evidence thatstatistics anxiety may be a separate construct from mathematics anxiety and that gender may playa different role in each (see Balo�glu, 2004). Recently, there has been a call to examine the degreeto which different subdomains of mathematics elicit different degrees of mathematics anxiety (seeDowker, Sarkar, & Looi, 2016) and our findings regarding differentiated attitudes based on spe-cific number types appear to be in line with this general idea.
Conclusions and educational implications
In conclusion, we have demonstrated that children’s and adults’ mathematics attitudes are multifa-ceted. In addition to having distinct attitudes about ability, preference, and value of mathematics(e.g., Cooper et al., 2018; Eccles & Wigfield, 1995), people also differ in their attitudes toward dif-ferent types of mathematics (i.e., with fractions and whole numbers). Even when people reportthat they “like mathematics,” they may still dislike fractions, despite the prevalence and import-ance of fractions in everyday life. Continued research is necessary for revealing relationshipsbetween attitudes, mathematics performance, math anxiety, educational attainment, gender, andhow attitudes change or stay the same across the lifespan. Additional research about students’ atti-tudes is needed, particularly research about students’ attitudes as they are formally learning aboutdifferent number types in school. Attitudes about different number types may ultimately contrib-ute to decisions about whether students engage and persist in STEM majors and professions.
Funding
This work was supported in part by the Institute of Education Sciences, U.S. Department of Education awardR305A160295, to Kent State University.
ORCID
Pooja G. Sidney http://orcid.org/0000-0003-3719-8543Clarissa A. Thompson http://orcid.org/0000-0001-8758-3218Jennifer M. Taber http://orcid.org/0000-0003-3285-4871
References
Ainley, M., & Ainley, J. (2011). Student engagement with science in early adolescence: The contribution of enjoy-ment to students’ continuing interest in learning about science. Contemporary Educational Psychology, 36(1),4–12. doi:10.1016/j.cedpsych.2010.08.001
Ainley, M., Hidi, S., & Berndorff, D. (2002). Interest, learning, and the psychological processes that mediate theirrelationship. Journal of Educational Psychology, 94(3), 545. doi:10.1037//0022-0663.94.3.545
Ajzen, I., & Fishbein, M. (2005). The influence of attitudes on behavior. In D. Albarrac�ın, B. T. Johnson, M. P.Zanna (Eds.), The handbook of attitudes (pp. 173–221). Mahwah, NJ: Lawrence Erlbaum Associates.
Alibali, M. W., & Sidney, P. (2015). Variability in the natural number bias: Who, when, how, and why? Learningand Instruction, 37, 56–61. doi:10.1016/j.learninstruc.2015.01.003
Alken, L. R. (1974). Two scales of attitude towards mathematics. Journal for Research in Mathematics Education,5(2), 67–71. doi:10.2307/748616
Ashcraft, M. H. (2002). Math anxiety: Personal, educational, and cognitive consequences. Current Directions inPsychological Science, 11(5), 181–185. doi:10.1111/1467-8721.00196
Balo�glu, M. (2004). Statistics anxiety and mathematics anxiety: Some interesting differences I. Educational ResearchQuarterly, 27(3), 38–48.
Booth, J., & Newton, K. J. (2012). Fractions: Could they really be the gatekeeper’s doorman? ContemporaryEducational Psychology, 37(4), 247–253. doi:10.1016/j.cedpsych.2012.07.001
Borenstein, M. (2009). Effect sizes for continuous data. In H. Cooper, L. V. Hedges, & J. C. Valentine (Eds.), Thehandbook of research synthesis and meta analysis (pp. 221–237). New York, NY: Russell Sage Foundation.
Braithwaite, D. W., & Siegler, R. S. (2018). Developmental changes in the whole number bias. DevelopmentalScience, 21(2), e12541.
Brown, S. A., Donovan, A. M., & Alibali, M. W. (2016, July). Gestural schematization influences understanding ofinfinite divisibility. Paper presented at the fourth annual midwest meeting on Mathematical Thinking, Madison,WI.
Carpenter, T. P., Corbitt, M. K., Kepner, H., Jr., Lindquist, M. M., & Reys, R. (1980). Results from the secondNAEP mathematics assessment: Secondary school. The Mathematics Teacher, 73(5), 329–338.
Cooper, J. L., Sidney, P. G., & Alibali, M. W. (2018). Who benefits from diagrams and illustrations in math prob-lems? Ability and attitudes matter. Applied Cognitive Psychology, 32(1), 24–38. doi:10.1002/acp.3371
Cuite, C. L., Weinstein, N. D., Emmons, K., & Colditz, G. (2008). A test of numeric formats for communicatingrisk probabilities. Medical Decision Making, 28(3), 377–384. doi:10.1177/0272989X08315246
Davidson, A. R., & Jaccard, J. J. (1979). Variables that moderate the attitude–behavior relation: Results of a longi-tudinal survey. Journal of Personality and Social Psychology, 37(8), 1364. doi:10.1037/0022-3514.37.8.1364
Denissen, J. J., Zarrett, N. R., & Eccles, J. S. (2007). I like to do it, I’m able, and I know I am: Longitudinalcouplings between domain-specific achievement, self-concept, and interest. Child Development, 78(2), 430–447.doi:10.1111/j.1467-8624.2007.01007.x
Doucleff, M. (2018, May 21). Is sleeping with your baby as dangerous as doctors say? National Public Radio.Retrieved from https://www.npr.org/sections/goatsandsoda/2018/05/21/601289695/is-sleeping-with-your-baby-as-dangerous-as-doctors-say
Dowker, A., Sarkar, A., & Looi, C. Y. (2016). Mathematics anxiety: What have we learned in 60 years? Frontiers inPsychology, 7, 1–16. doi:10.3389/fpsyg.2016.00508
Eccles, J. Wigfield, A., Harold, R. D., & Blumenfeld, P. (1993). Age and gender differences in children’s self- andtask perceptions during elementary school. Child Development, 64(3), 830–847.
Eccles, J. S., & Wigfield, A. (1995). In the mind of the actor: The structure of adolescents’ achievement task valuesand expectancy-related beliefs. Personality and Social Psychology Bulletin, 21(3), 215–225. doi:10.1177/0146167295213003
Etchegary, H., & Perrier, C. (2007). Information processing in the context of genetic risk: Implications for genetic-risk communication. Journal of Genetic Counseling, 16(4), 419–432. doi:10.1007/s10897-006-9082-z
Fagerlin, A., Zikmund-Fisher, B. J., Ubel, P. A., Jankovic, A., Derry, H. A., & Smith, D. M. (2007). Measuringnumeracy without a math test: Development of the Subjective Numeracy Scale (SNS). Medical Decision Making,27(5), 672–680. doi:10.1177/0272989X07304449
Fazio, L. K., Bailey, D. H., Thompson, C. A., & Siegler, R. S. (2014). Relations of different types of numerical mag-nitude representations to each other and to mathematics achievement. Journal of Experimental Child Psychology,123, 53–72. doi:10.1016/j.jecp.2014.01.013
Fazio, L. K., DeWolf, M., & Siegler, R. S. (2016). Strategy use and strategy choice in fraction magnitude compari-son. Journal of Experimental Psychology: Learning, Memory, and Cognition, 42(1), 1–16. doi:10.1037/xlm0000153
Fazio, L. K., Kennedy, C. A., & Siegler, R. S. (2016). Improving children’s knowledge of fraction magnitudes. PLoSOne, 11(10), e0165243. doi:10.1371/journal.pone.0165243
Fitzsimmons, C., Thompson, C. A., & Sidney, P. G. (2019). Confident or familiar? The role of familiarity and frac-tion estimation precision on metacognition. Paper to be presented at the 41th annual meeting North AmericanChapter of the International Group for the Psychology of Mathematics Education, St. Louis, MO.
Fennema, E., & Sherman, J. A. (1976). Fennema-Sherman mathematics attitudes scales: Instruments designed tomeasure attitudes toward the learning of mathematics by females and males. Journal for Research inMathematics Education, 7(5), 324–326. doi:10.2307/748467
Fuchs, L. S., Malone, A. S., Schumacher, R. F., Namkung, J., & Wang, A. (2016). Fraction intervention for studentswith mathematics difficulties: Lessons learned from five randomized controlled trials. Journal of LearningDisabilities, 50(6), 631–639. doi:10.1177/0022219416677249
Gunderson, E. A., Ramirez, G., Levine, S. C., & Beilock, S. L. (2012). The role of parents and teachers in the devel-opment of gender-related math attitudes. Sex Roles, 66(3-4), 153–166. doi:10.1007/s11199-011-9996-2
Halpern, D. F., Benbow, C. P., Geary, D. C., Gur, R. C., Hyde, J. S., & Gernsbacher, M. A. (2007). The science ofsex differences in science and mathematics. Psychological Science in the Public Interest, 8(1), 1–51. doi:10.1111/j.1529-1006.2007.00032.x
Hamdan, N., & Gunderson, E. A. (2017). The number line is a critical spatial-numerical representation: Evidencefrom a fraction intervention. Developmental Psychology, 53(3), 587–596. doi:10.1037/dev0000252
Hartnett, P., & Gelman, R. (1998). Early understandings of numbers: Paths or barriers to the construction of newunderstandings? Learning and Instruction, 8(4), 341–374. doi:10.1016/S0959-4752(97)00026-1
Hattikudur, S. D., Sidney, P. G., & Alibali, M. W. (2016). Does comparing informal and formal procedures pro-mote mathematics learning? The benefits of bridging depend on attitudes towards math. Journal of ProblemSolving, 9(1), 13–27. doi:10.7771/1932-6246.1180
Hyde, J. S., Fennema, E., & Lamon, S. (1990). Gender differences in math performance: A meta-analysis.Psychological Bulletin, 107(2), 139–155. doi:10.1037//0033-2909.107.2.139
Judd, C. M., McClelland, G. H., & Ryan, C. S. (2009). Data analysis: A model comparison approach (2nd ed.). NewYork, NY: Routledge.
Landy, D., Charlesworth, A., & Ottmar, E. (2017). Categories of large numbers in line estimation. CognitiveScience, 41(2), 326–353. doi:10.1111/cogs.12342
Lauermann, F., Tsai, Y. M., & Eccles, J. S. (2017). Math-related career aspirations and choices within Eccles et al.’sexpectancy–value theory of achievement-related behaviors. Developmental Psychology, 53(8), 1540–1559. doi:10.1037/dev0000367
Lee, I. A., & Preacher, K. J. (2013). Calculation for the test of the difference between two dependent correlations withone variable in common [Computer software]. Retrived from http://quantpsy.org
Lenhard, W., & Lenhard, A. (2016). Calculation of effect sizes. Bibergau: Psychometrica. Retrieved from https://www.psychometrica.de/effect_size.html
Lipkus, I. M. (2007). Numeric, verbal, and visual formats of conveying health risks: Suggested best practices andfuture recommendations. Medical Decision Making, 27(5), 696–713. doi:10.1177/0272989X07307271
Lortie-Forgues, H., Tian, J., & Siegler, R. S. (2015). Why is learning fraction and decimal arithmetic so difficult?Developmental Review, 38, 201–221. doi:10.1016/j.dr.2015.07.008
Ma, X., & Kishor, N. (1997). Assessing the relationship between attitude towards mathematics and achievement inmathematics: A meta-analysis. Journal for Research in Mathematics Education, 28(1), 26–47. doi:10.2307/749662
Moss, J., & Case, R. (1999). Developing children’s understanding of the rational numbers: A new model and anexperimental curriculum. Journal for Research in Mathematics Education, 30(2), 122–147. doi:10.2307/749607
National Governors Association Center for Best Practices, Council of Chief State School Officers. (2010). Commoncore state standards for mathematics. Retrieved from http://www.corestandards.org/Math/
Neale, D. C. (1969). The role of attitudes in learning mathematics. The Arithmetic Teacher, 16(8), 631–640.Ni, Y., & Zhou, Y. (2005). Teaching and learning fraction and rational numbers: The origins and implications of
whole number bias. Educational Psychologist, 40(1), 27–52. doi:10.1207/s15326985ep4001_3Opfer, J. E., & DeVries, J. M. (2008). Representational change and magnitude estimation: Why young children can
make more accurate salary comparisons than adults. Cognition, 108(3), 843–849. doi:10.1016/j.cognition.2008.05.003
Opfer, J. E., & Siegler, R. S. (2007). Representational change and children’s numerical estimation. CognitivePsychology, 55(3), 169–195. doi:10.1016/j.cogpsych.2006.09.002
Pajares, F. (1996). Self-efficacy beliefs in academic settings. Review of Educational Research, 66(4), 543–578. doi:10.3102/00346543066004543
Pajares, F., & Graham, L. (1999). Self-efficacy, motivation constructs, and mathematics performance of enteringmiddle school students. Contemporary Educational Psychology, 24(2), 124–139. doi:10.1006/ceps.1998.0991
Parker, M., & Leinhardt, G. (1995). Percent: A privileged proportion. Review of Educational Research, 65(4),421–481. doi:10.3102/00346543065004421
Petty, R. E., & Bri~nol, P. (2014). The elaboration likelihood and meta-cognitive models of attitudes: Implicationsfor prejudice, the self, and beyond. In J. Sherman, B. Gawronski, & Y. Trope (Eds.), Dual-process theories of thesocial mind (pp. 172–187). New York, NY: Guildford Press.
Sidney, P. G., & Alibali, M. W. (2015, October). Conceptual change in children’s number categories: The integrationof fraction and whole number knowledge. Poster presented at the biennial meeting of the Cognitive DevelopmentSociety in Columbus, OH.
Sidney, P. G., & Alibali, M. W. (2017). Creating a context for learning: Activating children’s whole number know-ledge prepares them to understand fraction division. Journal of Numerical Cognition, 3(1), 31–57. doi:10.5964/jnc.v3i1.71
Sidney, P. G., Thalluri, R., Buerke, M., & Thompson, C. A. (2018). Who uses more strategies? Linking mathematicsanxiety to adults’ strategy variability and performance on fraction magnitude tasks. Thinking & Reasoning, 25,94–131. doi:10.1080/13546783.2018.1475303
Siegler, R. S. (2016). Magnitude knowledge: The common core of numerical development. Developmental Science,19(3), 341–361. doi:10.1111/desc.12395
Siegler, R. S., Duncan, G. J., Davis-Kean, P. E., Duckworth, K., Claessens, A., Engel, M., … Chen, M. (2012).Early predictors of high school mathematics achievement. Psychological Science, 23(7), 691–697. doi:10.1177/0956797612440101
Siegler, R. S., Fazio, L. K., Bailey, D. H., & Zhou, X. (2013). Fractions: The new frontier for theories of numericaldevelopment. Trends in Cognitive Sciences, 17(1), 13–19. doi:10.1016/j.tics.2012.11.004
Siegler, R. S., & Opfer, J. E. (2003). The development of numerical estimation: Evidence for multiple representa-tions of numerical quantity. Psychological Science, 14(3), 237–243. doi:10.1111/1467-9280.02438
Siegler, R. S., & Thompson, C. A. (2014). Numerical landmarks are useful-except when they’re not. Journal ofExperimental Child Psychology, 120, 39–58. doi:10.1016/j.jecp.2013.11.014
Siegler, R. S., Thompson, C. A., & Schneider, M. (2011). An integrated theory of whole number and fractionsdevelopment. Cognitive Psychology, 62(4), 273–296. doi:10.1016/j.cogpsych.2011.03.001
Sinayev, A., Peters, E., Tusler, M., & Fraenkel, L. (2015). Presenting numeric information with percentages anddescriptive risk labels: A randomized trial. Medical Decision Making, 35(8), 937–947. doi:10.1177/0272989X15584922
Singh, K., Granville, M., & Dika, S. (2002). Mathematics and science achievement: Effects of motivation, interest,and academic engagement. The Journal of Educational Research, 95(6), 323–332. doi:10.1080/00220670209596607
Sowinski, C., Dunbar, K., & LeFevre, J. (2014). Calculation fluency test (Unpublished technical report). Ottawa,Canada: Math Lab, Carleton University.
Steiger, J. H. (1980). Tests for comparing elements of a correlation matrix. Psychological Bulletin, 87(2), 245.doi:10.1037/0033-2909.87.2.245
Thompson, C. A., & Opfer, J. E. (2010). How 15 hundred is like 15 cherries: Effect of progressive alignment onrepresentational changes in numerical cognition. Child Development, 81(6), 1768–1786. doi:10.1111/j.1467-8624.2010.01509.x
Tian, J., & Siegler, R. S. (2018). Which type of rational numbers should students learn first? Educational PsychologyReview, 30(2), 351–372. doi:10.1007/s10648-017-9417-3
Torbeyns, J., Schneider, M., Xin, Z., & Siegler, R. S. (2015). Bridging the gap: Fraction understanding is centralto mathematics achievement in students from three different continents. Learning and Instruction, 37, 5–13.doi:10.1016/j.learninstruc.2014.03.002
Vamvakoussi, X., Christou, K. P., Mertens, L., & Van Dooren, W. (2011). What fills the gap between discreteand dense? Greek and Flemish students’ understanding of density. Learning and Instruction, 21(5), 676–685.doi:10.1016/j.learninstruc.2011.03.005
Vamvakoussi, X., & Vosniadou, S. (2010). How many decimals are there between two fractions? Aspects of second-ary school students’ understanding of rational numbers and their notation. Cognition and Instruction, 28(2),181–209. doi:10.1080/07370001003676603
Van Hoof, J., Vandewalle, J., Verschaffel, L., & Van Dooren, W. (2015). In search for the natural number bias insecondary school students’ interpretation of the effect of arithmetical operations. Learning and Instruction, 37,30–38. doi:10.1016/j.learninstruc.2014.03.004
Van Hoof, J., Verschaffel, L., & Van Dooren, W. (2015). Inappropriately applying natural number properties inrational number tasks: Characterizing the development of the natural number bias through primary and second-ary education. Educational Studies in Mathematics, 90(1), 39–56. doi:10.1007/s10649-015-9613-3
Wang, M. T., Eccles, J. S., & Kenny, S. (2013). Not lack of ability but more choice: Individual and gender differen-ces in choice of careers in science, technology, engineering, and mathematics. Psychological Science, 24(5),770–775. doi:10.1177/0956797612458937
Waters, E. A., Fagerlin, A., & Zikmund-Fisher, B. J. (2016). Overcoming the many pitfalls of communicating risk. InHandbook of health decision science (pp. 265–277). New York, NY: Springer. doi:10.1007/978-1-4939-3486-7_19
Webb, R. M., Lubinski, D., & Benbow, C. P. (2002). Mathematically facile adolescents with math-science aspira-tions: New perspectives on their educational and vocational development. Journal of Educational Psychology,94(4), 785–794. doi:10.1037/0022-0663.94.4.785
Weigel, R. H., Vernon, D. T., & Tognacci, L. N. (1974). Specificity of the attitude as a determinant of attitude-behavior congruence. Journal of Personality and Social Psychology, 30(6), 724–728. doi:10.1037/h0037540
Wigfield, A., & Eccles, J. S. (2000). Expectancy–value theory of achievement motivation. Contemporary EducationalPsychology, 25(1), 68–81. doi:10.1006/ceps.1999.1015
Wigfield, A., Eccles, J., Maclver, D., Reuman, D., & Midgley, C. (1991). Transitions at early adolescence: Changesin children’s domain-specific self-perceptions and general self-esteem across the transition to junior high school.Developmental Psychology, 27, 552–565.
Wigfield, A., Eccles J.S., Yoon, K. S., Harold, R. D., Arbreton, A., Freedman-Doan, C., & Blumenfeld, P. C. (1997).Changes in children’s competence beliefs and subjective task values across the elementary school years: a three-year study. Journal of Educational Psychology, 89(3), 451–469.
Note. Relationships with whole-number and fraction performance (�) were tested by comparing nested models with and with-out the associated predictors: whole-number-magnitude estimation and whole-number fluency for whole-number perform-ance and fraction-magnitude estimation (0 to 1, 0 to 5), fraction-magnitude comparison, and fraction arithmetic for fractionperformance. Thus, F values associated with each model comparison test, rather than t values associated with individualpredictors, are reported here and in the text. Unstandardized regression coefficients are reported.
THE JOURNAL OF EXPERIMENTAL EDUCATION 31
Table B5. Study 3 relationships with general attitudes regression analysis results.