64
Chilean Health Reform Challenges & Pitfalls May 22 – 2008 Rodrigo Castro Libertad & Desarrollo www.lyd.org
| Date post: | 28-Dec-2015 |
| Category: |
Documents |
| Upload: | adelia-goodwin |
| View: | 219 times |
| Download: | 5 times |

Chilean Health Reform Challenges & Pitfalls
May 22 – 2008
Rodrigo CastroLibertad & Desarrollo
www.lyd.org

Outline
• How is Chilean health status?• How is Chilean health system?How is Chilean health system?• Why does AUGE arise?• What does AUGE mean? • How much does AUGE cost?• Will it be worth it?• What are the main challenges in our
health care system?
Main IssuesMain Issues

How much to How much to spend?spend?
Public Health Public Health Expenditure Expenditure
(mill (mill USUS$200$20044))
0
500
1000
1500
2000
250019
8719
8819
8919
9019
9119
9219
9319
9419
9519
9619
9719
9819
9920
0020
0120
02
million
s US
$ 04
-10%
-5%
0%
5%
10%
15%
20%
annu
al re
al c
hang
e (%
)
Expenditure Real Change (%)
Expenditure

How much to How much to spend?spend?
International International BenchmarkingBenchmarking
Expenditure
Fuente: OECD
Australia Austria Belgium
Canada
Czech Republic
Denmark
Finland
France Germany
Greece
Hungary
Iceland Ireland Italy
Japan
Korea
Luxembourg
Mexico
Netherlands
New Zealand
Norway
Poland
Portugal
Slovak Republic
Spain Sweden
Switzerland
Turkey
United Kingdom
United States
CHILE
y = 0.0853x - 160.84R2 = 0.7162
0
500
1000
1500
2000
2500
3000
3500
4000
4500
5000
0 5000 10000 15000 20000 25000 30000 35000 40000 45000 50000GDP
Heath expenditure

Expenditure
How much to How much to spend?spend?
Public & Private Per Public & Private Per capita expenditurecapita expenditure
200
44
344
148
050
100150200250300350400
1990
1991
1992
1993
1994
1995
1996
1997
1998
1999
2000
2001
US$
2004
public private

How is Chile’s health status ?
Health Status
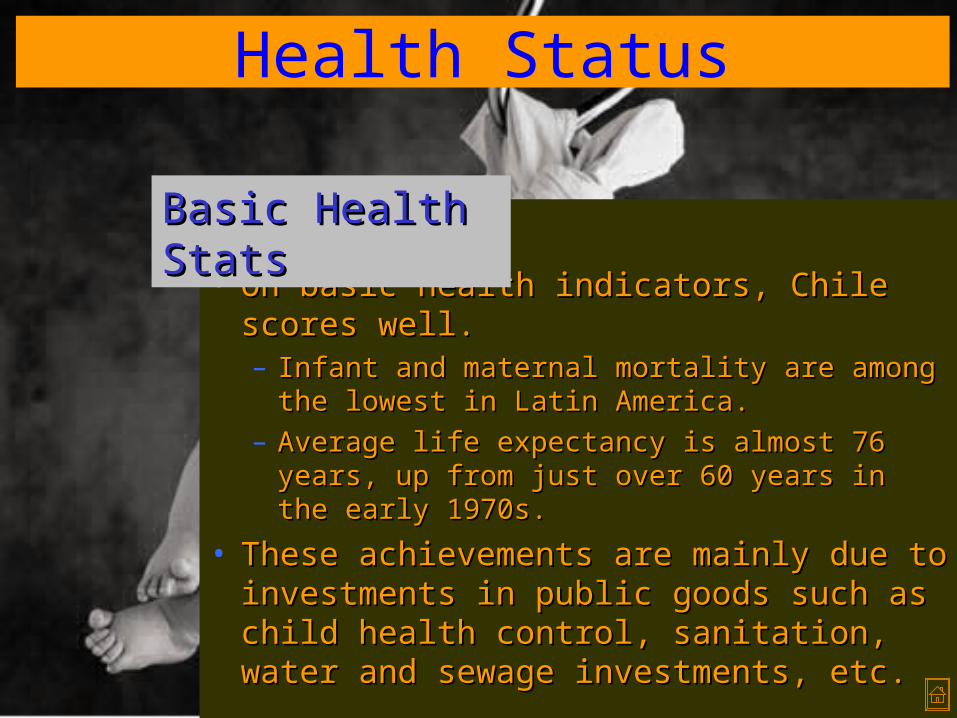
• On basic health indicators, Chile On basic health indicators, Chile scores well. scores well. – Infant and maternal mortality are among Infant and maternal mortality are among
the lowest in Latin America.the lowest in Latin America.– Average life expectancy is almost 76 Average life expectancy is almost 76
years, up from just over 60 years in the years, up from just over 60 years in the early 1970s.early 1970s.
• These achievements are mainly due to These achievements are mainly due to investments in public goods such as investments in public goods such as child health control, sanitation, water child health control, sanitation, water and sewage investments, etc.and sewage investments, etc.
Basic Health Basic Health StatsStats

Health Status
StatisticsStatistics
10
020406080
100120140160180
1945
1950
1955
1960
1965
1970
1975
1980
1985
1990
1995
1998
Rate
for 1
000
NV
5,4
0
5
10
15
20
25
1945
1950
1955
1960
1965
1970
1975
1980
1985
1990
1996
1997
Rate
eve
ry 10
00
Infant MortalityInfant Mortality General MortalityGeneral Mortality

Health Status
StatisticsStatistics
Source : INE(1) Average number of babies born to women during their reproductive years
Demographic Demographic IndicatorsIndicators
1970 1982 1992 1997 2000 2003
Life Expectancy 63.6 71.3 72.2 75.3 76.0 77.0Fertility rate (1) 3.4 2.8 2.6 2.5 2.4 1.9Population growth 1.8 1.8 1.6 1.3 1.2 1.0% pop. 0-14 39.2 32.2 29.4 28.6 28.1 27.3% pop. + 65 5.0 5.8 6.6 7.0 7.3 7.5Mortality rate 8.7 6.1 5.5 5.4 5.5 5.3Infant Mortality rate
82.2 23.6 14.3 10.0 8.3 7.8
Maternal Mortality rate
1.7 0.4 0.3 0.2 0.2 0.1

Health Status
StatisticsStatistics
Source : INE
Main death causesMain death causes
1970 1982 1992 1997 2000 2003
Cardiovascular 22.3 27.6 29.0 26.4 27.7 27.0Malignant tumors 12.0 16.8 20.0 21.7 21.8 23.0Injuries 19.0 12.1 12.0 10.6 9.3 9.0Respiratory diseases
17.4 8.5 11.1 12.7 14.0 9.0
Digestive diseases 6.9 8.6 6.3 7.5 6.7 8.0Ill-defined causes 4.5 8.8 5.6 4.7 4.5 3.0Infectious & parasitic
10.9 3.8 2.9 3.1 2.7 2.0
Perinatal causes 5.0 3.5 1.9 1.3 1.1 1.0Others 2.0 10.3 11.2 12.0 12.2 8.0

Health Status
StatisticsStatistics
Notes: (1) % GDP (2) in USD PPP (3) 1998, each 100.000 NB Source: World Development Report 2000/2001
International International ComparisonComparison
Countries Health Expend (1)
Per capita expend (2)
Life exp Inf Mort (3) Physic. (100K hab)
Germany 10.5 2.365 74;80 5.0 350
Argentina 8.2 823 70;77 19.0 268
Brazil 6.5 428 63;71 33.0 127
Chile 6.1 581 72;78 8.3 110
Colombia 9.3 507 67;73 23.0 116
USA 13.7 3.724 74;80 7.0 279
Spain 8.0 1.211 75;82 5.0 424
Japan 7.1 1.759 77;84 4.0 193

Health System
• 2 systems2 systems– Poorly linkedPoorly linked– Population is segmented by risk and incomePopulation is segmented by risk and income
• CentralismCentralism– Historical public policiesHistorical public policies
• Big public sector, was design in the Big public sector, was design in the 1950s1950s– InercyInercy– There is no leadershipsThere is no leaderships
• Interest groups have important powerInterest groups have important power
OrganizationOrganization

Health System
OrganizationOrganization
Healt
h r
isk
Income
Private Sector
Public Sector
D+ fiscal transfers
D+ per capita income
Dual Insurance Dual Insurance SchemeScheme

Health System
OrganizationOrganization Insurance Price Insurance Price SchemeScheme
price
income
FONASA
ISAPRE
price
risk
FONASA
ISAPRE

Health System
OrganizationOrganization Public Sector Public Sector OrganizationOrganization
Ministry of Health
Super of Isapres
Health Services
Fonasa
Isapres
Private Health Care Providers
Public Hospitals
Municipalities
Primary Health Care Centers

Health System
OrganizationOrganization Financing SchemeFinancing Scheme
Fonasa
Non Contributors (indigents)
Public Hospitals
Contributors
Isapres
Municipalities -Primary Health Care Centers
Private Health Care Provider
7%
co
ntrib
utio
n
7% contributionFree Choice (copayment
)
Free Service
Copayment (income)
Copayment

Health System
• Poorly management performance due to Poorly management performance due to wrong incentives:wrong incentives:– Financing does not follow good management Financing does not follow good management
practices.practices.– Human Resources policy is poorly defined. Human Resources policy is poorly defined. – There is no competition between public There is no competition between public
hospitals.hospitals.– Unfair competition against private sector Unfair competition against private sector
(Chart).(Chart).– Public hospitals which must offer free care to Public hospitals which must offer free care to
the poor, are overstretched and grossly the poor, are overstretched and grossly inefficient Details.inefficient Details.
– Since 1990 it has thrown three times more Since 1990 it has thrown three times more money with low productivity (Chart).money with low productivity (Chart).
OrganizationOrganization

Health System
ManagementManagement
0
500
1000
1500
2000
2500
3000
3500
4000
1990 1993 1996 1999 2003
publ
ic e
xpen
ditu
re (U
S$ m
ill
2004
)
0
0,2
0,4
0,6
0,8
1
1,2
Inde
x bas
e ye
ar 19
90 =
1
Expenditure EfficiencySource: Rodríguez & Tokman, 2000
Public Health Public Health System ProductivitySystem Productivity

Health System
Unfair CompetitionUnfair Competition
Assumption: household of three persons
Subsidy due to fiscal Subsidy due to fiscal aidaid
0
5.000
10.000
15.000
100.000
200.000
300.000
400.000
500.000
Per capita Contribution Public System Coverage
Subsidy due to Fiscal Aid
Govt Subsid

Health System
ManagementManagement
Source: Working Paper N°83
Hospitals Efficiency in Hospitals Efficiency in ChileChile• Overall level of technical inefficiency in the 4
groups of hospitals is in the range 30 to 94%• This is a combined inefficiency due to
operation at non-optimal scale (inappropriate hospital size) and pure technical inefficiency
• It implies that on average hospitals use about 30 to 94% more resources than what is required for the given output level.
• Then if the inefficient hospitals were to operate as efficiently as their peers on the frontier (benchmark) efficiency gains in terms of reduction in current expenditure would amount to US$107 millions.
Health System
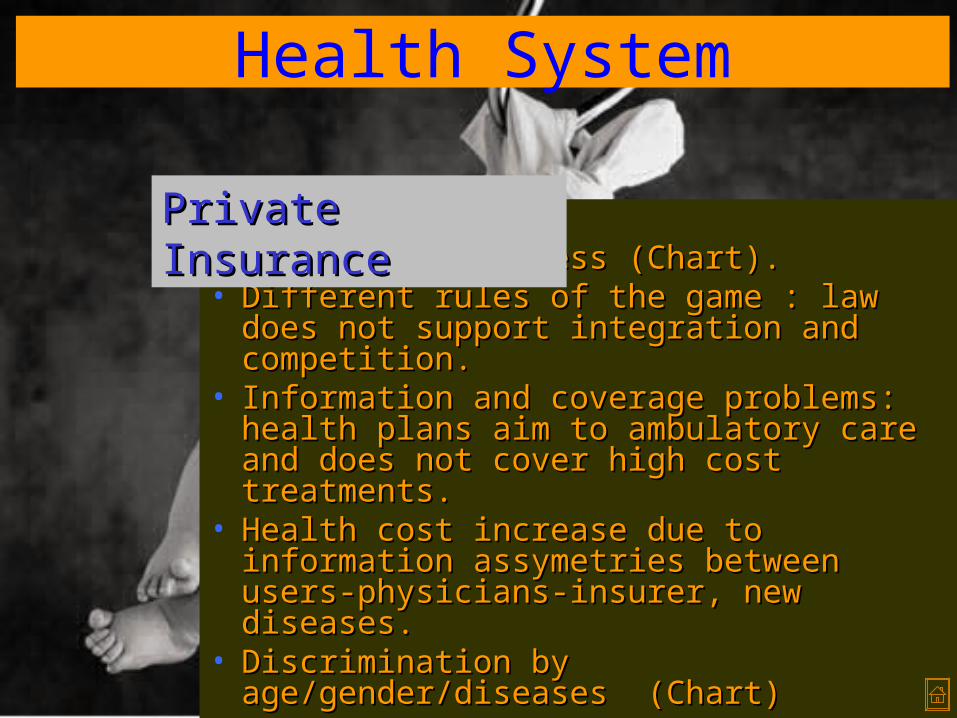
• Poor with no access (Chart).Poor with no access (Chart).• Different rules of the game : law does Different rules of the game : law does
not support integration and competition.not support integration and competition.• Information and coverage problems: Information and coverage problems:
health plans aim to ambulatory care and health plans aim to ambulatory care and does not cover high cost treatments.does not cover high cost treatments.
• Health cost increase due to information Health cost increase due to information assymetries between users-physicians-assymetries between users-physicians-insurer, new diseases.insurer, new diseases.
• Discrimination by age/gender/diseases Discrimination by age/gender/diseases (Chart)(Chart)
Private InsurancePrivate Insurance

Health System
No Access to No Access to PoorPoor
Insurees by quintile Insurees by quintile (2003)(2003)
91,1 85,4 76,460,5
33,6
1,6 5,611,2
24
50,5
0102030405060708090
100
I II III IV V
%
FONASA ISAPRES

Health System
Risk Selection by Risk Selection by gender/ age/illnessgender/ age/illness
0100.000
200.000300.000
400.000500.000
600.000700.000
0 10 20 30 40 50 60 70 80
age
Women Men
Costs by Gender and Costs by Gender and AgeAge

Health System
• Policy experts believe that current Policy experts believe that current health system won’t be able to face health system won’t be able to face with reasonable sucess the future with reasonable sucess the future sanitary challenges.sanitary challenges.
What’s the What’s the problem?problem?

Why does AUGE arise?

AUGE’s Philosophy
• Political issuesPolitical issues• Average conceals glaring inequalityAverage conceals glaring inequality• Population low satisfactionPopulation low satisfaction
Causes:Causes:

AUGE’s Philosophy
• ““Improve health for all, lowering life Improve health for all, lowering life lost because of premature mortality lost because of premature mortality or disability (DALYS) as well as, or disability (DALYS) as well as, lowering health inequalities, lowering health inequalities, improving health conditions of riskier improving health conditions of riskier groups”groups”
Sanitary Goals 2000-2010Sanitary Goals 2000-2010
Political issuesPolitical issues
AUGE’s Philosophy
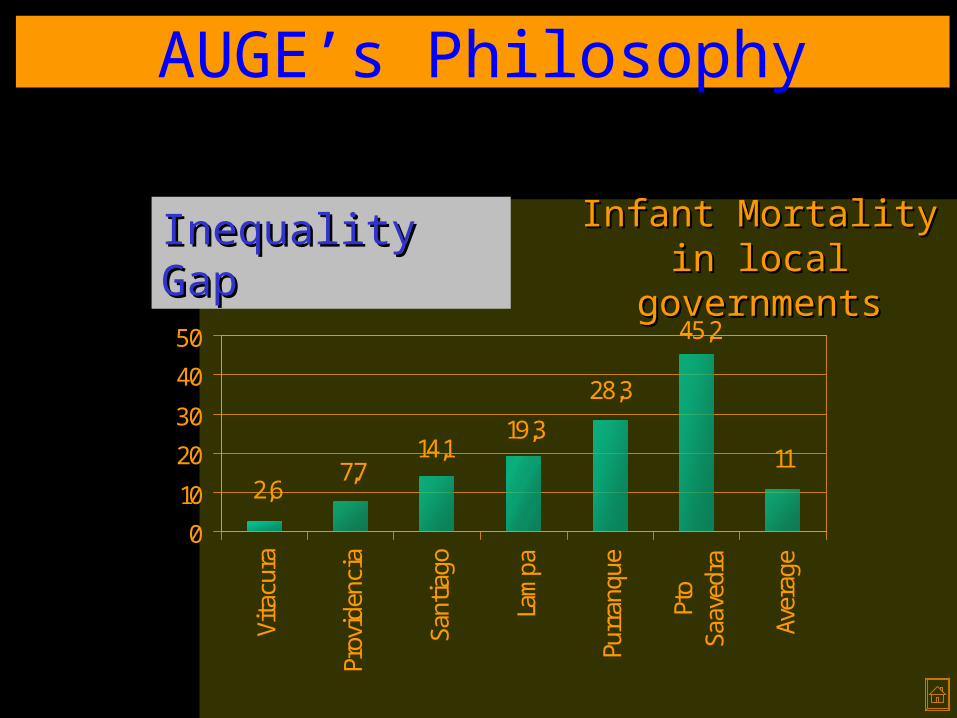
Inequality GapInequality Gap Infant Mortality in Infant Mortality in local governmentslocal governments
2,67,7
14,119,3
28,3
45,2
11
0
10
20
30
40
50
Vita
cura
Prov
iden
cia
Sant
iago
Lam
pa
Purr
anqu
e
Pto
Saav
edra
Aver
age

AUGE’s Philosophy
Health Health InequalityInequality
Infant Mortality by Infant Mortality by mother’s years of mother’s years of
schoolingschooling
0,05,0
10,015,020,025,030,035,0
00 01-0304-0607-0910-1213-+Average
Mother’s Years of Schooling
Mort
alit
y r
ate
(1
00
K N
B)
Neonatal Post-neonatal
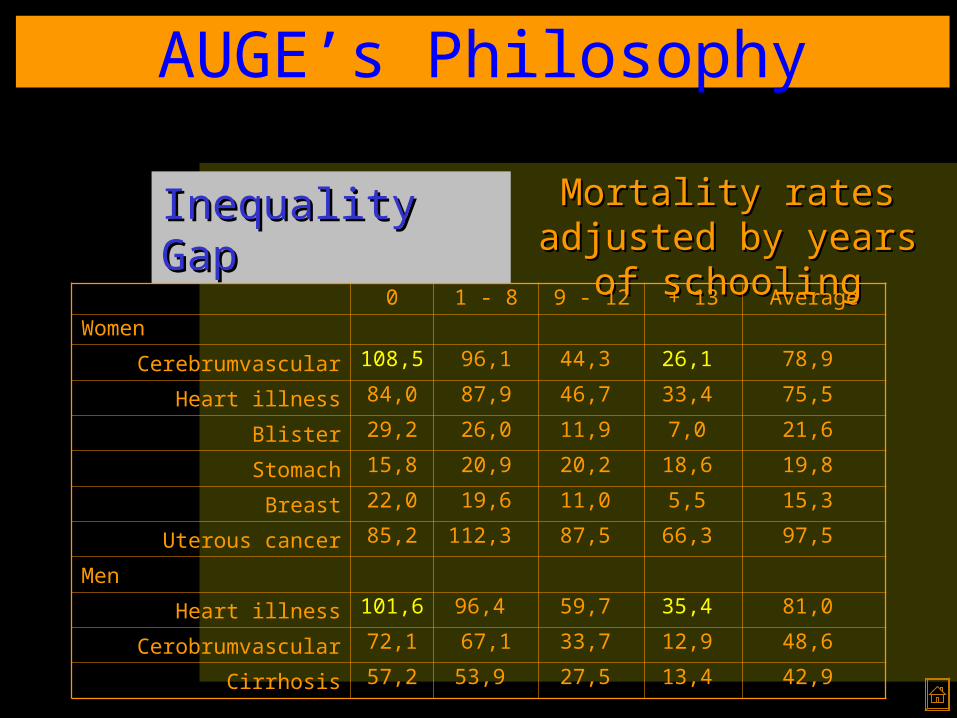
Inequality GapInequality Gap Mortality rates Mortality rates adjusted by years of adjusted by years of
schoolingschooling0 1 - 8 9 - 12 + 13 Average
Women
Cerebrumvascular 108,5 96,1 44,3 26,1 78,9
Heart illness 84,0 87,9 46,7 33,4 75,5
Blister 29,2 26,0 11,9 7,0 21,6
Stomach 15,8 20,9 20,2 18,6 19,8
Breast 22,0 19,6 11,0 5,5 15,3
Uterous cancer 85,2 112,3 87,5 66,3 97,5
Men
Heart illness 101,6 96,4 59,7 35,4 81,0
Cerobrumvascular 72,1 67,1 33,7 12,9 48,6
Cirrhosis 57,2 53,9 27,5 13,4 42,9
AUGE’s Philosophy

That mirrors our unequal income distribution

Income Income InequalityInequality
Source: Data 1970-1980, U of Chile. Data 90-2003, Household Survey, CASEN
Ratio 20/20: increase Ratio 20/20: increase from 9 from 9
to 14 times between to 14 times between 1970-031970-03
3,95,7
56,551,3
0102030405060708090
100
1970 1980 1990 1994 1996 1998 2000 2003
I II III IV V
AUGE’s Philosophy

AUGE’s Philosophy
Low Low SatisfactionSatisfaction
Source: CASEN 2000
Public Opinion about Public Opinion about their health condition their health condition
order by income order by income quintilesquintiles
60,8 66,6 68,1 75,5 82,9 71,3
7,6 6,1 5,2 1,9 5,68
0%
20%
40%
60%
80%
100%
I II III IV V TotalVery Good/Good Regular Bad

AUGE’s Philosophy
Low Low SatisfactionSatisfaction
Source: Altura Management
Public Hospitals long Public Hospitals long waiting listswaiting lists
Hospitals Patients Weeks
San Borja Arriarán
2,377 36
San José 3,327 28
San Juan de Dios
3,440 43
Salvador 2,062 90
Barros Luco 1,298 26
Sótero del Río 5,613 65
Total 18,117 50

AUGE’s Philosophy
Low Low satisfactionsatisfaction
Public Hospital Waiting Public Hospital Waiting ListsLists
AUGE’s Philosophy
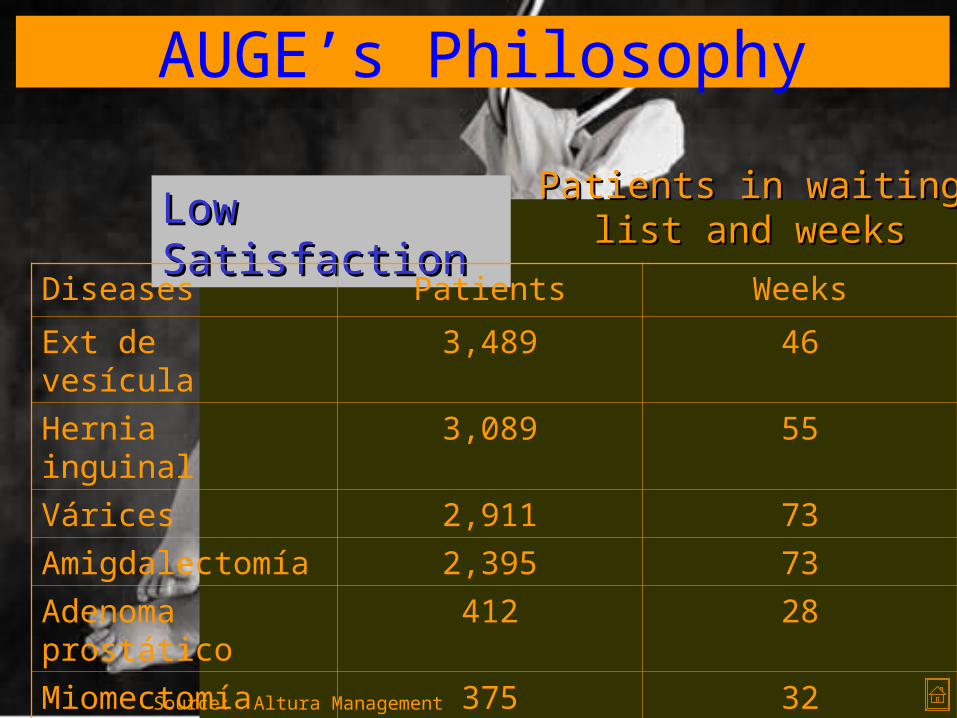
Low Low SatisfactionSatisfaction
Source: Altura Management
Patients in waiting list Patients in waiting list and weeksand weeks
Diseases Patients Weeks
Ext de vesícula 3,489 46
Hernia inguinal 3,089 55
Várices 2,911 73
Amigdalectomía 2,395 73
Adenoma prostático
412 28
Miomectomía 375 32
Endoprótesis cadera
285 62

AUGE’s Philosophy
• Demographic changesDemographic changes• Inequalities gapsInequalities gaps• Population expectationsPopulation expectations• Solve pending problems and Solve pending problems and
enhance enhance sanitary achievementssanitary achievements
4 Challenges4 Challenges

AUGE’s Philosophy
• Because people need to know what Because people need to know what to expect from health system and to expect from health system and what they should do if their what they should do if their expectations are not fulfill.expectations are not fulfill.
• It points out a world wide issue: It points out a world wide issue: health care is getting more health care is getting more expensive and current health care expensive and current health care system is not able to insurance system is not able to insurance “everything to everyone”.“everything to everyone”.
Why do we need to Why do we need to guarantee?guarantee?

AUGE’s Philosophy
• Ideal: total coverageIdeal: total coverage• Reality: set up priorities, direct Reality: set up priorities, direct
resources where they are most resources where they are most needed, while encouraging patients needed, while encouraging patients to demand their rights.to demand their rights.
• How do we define it?How do we define it?– Technical criteriaTechnical criteria– National Sanitary GoalsNational Sanitary Goals– Financial criteria andFinancial criteria and– Social and political criteriaSocial and political criteria
What kind of guarantee?What kind of guarantee?

What does AUGE mean?

AUGE
• Sanitary instrument which enhance Sanitary instrument which enhance equity and aims to achieve sanitary equity and aims to achieve sanitary and social protection goalsand social protection goals
• Set up health guaranteed planSet up health guaranteed plan
DefinitionDefinition
EXPLICIT GUARANTEE• Access• Opportunity • Quality• Financial protection

AUGE
• Collective:Collective:– Collective and individual actionsCollective and individual actions– Prevention and promotionPrevention and promotion
• Individuals:Individuals:– Current ailments offered by Current ailments offered by
FONASA (Public Health Insurance FONASA (Public Health Insurance Fund)Fund)
– Priorities with maximum or Priorities with maximum or intermediate guaranteeintermediate guarantee
ComponentsComponents

AUGE
• Ailments’ set up:Ailments’ set up:– MINSAL has to define ailments MINSAL has to define ailments
every 3 years.every 3 years.– Advise by Consultive CouncilAdvise by Consultive Council– Approve by joined Supreme Approve by joined Supreme
Decree of MoH and MoFDecree of MoH and MoF
How does it How does it work?work?

AUGE
• FONASA and ISAPRES would have to FONASA and ISAPRES would have to offer to their beneficiariesoffer to their beneficiaries
• Guarantee will enhance insurees’ Guarantee will enhance insurees’ rights.rights.
How does it How does it work?work?

AUGE
• Minimum Health Care Plan will offer Minimum Health Care Plan will offer guaranteed free or low-cost guaranteed free or low-cost treatment for 56 ailments that treatment for 56 ailments that between them are responsible for between them are responsible for three-quarters of years of life lost three-quarters of years of life lost because of premature or because of premature or disablement.disablement.
What does What does include?include?

AUGE
However,....However,....


How much does it cost?

Health Care Financing
• Government says the reform will add Government says the reform will add an extra an extra USD 230mUSD 230m to Chile’s total to Chile’s total spending on health of spending on health of USD 4.3billionUSD 4.3billion (or 6%of GDP). Most extra money (or 6%of GDP). Most extra money would come from the public purse.would come from the public purse.
• But, likely this reform will cost much But, likely this reform will cost much more than that...more than that...
Cost estimationCost estimation

Health Care Financing
• Is not the only reform that needs Is not the only reform that needs financial aidfinancial aid
Some bad Some bad news…news…
Rema, no más... Mira que tenemos que pagar el Chile Solidario, el Auge, las compensaciones por la baja de aranceles, la descontaminación de Santiago, las aguas lluvia, la crisis de la educación, el hoyo de la salud, la compra de tierras para los mapuches, el Miramar, las víctimas de los DD.HH., las obras para celebrar el bicentenario, la plata de los partidos políticos, las deudas de los municipios, los...

Health Care Financing
• AUGE - Pilot:AUGE - Pilot:– Heart diseasesHeart diseases– Kidney failureKidney failure– Infant canceInfant cance– Pain treatmentPain treatment– Uterous cancerUterous cancer
What does it What does it include ?include ?
US US Millions Millions
1.841.84
5.385.38
0.610.61
0.610.61
0.920.92
Total Total 9.369.36

Health Care Financing
• Where do we get these Where do we get these resources?resources?
ResourcesResources

Health Care Financing
• Solidarity in health care is rather limited in the current Chilean health care system. Money does not follow health needs.
• Also, private insurers are not really forced to compete on quality and efficiency of health care, but rather compete on risk selection (cream-skimming) which is a waste of resources.
Solidarity in health careSolidarity in health care

Health Care Financing
• With the introduction of a guaranteed health benefit package, the universal premium for which will be compensated by the Joint Compensation Fund (including a demand subsidy), a contribution to more equity and solidarity in health care financing and towards more efficiency and quality in health care delivery will be achieved.
Risk Compensation FundRisk Compensation Fund


Will it be worth it?

Remarks
• Main idea is correctMain idea is correct– Set up guarantee with patient rightsSet up guarantee with patient rights– Instrument aims to set up prioritiesInstrument aims to set up priorities– Focus on Primary Health Care, emphasis on Focus on Primary Health Care, emphasis on
promotion and preventionpromotion and prevention
• Murphy & Topel’s methodology:Murphy & Topel’s methodology:– In USA if cancer mortality rate drops in 1%, In USA if cancer mortality rate drops in 1%,
benefits will be about 6% of GDPbenefits will be about 6% of GDP– In Chile if mortality rate drops from 5.3 to 5.1 In Chile if mortality rate drops from 5.3 to 5.1
per thousand, benefits will be about 3.5% of per thousand, benefits will be about 3.5% of GDPGDP
– If mortality rate of diabetes mellitus drops in If mortality rate of diabetes mellitus drops in 10%, benefits will be 0.6 times AUGE’s cost10%, benefits will be 0.6 times AUGE’s cost
Main HighlightsMain Highlights

Remarks
• Financial restriction (estimated cost Financial restriction (estimated cost of this plan is over USD 300 million, of this plan is over USD 300 million, around ½ % of GDP). around ½ % of GDP).
• Reform is popular with the public Reform is popular with the public but not with health workers. but not with health workers. Doctors see standardised treatment Doctors see standardised treatment as a first step towards managed as a first step towards managed care and therefore as a threat to care and therefore as a threat to their income.their income.
However,…However,…

Remarks
• There is no enough technical capacity There is no enough technical capacity to:to:
– Design Treatment ProtocolsDesign Treatment Protocols– Training health workers and physiciansTraining health workers and physicians– BottlenecksBottlenecks
• Key to control the evolution of costs: Key to control the evolution of costs: granting more autonomy to hospitals granting more autonomy to hospitals and moving to more prospective and and moving to more prospective and performance related types of funding. performance related types of funding.
However,…However,…

Remarks
• Reform should limit opportunities Reform should limit opportunities for “cream skimming” in private for “cream skimming” in private health insurance and strengthen health insurance and strengthen patients’ rights.patients’ rights.
• Develop a system of indicators to Develop a system of indicators to monitor improvements over time monitor improvements over time (e.g patient feedback measures, (e.g patient feedback measures, rate of childhood vaccination and rate of childhood vaccination and mortality rates for key diseases)mortality rates for key diseases)
However,…However,…

Concluding RemarksWhat are the main challenges
in our health care system?
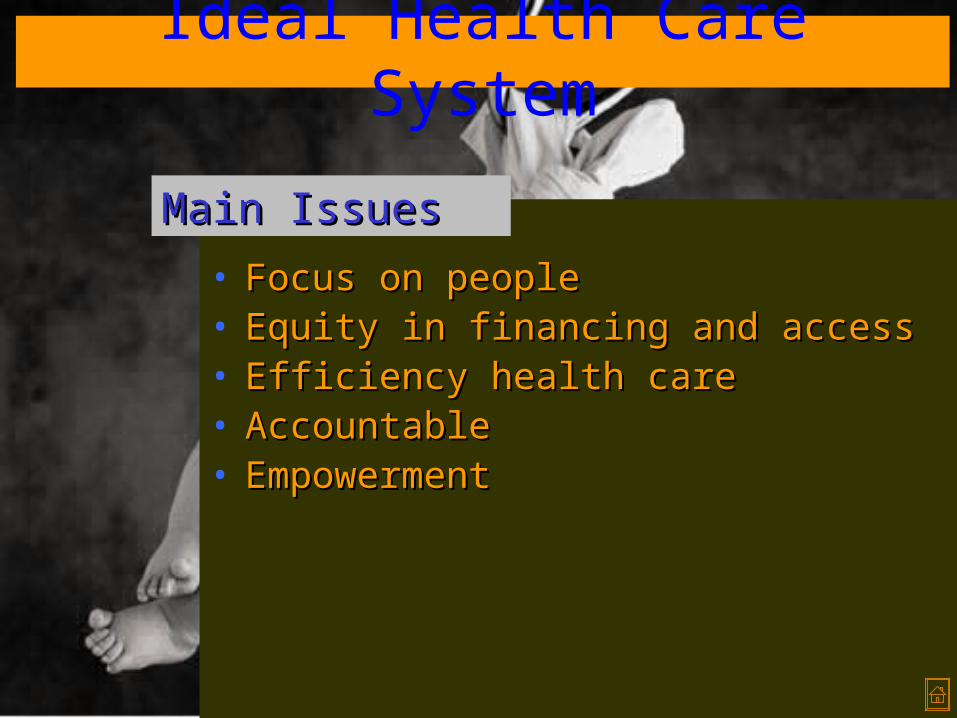
Ideal Health Care System
• Focus on peopleFocus on people• Equity in financing and accessEquity in financing and access• Efficiency health careEfficiency health care• AccountableAccountable• EmpowermentEmpowerment
Main IssuesMain Issues

Ideal Health Care System
• Empower peopleEmpower people• Move towards health subsidy portabilityMove towards health subsidy portability• Reform has to be gradually Reform has to be gradually
implemented.implemented.• Trade-off between cost containment and Trade-off between cost containment and
freedom to choosefreedom to choose• Trade-off between technical & economic Trade-off between technical & economic
efficiency and equityefficiency and equity• Enhance institutional policiesEnhance institutional policies• Better design of public choice issues Better design of public choice issues
involved in this Reform.involved in this Reform.
ChallengesChallenges

Chilean Health Reform Challenges & Pitfalls
May 22 – 2008
Rodrigo CastroLibertad & Desarrollo
www.lyd.org


