42
C ORPORATE P RESENTATION 2018

C O R P O R AT E P R E S E N TAT I O N 2 0 1 8

FOUNDED IN PIRQUE
Public company since 1933. Main ownership in two families with a long-term vision and passion for wine.
CHILE’S LEADINGWINE PRODUCER
HISTORY
2

HIGHLY RECOGNIZED WINE BRAND
LEADING CHILEAN EXPORTER
• 28.2 % by value• 33.3% by volume
LEADING GLOBAL WINE COMPANY
• SALES ~ US$ 1 BILLION• MARKET CAP. ~ US$ 1.7 BILLION
VIÑA CONCHA Y TORO AT A GLANCE
3

4
GLOBAL WINE COMPANY

CONSOLIDATED SALES
(US$ million)
5
528590
643735
872928 957
1018967 977 994
2007 2008 2009 2010 2011 2012 2013 2014 2015 2016 2017
AVERAGE ANNUAL GROWTH RATE 7%

SALES VOLUME
(million 9 liter cases)
6
26.3 27.5 28.8 29.7 30.1 30.6 30.733.2 34.3
36.2 34.8
2007 2008 2009 2010 2011 2012 2013 2014 2015 2016 2017
AVERAGE ANNUAL GROWTH RATE 3%
AVERAGE PRICE
CAGR +5%

7
SALES BY ORIGIN
CHILE
ARGENTINA
EEUU
81.6%
6.6%
11.8%
CHILE
ARGENTINA
EEUU
86.1%
6.7%
7.2%
VOLUME VALUE

20.4%CHILE*
8
32.7% EUROPE
19.3% USA & CANADA
15.3% LATIN AMERICA
11.0% ASIA &
OCEANIA
1.3% AFRICA & M.
EAST
BREAKDOWN OF SALES BY GEOGRAPHY
5.17.3 11.9 5.7 4.2 0.6
% OF SALES VALUE
VOLUME IN MILLION CASES
* Chile includes sales of “Other Non-Wine Products”

54,973
83,42593,432 92,701
86,267
2013 2014 2015 2016 2017
EBITDA
9
EBITDA & NET INCOME
33,174
43,051
49,797 47,931 49,575
2013 2014 2015 2016 2017
NET INCOME
(in million Ch$)
US$140 mm US$80.6 mm
Year-end exchange rate: Ch$/US$ 614.75

10
COUNTRY POSITION % ON EXPORTED VALUE OF BOTTLED WINE
China #1 10.6%
USA #1 29.8 %
Japan #1 30.1%
Brazil #1 16.5 %
UK #1 42.3 %
Holland #1 23.9 %
Canada #1 33.2 %
Ireland #2 26.4 %
South Korea #1 22.5 %
Mexico #1 50.2 %
TOTAL BOTTLED WINE #1 28.2%
LEADING EXPORTER OF CHILEAN WINE
28.2% of Chilean exports
by value
Source: Vinos de Chile - December 2017
Top 10 markets for Chilean wine

11
TOP 5 - LARGEST WINE COMPANIES
RANKING COMPANY MARKET SHARE BY VOLUME
1 ° E&J Gallo Winery Inc 3.04%
2 ° Constellation Brands Inc 1.80%
3 ° Wine Group Inc, The 1.35%
4 ° Treasury Wine Estates Ltd 1.21%
5 ° Viña Concha y Toro 1.14%
6 ° Castel Groupe 1.07%
7 ° Accolade Wines Ltd 1.05%
8 ° Pernod Ricard Groupe 0.92%
9 ° Grupo Peñaflor SA 0.91%
10 ° FeCoVitA Coop Ltda 0.87%
Source: Passport Euromonitor, The Company. (2016)

12
HIGHLY RECOGNIZED WINE BRAND
#1 Most Admired Wine Brands2011- 2012 – 2013
#2 Most Admired Wine Brands 2017 - 2018
#1 World’s Most Powerful Wine Brand2015

FROM A LEADING GLOBAL WINE COMPANY TO A LEADING CONSUMER - CENTRIC PREMIUM WINE COMPANY
STRATEGIC VISION

BUSINESS MODEL
VERTICAL INTEGRATED MODELINVOLVEMENT OVER ALL THE PRODUCTION PROCESS AND SUPPLY CHAIN,
GUARANTEES THE PRODUCTION OF QUALITY WINES
14
VINEYARDS
FROM THE VINEYARD TO THE BRANDS
DISTRIBUTIONWINEMAKING SUPPLY CHAIN
15
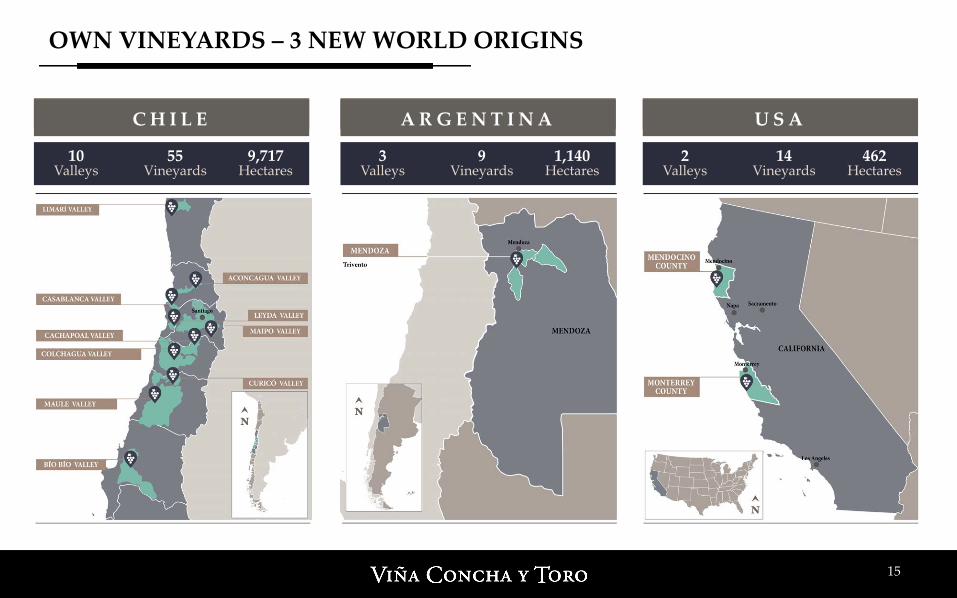
OWN VINEYARDS – 3 NEW WORLD ORIGINS
2 Valleys
14Vineyards
462Hectares
U S A
3 Valleys
9Vineyards
1,140 Hectares
A R G E N T I N A
10 Valleys
55Vineyards
9,717Hectares
C H I L E

Treasury Wine Estates(AUS/USA/NZ/IT)
Constellation (USA/CAD/NZ/IT)
E&J Gallo (USA)
0 2,000 4,000 6,000 8,000 10,000 12,000 14,000
(HECTARES)
11,319
7,247
13,259
VIÑA CONCHA Y TORO (CHI/ARG/USA)
Pernod Ricard (FR/AUS/ARG) 5,611
9,308
TOP 2 - IN TERMS OF SURFACE OF PLANTED VINEYARDS
16
8,782

Efficient and cost-effective operation to deliver world-class products to our customers with high quality standards.
17
SUPPLY CHAIN
U S A A R G E N T I N A
15 Cellar
4Bonling Plants
C H I L E
2 Cellar
1Bonling Plants
1 Cellar
1Bonling Plants

18
KEY MARKETS TO DEVELOP HIGH PERFORMING BRANDS
USA15.7%
CANADA3.5%
MEXICO3.0%
BRAZIL5.6%
CHINA2.7%
JAPAN5.7%
UK17%
NORDICS5.3%
CHILE20.4%
(% of sales by value)

19
• BRAND BUILDING• FOCUS ON VALUE

• Focus in the high-growth and higher-margin segments of the wine industry (>US$10 retail price).
• Brand Matrix: Identifies Potential/Relevance of the brands and aligns sales objectives and marketing investments.
20
SALES & MARKETING STRATEGY - FOCUS ON PREMIUM WINES
2017 SALES MIX (VALUE)
CHILE ARGENTINA USA TOTAL
PREMIUM 41.2% 52.5% 78.5% 46.8%
NON-PREMIUM 58.8% 47.5% 21.5% 53.2%

21
WINERIES AND KEY BRANDS OF THE GROUP
H O L D I N G
CHILE
15.8 MM CAJAS
CHILE
5.1 MM CAJAS
EEUU
2.5 MM CAJAS
ARGENTINA
2.2 MM CAJAS
CHILE
2.2 MM CAJAS

22
CONCHA Y TORO BRAND
FINE WINE PORTFOLIO Heritage and Innovation
CASILLERO DEL DIABLO Premium global brand

23
DON MELCHOR
96 PtsTIM ATKIN
96 PtsWINE SPECTATORHot Wine
94 PtsWINE ENTHUSIASTEditor’s Choice

24
MARQUES DE CASA CONCHA
92 PtsJAMES SUCKLING
90 PtsTIM ATKIN
“Revelation Wine”
93 PtsJAMES SUCKLING
93 PtsTIM ATKIN
93 PtsJAMES SUCKLING
90 PtsTIM ATKIN
CABERNET SAUVIGNONBLACK LABELROSÉ

SUCCESSFUL POSITIONING OF A GLOBAL BRAND IN THE PREMIUM CATEGORY
CASILLERO DEL DIABLO BRAND
USD 205 mm
2017
25

26
CASILLERO DEL DIABLO BRAND
UTRA PREMIUM
SUPER PREMIUM
PREMIUM PLUS
PREMIUM
L E Y E N D A F O B 2 0 0 U S D
R E S E R V A P R I V A D A F O B 6 0 U S D
R E S E R V A F O B 3 5 U S D
D E V I L ’ S C O L L E C T I O N F O B 4 5 U S D
P R E M I U M : 9 3 % U S $ P P , S P , U P : 7 % U S $

3,115 3,3603,777
4,4314,992
5,424 5,224
2011 2012 2013 2014 2015 2016 2017
2017SALES US$: + 2.1% AV. PRICE: + 5.7%
27
CASILLERO DEL DIABLO (THOUSAND CASES)
CAGR : 9%

28
LINE EXTENSIONS TO HIGHER PRICE SEGMENTS

29
BRAND RECOGNITION
91 PtsJAMES SUCKLING
90 PtsWINE SPECTATOR
RESERVA PRIVADA
#2 World’s Most Powerful Wine Brand
WINE INTELLIGENCE
93 PtsJAMES SUCKLING
91 PtsROBERT PARKER
LEYENDA

30
Expressive and innovative wines that
convey the spirit of the New World.
WINERIES AND GROUP BRANDS - CONO SUR
Strong commitment with the environment.
Leading producer of Pinot Noir.
#1 Pinot Noir in
the UK

31
706800
928
1,1201,260 1,326 1,394
2011 2012 2013 2014 2015 2016 2017
PREMIUM FOCUS - CONO SUR BICICLETA (THOUSAND CASES) 2017
SALES US$: + 4.8%
CAGR : 12%

32
Europe’s Most Sold Argentine Wine
Brand
WINERIES AND GROUP BRANDS- TRIVENTO
#1 Malbec in the UKTop 3 exporter from Argentina

33
CAGR+64%
PREMIUM FOCUS - TRIVENTO RESERVE (THOUSAND CASES) 2017
SALES US$ + 14.4%
88
199265
469
642713
2012 2013 2014 2015 2016 2017

34
Leading producer of organic grapes
WINERIES AND GROUP BRANDS - FETZER VINEYARDS
Largest wine company B Corp certified

35
PREMIUM FOCUS - BONTERRA
230
310353 377
446486
559
2011 2012 2013 2014 2015 2016 2017
(THOUSAND CASES) 2017:SALES US$ + 16.9%

36
PREMIUM FOCUS - 1000 STORIES (THOUSAND CASES) 2017
SALES US$ + 33.1%VOLUME + 36%
216
84
113
2014 2015 2016 2017

37
STRONG DISTRIBUTION NETWORK
• Diversification of markets and global presence
• Focus the commercial strategy on priority markets: Those important in value today and those with high future potential.
• Define and execute the best RTM for each of the priority markets.
• Develop and maintain strong relationships with key customers and distributors.

38
VISION OF SUSTAINABILITY
THE COMPANY INCORPORATES INITIATIVES WHICH
CONTRIBUTE TO MANAGING ECONOMIC, ENVIRONMENTAL AND SOCIAL FACTORS IN A BALANCED WAY IN THE ENTIRE
PRODUCTION PROCESS.
RATIONAL USE OF NATURAL RESOURCES
RESPONSIBLE WITH THE ENVIRONMENT
COMMITMENT TO PEOPLE AND COMMUNITIES

RESPONSIBLE SUPPLY
CARBON FOOTPRINT Measured since 2007
WATER FOOTPRINT Measured since 2010
RENEWABLE ENERGIES
NATIVE FOREST
39
• Light botles, 99% of total portfolio.• 30% reduction of the Carbon Footprint since 2012.
• 100% drip irrigation system in own vineyards.• Water Footprint 40% lower than the average of the global industry.
65% clean energy supply. moving towards the certification of the Energy Footprint aiming to reach 100% in 2020.
15% of suppliers respond to a program of good social and environmental practices.
Conservation of 3,372 certified and protected hectares, 100% with biodiversity inventories.
2020 Sustainability Strategy aligned with the United Nations SDGs.SUSTAINABILITY STATEGY
DOW JONES SUSTAINABILITY INDEX
Top 10 Beverages categoryViña Concha y Toro
OUR JOURNEY
VISION OF SUSTAINABILITY

BIDA BIOFILTER
· 100% waste water reuse.
· 85% more efficient.
CARBON NEUTRAL
First North American winery certified as “Carbon
Neutral".
40
UNITED NATIONS
Momentum For Change Climate solution Award
2017
FETZER VINEYARDS
First California winery that works completely with renewable energy.
VISION OF SUSTAINABILITY

41
CENTER FOR RESEARCH AND INNOVATION
Unique R+D+i winemaking research
center in Latin America
Scientific-technological innovation to face the
challenges of the business.
Technological development and knowledge exchange, for a more
competitive wine industry.MM $ 2,513
Investment in R+D
• More than 70 R+D projects in course • 54 extension activities during 2017
• 1,500m2 of modern modular building
• Cuning-edge equipment

42
CENTER FOR RESEARCH AND INNOVATION
STATEGIC R+D PROGRAMS
• Plant production health• Quality of grapes and wines• Water resources and climate change
• New product design• Smart wine industry
STATEGIC PARTNERSHIPS


