1 22 October 2003 Experience Brief for Chilika Lake Orissa, India Asish Ghosh Center for Environment and Development 1.0 Introduction The Lake Chilika, Asia’s biggest salt water lake in the eastern coast of India has a long history spanning over more than five thousand years. It has inspired the philosophers, poets and naturalists for its picturesque beauty of vast water spread area with a panoramic view of hills as a part of the Eastern Ghats in its background. The Lake once a part of Bay of Bengal provided excellent port facilities in the past. Commercial boats used to sail off from the lake to distant lands of Cambodia and Indonesia. To this day the villagers around Chilika Lake observes an annual festival called “Bali Yatra” (Journey to Bali in Indonesia). A place called Manikpatna is considered the site of this ancient port. The Chilika Lake is well known to the bird lovers for winter bird congregation migrating from distant lands; more than 100 of 211 species recorded from Chilika are intercontinental migrants flying of from Caspian Sea, Lake Baikal, Aral Sea and other remote parts of Russia, Kirghiz steppes of Mongolia, Central and Southeast Asia. The Lake Chilika attracts thousands of visitors for its serene beauty and rich natural landscape dotted with such islands named Beacon island, Breakfast island, Honeymoon island, Birds island (all christened during colonial era) and Somolo, Dumkudi, Parikud, Barunkuda (bearing the traditional Oriya name in local language). The local community have also deep religious attachments with Kalijai temple situated in yet another island; goddess Kalijai is venerated due to the folklore and legend. So are the ancient deity – Nabagraha located near the village Berhampur along the outer channel of the Lake and the Shiva temple in the village Alupatna in the same area. The Chilika Lake has therefore taken the place of pride in Asian Lake scenario for its richness of historical, social, cultural and religious traditions. 2.0 Background The Chilika Lake, (19 0 28’ - 19 0 54’ N latitude and 85 0 05’ - 85 0 38’E longitude), located in the east coast of state of Orissa, India is the largest lagoon in Asia. It is separated from Bay of Bengal by a sand bar whose width varies between 100 m to 1.5 km; a long outer channel stretching of 32 km connects the main lagoon with the Bay of Bengal near a village name Arakhukuda. Spread over three coastal districts of the state viz., Puri, Khurda and Ganjam, the
Transcript
1
22 October 2003
Experience Brief for Chilika Lake Orissa, India
Asish Ghosh
Center for Environment and Development 1.0 Introduction The Lake Chilika, Asia’s biggest salt water lake in the eastern coast of India has a long history spanning over more than five thousand years. It has inspired the philosophers, poets and naturalists for its picturesque beauty of vast water spread area with a panoramic view of hills as a part of the Eastern Ghats in its background. The Lake once a part of Bay of Bengal provided excellent port facilities in the past. Commercial boats used to sail off from the lake to distant lands of Cambodia and Indonesia. To this day the villagers around Chilika Lake observes an annual festival called “Bali Yatra” (Journey to Bali in Indonesia). A place called Manikpatna is considered the site of this ancient port. The Chilika Lake is well known to the bird lovers for winter bird congregation migrating from distant lands; more than 100 of 211 species recorded from Chilika are intercontinental migrants flying of from Caspian Sea, Lake Baikal, Aral Sea and other remote parts of Russia, Kirghiz steppes of Mongolia, Central and Southeast Asia. The Lake Chilika attracts thousands of visitors for its serene beauty and rich natural landscape dotted with such islands named Beacon island, Breakfast island, Honeymoon island, Birds island (all christened during colonial era) and Somolo, Dumkudi, Parikud, Barunkuda (bearing the traditional Oriya name in local language). The local community have also deep religious attachments with Kalijai temple situated in yet another island; goddess Kalijai is venerated due to the folklore and legend. So are the ancient deity – Nabagraha located near the village Berhampur along the outer channel of the Lake and the Shiva temple in the village Alupatna in the same area. The Chilika Lake has therefore taken the place of pride in Asian Lake scenario for its richness of historical, social, cultural and religious traditions. 2.0 Background The Chilika Lake, (190 28’ - 190 54’ N latitude and 850 05’ - 850 38’E longitude), located in the east coast of state of Orissa, India is the largest lagoon in Asia. It is separated from Bay of Bengal by a sand bar whose width varies between 100 m to 1.5 km; a long outer channel stretching of 32 km connects the main lagoon with the Bay of Bengal near a village name Arakhukuda. Spread over three coastal districts of the state viz., Puri, Khurda and Ganjam, the
2
lake covers an area of 1165 sq. Km., in monsoon and 906 sq. Km in summer. The pear shaped lake has a maximum linear axis of 64.3 km with average mean width of 20.1 km. The lake receives freshwater from a series of more than 32 channels. Hydrologically, Chilika is influenced by three subsystems viz. Mahanadi river system, rivers flowing in the lagoon from the Western catchment and the Bay of Bengal (fig-2). Construction of major hydraulic structures upstream have altered the flow pattern into Chilika. The long shore sediment transport along the coast of Bay of Bengal estimated to be 0.1 million metric tones annually tend to shift lagoon mouth opening to the sea every year thus adversely affecting the tidal exchange. This used to significantly affect salinity regime, flushing pattern and consequent natural recruitment of biological species. The spatial and temporal salinity gradients due to the freshwater flow from the riverine system and the seawater influx; gave it the unique characteristics of an estuarine eco-system, exercising a continuous and selective influence on its biota. 2.1 Biophysical Features The drainage basin of Chilika covers an area of over 4,300 sq. Km. (Das and Samal, 1988) including +_ 1,100 sq. Km. of the lagoon itself. The watershed boundaries lie between water flowing into the Mahanadi and Chilika in the north, while areas draining into the Bhargavi river make up the north east watershed; in the west and south west the watershed boundary lies between streams flowing into the Rushikulya river and those flowing into Chilika (Ram, Rao, Ghosh, 1994). The drainage basin in the north east consists of a large tract of alluvial land with elevations less than 30m above mean sea level. An area of rolling plains, located 30-150 m above msl lies in the north; however some higher hills reaching up to 600 m may be recorded in the north and western part. In this area of predominantly laterite soil, hill streams formed deep gullies and ravines, often interspersed with depression filled with alluvium. Eastern ghat mountain range form a part of west and south west with an elevation of over 600 m and strands of forests of Sal (Shorea), Dillenia and Pterospermum spp. These hilly tracts serve as the headwater region of several streams flowing into the lake (Asthana, 1979).
3
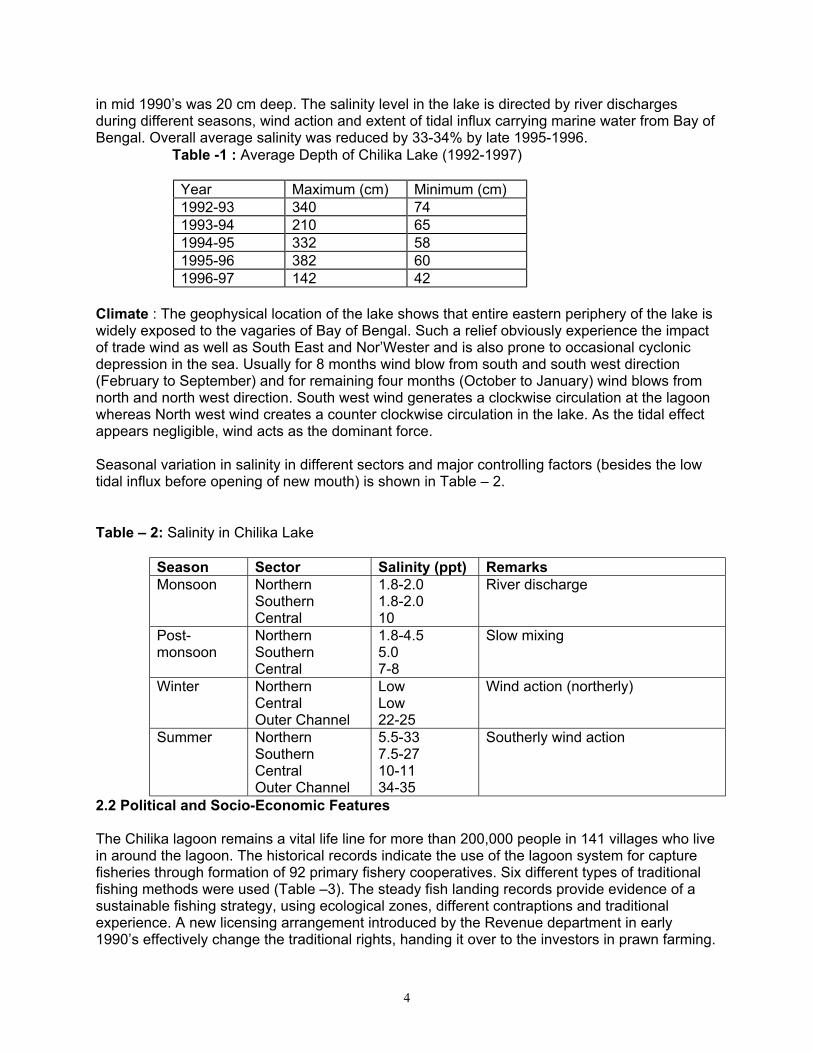
The average depth (Table – 1) of the lake is 50 cm in the northern sector, (which forms the major part) while the maximum of 3.7 m is seen in the central sector; the lake mouth
4
in mid 1990’s was 20 cm deep. The salinity level in the lake is directed by river discharges during different seasons, wind action and extent of tidal influx carrying marine water from Bay of Bengal. Overall average salinity was reduced by 33-34% by late 1995-1996.
Table -1 : Average Depth of Chilika Lake (1992-1997)
Year Maximum (cm) Minimum (cm) 1992-93 340 74 1993-94 210 65 1994-95 332 58 1995-96 382 60 1996-97 142 42
Climate : The geophysical location of the lake shows that entire eastern periphery of the lake is widely exposed to the vagaries of Bay of Bengal. Such a relief obviously experience the impact of trade wind as well as South East and Nor’Wester and is also prone to occasional cyclonic depression in the sea. Usually for 8 months wind blow from south and south west direction (February to September) and for remaining four months (October to January) wind blows from north and north west direction. South west wind generates a clockwise circulation at the lagoon whereas North west wind creates a counter clockwise circulation in the lake. As the tidal effect appears negligible, wind acts as the dominant force. Seasonal variation in salinity in different sectors and major controlling factors (besides the low tidal influx before opening of new mouth) is shown in Table – 2. Table – 2: Salinity in Chilika Lake
Season Sector Salinity (ppt) Remarks Monsoon Northern
Southern Central
1.8-2.0 1.8-2.0 10
River discharge
Post-monsoon
Northern Southern Central
1.8-4.5 5.0 7-8
Slow mixing
Winter Northern Central Outer Channel
Low Low 22-25
Wind action (northerly)
Summer Northern Southern Central Outer Channel
5.5-33 7.5-27 10-11 34-35
Southerly wind action
2.2 Political and Socio-Economic Features The Chilika lagoon remains a vital life line for more than 200,000 people in 141 villages who live in around the lagoon. The historical records indicate the use of the lagoon system for capture fisheries through formation of 92 primary fishery cooperatives. Six different types of traditional fishing methods were used (Table –3). The steady fish landing records provide evidence of a sustainable fishing strategy, using ecological zones, different contraptions and traditional experience. A new licensing arrangement introduced by the Revenue department in early 1990’s effectively change the traditional rights, handing it over to the investors in prawn farming.
5
The introduction of prawn culture, gheri or bund fishery in 1991 has led the process of changes in the hydrology and sediment transport. This was largely due to the use of split bamboo and zero-mesh net, encircling the culture area, which prevented free sediment flow. The inflow of heavy discharge of silt through 16 major channels of a total of 52 freshwater channels, contributed to the changing lake-bed and rapid growth of macrophytes. Macrophytes proliferated due to declining salinity, nutrient flow from the catchment, blockage of the outlet to Bay of Bengal and additional nutrient load originating from prawn culture practices in the lagoon. The economic return from the lagoon to the traditional fishermen reached an all time low. Discontent finally led to protest march to the Secretariat, and angry fishermen demolishing gheri structure. Police firing led to death of four fishermen. The Chilika story became a National Press item. Table – 3: Traditional Fishery methods in Chilika Sl. No. Name Methods Period Percentage 1 “Bahani” - Net fishing - Throughout the
year -58%
2 “Janos” - Enclosure in shallow region by spilt bamboo and net
September – October (Leased August – February)
- 15%
3 Trap fishery “Dhaudi” & “Baja”
Box type bamboo basket with or without lead line; Dhaudi – large box, Baja – small box
___
- 25%
4 “Dian” Upland near Jano areas (for non fishermen community) 100-200 yards from the shore
____
1.5%
5 Uthapani Near shore, in shallow water both by fishers and non-fishers
June – July 0.5%
6 Prawn Khatties For capturing prawns – a total of 70 were operative
March – August
1. “Jano” and “Dhaudi-baja” have now been replaced by “Khonda” popularly called “Disco-net”,
“Khonda” has a “Barh” (wing) 20-60 cm length net of 20-25 mm mesh that meet Bichni – a ten meter semi-circular net area with 0 mm mesh with two box type trap or puda (2 m x 1.5 m x 1.5m) with net of 10-15 mm mesh.
2. Bahani fishes is replaced by gill cum drag netting. The community in the local drainage basin mainly subsist on agricultural practices but the villagers around the lagoon area depend on prawn culture (started after a Court verdict) and capture fisheries. Prawn trap traditionally involved bamboo nets or ‘khanda’, which allows free interchange of water; no fertilizer or antibiotic was used for such a process and it simply allowed prawn-catching from November every year; the trap method also allowed the juveniles to
6
escape. But the entire system changed in “gheri” or “bund fishery” where ‘o’ mesh nets are used encircling water areas with a supportive bamboo structure. The fish landing data collected by State fisheries department showed an average annual yield of 6000-8000 mt during 1970-1990 but it sharply declined to 1270 - 1630 mt in 1990-1997 period. The history of fishery rights is summarized in Table - 4. Table - 4: Fishery Rights in Chilika : Genesis Sl. No. Period System 1 Zamindar & Jagirdary
period (British colonial rule) Royalty to Raja of Purikud, Raja of Kalikote, Jagirdars
2 Anchal Adhikari of Chilika (1953-1959)
Open auction lease mostly to fishermen
3 CFCMS (1959-1988) Lease out to Primary Fishermen Co-operative Societies Limited; access to Non-fishermen
4 Policy Change December 31st 1991-92 vide Policy 1991
Rights to non-fishermen; prawn culture in the shore of Chilika at Sunamuhi under ERRP and IRDP scheme Forcible occupation of PFC areas
[Source: Ghosh, 1999 b , Final Technical Report for Chilika,] As a result of changed fishery policy, in spite of increase of number of boats, including mechanized boats only seven Primary Fishermen Cooperative Societies remained functional (out of 92) in the year 1998. 2.3 Institutional and Managerial Features The management of Chilika Lake was basically related to the activities of two major stakeholder departments till 1992, viz., the State Fisheries and the State Tourism Departments, besides the State Forest (Wildlife) Division entrusted to look after the Nalabana Sanctuary within Chilika. The concept of a Chilika Development Agency (CDA) (see annexure IV) emerged in 1992 with the following objectives:
i) to protect the lake ecosystem and its genetic biodiversity; ii) to survey, plan and prepare a proposal for integrated resource management in
and around the lake; iii) to understand multi-dimensional and multi-disciplinary development activities;
and iv) to cooperate and collaborate with other institutions for development of the lake.
The Chief Minister of the state is the chair person of the CDA , this institutional structure facilitated the integration and co- ordination between the stakeholder departments and organizations. It is an autonomous body borne under the administrative control of Environment Department. The executive body of the Authority is delegated with adequate financial power to take quick decision. However in spite of a creation of a nodal agency under the Chairmanship of the Chief Minister of the State, CDA did not play any significant role in any major policy making activities on Chilika. The Fishing Policy in Chilika was largely dictated by the Revenue Department. The
7
institutional framework of CDA could cater the basic requirements but with inadequate budgetary allocation, its impact on lake management could not be felt till 1997. The change of Chief Executive Officer in 1996-97 and the crisis situation facing Chilika led to first effective action but that too within limited scope of a political system. The need to change the fishing policy, the clash of interest between traditional fishermen and investors in shrimp culture could never be resolved by CDA. The institutional development was noted with additional funding support received from the 10th and 11th Finance Commission. The capacity building exercises and limited action for restoration of Chilika became evident in 1998. Chilika Development Authority developed linkages with more than forty institutions, stakeholders departments, agencies etc., for restoration of the lagoon. Historically, the political scenario in the State of Orissa changed during 1980’s. The real stakeholders were driven back or out; the first clash with fishermen in 1986 resulted in five deaths.The introduction of prawn farming within the lake in 1990’s led to further unrest. The State government failed to recognize the Supreme Court’s order of treating 1000 meter from HTL as ‘No Activity Zone’ in the lake; this itself could have stopped all prawn culture activities. The repetitive failure of local politician to understand the real root-causes led to firing in 29 May, 1999 resulting in the death of 4 fishermen. The fishermen had organized themselves under the banner of ‘The Chilika Matsyajibi Mahasangh’, which spearheaded the movement in 1999. In summary, repetitive administrative failure in arriving at a firm policy decision, alleged nexus between politicians and prawn culturists and denial of rights to the traditional fishermen community for their livelihood sustenance dominated the Chilika scenario till end of 20th century. While the net per capita income from fishing has been calculated at Rs. 500/- per month (i.e., 12 million per year) the actual turnover appears to be much higher. A rough calculation shows that at the current market price (of average fish landing at @8000 mt/pa), the economic return (turnover) at primary retail market amount to more than $100 million. Obviously the total turnover-benefit is shared by a number of beneficiaries starting from bulk purchasers to boat and net owners besides the working fishermen. The annual income of the fisher folk improved by 1200 US $ per family per annum after the hydrological intervention. 3.0 Biophysical Environment 3.1 Past and the Present Conditions 3.1.1 Biodiversity The Chilika lake was spread over 908 sq. km., in the summer and 1165 sq. km., during monsoon in the early part of 20th Century. (Annandale, 1915 - 1924). By mid 1980’s the average water spread was estimated at 790 sq. km., and by late 1990’s it has reduced to 760 sq. km., according to landsat TM data. Shrinkage has also been recorded in the lagoon inlet areas and the connecting outer channel. This can largely be attributed to reclamation of shoreline areas for agriculture, aquaculture and human settlements. The sediment inflow from the catchment further aggravated the process of shrinkage.
8
The faunal diversity of Chilika lake was first studied between 1915-1924 by Annandale and his group of scientists, from Indian Museum and Zoological Survey of India. The results of the study indicate nearly 600 species in the aquatic, island and shore areas of the lake; the past records of 428 species shows a positive trend of species diversity but earlier investigation on Platyhelminthes, Polychaetes, Birds have never been carried out systematically. It is noted that at least three species of brackish water porifera disappeared during 60 years as also a number of crustaceans (Brachyura and Decapods); of the 74 species of mollusks at least 50 species could not be traced during these year long surveys although total number of species increased to 87. Of the 69 species of fishes recorded from the lake during 1980’s, 24 species were freshwater fishes – the decline in total fish diversity from 217 species recorded earlier to 69 is perhaps most startling. In general, while the lake has been or known as a type locality for nearly 30 species of crustacea and 60 species of mollusks besides some other in the past, the profile of species diversity positively changed over 60 years; it may be noteworthy that even in 1980’s, eight new species of Platyhelminthes and five species of Nematode have been discovered from the lagoon (Ghosh et al, 1995); (Table - 5). Table – 5 : Lake Chilika : Species Diversity: A changing profile (1914 -15 to 1985-87) Sl. No.
Annandale (ed) (1915-1924)
Ghosh (ed) (1995)
1 Protozoa Few 61 2 Porifera 7 2 (Decline in
salinity) 3 Coelenterate 6 7 4 Platyhelminthes
Digenia N.A. 29 (2 new genera,
8 new species) 5 Nematode 4 37 (5 new species) 6 Polychaetes N.A. 31 7 Crustacea
[Annandale, N. (ed) 1915-1924. The Fauna of Chilika Lake. Mem. Indi. Mus., 5 (1-13): 1-1003; Ghosh, A. K. (ed) 1995. Fauna of Chilika Lake . 1-672, Wetland Ecosystem Series 1. Zoological Survey of India.]
Unfortunately similar accounts of flora over a time series is not available
The most recent account (Roy, Anirban, Ph.D. Thesis, C.U., 2001) of floral diversity ( before the new mouth was opened in 1999-2000 ) provides an account of 72 genera of phytoplankton and 8 genera of sea weeds from different sectors of lake at different season. This plays a key role in the food chain of the lake ecosystem. Phytoplankton genera include Bacillariophyceae (35), Chlorophyceae (20), Myxophyceae (12), Dinophyceae (3) and Xanthophyceae (1). Sea weeds number 12 species under 8 genera belonging to Chlorophyceae (7 spp), Charophyceae (1 spp) and Rhodophyceae (7 spp) only in the marine and brackish water zone. Sea grasses include Halophila and Ruppia. Aquatic macrophtes belongs to Vittate (9), Rosulate (1), Ptenstophyte (12), Epihydate (6), Hyperhydate (6) and Helophyte (33) growth classes, totally 67 species. Macrophyte concentration seems to be densest in the northern sector followed by outer channel and southern sector. It is further reported (Roy, Aniban, Ph.D. Thesis, Unpub., C.U., May 2001) that Chilika lake system harbours at least 185 species of plants in the aquatic and terrestrial islands which are of known medicinal properties. Of the total floral diversity in the lake area, at least 10 species are used as local vegetable, 15 as fodder, 6 for thatching, 12 for fish food, 56 for bird feeding and nesting besides 185 for medicinal purposes. As such use class category of plant resources provide a vital resource base for local community as also for other birds, fishes and other biota.
In summary out of 389 species of flora, (Dicots – 288, Monocots – 80, Pterydophytes – 9, Sea weeds – 12), 84 species strictly belong to aquatic plant categories. Of the aquatic plants 5 species of sea grasses (Halophila becarii, Halophila minor, Halophila ovalis, Ramamurtiaoa, and Ruppia maritima ) are considered threatened due to extensive prawn culture and habitat change; similarly at least one species of algae (Rosenvingea) and a species of mangrove Aegiceras corriculatum (L) Blanco, are now considered threatened.
It is also noted that at least 63 species and sub-species of plants reported between 1913-1988, could not be traced during 1996-2000 period; of these at least 15 are aquatic or semi-aquatic plants. The impact of opening of mouth and increase in salinity is apt to bring out some changes
10
in the aquatic vegetation of the lake; a future research project can only provide the changing profile. Due to increase in the salinity the area occupied by the fresh water invasive species in the northern sector is reducing. Similarly the less fluctuation of salinity is favoring the growth of the sea grass of central sector.
Apart from this, the lake provided unique habitat for avian fauna both resident and migratory, which led to setting up “Nalbana” - a part of the lake as a sanctuary. The peak population of birds varied between 4,47,511 (1985) to 7,56, 396 (in 1993) but according to Wetlands International it reached 14,54,186 in 1996. The tourist traffic during the same period visiting the lake obtains the great benefit of the vast wetland habitat, as does the waterfowl. However, at least 20 species of reptiles, birds and mammals recorded in Chilika are considered threatened or vulnerable. 3.1.2 Salinity Salinity is one of the most dominant factor which determines the ecosystem of the lagoon. The lagoon as mentioned earlier, is connected to the Bay of Bengal by a narrow inlet and constricted outer channel . The inlet frequently tends to shift to the north affecting the tidal influx into the main lagoon. The mean surface salinity is affected by influx of freshwater from the western catchments and from the adjacent Mahanadi River delta, estimated at 3,75,000 cusecs every year. The latter flows are delivered by three channels of the river Mahanadi viz., Daya, Nuna, Bhargavi. The sediment buildup at Chilika mouth and Palur canal in Ganjam district connecting lake with the ocean, reduced the saline water influx over years. This can be evidenced from the following Table - 6. Table – 6: Salinity level in Chilika
Year of Recording Average Salinity 1957 27-33 ppt 1960-61 13-20 ppt 1961-64 9.4-11.8 ppt 1995 1.38-6.3 ppt
The reduction in the salinity level has resulted in a significant change in fish catches composition (Table-7). Such changes can be attributed to gradual decline in rate of recruitment of marine elements due to blockade at the mouth and inhospitable habitat with low salinity. Table – 7: Rank Order changes of Ten different Commercial Fisheries of Chilika due to loss of salinity
3.1.3 Sedimentation Major silt load to the lagoon is carried by Daya, Bhargavi and luna rivers the distributaries of Mahanadi river system. A sediment flow monitoring programme initiated by the Department of Water Resources in five rivers (viz., Daya and Bhargavi in northern sector and Malaguni, Kusmi and Salea in the western sector) showed that approximately 1.5 million tonnes of sediment enters in the lagoon in the north and 0.3 million tonnes sediment enters in the western sector. (S. S. Pattnaik, 2002). Vertical accumulation of sediment has exceeded the relative sea level rise. Obviously the fate of the lagoon depend on combination of accretion (difference between vertical accumulation rate and RSL rise) and local RSL rise, which determines the volumetric capacity of the lagoon. The siltation and reduction in salinity level has resulted in rapid growth of the invasive weed species in the northern sector and free movement of juveniles of prawns and mullets from the sea into the lagoon and vice versa. Breeding and spawning ground of many important fishes, mollusks and paenid prawns have been affected due to siltation. The upstream erosion and sedimentation process in the lagoon directly contributed to the loss of depth of lake bed as also to the choking of mouth; this in turn led to decline in salinity. 3.1.4 Water Quality 3.1.4 Water Quality The water is usually well oxygenated but decomposition of organic detritus may lead to high BOD value in the northern sector, after the opening of the passage to the ocean, which led to rapid die-off of the freshwater macrophytes. Nutrient load in the form of high Nitrate – N concentrations are observed in winter months due to land drainage carrying agricultural fertilizers. Data collected by the author for the years 1986-87 to 1997-98 shows that within a decade, use of fertilizer has become nearly double at 8 monitoring stations. The runoff from agriculture become severe due to lack of adequate soil conservation measure; in addition at least 25 million gallons of untreated waster water from the capital city in Bhubanshwar find way to Chilika via Gengua nala and Daya river. Siltation, declining salinity and inflow of nutrients led to extensive growth of macrophytes. Free floating invasive species e.g., Azolla , Eichhornia and Pistia and emerging species e.g., Ipomea become a common sight. Weed infestation increased from 20 sq. km., in 1973 to 440 sq. km., in 1998. Paspalum vaginatum, Paspalidium punctatum, Potamogetom nodosus, Potamogeton pectinatus dominate the macrophyte community; Potamogeton alone accounts for 78% invasion. A Utkal University study indicated that while a positive correlation could be established between macrophyte growth and total phosphorus (average 18 mg/l) and nitrate nitrogen (0.002 mg/l to 1.80 mg/l). pH level has no apparent influence on growth of macrophytes. Unfortunately,
12
the effects of changes in flows and timings because of the barrages in the Mahanadi River for irrigation and flood control have never been documented. 3.2 Lake and Drainage Basin Resource Conflicts The major conflict in the drainage basin arises from demand of intensification of agriculture to be supported by irrigation, chemical fertilizer and pesticides. The 2nd spiral study under OWRCP (1997-98) shows as many as 49 irrigation related projects involving construction of dams and barrages are coming up in the Mahanadi system. Cumulative impact of such mass intervention on Chilika freshwater flow has to be assessed. This is being addressed through an environmental flow assessment exercise under aegis of OWRCP. Agricultural Intensification Programme (AIP) sponsored under OWRCP is likely to further intensify the agricultural work; in Rushikulya basin alone nearly 6200 ha has been targeted with 25% increase in fertilizer use. In the lagoon area itself, conflict started with the changing basic policy entitling non-fishermen community to use water spread area for traditional culture fishery. Major conflict started with big investment pouring in from other parts of the state or even from outside the state. The functioning of Primary Fishermen Co-operative Societies gradually slowed down and almost ceased to work. The agitated fishermen made writ petition, submitted memoranda and went to the Secretariat demanding abolition of unauthorized shrimp culture within the water spread area of the lagoon. Two incidence of police firing leading to loss of life (the last one in May 1999) led the Government to issue an executive instruction to ban all kinds of culture fishery in the lagoon. During this period, (in early 1990’s), the house of Tata’s, one of the top three industrial houses had proposed a large aquaculture project but local agitation forced the government and the investor to withdraw. The conversion of capture fishery (locally JANO) in fringe area of the lagoon in Puri district during 1988-92 led to 61 new culture ponds.; the district administration in Puri allowed 40% of the area to be changed in culture fisheries, which also fuelled agitation by traditional fishermen.
4.0 Management Environment
4.1.1 Lake Environment Improvement
The basic programme of opening a new mouth can be considered as a first step to improve the lake environment. EIA studies undertaken (E & M) before and after the artificial mouth was opened showed marked improvement in terms of salinity, weed-free area, recruitment of marine elements, flushing of silts, and finally the total productivity increase both for fin-fishes and shell fishes.
The new mouth also reduced the distance between the lagoon and the sea by 18 km facilitating migration of both caladramons and anadramons species. Paenaeus indicus, a shrimp species reappeared in the lake system due to environmental improvement and constituted nearly 50% of total shrimp landing data.
The lake system hosts over 160 species of birds in the peak migratory season of which at least 97 are inter-continental migrants (Ram et al., 1994). After the restoration programme started Bombay Natural History Society’s team recorded nesting colonies of Gull-billed Tern in Nalabana, establishing its southern breeding range extension. During the same period (2002) Indian River Tern, a least studied group was found to nest in Nalabana (540 nest records). These records further established the significant welcome changes in the lake environment.
13
SAP component of Nalabana Bird Sanctuary Habitat Improvement Programme therefore yielded some positive results within a short period of time. The lake environment is also directly linked with the land use pattern and agricultural practices followed in the basin area. During the SAP, micro watershed based soil conservation programme was initiated to reduce flow of silt into the lake system. This in conjunction with the efforts of trapping significant silt load at Naraj Barrage are likely to reduce the annual silt flow. E & M for checking silt flow also indicate the same. Latest information shows that a participatory micro watershed management has been initiated in three villages covering 640.45 ha. The objective is to create capacity building at community level through a series of training programme towards integrated and holistic management of micro watershed. This model is already providing encouraging results in terms of effective training as also income generation activities through proper water resource management. Now the results in 2003 indicate a marked improvement in Lake Environment. The major achievements besides the ones discussed earlier may be summarized as :
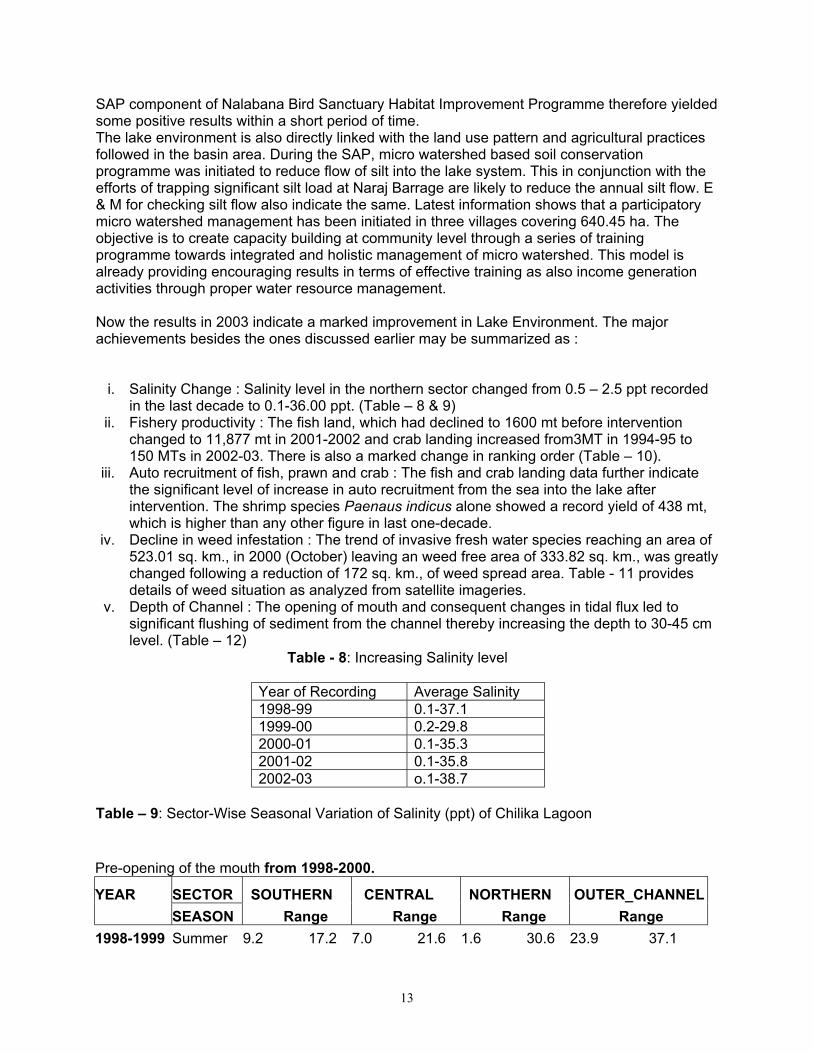
i. Salinity Change : Salinity level in the northern sector changed from 0.5 – 2.5 ppt recorded in the last decade to 0.1-36.00 ppt. (Table – 8 & 9)
ii. Fishery productivity : The fish land, which had declined to 1600 mt before intervention changed to 11,877 mt in 2001-2002 and crab landing increased from3MT in 1994-95 to 150 MTs in 2002-03. There is also a marked change in ranking order (Table – 10).
iii. Auto recruitment of fish, prawn and crab : The fish and crab landing data further indicate the significant level of increase in auto recruitment from the sea into the lake after intervention. The shrimp species Paenaus indicus alone showed a record yield of 438 mt, which is higher than any other figure in last one-decade.
iv. Decline in weed infestation : The trend of invasive fresh water species reaching an area of 523.01 sq. km., in 2000 (October) leaving an weed free area of 333.82 sq. km., was greatly changed following a reduction of 172 sq. km., of weed spread area. Table - 11 provides details of weed situation as analyzed from satellite imageries.
v. Depth of Channel : The opening of mouth and consequent changes in tidal flux led to significant flushing of sediment from the channel thereby increasing the depth to 30-45 cm level. (Table – 12)
Table - 8: Increasing Salinity level
Year of Recording Average Salinity 1998-99 0.1-37.1 1999-00 0.2-29.8 2000-01 0.1-35.3 2001-02 0.1-35.8 2002-03 o.1-38.7
Table – 9: Sector-Wise Seasonal Variation of Salinity (ppt) of Chilika Lagoon
Pre-opening of the mouth from 1998-2000.
YEAR SECTOR SOUTHERN CENTRAL NORTHERN OUTER_CHANNEL SEASON Range Range Range Range 1998-1999 Summer 9.2 17.2 7.0 21.6 1.6 30.6 23.9 37.1
Year Maximum (cm) Minimum (cm) 1998-99 480 40 1999-00 682 35 2000-01 677 28 2001-02 540 31 2002-03 586 29
Seasonal Variation of salinity in different sector (1998-2003)
0
5
10
15
20
25
30
35
40
April 9
8-99
April 9
9-200
0
April -2
000-0
1
April 0
1-02
April 0
2-03
July
98-99
July
99-20
00
July
2000
-01
July
01-02
July
02-03
Octobe
r 98-9
9
Octobe
r 99-2
000
Octobe
r 200
0-01
Octobe
r 01-0
2
Octobe
r 02-0
3
Janu
ary 98
-99
Janu
ary 99
-2000
Janu
ry 20
00-01
Janu
ry 01
-02
Janu
ary 02
-03
Year (Month)
Salin
ity le
vel
Southern Central Northern Outer Channel
Bombay Natural History Society’s is carrying out a study with Birds as a bio indicator since December 2001. The lake system now hosts over 211(BNHS) species of birds in the peak migratory season of which 97 are intercontinental migrants coming from Caspian sea, Baikal, Aral Sea, remote parts of Russia, Kirghiz Steppes of Magnolia, Central and South east Asia, Ladakh and the great Himalayas (Dev,1990) . Included in these are some rare birds as it falls in the central Asia flyway. The important bird species of the lagoon are Anser clypeata, Aythya
16
ferina, Anas querquedula, Anas penelope, Anas fuligula, Anser strepera, Limnodromus semipalmatus and Eurynorhynchus pygmeus. The other interesting and threatened species are spoon-billed sandpiper (Eurynorhynchus pygmeus) and the Asian Dowithcher (Limnodromus semipalmatus) spot billed pelican (Pelecanus philippensis) dalmatian pelican (Pelecanus crispus) and pallas fishing eagle (Haliaeetus leucoryphus).
After the restoration programme, the BNHS team recorded nesting colonies of Gull-billed Tern in Nalabana, establishing its southern breeding range extension. During the same period (2002) Indian River Tern, a least studied group was found to nest in Nalabana (540 nest records). These records further established the significant welcome changes in the lake environment. SAP component of Nalabana Bird Sanctuary Habitat Improvement Programme therefore yielded some positive results within a short period of time.
The most recent account of the flora is by Pattnaik, A. K. (Unpublished Ph. D. Thesis, Utkal University, 2003) which reports the existence of 726 species of angiosperms belonging to 496 genera under 120 families from the lagoon and its immediate neighbourhood including its Islands, sand bar and shore lines. This represents about one-fourth of the flora of the State of Orissa which is estimated at 2,900 species. The predominance of members of Leguminosae, Poaceae and Cyperaceae was astriking feature of the flora. The occurrence of an apparent endemic species namely, Cassipourea ceylanica was recorded from Barkuda and Sanakuda islands in badly degraded condition, which is also known to occur in the coast of Madras and Sri Lanka.
Few mangrove associates like Aegiceras corniculatum, Excoecaria agallocha, Salvadora persica, Pongamia pinnata, Cassipourea ceylanica etc. have been recorded by Pattnaik (2003). The species of plants recorded from Chilika during the present study by CDA, which comes under the category of rare, vulnerable or threatened plants are Cassipourea ceylanica
Pattnaik (2003) enumerated the economic and useful plants of the lake and its environ including medicinal and aromatic plants, wild relatives of cultivated species, wild plants of horticultural importance and interesting plant groups like insectivorous plants, epiphytes, parasites, lithophytes etc.
The diversity and extent of distribution of seagrasses in Chilika lake has been assessed by Pattnaik (2003) and the occurrence of five species of seagrass in its true sense i.e. Halodule uninervis, Halodule pinifolia, Halophila ovalis, Halophila ovata and Halophila beccarii has been reported. Out of this, occurrence of Halodule uninervis, Halodule pinifolia and Halophila ovata from the lagoon were new distributional records.
4.1.2 GAPS
4.1.2.1 Wastewater Treatment and Pollution Control
17
One of the important area, which remains unattended is the prevention of inflow of untreated domestic wastewater from each of the 5 sewage discharge zone of the Capital City of Bhubaneshwar (approx., 25 million gallon) as also from 141 villages around the lake. A positive suggestion in this regard was given in SAP (Part II, p. 12) in possible linkage with Bhubaneshwar Development Authority and Orissa State Pollution Control Board. The wastewater characteristic from the Capital City shows a suspended solid (SS) (mg/l) figure at 275 as against the permissible limit of 30; the BOD, likewise shows an average figure of 110 as against permissible limit of 20 (OSPCB, 1998). Currently, a “Project Water” is being launched with ICEF funding for treatment of wastewater of the capital city but only to a limited scale.
The Orissa Water Supply and Sewage Board ,Government of Orissa has formulated a proposal for the Integrated Sewage and Waste Disposal scheme for abetment of pollution in the River Kuakhai and Daya draining in to Chilika at Bhubaneswar City, at a cost of 108 million US $.
4.1.2.2 Land Use Control
The other gap that is identified is apparent contradiction of Agricultural Intensification Programme (AIP) and OWRCP and control of runoff water laden with fertilizer from the basin into the lake. This was pointed out in Chilika Report under OWRCP (1998, 1999).
4.1.2.3 Eco-tourism
The present tourism activity at Chilika is focused around Rambha, Barkul and Satpada. During OWRCP study a growth rate of nearly 30% tourist between 1987-1997 was recorded. The introduction of motorized boats in the lagoon (as against conventional sail boat) and lack of specific demarcated channel to reach “Nalabana” led to a uncontrolled tourism activity. A report on tourism development was prepared by Tata Consultancy Services (TCS) in 1993 emphasizing eco-tourism. Subsequently Wetland International also prepared a document on ecotourism in Chilika. It is observed that more meaningful dialogue need to be established between Chilika Development Authority and State Tourism Department to implement a community based Ecotourism programme in Chilika (Lenka, 2002). The Tourism department Govt of Orissa have commissioned the services of a consultant for developing a master plan on Ecotourism. An orientation training programme for the boat men transporting tourists in the lagoon has been started.4.2 Reduction in Lake Stresses
4.2.1 The stress reduction achieved in Chilika lagoon is best exemplified by improvement in the salinity regime, and improvement of the depth of the lead channel after opening of the new mouth.
4.2.2 The stress reduction in the lake system is also noted by the decrease of the area covered by the invasive species and substantial increase in the weed free zone consequent upon desiltation operation.
4.2.3 The restoration programme period also recorded voluntary participation of fisher community in publicizing importance of use of right mesh size net (ref. www.chilika.com) and the ill effects of “zero-mesh” net. Ban on juvenile catch by fishers helped in significant high yield.
4.2.4 The participatory catchment area treatment (outside forest area) and afforestation programme inside degraded forest, initiated under SAP are also showing positive results. The increase in the income of the watershed community due to increase in production with soil moisture conservation, is also to be noted.
18
4.2.5 The restoration process through SAP helped in improving sea-grass meadows and their species diversity bed; improvement in the water level variation during tidal cycle turned the lagoon in to a pulsating mode.GAPS
4.2.6 Point Source Pollution: No quantified data on reduction of point source pollution (kg pollutants) is available till date.
4.2.7 Demarcation of “No fishing zone” : The recommendation in SAP is yet to be implemented. (vide recommendation –1 under SAP, July 1999; Ghosh, July 1999, p. 19)
4.2.8 The total impact of the projected 49 irrigation projects involving dams and barrage constructions in the Mahanadi basin of Chilika has not been linked with Chilika Management Plan although it was pointed out in the 2nd Technical Report on Chilika Lake under OWRCP (Ghosh, April 1999, p. 7). However, an environmental flow assessment has been initiated which is likely to be completed January 2004 (supported by World Bank).4.3 Environmental Status
The environmental status can best be determined by applying a set of indicators appropriate for the lake system. Keeping in view the major objectives in the management plan viz., control of silt and improved recruitment of marine elements, Public awareness, Augmentation of per capita income, the indicators provide following results.
4.3.1 Improved flow regime
The Management Intervention to improve tidal influx and salinity in the water spread area can be assessed from the significant change of salinity in the northern sector. The area was remaining a freshwater regime till the opening of the mouth and dredging outer channel; the salinity level changed from 0.5 to 2.5 ppt (recorded between 1990-1999) to 21.2 – 31.2 ppt. This is convincing proof for improved flow regime. This is further evidenced in reduction of freshwater weeds in 172 sq. km., weed free zone in one year (2000-2001).
4.3.2 Changes in local community income
The fishing landing data reached a all time low at the most degraded lake condition in 1997-98 (1600 mt), the intervention under SAP witnessed a record yield of 11877.81 mt in 2001-2002; so was the crab landing data showing a 10 fold increase from 10 mt to 111.07 mt. The total financial return due to the enhancement of fish and crab yield, based on average weighted price, enhanced by nearly INR 68 crore or Rs. 680 million. Per family average annual income increased by Rs. 50,000 (Source : www.chilika.com, Pers. Comm.with CDA).
4.3.3 Improved recruitment classes of targeted fish species
The recruitment of marine elements especially Mugil cephala Linn (loc. Khoinga) and Liza macrolepus (Smith) (In. danyln) which become increasingly rare during degraded period of the lake is a positive feature. About 40% of the typical fish catch originally depended on sea water migration and after lake SAP the proportion has been reportedly restored. Recruitment during February to May become highest because of opening of outlet. Seaward migration of prawn and lakeward migration of mullet fingerlings are now ensured through Muggermukh area after dredging and de-siltation.
19
Annual Fish Landing from Chilika Lagoon
0.00
2000.00
4000.00
6000.00
8000.00
10000.00
12000.00
14000.00
1985
-86
1986
-87
1987
-88
1988
-89
1989
-90
1990
-91
1991
-92
1992
-93
1993
-94
1994
-95
1995
-96
1996
-97
1997
-98
1998
-99
1999
-2000
2000
-2001
2001
-2002
2002
-2003
Year
Qty
. (M
T)
Landing (Qty. M.T)
Annual Crab Landing from Chilika Lagoon
0.00
20.00
40.00
60.00
80.00
100.00
120.00
140.00
160.00
1985
-86
1986
-87
1987
-88
1988
-89
1989
-90
1990
-91
1991
-92
1992
-93
1993
-94
1994
-95
1995
-96
1996
-97
1997
-98
1998
-99
1999
-2000
2000
-2001
2001
-2002
2002
-2003
Year
Qty
. (M
T)
Landing (Qty. M.T)
20
4.3.4 Return of flagship species Besides return of flagship mullet species reappearance of shrimp Paeneus indicus (loc. Kantala) is another indicator of environmental status change after SAP implementation. The crustacean species which became very rare during the period of degradation formed 2485.85 mt of the total catch of 11988.88 mt in 200, 1 which account for 20.51% During 2002-03 the crustacean landings further increased to 2628.63 MT accounting for 24.13% of the total landings. It is also noteworthy that six other fish species which were considered as threatened in Chilika environ have reappeared in the lake during post intervention period. They are : Hilsa (Tenuealosa) ilisha (loc. Ilishi), Chanos chanos (loc. Seba khainga), Megalops cyprinoids (loc. Panialehio), Elops machnata (Nahama), Acanthopargus berda (loc. Kala khuranti) and Rhinomugil cosula (loc. Kekenda). 4.3.5 Improved stakeholder awareness The fisher community after facing a decade long period of lake degradation due to faulty policy of prawn culture by gheri (bund) fishery, which was imposed up on by the government policy maker, showed a keen awareness about wise use of lake. This was triggered by increase in fishery resource after 2001. A self adopted good practice like regulation of mesh size, discouraging juvenile catches propagated by the fisher community with public address system was remarkable. A better linkage has been established between CDA and fisher community following implementation of action plan. The stakeholders have also formed a federation of NGO’s and CBO’s, called ‘Campaign for Conservation of Chilika Lagoon’ (CCCL) who are working in close tandem with CDA for common issues in and around the Chilika lake. Activities of a very effective out reach programme run by an NGO, ‘Pallishree’ can also be cited as an excellent example. The NGO has formed 10 ‘Centre for Environment Awareness and Education’ around 40 villages of Chilika with support from Japan fund for Global Environment, Ramsar Centre Japan – Asia and CDA; this programme is going on since 2000 with the help of 10 trained facilitators. GAPS 4.3.6 Measurable improvement of trophic status No quantified data on measurable improvement of trophic status is available. A Hydrobiological monitoring by CDA and Environmental monitoring by NIO during pre and post intervention period is being conducted. The monitoring data from the post intervention period, however indicate that there is a significant improvement in the salinity, DO, depth of the channel (NIO Goa). Among the biotic factor there appears to be significant improvement of the biomass of sea grass with increase in the species diversity. There have been spectacular enhancement of the fish, prawn and crab landing which touched all time high during 2001, 2002. It is likely that such data should be forthcoming. 4.3.7 Improved ecological and biological indices A generalized picture of improvement has been evidenced; but not in quantified term except in fishery productivity. The species diversity of sea grass biomass increased conspicuously. The spread of the habitat of the Irrawady Dolphin in the Central and southern sector is also noteworthy; The ongoing M & E is likely to provide such in future. 4.3.8 Improved Chemical, Physical and Biological parameters
21
The increase in salinity, free flow of marine water and increase in depth of the channel (by 30-45 cm in different sections) connecting sea indicate an overall improvement but again no quantified data is available. It is most likely that biological parameters have a better profile since 2001 but data is missing. 4.4 Enabling Environment 4.4.1 The Critical Policy and / Institutional Framework for Management The Chilika Development Authority (CDA) established in 1992 remains under administrative control of State Environment Department. CDA is headed by a Chief Executive Officer (CEO) nominated by the authorities for a fixed term period; current CEO is on deputation from State Forest Department serving in the position for last six years. CDA is supported by funding from both State and the Central Government. The entire issue of better lagoon management and the restoration programme was initiated after receiving 270 million INR special problem area grant as per the recommendation of the 10th Finance Commission and further assistance of 300 million INR approved by the 11th Finance Commission. Table - 13 lists the activities carried out by CDA during 1996-97 to2002-2003. Annexure I provides the list of activities carried out/planned from the resources received as per the recommendation of the 10th and 11th finance commission. Table – 13: Activities of CDA in collaboration with other Organizations Sl. No.
ACTIVITY AGENCY ENGAGED
i. Improvement of water exchange and Salinity gradient by dredging with support of mathematical model and bathymetry data
ii. Environmental Impact Assessment of Chilika Lake for dredging of outer channel by water and sediment quantity study, eco-biological quality study and circulation of siltation process
NIO, Goa, CDA
iii. Weed Management and Eutrophication study RRL (CSIR), Bhubaneshwar iv. Catchment area afforestation and soil
conservation State Forest Department, Soil Conservation Department, Watershed associations
v. Public Awareness, Eco development in the peripheral areas
CDA./ CEE, Community Based organisations, NGO’s
vi. Research and training CDA vii. Fisheries development Fisheries Department, stake
holder, CIFRI viii. Bird Sanctuary Management Forest Department, Bombay
Natural History Society It may be noted that CDA is a coordinating agency and has no statutory power to control work of other state agencies, which may have direct impact on Lake Chilika. Empowering CDA in an appropriate manner may be more effective.
22
The State Revenue Department on the other hand has complete administrative control on land area including wetland area of the State. The lease policy of Revenue Department has direct bearing on fishery policy in Chilika Lake as was noted earlier. 4.4.2 Quality of Lake Management Programme While the present day programme of lagoon management largely caters to the general need for good management practices, areas of work programme, which are supposed to be implemented by other stakeholder departments may not provide a desirable update. Some examples may be given: • The measures suggested to the State Pollution Control Board to control agricultural,
industrial, domestic pollution discharge into the lake still remain to be undertaken. On the other hand, due to a well designed programme of CDA under SAP, data on lake water quality and lake ecosystem status are regularly compiled on CDA database. In summary, programmes directly undertaken by CDA can be better monitored and documented than by other stakeholder departments, except for State Fishery Department, which usually work in close tandem with CDA. 4.4.3 Stakeholder involvement The State agencies were not well organized for community involvement until 1998-99 when OWRCP provided an opportunity. However, the level of understanding on the part of the state authorities deserved much to be improved. The improvement of livelihood of the community around Chilika Lake is intimately connected with fish-productivity and through a system of benefit sharing. The revival of Primary Fishery Co-operative Societies (PFCS) may help in such a process. Currently the apex body of PFCS, Fishfed is looking after the process of leasing out potential fishing areas from the revenue department. On the other hand, peoples’ expectation for better communication, education and healthcare system are justifiable as a part of Lake Management but these are yet to be achieved at the desired level. The strength of present authorities lies in the level of communication that has been established with the stakeholders while weakness can be noted in not being able to meet some basic demand. The state Government are coming up with a new legislation on the regulation of the fishery activities in Chilika . The legislation completely ban culture fishery and there is penal provision for the detrimental activities like unauthorized shrimp culture. Statutory powers are also delegated within the frame work of the above legislation to CDA to deal with the violation of the provision under the Act. 4.4.4 Linkages with other programmes: During preparation of SAP under OWRCP was linkage with other investment programmes of (i) Agriculture Department, (ii) Soil Conservation Department, (iii) Forest Department, (iv) Fisheries Department, (v) Department of Water Resources, (vi) Bhubaneshwar Development Authority,
23
(vii) Orissa State Pollution Control Board and (viii) Tourism Department was proposed focussing specific areas which demand such linkages. These are: • Functioning of Agricultural Intensification Programme in Chilika Basin and its possible
impact on Lake environment • Soil treatment project in Chilika Basin (Mahanadi river basin; Agriculture Department) • Afforestation programme in Khurda Division (Forest Department) • Monitoring Fish landing data and fishing practices (Fishery Department) • Impact of Naraj Barrage project (yet to be operational) and monitoring Operational Rules for
Controlling Freshwater Discharge and silt discharge into Chilika (DoWR) • Treatment of wastewater monitoring from Capital City before being discharge into Chilika
drainage basin (OPCB) • Implementation of eco-tourism project in Chilika (Tourism Department) • Conservation and monitoring of Bird Sanctuary (Annual Waterfowl Census) and Dolphin
population near Puri (Wildlife Division, Forest Department) All these programmes were accepted in principle by the concerned departments but the prevailing budgetary allocation hardly allowed provision for effective implementation unless CDA offered lateral funding support. With some financial constraints, CDA has been effectively coordinating all these activities so that they jointly contribute towards meeting the goals of the management programme. The interest of drainage basin inhabitants (in the delta), specially the agricultural farmers apparently have no linkage with lake related resource management, other than the peripheral villages which used to suffer from inundation specially in the Kanas and Bramhagri Development Block areas, leading to crop loss of over more than 50,000 hectares of paddy. The newly restored hydrological system led to quick discharge of freshwater through new mouth; as a result peripheral and island villages were not affected by flood after 2001. The current efforts to involve NGO’s (e.g., “Campaign for conservation of Chilika Lagoon” and Pallishree) may help motivating upstream people to adopt sustainable agriculture. 4.4.5 Success and Failure A positive SAP implementation effort could be evidenced in the developments starting from 21st century. Supported by 10th and 11th Finance Commission Grant totaling INR 60 crore or 600 million, the Chilika Development Authority in collaboration with other stakeholder government departments achieved the results shown in annexure III. One of the major impediments to achieve complete success is positively linked with timely fund flow and resource availability. The lake management being dependent on a successful partnership between at least eight government departments, co-ordination by CDA for acceptance by each stakeholder also appears time consuming but is essential. The positive success story also includes the concept and realization of a Lake Science Centre at Barkul for hydrobiological and other studies during last 1999 - 2002. A training programmes for all stakeholder department after the SAP was framed is another commendable feature. While the success of a number of SAP components can therefore be lauded, failure to implement (till date) some vital action plan (marked by * in the foregoing table) indicate the necessity to put more concerted efforts. But the failure may be largely due to lack of financial
24
resource other than lack of concept and willingness on the part of executing agency. It will be worthwhile to find out feasibility of undertaking work through self-financing from fisheries and eco-tourism. However, the success of SAP can best be judged from the fact that the Ramsar Conservation Award and Evian Special Prize, 2002 was awarded to CDA for outstanding achievement in restoring the Chilika Lake. The name of the lake was earlier removed from Montreux Record in 2001 on condition of good management. 4.4.6 Public Awareness and Access to Information A visitor’s centre has been established at Satapada, which is a major entry point to the lagoon has taken shape at the cost of INR 8.0 million. The entire eco system of Chilika is show cased in the center with a lot of interactive exhibits. Wetland education programme are also run in the centre for the school children and the stake holders. A network of the NGOs and the CBOs working in and around Chilika has been developed; an outreach programme is carried out through this net work. The work of ‘Pallishree’ a grass root level NGO working with the support of Japan fund for Global Environment, Ramsar Centre Japan-Asia and Chilika Development Authority can be cited as good example towards creating public awareness. The NGO has established 10 small centres, one for four villages in and around Chilika area; these centres are called “Centre for Environment Awareness and Education’ (CEAE) provide both non-formal education through trained facilitators, mostly women on Chilika lagoon also formal education through school level text books in local language on Environment of Chilika Lagoon, Birds of Chilika, Fishes of Chilika and Plants of Chilika. Each centre has a small museum, a small library, audio-visual material, facilities for environmental games etc. This out reach programme, according to CDA has become very effective during last three years (2000-2003). A quarterly news letter in local language is also published regularly, most of the articles are contributed by the local stake holders. The launch of Chilika Web site (www.chilika.com) provide detailed information of wetland studies sponsored by CDA; history of restoration, Ecological Characteristics, Socio-economic features, Forest and Agriculture in the basin area, Physical characteristics and a special focus on birds and dolphins. At present the web site does not provide information on progress with the Integrated Management Plan for Chilika but could be used as a vehicle to keep other organizations and the public aware of progress with the lake’s restoration and protection. 4.4.7 Past and Ongoing Financial Investment It has been mentioned earlier that under special problem are grant provided by the Government of India’s as per the recommendation of the 10th and 11th Finance Commission. The total grant received through recommendation of 10th Finance commission ( 1996-2000) and 11th Finance Commission ( 2001-2004) was 270 million and 300 million INR respectively. It may be mentioned that the Integrated Management Plan for Chilika prepared under World Bank supported OWRCP (1999) showed a projection of INR 1100 million for the period 2000-2001 to 2004-2005. An amount of 10 million INR was made available to CDA for the hydrobiological monitoring of the lagoon from the Orissa Water Resource Consolidation Project( OWRCP). The success in the efforts for restoration has already been convincing proved. The support for other areas of action directly by the lake authorities or by stakeholder agency obviously will go a
25
long way to complete implementation of SAP. The major areas of such future support need and timely action have already been flagged in the section 4.4.5. The human resource and institutional development aspect can be judged from the existing staff component of Chilika Development authority at the capital city of Bhubaneshwar (not exceeding 10 at any given point of time). The new set up of a Public Awareness Centre and wetland research center at Chandraput, Ganjam district, adjacent to the lagoon can be taken as an welcome extension towards institutional support. Obviously the linkages with more than 40 National and regional Institutions are very good example of an integrated collaborative approach. The process has been well initiated and the results emerging appear encouraging. Such a process of multi-institutional involvement can be sustained only through a well-laid programme and funding support. However, since each of these departments have their own agenda and annual plan of work, the expectations from these agencies to carry out the work relevant to lake management can only be met through annual budgetary allocation towards outsourcing work. 5.0 Lessons Learned and Recommended Initiatives 5.1 Political Interest : Changing Lake Management for maximum return; loss of fisher community interest The history of management of Chilika lake (refer to Table-2) clearly shows lack of clear perception and strong political will to ensure better management of the lake. Traditionally, the fisher community had a positive role in the management through indigenous and sustainable fishing system. The fishermen co-operatives further ensured a mechanism of equitable benefit sharing. The natural shift of mouth of Chilika did change the biophysical character of the lake but never created a crisis, which was witnessed after 1980’s, reaching a peak in 1990’s. It is interesting to note that the State Government in early 1990 could think of a ‘Chilika Development Authority’ for better lake management. Support however, was little in terms of manpower and finance. Interventions within the lake was unprecedented. Interestingly, the Fishery Department was forced to play a minor side role. The lake’s contribution to state economy was most certainly through capture fishery. The earlier reports showed involvement of Fishery Department in lake management with a positive and established stake on its yield but during 1990’s the opinion of the concerned department was not considered while introducing intensive shrimp culture. The opinion of fisher community was also ignored. The lesson seems to be that, unless the government is well informed about the existing management of the lake and takes account of the interests of local communities and their informal management methods, it can cause biophysical and social destruction. Thus the role of the community in decision making could also be drawn as a lesson from this experience. Further, wide stakeholders consultation, proposed legislation on regulation of the fishery activities in Chilika etc., serious indicate the concern of the State Government for conservation of the lagoon. 5.2 Changing Policy The post 1995 scenario bears testimony to the efforts towards sustainable development process by CDA. However, the Department of Environment (under whose administrative control
26
CDA operates) did not have power to change the fishing policy in Chilika introduced by the strong political lobby. However, t he proposed new legislation on Chilika banning all kind of culture fishery and delegation of the statutory power to CDA can be considered as some of the significant steps taken by the State Government. The attempts to establish sustainable institutions to address multi sectoral issues and multi stakeholder interests finally seem to succeed during post 1999-2002 periods. The lesson here seems to be one of inter-departmental cooperation and coordination. 5.3 Financing Mechanism CDA never could depend on insufficient support from the State Government. Mobilization of fund from external sources has become a top agenda for CDA; the success in such efforts has already been witnessed (Annexure I). But even then it is not adequate. The fund crunch continues to affect CDA’s efforts to keep the targeted programme on schedule. A self financing mechanism may be suggested to obviate such crunch; but the beneficiaries are yet to be in a position to bear management cost. The funding received during last three years from five different sources are given in Annexure II (source: Pers. Comm. with CEO, CDA, August 2003). 5.4 Legislative Framework and Policies The abolition of Gheri fisheries was carried out by executive order. No comprehensive Lake Management Policy for Chilika has yet been publicly announced (vide web page on Chilika). That absence of a Lake Management policy can create a crisis even in future, should be a lesson taken from the immediate past. It is therefore essential to formulate a long-term policy on Chilika to ensure sustainable lake management. The management programme since 1999-2000 emphasized on stakeholder participation in major decision making. That unilateral decision may create serious problems both for people and the lake was a lesson learned in 1999. The changed policy in complete agreement with stakeholder led to a “recovery” of lake ensuring benefit to these stakeholders. A bill titled ‘Chilika Fishery Regulation Act’ is now under the active consideration of select committee of Orissa Legislative Assembly. The Act prohibits culture fisheries in Chilika. If approved this will further reinforce the executive instruction by the Revenue authority of Orissa banning shrimp culture with effect from the year 2000 (source: Pers. Comm. with CEO, CDA, August 2003). 5.5 Stakeholders Participation The current policy of CDA to link socio economic activities in support of local communities has been commended by Ramsar Mission visiting Chilika from 9-13 December 2001: “CDA has developed an integrated approach to managing the lake which can be regarded as an excellent example of the whole ecosystem approach”. One of such programme is participatory micro watershed management as discussed earlier. The CDA has also addressed the issue of illegal bird hunting by working with local NGO’s and CBO’s to form a “Bird protection Committee” which has assisted in developing alternative economic activities through soft loan. The effort has been supported at an official level and commended by Ramsar Mission.
27
For management of the catchment a participatory approach has also been adopted. There are 20 micro watersheds in the catchment of the lagoon spread over 4100 sq kms. The basic approach adopted was to facilitate a community based co-management system for an integrated terrestrial and aquatic resource management programme, with a major emphasis on the capacity building at the community level. This is done through a series of training and exposure visits, to pave the way for preparation of the micro plan blended with indigenous knowledge at the community level for optimum utilization of the natural resources to increase in the productivity . The increase in the productivity level is also helping in the poverty alleviation in the catchment area. The watershed community also shares the part of the cost of the treatment. This is creating an enabling situation for the local community to take decision on the natural resource management within the catchment. Till now 8 micro watersheds covering an area of 1000 sq kms and more than 52 villages. The network of the NGOs and CBOs , wide stake holders cosultation , watershed associations are some of the positive elements in the participatory management approach adopted by CDA. The self initiated good practices are indicatione of the confidence regained by the stake holders on the lagoon ecosystem. 5.6 Linkages with other Water Resource Management programme This has already been discussed earlier. That lack of coordination can create more chaos is a positive lesson learnt. The strong linkages and a scheduled monitoring is therefore most welcome. 5.7 Importance of Scientific Information and Research One of the most significant lessons learned from Chilika experience is the vital role that scientific information can play towards achieving good management. The data generated on freshwater flow, silt load, nature and characteristics of weed infestation, salinity and nutrient, depth and possible impact of dredging were all a vital set of research input. So was identification of denuded forest area and soil conservation need in basin area with the help of remote sensing. These scientific information drawn out of long term research finally led to a model-study (1 & 2 dimensional) on the best possible way to increase salinity and tidal influx. The prediction of rapid return of salinity was then put to test. Thus the connection between the research and the management initiative is well demonstrated. The post-operative phase has already shown significant changes in lake environment, increasing prawn and fish yield and in active participation of stakeholders. The lesson learned from this total exercise shows as how scientific research can lead to a better management in a wetland ecosystem. The amelioration of the ecosystem both at the wetland as well as the watershed has resulted in the enhancement of the productivity leading to the poverty alleviation. 6.0 Discussion The institutional framework for Chilika is based on a principle of multi sectoral collaboration with CDA playing the role of central coordinating authority. The earlier problem of overlapping areas of authority and the conflict arising thereof will further be overcome with the newly drafted bill of Government of Orissa – “The Orissa Fishing in Chilika (Regulation) Bill, 2002”. The bill while admitting the right of the District Collector to grant lease in respect of the entire leasable area to the Orissa State Fishermen Cooperative Federation Ltd., has also made it mandatory to communicate the details of such lease or sub-lease to CDA. The bill has admitted
28
CDA as the central authority for all other matter empowering it to make regular inspection, demolish illegal structures, to search and seize any article of objection and to seek help of the police department wherever needed. The present activities of CDA show a clear perception about the importance of functioning with civil society organizations both in the basin and in the lake area. This ensures a positive role of CDA as an institution. The policies and laws that can be correlated with administration of Chilika are : Indian Wildlife Protection Act, 1972 Water Act, 1974 Forest (Conservation) Act, 1980 Coastal Zone Regulation Rules, 1991 National Water Policy, 2002 The Biological Diversity Act, 2003. These federal acts and policies along with the State Marine Fisheries Act and Fishing in Chilika Bill, 2002 provide a strong foundation for implementing a process of conservation and sustainable use. The application of appropriate methodology in science and technology have already shown the positive impact on the restoration of the lake system. The use of scientific database, remote sensing technology, GPS mapping, mathematical modeling and continuous monitoring both for hydrobiological parameters and for impact of dredging on lake ecosystem provided tangible benefits in the management process. The investment for restoration of Chilika Ecosystem also provides a lesson of positive return in terms of fishery productivity and poverty alleviation. Besides the benefit from the fishery sector tourism in Chilika is expected to show an upwardly mobile trend from three different streams of visitors viz., winter tourist visiting Nalban Sanctuary for viewing migratory birds, tourists coming from other states round the year for aesthetic and recreational purposes and the local pilgrims visiting Kaliaji temple and other places of worship. The investment for promoting eco-tourism by training the local boatmen will be a worthwhile venture. The investment from the private sector on boats, nets, ice factories and transportation of produces is likely to increase with the increasing productivity of the lake. No quantified data however is available. An investigation in this area will be worthwhile. However the financing mechanism through external sources can not be a permanent solution to ensure viability of restoration process. CDA has already initiated a process of self – financing through local beneficiaries. This process should be further explored to guarantee sustainability of restoration. The Chilika experience also illustrates the immense benefits that can be expected through a process of participatory management of both basin area and the lake area. The consortium of NGO’s formed under the initiative of CDA and the functioning of “Pallishree”, a local NGO working in 20 micro watershed area have already shown positive result. The pro-active role played by the fisher community in promoting wise-use of Chilika also deserve attention. CDA on
29
its part has launched a massive public awareness programme through its centre at Satpara. Such a programme is likely to encourage more voluntary participation in the lake management system. The process has been started but it has “miles to go”. More remains to be done particularly in the area of basin management, ecotourism and installing a mechanism of self-financing. However, the Chilika Lake story shows how effective can application of scientific and technological methods be in an well financed management interventions process, when they are supported by local participation. Acknowledgements The author is grateful to Dr. Masahisa Nakamura, Project Manager and to Dr. Thomas Ballatore of ILEC for providing this opportunity to share experiences on Chilika. Thanks are also due to Dr. A. K. Pattnaik, IFS, Chief Executive Officer, Chilika Development Authority for readily supplying data on recent development and other courtesies. The author is also thankful to all the participants at the Asian Regional Experience Sharing and Review Workshop held at Manila (September 2003) for their valuable comments. References Annandale, N. (ed). 1915-1924. The fauna of Chilika lake. Mem. Ind. Mus., 5 (1-13): 1-1003. Asthana, V., 1979. Limnological studies on Chilika lake - Final Project Report. MAB - India, Project No. 112. Department of Science and technology, New Delhi. Bandyopadhyay, S., and B. Gopal, 1991. Ecosystem studies and management problem of a coastal lagoon, the lake Chilika. p. 117-172. In Aquatic Sciences in India (ed. B. Gopal and V. Asthana). Indian Association for Limnology and Oceanography. Das, N. K., and R. C. ?, 1998. Environmental Survey of Chilika. p. 96-103. In “Chilika, The Pride of our Wetland Heritage”. (ed. S. N. Patro). Orissa Environmental Society, Bhubaneshwar. Ghosh, A. K. (ed), 1995. Fauna of Chilika Lake. Wetland Ecosystem Services 1. Zoological Survey of India. 1-672. Ghosh, A. K., 1998. Interim Technical Report on Chilika Lake under orissa Water Resources Consolidation Project, November 30, 1998. Water Resource Department, Government of Orissa. Ghosh, A. K., 1999 (a). Second Technical Report on Chilika Lake under OWRCP, April 1999. Water Resource Department, Government of Orissa. Ghosh, a. K., 1999 (b). Integrated Management Action Plan for Chilika Lake under World Bank aided Orissa Water Resources Consolidation Project. Water Resource Department, Government of Orissa. Lenka, S. K., 2002. An approach to community based ecotourism planning for Chilika lagoon. p. 318-2. In ”Proc. Int. Workshop Sustainable Development of Chilika Lagoon”, 12th - 14th December, 1998. Chilika Development Authority.
30
Nayak, B. U., L. K. Ghosh, S. K. Roy, R. S. Kankara, 2002. A Study on Hydrodynamics and Salinity of Chilika Lagoon. p. 31-47. In “Proc. Int. Workshop Sustainable Development of Chilika Lagoon”, 12th - 14th December, 1998. Chilika Development Authority. Panda, P. C., and S. N Patnaik. 2002. An enumeration of the flowering plants of Chilika lagoon and its immediate neighbourhood. p. 122-141. In “Proc. Int. Workshop Sustainable Development of Chilika Lagoon”, 12th - 14th December, 1998. Chilika Development Authority. Patnaik A .K . 2003 Phytodiversity of Chilika lake, Orissa, India. Ph.D. Thesis , Utkal University, 1-150+appendices Patnaik, S. 1978. Distribution and abundance of some algal forms in Chilika lake. J. Inland Fisheries. Soc. India, 10: 56-67 Pattnaik, S. S., 2002. Estimation of sediment flow into Chilika Lake. p. 83-87. In “Proc. Int. Workshop Sustainable Development of Chilika Lagoon”, 12th - 14th December, 1998. Chilika Development Authority. Ram, Rahul, N., Kaza V. Rama Rao and Asish Ghosh, 1994. Ramsar Sites of India: Chilika Lake. World Wide Fund for Nature, New Delhi, 1-69. Ramsar Bureau, 2001. Renoval of Chilika Lake Ramsar Site, India from Montreux Record. Ramsar Advisory Mission, No. 50. Roy, Anirban. 2001. Ecological Investigations on the plant resources of the Lake Chilika, Orissa, India. Ph.D. Thesis, University of Calcutta, 1-155 + appendices, Botanical Survey of India.
31
Additional Selected Readings (Unpublished) CDA, 1991. Sustainable Development of Chilika Lake, Orissa CWPRS, 1992. Mathematical Model Studies for Chilika Lake CWPRS, 1995. Mathematical Model Studies to assess the effect of proposed channel on flow circulation and salinity in Chilika Lake CWPRS, 1997. 2 D Mathematical Model Studies to assess the effect of proposed channel on salinity improvement in Chilika Lake CWPRS, 1998. Mathematical Model Studies to assess the effect of proposed channel on flow circulation and salinity in Chilika Lake, Orissa Das, G. S., 1993. Report of the fact finding committee on Chilika Fisheries submitted to the Hon’ble High Court, Orissa on 16th August, 1993 DOWR, 1998. Report on Naraj Barrage NIO, 1992. Studies on waves and long shore sediment transport along coastline of Chilika Lake NIO, 1994. Characteristic of existing Chilika Lake Inlet Channel NIO, 1996. Studies on volume of Dredging of Chilika Lake ORSAC, 1992-1996. Report on Chilika Database for the year 1991-92, 1994-95, 1995-96 ORSAC, 1994-1996. Environmental Monitoring of Chilika Lagoon, 1994, 1995, 1996 RRL, 1994. Investigation on Eutrophication problems in Lake Chilika Utkal University, 1996. A Socio-Economic study of peripheral villages of Chilika Lake – A Preliminary Report. Anthropology Department Utkal University, 1998. A Report on present status of Weeds in Chilika Lagoon, Botany Department.
32
Annexure I Consolidate Phase wise Action Plan for Chilika Lake Chilika Development Authority (2000-01 to 2004-05) Activities 1. Control of Silt load by plantation in catchment area
2. Improvement of water exchange and maintenance of salinity gradient. (Dredging;
Bathymetry & Hydrologic monitoring)
3. Nalaban Island Ecosystem Conservation Programme for Migratory Bird
4. Weed management with community participation and use in bio gas generation
5. Hydrobiological monitoring
6. Mass awareness programme
7. Fishery Resource Development programme (net mesh-size regulation, prohibiting catching
brood fish and prawn juveniles, identification)
8. Upliftment of Socio Economic Condition of Rural Community around the lake
Conservation and Management of Chilika lake, Orissa
36.00 lakh
61.84 lakh
120.00 lakh
For treatment of the catchment
Ministry of Finance as recommended by Tenth Finance Commission
Restoration of ecosystem in Chilika lake.
675.00 lakhs
Nil
Nil
For restoration of Chilika lagoon.
Ministry of Finance as recommended by Eleventh Finance Commission
Restoration of ecosystem in Chilika lake.
Nil
1206.60 lakh
603.30 lakh
For restoration of Chilika lagoon.
Government of Orissa.
Establishment and other expenditure
12.00 lakh
19.64 lakh
26.03 lakhs
For meeting Establishment expenditure
Department of Water Resources, Government of Orissa
Hydro-biological monitoring of Chilika lagoon.
20.00 lakh
33.95 lakh
23.35 lakh
For hydrobiological monitoring
34
Annexure III Concerns and Actions
Sl. No.
Problem Areas Actions taken
I. Socio Economic Factors 1. Economic crisis due to critical loss
of fish yield arising out of wrong policy
Peak fish yield reached with in one year after management
2. Lack of Public Awareness due to lack of initiative
Positive action towards public awareness campaign and voluntary action by fisher community
3. Insufficient Accountability in view of Lack of perception
Launch of Chilika website with information put to public domain
II. Threats from within Drainage Basin 1. Critical Water Quality (low
salinity, high silt) due to bad management
Increased salinity and flushing of silt
2. * Toxic contamination from industrial unit due to Chemical factory in Rushikulya estuary
No positive action reported so far
3. Increased erosion and sedimentation due to intensive agriculture and loss of forest in the basin area
i. Soil conservation work undertaken outside the forest ii. Afforestation work in denuded forest area iii. Trapping silt in Naraj Barrage in downstream of Mahanadi system
4. Unsustainable fishing and aquaculture arising out of changing lease policy and intensive prawn farming
i. Bund-fishery and aquaculture banned ii. Revival of traditional fishing and use of appropriate mesh size in the net
5. Loss of biodiversity habitat and profile due to unchecked freshwater flow from basin area and loss of salinity arising out of blockade of lake mouth
i. Revival of recruitment of marine elements through lake mouth ii. Habitat improvement undertaken in Nalabana bird sanctuary
6. Solid waste disposal by the lake side from tourist resorts
Banned
III. Threat from outside Drainage Basin 1. Air borne pollutant No positive evidence of any air
borne pollutant level available 2. Invasive species due to entry and The increase in salinity by opening
35
survival of freshwater species from 42 channels from the basin area; the low salinity helped in development of such species
the mouth near sea and hydrological changes helped in recruitment of marine species and decline in the population of freshwater species
3. Climate change and its impact on sea level rise along Chilika Coast
No quantified data or analysis has been carried out on the effect of GHG releases from the basin area and its possible impact on Chilika lake (Sea level rise threatening existence of the lagoon)
IV. Problem solving mechanism 1. * Accurate water budget in the
drainage basin Yet to achieve
2. Lessons learned from past experience
Utilized effectively in current lake management in de-weeding, increasing salinity, better hydrology, better fish yield
3. * Waste Water Treatment Action Plan
Yet to be implemented both for Capital City and lake side villages
4. * Limit/ban Phosphorus based detergent
Not evidenced
5. Protection of forest and vegetation in the drainage basin
Fairly implemented through declaration of “Protected Forest”
6. Erosion control Action being taken in a phased manner by soil treatment and afforestation
7. * Control of Agriculture and urban run-off
Not yet effectively implemented
8. * Pollution prevention Yet to achieve 9. Sustainable fisheries Achieved after SAP implementation
especially by increasing salinity, clearing weed, increasing depth and facilitating recruitment
10. Established PA within wetland Effectively implemented by declaring “Sanctuary” area
11. *
Lake Management and Public Health
No positive action evidenced
12. Anti litter campaign Has been initiated through Tourism Department by CDA
13. *
Change in Land use plan for water management
Not evidenced
14.* Appropriate Pollution Control Not yet implemented 15. Prevent invasive species Invasion of freshwater species
checked by salinity increase
36
16. Prevent Conflict No major conflict after banning aquaculture and related structure
17. Poverty alleviation i. Efforts are on to provide better infrastructure for marketing and income generation ii. Income increased with higher productivity of Capture fisheries