EMBASSY OF SWITZERLAND IN THE PEOPLE’S REPUBLIC OF CHINA CH@WORLD: A754 Swiss representation: Beijing Country: China Ref: 512.0-2 HOI / ATO / HLB / BZD / LEEJA / TANGU Last Update: December 2015 China 2015 Final Economic Report Executive Summary .....................................................................................................................................1 Abbreviations................................................................................................................................................2 1 Macroeconomic Situation .....................................................................................................................3 1.1. Slowing growth and economic transformation under the “New Normal” ........................................3 1.2. “Tumultuous” summer of 2015 ........................................................................................................4 1.3. Risks to the economy......................................................................................................................6 1.4. Structural reforms launched in 2015 ...............................................................................................9 1.5. Opportunities in conjunction with the 13 th Five-Year Plan ............................................................10 2 International and Regional Economic Agreements ..........................................................................11 2.1. China’s policies and priorities ........................................................................................................11 2.2. Outlook for Switzerland..................................................................................................................14 2.3. One Belt, One Road ......................................................................................................................14 2.4. Asian Infrastructure Investment Bank ............................................................................................16 3 Foreign Trade .......................................................................................................................................17 3.1. General development and outlook .................................................................................................17 3.2. Trade with Switzerland ..................................................................................................................18 4 Direct Investment .................................................................................................................................19 4.1. General development and outlook .................................................................................................19 4.2. Investment flows from and to Switzerland .....................................................................................20 5 Trade, Economic, Investment and Tourism Promotion ...................................................................21 5.1. Foreign trade and economic & Swiss investment promotion instruments .....................................21 5.2. Interest and further development of Switzerland’s financial center ...............................................23 5.3. Interest and further development of Switzerland as a location for tourism, education and other services ..........................................................................................................................................24 6 Energy and Environment ....................................................................................................................25 6.1. Rebalancing the domestic energy mix..........................................................................................25 6.2. China’s efforts to promote low-carbon growth ...............................................................................26 7 Annexes ................................................................................................................................................28
Transcript
EMBASSY OF SWITZERLAND IN
THE PEOPLE’S REPUBLIC OF CHINA
CH@WORLD: A754
Swiss representation: Beijing Country: China
Ref: 512.0-2 HOI / ATO / HLB / BZD / LEEJA / TANGU Last Update: December 2015
1.1. Slowing growth and economic transformation under the “New Normal” ........................................ 3
1.2. “Tumultuous” summer of 2015 ........................................................................................................ 4
1.3. Risks to the economy ...................................................................................................................... 6
1.4. Structural reforms launched in 2015 ............................................................................................... 9
1.5. Opportunities in conjunction with the 13th Five-Year Plan ............................................................10
2 International and Regional Economic Agreements ..........................................................................11
2.1. China’s policies and priorities ........................................................................................................11 2.2. Outlook for Switzerland..................................................................................................................14 2.3. One Belt, One Road ......................................................................................................................14 2.4. Asian Infrastructure Investment Bank ............................................................................................16
3.1. General development and outlook .................................................................................................17 3.2. Trade with Switzerland ..................................................................................................................18
4 Direct Investment .................................................................................................................................19
4.1. General development and outlook .................................................................................................19 4.2. Investment flows from and to Switzerland .....................................................................................20
5 Trade, Economic, Investment and Tourism Promotion ...................................................................21
5.1. Foreign trade and economic & Swiss investment promotion instruments .....................................21 5.2. Interest and further development of Switzerland’s financial center ...............................................23 5.3. Interest and further development of Switzerland as a location for tourism, education and other
6 Energy and Environment ....................................................................................................................25
6.1. Rebalancing the domestic energy mix ..........................................................................................25 6.2. China’s efforts to promote low-carbon growth ...............................................................................26
China is facing a variety of challenges as it gradually shifts from a fixed investment- and export-led to a more consumption-driven and sustainable economic growth model under the “New Normal”.
GDP growth has consistently slowed since 2010, and may dip to 7% or even lower in 2015, but growth today follows from a much higher level than during the double-digit growth years of the 2000s.
Growth has been dragged down by a weakening industrial sector, while consumer activity of an ex-panding middle class has decelerated the slowdown and contributed to the economic transformation.
The reduction of the growth target from 7% to 6.5% reflects a strong focus on maintaining growth and avoiding the middle-income trap while giving more scope for the implementation of structural reforms.
Structural reforms launched in 2015 as well as the 13th Five-Year Plan point to an increased empha-
sis on improved resource allocation, manufacturing, IT and services as well as low-carbon growth.
Recent exchange rate liberalization efforts are indicative of reform and higher transparency & could serve as a tailwind for more structural changes and regional trade.
With a share of 2.8% in global payments last August, the RMB recently overtook the JPY to become the world’s fourth most-used currency, having overtaken seven currencies during the last three years.
Risks to the economy include policy interventions that do not align to China’s strategic economic ob-jectives, overall debt, deflationary pressures as well as fragile property and labor markets.
The future of the transpacific trade policy architecture is currently being dominated by a race between the PRC-led RCEP and FTAAP on one side and the U.S.-led TPP on the other.
In H1, China’s total foreign trade dipped by 6.9% YoY and official customs data purportedly point to a 7.2% YoY decline in CY 2015, which is far below the 6% foreign trade growth target for 2015.
Switzerland’s trade with China during the first 12 months since enforcement of the FTA grew much more strongly than Switzerland’s trade with the rest of the world.
In the first ten months of 2015, total Sino-Swiss trade grew by 7.4% over the same period in 2014 – at a time when trade growth between China and most of its key trading partners was negative.
In the first nine months of 2015, Switzerland was China’s 9th largest foreign (and 2
nd largest Europe-
an) supplier and 15th largest foreign (and 6
th largest European) trading partner worldwide.
In 2014, China became a net capital exporter, reflecting an expansion of investments to North Ameri-ca, Europe and Australia in sectors including high tech, agribusiness, manufacturing and services.
In 2015, 72% of Swiss companies surveyed planned to increase investment in China and 64% con-sidered the country to be a top 3 investment destination.
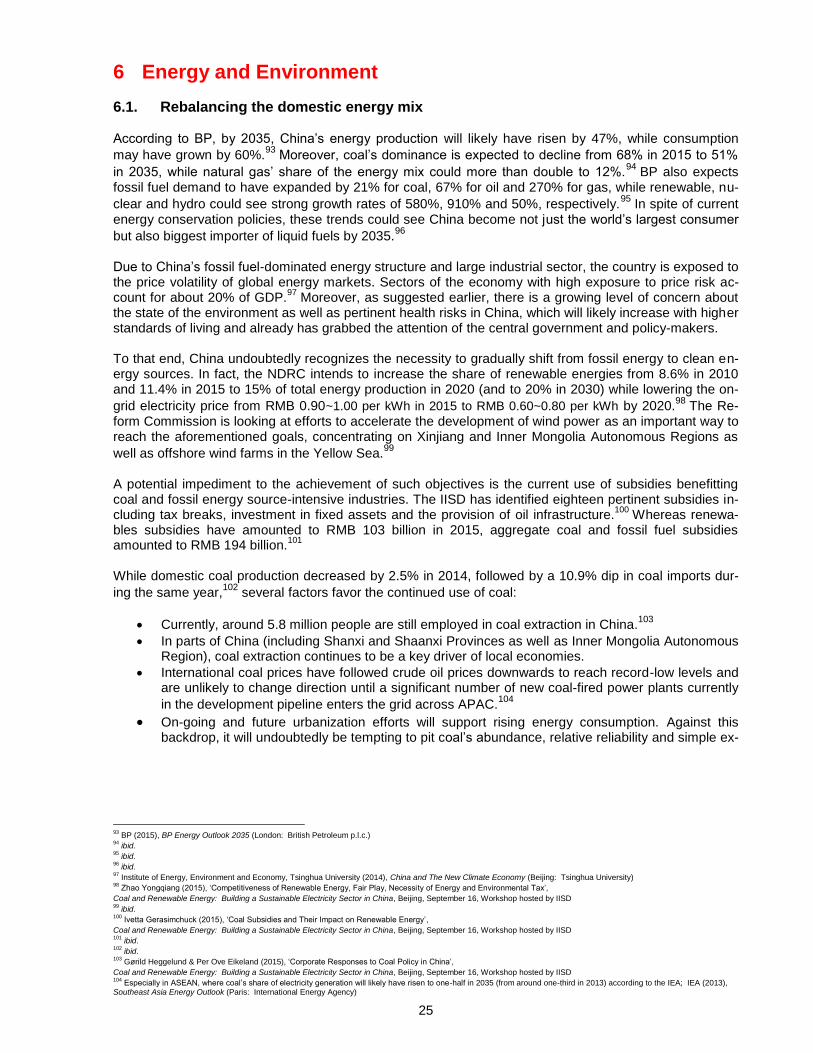
During last March’s NPC, Premier Li reiterated the urgency of having to fight the “war against pollu-tion”, recognizing that the environment is an integral part of the economy and economic growth.
The success of China's reforms might hinge on how fast and to what extent the country rolls back subsidies and regulatory advantages for SOEs & opens up industries to the private sector.
2
Abbreviations ADB Asian Development Bank (headquartered in Manila) AIIB Asian Infrastructure Investment Bank (headquartered in Beijing) APAC Asia-Pacific region APEC Asia-Pacific Economic Cooperation (headquartered in Singapore) ASEAN Association of Southeast Asian Nations (headquartered in Jakarta) BP British Petroleum (headquartered in London) BRICS Brazil, Russia, India, China and South Africa CCB China Construction Bank (headquartered in Beijing) CCP Chinese Communist Party CDB China Development Bank (headquartered in Beijing) CEIBS China Europe International Business School (headquartered in Shanghai) CHF Swiss franc COP 21 United Nations Climate Change Conference (held in Paris from November 30 to December 12, 2015) CPI consumer price index CSSTA Cross-Strait Services Trade Agreement (signed in Shanghai on June 21, 2013) DSB Dispute Settlement Body (of the World Trade Organization) EBRD European Bank for Reconstruction and Development (headquartered in London) ECFA Economic Cooperation Framework Agreement (signed in Chongqing on June 29, 2010) EPL Environmental Protection Law (of the People’s Republic of China) EUR euro FCA Federal Customs Administration (of the Swiss Confederation) FDFA Federal Department of Foreign Affairs (of the Swiss Confederation) FDI foreign direct investment FINMA Swiss Financial Market Supervisory Authority FTA free trade agreement FTAAP Free Trade Area of the Asia-Pacific GACC General Administration of Customs (of the People’s Republic of China) GATT General Agreement on Tariffs and Trade (signed in Geneva on October 30, 1947) GBP pound sterling GCC Gulf Cooperation Council (headquartered in Riyadh) GDP gross domestic product GFC Global Financial Crisis GNP gross national product GPP Green Public Procurement HNA Hainan Airlines (headquartered in Haikou) HSBC Hongkong and Shanghai Banking Corporation (headquartered in London) IEA International Energy Agency (headquartered in Paris) ICBC Industrial and Commercial Bank of China (headquartered in Beijing) ICE IntercontinentalExchange (headquartered in Atlanta) IISD International Institute for Sustainable Development (headquartered in Winnipeg) IMD International Institute for Management Development (headquartered in Lausanne) IMF International Monetary Fund (headquartered in Washington, D.C.) INDC intended nationally determined contribution IP / IPR Intellectual Property / Intellectual Property Rights IT information technology JPY Japanese yen JV joint venture M&A mergers and acquisitions MFA Ministry of Foreign Affairs (of the People’s Republic of China) MFN most favored nation MNC multinational corporation MOFCOM Ministry of Commerce (of the People’s Republic of China) NBS National Bureau of Statistics (of the People’s Republic of China) NDB New Development Bank (headquartered in Shanghai) NDRC National Development and Reform Commission (of the People’s Republic of China) NPC National People’s Congress (of the People’s Republic of China) NPL non-performing loan OBOR One Belt, One Road ODI outward direct investment PBoC People’s Bank of China PMI Purchasing Managers’ Index PPP public-private partnership PRC People’s Republic of China RCEP Regional Comprehensive Partnership Agreement RMB renminbi R&D research and development ROK Republic of Korea (South Korea) RQFII RMB Qualified Foreign Institutional Investor SAR Special Administrative Region (of the People’s Republic of China) SBH Swiss Business Hub SDR special drawing rights (maintained by the International Monetary Fund) SECO State Secretariat for Economic Affairs (of the Swiss Confederation) S-GE Switzerland Global Enterprise (headquartered in Zurich) Sinopec China Petroleum & Chemical Corporation (headquartered in Beijing) SME small and medium-sized enterprises SNB Swiss National Bank SOE state-owned enterprise SWIFT Society for Worldwide Interbank Financial Telecommunication (headquartered near Brussels) TBT/SPS Technical Barriers to Trade/Sanitary and Phytosanitary Measures TPP Trans-Pacific Partnership (signed in Atlanta on October 5, 2015) UBS Union Bank of Switzerland (headquartered in Zurich) UNCTAD United Nations Conference on Trade and Development (headquartered in Geneva) UNFCCC United Nations Framework Convention on Climate Change (secretariat based in Bonn) UNIDO United Nations Industrial Development Organization (headquartered in Vienna) USD U.S. dollar WTO World Trade Organization (headquartered in Geneva) YoY year-on-year YTD year-to-date
3
1 Macroeconomic Situation
1.1 Slowing growth and economic transformation under the “New Normal”
China’s annual GDP growth has consistently slowed since 2010.1 It has been underpinned by a major
economic transformation, which was conveyed by its then-new leaders under Chinese Communist Party (CCP) General Secretary Xi Jinping during the 18
th Central Committee’s Third Plenum in November 2013.
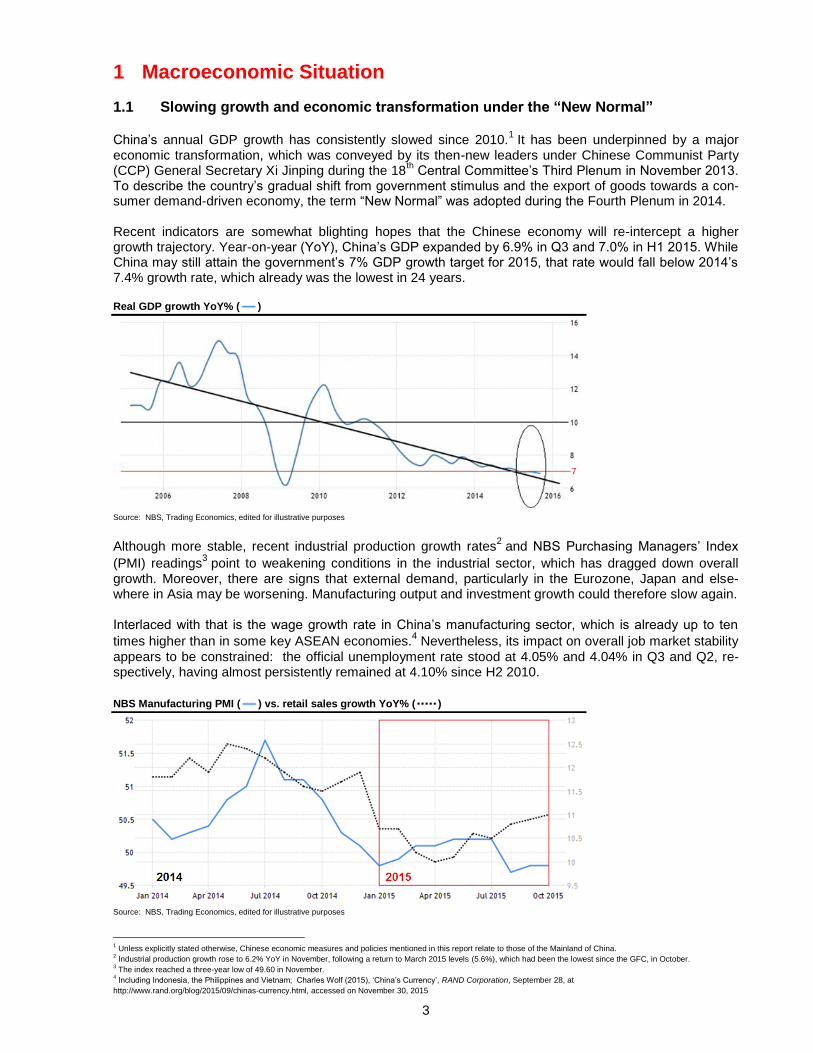
To describe the country’s gradual shift from government stimulus and the export of goods towards a con-sumer demand-driven economy, the term “New Normal” was adopted during the Fourth Plenum in 2014. Recent indicators are somewhat blighting hopes that the Chinese economy will re-intercept a higher growth trajectory. Year-on-year (YoY), China’s GDP expanded by 6.9% in Q3 and 7.0% in H1 2015. While China may still attain the government’s 7% GDP growth target for 2015, that rate would fall below 2014’s 7.4% growth rate, which already was the lowest in 24 years. Real GDP growth YoY% ( )
Source: NBS, Trading Economics, edited for illustrative purposes
Although more stable, recent industrial production growth rates2 and NBS Purchasing Managers’ Index
(PMI) readings3 point to weakening conditions in the industrial sector, which has dragged down overall
growth. Moreover, there are signs that external demand, particularly in the Eurozone, Japan and else-where in Asia may be worsening. Manufacturing output and investment growth could therefore slow again. Interlaced with that is the wage growth rate in China’s manufacturing sector, which is already up to ten
times higher than in some key ASEAN economies.4 Nevertheless, its impact on overall job market stability
appears to be constrained: the official unemployment rate stood at 4.05% and 4.04% in Q3 and Q2, re-spectively, having almost persistently remained at 4.10% since H2 2010.
Source: NBS, Trading Economics, edited for illustrative purposes
1 Unless explicitly stated otherwise, Chinese economic measures and policies mentioned in this report relate to those of the Mainland of China.
2 Industrial production growth rose to 6.2% YoY in November, following a return to March 2015 levels (5.6%), which had been the lowest since the GFC, in October.
3 The index reached a three-year low of 49.60 in November.
4 Including Indonesia, the Philippines and Vietnam; Charles Wolf (2015), ‘China’s Currency’, RAND Corporation, September 28, at
http://www.rand.org/blog/2015/09/chinas-currency.html, accessed on November 30, 2015
4
At 11.2% YoY, retail sales growth in 2015 has had its strongest showing in November, having consistently increased since July. Consumption already contributed more to China’s economic growth than investment
in 2014, 50.2% versus 48.5%,5 and even accounted for around 60% of GDP growth during H1.
6 An ever-
expanding middle class, which already grew by 1,500% in urban areas between the turn of the millennium
and 2012,7 provides a favorable backdrop for that trend, which shows that the economic transformation
seems to be well under way. Moreover, it is important to note that while economic growth is slowing, it follows from a much higher level than during the double-digit growth years of the last decade. A bigger economy translates into more out-
put,8 thereby opening up an array of opportunities – especially, if services growth remains robust. Since
2012, China’s services sector has consistently grown faster than the industrial sector, and the spread be-
tween the growth rates of both sectors has widened to almost ten percentage points.9 More recently, in
October, the Caixin China General Services PMI reached 52.0 index points, rebounding from a 14-month low last September, which further points to stabilization rather than to an uncontrolled decent of the econ-
omy. The index lost 0.80 points in November due to more stable manufacturing output.10
1.2 “Tumultuous” summer of 2015 Weaker activity data aside, last summer’s stock market slump and the sudden depreciation of the renminbi (RMB) formidably reminded observers of China’s economy of the dynamics underlying the coun-try’s current stage of development and the challenges that need to be overcome to ensure that its growth trajectory is sustainable. The downside risks have, however, been limited. Stock market slump Between mid-June and end of August, over 40% of the value of Chinese shares was wiped out, reversing a stock market boom that had seen the Shanghai Composite Index gain over 135% between the summer of 2014 and June 12, 2015, or around 60% between the beginning of this year and that June 12 high. Since the August 26 low, the index has bottomed out and recovered some lost ground. Shanghai Composite Index ( )
Source: finanzen.net, edited for illustrative purposes
5 Xinhua News Agency (2015), ‘Consumption Contributes More to China’s GDP Growth’, China Daily, June 4, at
http://www.chinadaily.com.cn/business/2015-06/04/content_20907900.htm, accessed on November 30, 2015 6 Enda Curran (2015), ‘How China Can Create the $67 Trillion Consumer Economy’, BloombergBusiness, July 24, at
http://www.bloomberg.com/news/articles/2015-07-23/how-china-can-create-the-68-trillion-consumer, accessed on November 30, 2015 7 Dominic Barton, Yougang Chen & Amy Jin (2013), ‘Mapping China’s Middle Class’, McKinsey Quarterly, June, at
http://www.mckinsey.com/insights/consumer_and_retail/mapping_chinas_middle_class, accessed on November 30, 2015 8 For example, in 2014, the Chinese economy was over twenty-four times larger than in 1980 whilst the U.S. and Swiss economies were around 2.5 and 1.8 times, respectively,
bigger at the end of the same period; Embassy estimates based on data gathered from IMF (2015), World Economic Outlook October 2015 Database, at
https://www.imf.org/external/pubs/ft/weo/2015/02/weodata/index.aspx, accessed on November 30, 2015 9 Chi Lo (2015), ‘What Lies Beneath China’s Renminbi Shock?’, Chi on China Series (Hong Kong: BNPP IP)
10 Eamonn Sheridan (2015), ‘China Data - Caixin Services PMI for November: 51.2 (Prior 52.0)’, Nasdaq, Inc., December 2, at
http://www.nasdaq.com/article/china-data-caixin-services-pmi-for-november-512-prior-520-cm549614, accessed on December 13, 2015
5
In our view, the implications for the real economy have been limited:
A relatively low percentage – according to UBS, currently around 10%11
of Chinese households – has invested in the stock market, which will unlikely affect consumers’ propensity to spend.
A banking crisis is unlikely, given that the amount dedicated to the subsequent government-coordinated intervention and stabilization of the stock market by the banks made up around 1.5%
of total assets within the Chinese banking system.12
Q3 GDP growth seemed unaffected in spite of the stock market slump. Exchange rate liberalization On August 11, the People’s Bank of China (PBoC) announced a change to the daily fixing mechanism of the RMB exchange rate, which led to a 3% depreciation of the redback against the greenback.
RMB/USD ( ) vs. RMB/CHF ( )
Source: OANDA, edited for illustrative purposes
The fixing is now based on the previous day’s average closing rate and takes into account exchange rate developments of the most important international currencies. It no longer purely relies on the moving av-erage closing rates of market makers, most notably Chinese state banks, and the U.S. dollar (USD). The PBoC’s announcement will likely have the following implications or give support to the following develop-ments:
The stronger incorporation of market forces into this fixing mechanism is indicative of reform and higher transparency.
Long-term, exchange rate liberalization could serve as a tailwind for more structural changes and regional trade.
On November 9, the PBoC authorized direct trading between the RMB and the Swiss franc (CHF), which will help reduce conversion costs for market participants, could deepen bilateral financial and trading rela-tions and facilitate the establishment of an RMB hub in Switzerland. On November 30, in our view, at least partially stemming from the PBoC’s August 11 announcement, the International Monetary Fund (IMF) included the RMB with a 10.92% weighting to its Special Drawing Right
(SDR) basket, effective October 1, 2016.13
This is an important milestone for the RMB internationalization process as well as overall efforts to open up the economy and spur financial reform.
11
At the time of the slump, given higher stock market values, that share stood at around 12%; Wang Tao (2015), representing UBS Investment Research, November 29 12
The Economist (2015), ‘China’s Stockmarket Crash: A Red Flag’, The Economist, July 7, at
http://www.economist.com/blogs/freeexchange/2015/07/chinas-stockmarket-crash, accessed on November 30, 2015 13
The other currencies of the newly-composed SDR basket show the following weightings: USD (41.73%), EUR (30.93%), JPY (8.33%) and GBP (8.09%);
IMF (2015), ‘Q and A on 2015 SDR Review’, International Monetary Fund, November 30, at
https://www.imf.org/external/pubs/ft/weo/2015/02/weodata/index.aspx, accessed on December 1, 2015
6
1.3 Risks to the economy In spite of stabilizing factors, downside risks to the economy (many of which are interrelated) remain, which we identify as follows: Tactical policy interventions versus strategic objectives While the central government under the direction of President Xi and Premier Li Keqiang has repeatedly stressed the need to upgrade China’s economic structure, more short-term macroeconomic risks have constantly put pressure on the leadership. Policy interventions in response to these risks may have had stabilizing effects. However, there is a risk that some of their effects are too short-term and do not align to the strategic objectives of China’s economic transformation. Premier Li’s pledge to create 10 million urban jobs and sustain medium-to-high growth in 2015 has further prompted the leadership to loosen monetary policy. The PBoC is believed to have injected several hun-dreds of billions of RMB through various lending facilities during the last 12 months. During the same peri-od, the PBoC progressively lowered its one-year lending rate to a record-low 4.35% in October from 6.0% last year, which is a rate that had remained unchanged between the end of 2012 and Q3 2014. Also in October, the ceiling on the PBoC’s other benchmark interest rate, the one-year deposit rate, was removed after another cut, seeing the deposit rate dip to a record-low 1.5%, while the banks’ required reserve ratio was reduced by a further 0.5 percentage points. Monetary and fiscal stimuli may prop up the economy and preserve the belief that a hard landing is no plausible scenario. However, much of their long-term effectiveness will rest on broader and more efficient credit allocation. Another risk is that state-owned enterprises (SOEs) might be slow to list their shares publicly if they are called upon to participate in future stabilizations of the stock market – as they were last summer – which could hamper efforts to boost efficiency in the corporate sector. Local government and overall debt By various accounts, China’s total debt now exceeds 280% of GDP (which, as a percentage of GDP, is higher than those of the U.S. and Germany whilst significantly lower than those of Spain and Japan). We expect local government debt to weigh heavily on that ratio. Not only will local government investment pro-ject execution and profitability risks therefore loom large, but the extent to which reforms conveyed by the central government will trickle down and be implemented at the local level will be significant for the coun-try’s overall development. As China’s economic growth model since the Global Financial Crisis (GFC) has been substantially fi-nanced via debt, a key challenge for the central government will be to reduce lending without jeopardizing growth. By contrast, raising the debt burden could increasingly dent the economy – especially, if the cost of future stimulus measures is divided between sectors in a way that the incentives of major economic ac-tors are adversely affected, which would then put another damper on growth. Moreover, in Q2, net profit growth of three of China’s “big four” state-owned banks, the Industrial and Commercial Bank of China (ICBC), China Construction Bank (CCB) and Agricultural Bank of China, was
lower than during the same period in 2014.14
As economic growth slows and banks have difficulty adjust-
ing to industrial restructuring under the New Normal, lower profit growth could weaken their capability to
assist companies in financial distress. In turn, rising NPLs adversely affect the bottom line of banks,15
cre-ating a vicious cycle. The proportion of non-performing loans (NPLs) on the Mainland already rose by 0.22
percentage points to 1.82% in H1.16
Nevertheless, China’s relatively low external debt (8.6% of GDP in 2014),17
its highly-capitalized compa-
nies, high foreign exchange reserves and available liquidity tools (including further rate cuts), among oth-
14
Don Weinland (2015), ‘China's Biggest Banks See Slower Profit Growth amid “New Normal”’, South China Morning Post, September 2, at
http://www.scmp.com/business/banking-finance/article/1854554/chinas-biggest-banks-see-slower-profit-growth-amid-new, accessed on December 13, 2015 15
Between March 31 and June 30, 2015 the NPL ratios of ICBC and Agricultural Bank of China grew from 1.29% to 1.4% and 1.65% to 1.83%, respectively, while CCB’s ratio hit
1.42% at the end of June from 1.19% at the end of 2014; Ben Bland (2015), ‘China’s Banks Face Tightening Bad Loans Squeeze’, Financial Times, August 30, at
http://www.ft.com/cms/s/0/3eace0ec-4d6d-11e5-9b5d-89a026fda5c9.html#axzz3uDx36xwZ, accessed on December 13, 2015 16
Reuters (2015), ‘China's Top Bank Regulator Says Bad Loans Surge, Profit Growth Slows in Cooling Economy’’, Reuters, August 6, at http://www.reuters.com/article/idUSL3N10H20C20150806#EQ02hZfB7qr0ez8C.97, accessed on December 13, 2015 17
Embassy estimates based on State Administration of Foreign Exchange and World Bank data
7
ers, give it both enough ammunition and room for government-coordinated action that could decidedly lessen the risk of a hard landing or a full-blown financial crisis. Deflationary pressures While in November consumer inflation increased again from 1.3% YoY in October, at 1.5% YoY it contin-ues to be far below the 3% target set by the central government for 2015 and dragged down by even low-er food price inflation. As in the U.S., the UK, the Eurozone and Japan, lower international commodity
prices, in itself partially driven by slowing Chinese demand, have contributed to lower inflation.18
From a
borrower’s perspective, this development could be particularly problematic, as asset values are less likely
to increase in line with the face value of monetary obligations.19
Worse, declining asset values in a defla-tionary scenario would very likely lower aggregate demand and appetite for investment, as consumers in-crease their cash positions in an attempt to avoid further financial loss. Additional interest rate cuts could, however, mitigate those effects.
Source: NBS, Trading Economics, edited for illustrative purposes
Property market The downturn in the property market has been spectacularly halted. While property investment growth is edging closer towards zero on a 3-month moving average YoY, property sales volume growth is back in
positive territory, rising almost 15% YoY in August.20
Risks, however, remain. A slowdown, combined with deflationary pressures and excess capacity imply
that the housing market, which accounts for 10% of GDP,21
remains fragile. Here as well, fiscal and mone-tary measures could help avert a market crash. The PBoC has not shied away from supporting the hous-ing market by cutting the minimum down payment for first-time and second-time buyers in September and March, respectively. Additionally, the Ministry of Land and Resources announced measures to regulate land supply for residen-tial housing projects, declaring that cities experiencing housing market turbulence would be forced to stop selling more land this year and would have to reallocate land already sold for housing developments to cultural, sports and retirement home projects. Finally, accelerated infrastructure investment could further boost property investment and, of course, vice versa. Moreover, an uptick in property sales translating into less available floor space could give another boost to property investment.
18
Bloomberg News (2015), ‘China’s Deflation Pressures Signal More Monetary, Fiscal Easing’, BloombergBusiness, November 10, at
http://www.bloomberg.com/news/articles/2015-11-10/china-s-deflation-pressures-signal-more-monetary-fiscal-easing, accessed on November 30, 2015 19
Michael Pettis (2015), ‘Interview on Chinese CPI and PPI Data for December’, Michael Pettis’ China Financial Markets, January 9, at
http://blog.mpettis.com/2015/01/interview-on-chinese-cpi-and-ppi-data-for-december, accessed on November 30, 2015 20
HSBC Global Research (2015), Asia’s Debt Squeeze (Hong Kong: Hongkong and Shanghai Banking Corporation) 21
The Vanguard Group, Inc. (2015), ‘Global Macro Matters: China’s Key Risk is Housing, Not Stocks’, Vanguard Investments Canada Inc., October 2, at
https://www.vanguardcanada.ca/advisors/articles/research-commentary/markets-and-economy/gmm-chinas-key-risk.htm, accessed on November 30, 2015
8
Labor market Maintaining stability in the labor market has been an ideological priority for the Chinese Government. As it is implementing reforms under the New Normal amidst an economic slowdown, this priority has become more demanding. Decades of ample, cheap labor have come to a close and the Chinese population is en-tering the post-transitional stage of a negative demographic dividend. The working age population rate has been sluggish for more than a decade, whilst the median youth age and dependency ratio have been
rapidly increasing, wielding strong pressure on the labor market.22
Labor market dynamics
Source: World Bank
Considering that official data can be embellished or incomplete, so far, the labor market has shown tem-porary resilience to the above-mentioned socio-economic dynamics. In 2014, 772.5 million people were employed (+3.35% YoY), and, at 4.1%, the urban unemployment rate had remained constant since 2010,
meeting the official target to keep it below 4.5%.23
With 13.6 million newly created jobs in urban areas, the
government even exceeded its target of 10 million by 36% – an important factor for stable GDP growth.24
Research suggests that in China, a single percentage point increase in employment results in a GDP av-
erage growth increase of 0.08 percentage points.25
In urban areas, nominal wages had grown 9.43% YoY.
Outpacing nominal GDP growth, the average urban nominal wage reached RMB 56,339 in 2014.26
Looking back, China’s unique labor market features and certain structural factors seem to have been able to somewhat buffer negative pressures on the labor market. In structural terms, the policy-driven expan-sion of the relatively labor-intensive albeit low-skilled services sector has played a particularly important role. Closely related to trends in urbanization and the weakening manufacturing sector, the tertiary sector
overtook the secondary sector in 2013, making up 48.1% of the sectoral fabric in 2014.27
High growth ar-
eas, as Q2 2015 YoY employment demand data suggests, were to be found in logistics and transportation (+36.3%), finance (+17.5%) and IT (+5.5%), reflecting the e-commerce boom in China, whilst demand
waned in construction (-23.8%), agriculture (-16.8%), retail (-9.8%) and manufacturing (-7.7%).28
22
Central Intelligence Agency (2015), ‘The World Factbook’, Central Intelligence Agency, at https://www.cia.gov/library/publications/the-world-factbook/fields/2177.html,
accessed on December 14, 2015 & Pew Research Center (2014), ‘Chapter 2. Aging in the U.S. and Other Countries, 2010 to 2050’,
Attitudes about Aging: A Global Perspective, January 30, at http://www.pewglobal.org/2014/01/30/chapter-2-aging-in-the-u-s-and-other-countries-2010-to-2050, accessed on
November 25, 2015 23
Victoria Ruan (2015), ‘China’s Labour Pains: Slower Economic Growth and a Cooling Job Market’, South China Morning Post, April 25, at
http://www.scmp.com/news/china/economy/article/1775790/chinas-labour-pains-slower-economic-growth-and-cooling-job-market, accessed on November 27, 2015 24
NBS annual economic, employment and wage data gathered from http://data.stats.gov.cn/english/easyquery.htm?cn=C01, accessed on November 25, 2015 25
IMF (2015), ‘China’s Labor Market in the “New Normal”’, IMF Working Paper, WP/15/151, at https://www.imf.org/external/pubs/ft/wp/2015/wp15151.pdf,
accessed on November 25, 2015 26
NBS annual economic, employment and wage data gathered from http://data.stats.gov.cn/english/easyquery.htm?cn=C01, accessed on November 25, 2015 27
ibid. 28
German Chamber of Commerce in China (2015), ‘Labor Market & Salary Report 2015/2016’, October, at
http://china.ahk.de/fileadmin/ahk_china/Marktinfo/2015_16_Labor_Market_and_Salary_Report_limited_report.pdf, accessed on December 12, 2015
9
Moreover, China has benefited from its unique labor market features, including excess labor in SOEs, sec-tors with significant overcapacity and millions of internal migrants. IMF empirical analysis suggests that migrant workers in particular have played a pivotal role in absorbing shocks to China’s labor market. In addition, their flow is considered to be a more accurate indicator for short-term labor market dynamics in China than unemployment data (which does not factor migrant workers into urban employment statis-
tics).29
A transitory labor force of nearly 274 million people, in 2014 migrant workers represented almost half of the urban, and one third of the total labor force. Of these, 64.67 million migrated towards the central
region, 53.53 million to the western regions and 50.01 million to eastern areas.30
Migrant workers have
been mainly engaged in low-skilled and manufacturing industries, often without a formal contract. Besides, the hukou or ‘household registration’ system has forced them to trade off a significant proportion of civil rights and social welfare for a higher salary. Their wages have grown at a similar pace as urban non-
private sector workers. Yet, their average salaries (RMB 2,864) amount to merely 61% of the latter.31
Relief aside, long-term, China’s labor market characteristics are fragile and unsustainable. The services sector is limited in its capacity to absorb waning employment in the manufacturing sector, and there is a severe skills mismatch in the labor market due to a lack of vocational training and general shortage of skilled labor. In H2 2015, this risk was reflected in a record contraction of the Caixin China Composite PMI (all-sector index) from 50.2 to 48.8 between July and August. The downturn was felt across China’s labor markets, where employment in the services (affecting particularly, although not exclusively, smaller ser-
vice providers)32
and manufacturing sectors had not dropped as sharply since January 2009.33
Last October, in its 13
th Five-Year Plan, the central government recognized the urgent need for increased
resilience and flexibility of the labor market. It launched important reforms to the one-child policy and the hukou system. For foreigners, the labor market in China remains rigid and hiring policies restricted. Obtaining a work visa and resident permit is a complex, time-consuming and costly procedure. Different ministries are involved in the process and special documents are required for the work permit application, such as a foreign ex-
pert certificate (外国专家证) that attests a minimum of two years of work experience abroad. Additionally,
expats are often burdened with double contributions to social security systems (i.e., both in their home
countries and in China; 社保), which is a disincentive to the unrestrained exchange of talent.
Regarding the latter, Switzerland and China reached a milestone last September when Federal Councilor Alain Berset and Minister of Human Resources and Social Security Yin Weimin signed the Agreement on Social Security. Swiss nationals who are temporarily working in China and vice versa will no longer have to pay contributions in both countries or change social security systems, which is a significant develop-ment in the age of cost reduction programs and further enhances Sino-Swiss collaboration.
1.4 Structural reforms launched in 2015 More short-term economic measures aside, since the 18
th Central Committee’s Third Plenum, the Chinese
leadership has started to unbundle an ambitious package of structural reforms with a view to long-term and sustainable growth. This year, important, pertinent milestones have either been announced or imple-mented, including:
A new Budget Law, which took effect in January 2015. The law aims to improve budget disci-pline, following a sharp increase of local government debt, dramatically in the wake of the GFC and, more recently, during the previous two years. Local governments are now not only required to disclose their financial situation to the public, but they also need to get approval from the central government to issue new debt, which was capped at RMB 600 billion for 2015.
The steady expansion of a newly-launched debt-for-bond program, which since last August has allowed local governments to swap a total of RMB 3.2 trillion of existing debt into bonds with a longer maturity and lower interest rates compared to existing loans. Lower refinancing costs for
29
IMF (2015), ‘China’s Labor Market in the “New Normal”’, IMF Working Paper (WP/15/151), at https://www.imf.org/external/pubs/ft/wp/2015/wp15151.pdf,
accessed on November 25, 2015 30
NBS (2015), ‘2014 年全国农民工监测调查报告’, 最新发布, at http://www.stats.gov.cn/tjsj/zxfb/201504/t20150429_797821.html, accessed on November 27, 2015 31
IMF (2015), ‘China’s Labor Market in the “New Normal”, IMF Working Paper, WP/15/151, at https://www.imf.org/external/pubs/ft/wp/2015/wp15151.pdf,
accessed on November 25, 2015 32
Xiaoyi Shao & Kevin Yao (2015), ‘China’s Activity Surveys Show Economic Conditions Deteriorating, Not Crashing’, Reuters, October 1, at
http://www.reuters.com/article/2015/10/01/china-economy-pmi-idUSL3N11Z2IZ20151001#9ryRXMImFw9euddZ.97, accessed on November 27, 2015 33
Chris Williamson (2015), ‘PMI Surveys Signal Steepest Economic Downturn for 6½ Years’, Markit, September 3, at
https://www.markit.com/Commentary/Get/03092015-Economics-PMI-surveys-signal-steepest-economic-downturn-for-6-years, accessed on December 12, 2015
10
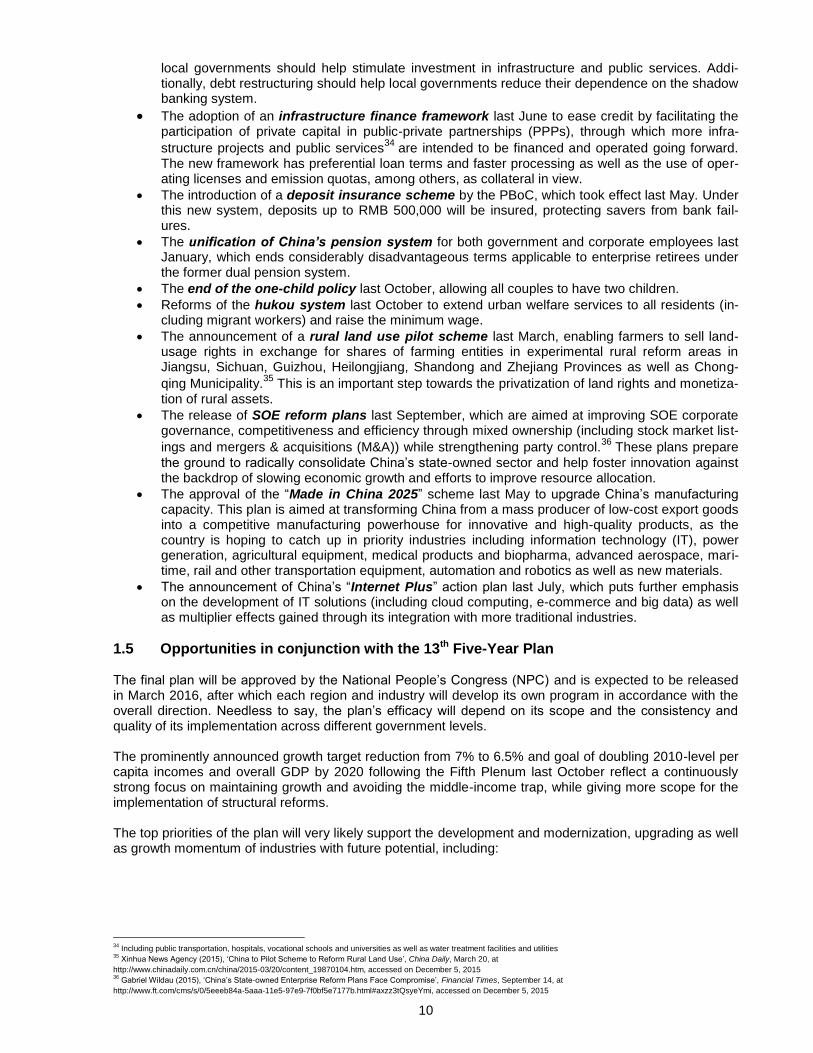
local governments should help stimulate investment in infrastructure and public services. Addi-tionally, debt restructuring should help local governments reduce their dependence on the shadow banking system.
The adoption of an infrastructure finance framework last June to ease credit by facilitating the participation of private capital in public-private partnerships (PPPs), through which more infra-
structure projects and public services34
are intended to be financed and operated going forward. The new framework has preferential loan terms and faster processing as well as the use of oper-ating licenses and emission quotas, among others, as collateral in view.
The introduction of a deposit insurance scheme by the PBoC, which took effect last May. Under this new system, deposits up to RMB 500,000 will be insured, protecting savers from bank fail-ures.
The unification of China’s pension system for both government and corporate employees last January, which ends considerably disadvantageous terms applicable to enterprise retirees under the former dual pension system.
The end of the one-child policy last October, allowing all couples to have two children.
Reforms of the hukou system last October to extend urban welfare services to all residents (in-cluding migrant workers) and raise the minimum wage.
The announcement of a rural land use pilot scheme last March, enabling farmers to sell land-usage rights in exchange for shares of farming entities in experimental rural reform areas in Jiangsu, Sichuan, Guizhou, Heilongjiang, Shandong and Zhejiang Provinces as well as Chong-
qing Municipality.35
This is an important step towards the privatization of land rights and monetiza-tion of rural assets.
The release of SOE reform plans last September, which are aimed at improving SOE corporate governance, competitiveness and efficiency through mixed ownership (including stock market list-
ings and mergers & acquisitions (M&A)) while strengthening party control.36
These plans prepare
the ground to radically consolidate China’s state-owned sector and help foster innovation against the backdrop of slowing economic growth and efforts to improve resource allocation.
The approval of the “Made in China 2025” scheme last May to upgrade China’s manufacturing capacity. This plan is aimed at transforming China from a mass producer of low-cost export goods into a competitive manufacturing powerhouse for innovative and high-quality products, as the country is hoping to catch up in priority industries including information technology (IT), power generation, agricultural equipment, medical products and biopharma, advanced aerospace, mari-time, rail and other transportation equipment, automation and robotics as well as new materials.
The announcement of China’s “Internet Plus” action plan last July, which puts further emphasis on the development of IT solutions (including cloud computing, e-commerce and big data) as well as multiplier effects gained through its integration with more traditional industries.
1.5 Opportunities in conjunction with the 13th Five-Year Plan The final plan will be approved by the National People’s Congress (NPC) and is expected to be released in March 2016, after which each region and industry will develop its own program in accordance with the overall direction. Needless to say, the plan’s efficacy will depend on its scope and the consistency and quality of its implementation across different government levels. The prominently announced growth target reduction from 7% to 6.5% and goal of doubling 2010-level per capita incomes and overall GDP by 2020 following the Fifth Plenum last October reflect a continuously strong focus on maintaining growth and avoiding the middle-income trap, while giving more scope for the implementation of structural reforms. The top priorities of the plan will very likely support the development and modernization, upgrading as well as growth momentum of industries with future potential, including:
34
Including public transportation, hospitals, vocational schools and universities as well as water treatment facilities and utilities 35
Xinhua News Agency (2015), ‘China to Pilot Scheme to Reform Rural Land Use’, China Daily, March 20, at
http://www.chinadaily.com.cn/china/2015-03/20/content_19870104.htm, accessed on December 5, 2015 36
Gabriel Wildau (2015), ‘China’s State-owned Enterprise Reform Plans Face Compromise’, Financial Times, September 14, at
http://www.ft.com/cms/s/0/5eeeb84a-5aaa-11e5-97e9-7f0bf5e7177b.html#axzz3tQsyeYmi, accessed on December 5, 2015
11
Agriculture
Manufacturing
Internet and IT
Healthcare
Clean technologies and green investment
Services sector in general At a higher, cross-sector level, importance will almost certainly be placed on low-carbon development, ur-banization, economic regions, improved resource allocation and financial liberalization, among others.
2 International and Regional Economic Agreements
2.1. China’s policies and priorities Tactical policy interventions versus strategic objectives aside, another major balancing act preoccupying the central government is the one between the preservation of protectionist interests of the state and its enterprises on the one hand and liberalization pressures on the other. Moreover, diminishing dependence on Western markets for Chinese exports is a key driver for increasing domestic demand as well as diversi-fying the economy. Still, in CY 2014, both by the sum of exports and imports as well as exports alone, China was the world’s leading trader of merchandise – in both cases, followed by the U.S., Germany and
Japan.37
It is against this backdrop that China is gaining influence in international trade policy, protecting its inter-ests within the World Trade Organization (WTO) and concluding regional and bilateral trade agreements with strategic partners. China and the WTO Since its accession to the WTO, China has been categorized as a developing country. In spite of its tre-mendous economic development, the country therefore continues to benefit from special and differential treatment provisions contained in WTO Agreements. Industrialized states tend to claim that emerging economies should make more concessions than other states categorized as developing countries. Alt-hough China has made far-reaching commitments with respect to market opening and liberalization, which are unparalleled in WTO (and GATT) history, and is perceived to be a constructive partner in many fields, the country has not yet adopted a leading role that is commensurate with most countries’ expectations. China’s recent experience with the WTO’s Dispute Settlement Body (DSB) suggests that the country is gradually internalizing the non-discrimination principle embodied by the multilateral trading regime, com-mitting itself to comply with all DSB rulings and redress its policies that are inconsistent with the WTO in a number of cases. All in all, 33 cases of violations of WTO rules have been filed against China before the DSB, mainly for illegally restricting access to its domestic market through anti-dumping duties or promot-ing its domestic industry through illegal subsidies.
38 However, China has experienced far less complaints
than, for instance, the U.S. (124)39
or the EU (82).40
FTAAP and RCEP versus TPP
The Asia-Pacific (APAC) trade policy architecture not only resembles a bowl of noodles,41
encompassing well over 100 free trade agreement (FTA) projects, of which almost three-quarters have been signed or entered into force, but also constitutes the world’s most dynamic FTA activity zone.
42 The future of the
transpacific trade policy architecture is now being dominated by a race between the PRC-led Regional
37
By imports alone, China ranked second (behind the U.S.) while Switzerland ranked 21st by exports and 18
th by imports;
WTO (2015), International Trade Statistics 2015 (Geneva: World Trade Organization) 38
Cases have been filed by the U.S. (16), the EU (7), Mexico (4), Canada (3), Japan (2) and Guatemala (1); WTO (2015), ‘Member Information: China and the WTO’,
World Trade Organization, at https://www.wto.org/english/thewto_e/countries_e/china_e.htm, accessed on December 6, 2015 39
WTO (2015), ‘Member Information: United States of America and the WTO’, World Trade Organization, at
https://www.wto.org/english/thewto_e/countries_e/usa_e.htm, accessed on December 6, 2015 40
WTO (2015), ‘Member Information: The European Union and the WTO’, World Trade Organization, at
https://www.wto.org/english/thewto_e/countries_e/european_communities_e.htm, accessed on December 6, 2015 41
That is, a plethora of overlapping agreements that add complexity and confusion 42
Christopher M. Dent (2013), ‘Free Trade Agreements in the Asia-Pacific: Going Around Circles?’, The Evian Group@IMD Expert Perspectives, at
http://www.imd.org/uupload/IMD.WebSite/EvianGroup/Web/982/Free%20Trade%20Agreements%20in%20the%20Asia.pdf, accessed on December 6, 2015
12
Comprehensive Partnership Agreement (RCEP) and Free Trade Area of the Asia-Pacific (FTAAP) on one side and the U.S.-led Trans-Pacific Partnership (TPP) on the other.
The main objective of RCEP is to build a more unified market by lessening the FTA noodle-bowl effect across APAC through harmonization and institutionalization of existing political dialogs as well as a consolidation of existing FTAs. Due to the high complexity reflected in the existing re-gional trade policy architecture as well as heterogeneous political and economic interests of the
16 states participating in the RCEP negotiations,43
the anticipated conclusion of an agreement in
2015 has been postponed to as early as 2016. RCEP’s future prospects will also hinge on the successful management of diplomatic relations between negotiating parties, in spite of periodic geopolitical irritants including overlapping sovereignty claims in the East and South China Seas.
In stark contrast, TPP seeks a concrete elimination or reduction of tariff and non-tariff barriers
through the creation of new trade rules, which obliges its 12 members44
to open up more of their
sectors, thus challenging China to reform its services and foreign investment policies.45
The TPP was signed on October 5 in Atlanta and will have to undergo ratification by its members before it can enter into force, which could prove to be a rather arduous task.
Through FTAAP, China has attempted to geographically expand the reach of RCEP. During Chi-na’s 2014 Asia-Pacific Economic Cooperation (APEC) Presidency, APEC economies agreed to advance the FTAAP process through a “collective strategic study” by 2016, as laid out in the Bei-
jing Roadmap.46
Emerging institutional architecture
Source: Embassy of Switzerland in the People’s Republic of China, FDFA
43
The ten ASEAN member states (Brunei, Cambodia, Indonesia, Laos, Malaysia, Myanmar, the Philippines, Singapore, Thailand and Vietnam), Australia, China, India, Japan,
New Zealand and ROK 44
Australia, Brunei, Canada, Chile, Japan, Malaysia, Mexico, New Zealand, Peru, Singapore, U.S. and Vietnam 45
The Economist (2014), ‘The Trans-Pacific Partnership: No End in Sight’, The Economist, February 25, at
http://www.economist.com/blogs/banyan/2014/02/trans-pacific-partnership-0, accessed on December 6, 2015 46
APEC (2014), ‘Annex A – The Beijing Roadmap for APEC’s Contribution to the Realization of the FTAAP’, 2014 Leaders’ Declarations, at
http://www.apec.org/Meeting-Papers/Leaders-Declarations/2014/2014_aelm/2014_aelm_annexa.aspx, accessed on December 6, 2015
13
Since China is a major trading partner for most TPP and RCEP members, its non-participation in the TPP calls the completion of the U.S.-led arrangement somewhat into question. In turn, the TPP could pose three substantial risks to China: trade diversion, exclusion from negotiations on the future trade architec-ture in APAC and a diminishing geostrategic role.
47 It is important to note that, at this time, China does not
meet important requirements of the TPP (e.g., concerning intangible goods and the services sector), which likely gives additional impetus to follow through with FTAAP as a balancing effort.
China’s FTA network48
China49
has concluded numerous bilateral FTAs. It has, with the respective signatories, let such agree-ments enter into force with Switzerland (July 1, 2014), Iceland (July 1, 2014), Costa Rica (2011), Peru (2010), Singapore (2009), New Zealand (2008), Pakistan (2007), Chile (2006), ASEAN (2005), Macau SAR (2004) and Hong Kong SAR (2004). Moreover, China signed FTAs with Australia and the Republic of Korea (ROK) this year. FTAs defined by the Ministry of Commerce of the People’s Republic of China (MOFCOM) as “under nego-tiation” encompass potential or upgraded ones with ASEAN (signing of the China-ASEAN FTA Upgrading Protocol on November 22), Maldives (second meeting of the China-Maldives Joint Committee of Economy and Trade last September), the Gulf Cooperation Council (GCC; the signing of the 2014–2017 Action Plan put FTA negotiations back on the agenda following a half-a-decade standstill due to China’s exclusion of services), Sri Lanka (second round of negotiations in November 2014) and Norway (halted since the 2010 awarding of the Nobel Peace Prize). The seventh round of negotiations for a trilateral FTA between China, Japan and ROK, which would encompass China’s largest and second largest non-Chinese, Asian trading partners, respectively, was held last April. Feasibility studies have either been launched or completed with several countries including India, Colom-bia, Georgia and Moldova. Moreover, last May, President Xi and Russian President Vladimir Putin signed a joint declaration on cooperation for the integration of the Eurasian Economic Union and the Silk Road Economic Belt. Additionally, China and Canada have held exploratory talks on a potential FTA following the entry into force of the Foreign Investment Protection Agreement between both countries. China has also expressed considerable interest in negotiating an FTA with the EU. However, this option will likely only be taken into deeper consideration once an EU-China bilateral investment treaty is con-cluded and ways to clear hurdles including subsidies, export credits and cheap loans are found. China’s busy FTA activity could lead to an increasingly complicated situation, where agreements overlap each other. Ultimately, synergies between them might have to be created. Agreements between the Mainland and Taiwan While relations between the Mainland and Taiwan have further intensified since direct, government-level talks were initiated between both sides last year, and the signing of the Cross-Strait Services Trade Agreement (CSSTA) in 2013, alleged attempts by the Kuomintang to unilaterally pass the CSSTA led to a political crisis on the island, which had grown out of the Sunflower Student Movement. The CSSTA there-fore remains unratified. Meanwhile, the 12
th round of negotiations on the Cross-Strait Agreement on Trade in Goods, which build
on the landmark Economic Cooperation Framework Agreement (ECFA), took place in Taipei on Novem-ber 23. At the same time, in large part due to its trade dependence on the Mainland, Taiwan has explored the possibility of signing more trade deals in the wider region, including with India, the Philippines and Ma-laysia. However, the One-China policy puts an effective damper on the signing of FTAs with such econo-mies, unless FTAs have already been concluded between the countries in question and the PRC. In that fashion, economic cooperation agreements have entered into force with Singapore (2014) and New Zea-land (2013).
47
Yifan Hu (2013), ‘China’s Trade Agreements: The Inside and Outside Strategy’, Peterson Institute for International Economics, December 24, at
http://blogs.piie.com/china/?p=3631, accessed on December 6, 2015 48
An overview of China’s FTA network can be found on this dedicated subpage of MOFCOM: http://fta.mofcom.gov.cn/english/index.shtml, accessed on December 6, 2015 49
“China” herein refers to the customs territory of the Mainland.
2.2. Outlook for Switzerland After two and a half years of negotiations and its formalization in July 2013, on July 1, 2014, the Switzer-land-China FTA entered into force. The FTA contains chapters on Trade in Goods, Services, Rules of Origin, Customs Procedures and Trade Facilitation, Technical Barriers to Trade/Sanitary and Phytosani-tary Measures (TBT/SPS), Trade Remedies, Intellectual Property Rights (IPR), Competition, Trade and Sustainable Development, Legal and Institutional Provisions as well as Economic and Technical Coopera-tion. Side Agreements on Labour and Employment, Cooperation in the Area of TBT and SPS and Coop-eration in the Area of Certification and Accreditation, among others, were also signed on that occasion.
50
These provide a legal framework for consultations and dispute settlement mechanisms. A first meeting of the Joint Committee established under the Switzerland-China FTA took place in Bern last August. Moreover, various sub-committees were set up to monitor the implementation of the Agree-ment. The provisions of the FTA improve mutual market access for goods and services, enhance legal se-curity for the protection of intellectual property and bilateral economic exchange in general, contribute to sustainable development and deepen bilateral cooperation. While the FTA has become an obvious cornerstone of the Sino-Swiss bilateral trade relationship, it is too early to assess its full impact, as tariff rates will be progressively lowered in the years to come. Partial impact of the Switzerland-China FTA on selected sectors
Source: Sovereign China, based on FTA Annex I Tariff Schedules
2.3. One Belt, One Road The “One Belt, One Road” (OBOR) initiative, also known as the “New Silk Road”, was launched by China with a view to strengthening trade ties with Europe and countries along the original, land-based and mari-time Silk Roads to diversify Chinas trade routes. To enhance the connectivity between these countries, the improvement of infrastructure is a key priority.
51 OBOR passes through over 60 countries across Asia,
Europe, the Middle East and Africa, which account for 70% of the world’s population and 55% of global GNP.
52 The initiative has been described by the Chinese Government as the third round of China’s open-
ing up, after the establishment of the economic zones under Deng Xiaoping in the 1980s and China’s ac-cession to the WTO in 2001. OBOR has two main elements: (1) the “Silk Road Economic Belt”, a land route designed to connect China with Central Asia, Eastern and Western Europe, as well as (2) the “21
st
50
These agreements can be accessed on this dedicated subpage of SECO: http://www.seco.admin.ch/themen/00513/00515/01330/05115/index.html?lang=en,
accessed on December 7, 2015 51
For the political foundations of this project, see the official action plan: NDRC, MFA & MOFCOM (2015),
‘Vision and Actions on Jointly Building Silk Road Economic Belt and 21st-Century Maritime Silk Road’, Xinhuanet, March 28, at
http://news.xinhuanet.com/english/china/2015-03/28/c_134105858.htm, accessed on December 6, 2015 52
Figures vary depending on source; European Council on Foreign Relations (2015),
“One Belt, One Road”: China’s Great Leap Outward (London: European Council on Foreign Relations)
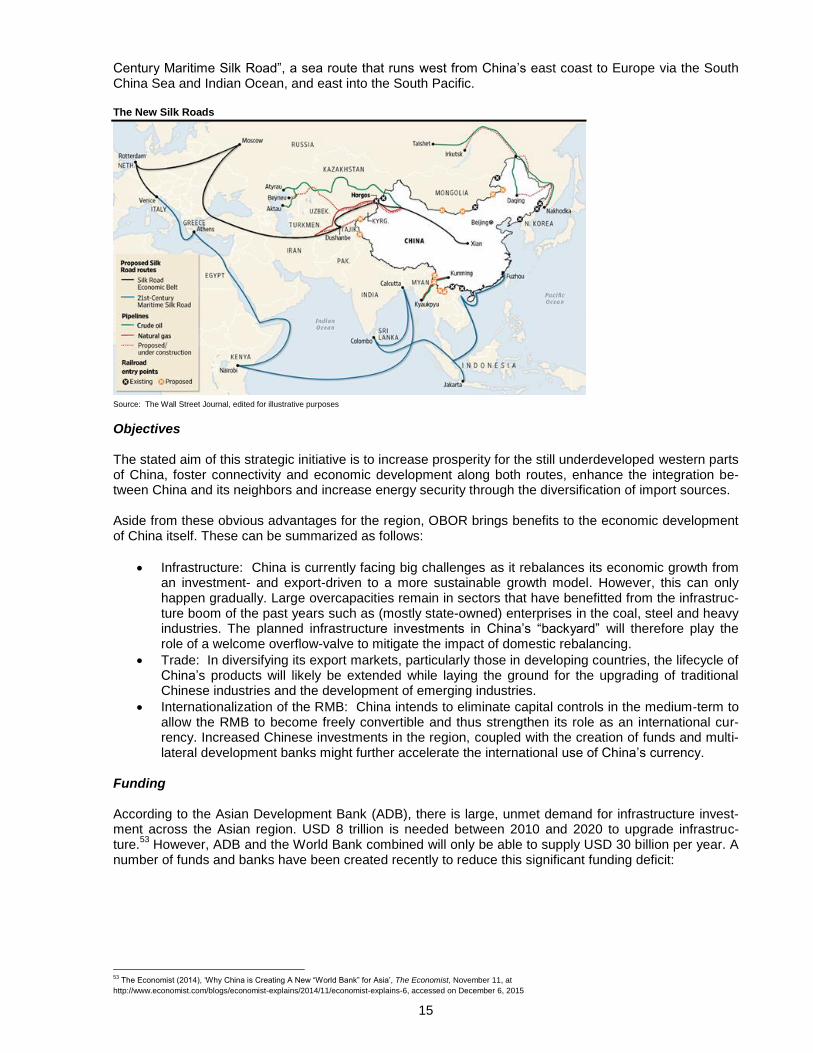
15
Century Maritime Silk Road”, a sea route that runs west from China’s east coast to Europe via the South China Sea and Indian Ocean, and east into the South Pacific. The New Silk Roads
Source: The Wall Street Journal, edited for illustrative purposes
Objectives The stated aim of this strategic initiative is to increase prosperity for the still underdeveloped western parts of China, foster connectivity and economic development along both routes, enhance the integration be-tween China and its neighbors and increase energy security through the diversification of import sources. Aside from these obvious advantages for the region, OBOR brings benefits to the economic development of China itself. These can be summarized as follows:
Infrastructure: China is currently facing big challenges as it rebalances its economic growth from an investment- and export-driven to a more sustainable growth model. However, this can only happen gradually. Large overcapacities remain in sectors that have benefitted from the infrastruc-ture boom of the past years such as (mostly state-owned) enterprises in the coal, steel and heavy industries. The planned infrastructure investments in China’s “backyard” will therefore play the role of a welcome overflow-valve to mitigate the impact of domestic rebalancing.
Trade: In diversifying its export markets, particularly those in developing countries, the lifecycle of China’s products will likely be extended while laying the ground for the upgrading of traditional Chinese industries and the development of emerging industries.
Internationalization of the RMB: China intends to eliminate capital controls in the medium-term to allow the RMB to become freely convertible and thus strengthen its role as an international cur-rency. Increased Chinese investments in the region, coupled with the creation of funds and multi-lateral development banks might further accelerate the international use of China’s currency.
Funding According to the Asian Development Bank (ADB), there is large, unmet demand for infrastructure invest-ment across the Asian region. USD 8 trillion is needed between 2010 and 2020 to upgrade infrastruc-ture.
53 However, ADB and the World Bank combined will only be able to supply USD 30 billion per year. A
number of funds and banks have been created recently to reduce this significant funding deficit:
53
The Economist (2014), ‘Why China is Creating A New “World Bank” for Asia’, The Economist, November 11, at
http://www.economist.com/blogs/economist-explains/2014/11/economist-explains-6, accessed on December 6, 2015
16
Asian Infrastructure Investment Bank (AIIB) with a capital stock of USD 100 billion
Silk Road Fund with a capital stock of USD 40 billion
New Development Bank (NDB)54
with a capital stock of USD 100 billion
China Development Bank (CDB) with a capital stock of USD 16.3 billion
ASEAN Infrastructure Connectivity Fund with a capital stock of USD 20 billion
Maritime Silk Road Bank with a capital stock of USD 810 million Sino-European cooperation Effectively, a prime goal of OBOR in itself, Europe plays a strategic role in China’s new vision of intercon-tinental connectivity. The recent EU-China summit was concluded with the acknowledgement of a strong mutual interest in each other’s flagship projects, the EUR 315 billion Investment Plan for Europe (also known as the “Juncker Plan”) and OBOR. Moreover, several joint projects have been launched in that fashion, aiming at investment in the European and Central Asian regions. The EU has also expressed its support for closer cooperation between China and the European Bank for Reconstruction and Develop-ment (EBRD).
55 In fact, the EBRD approved China’s application for membership of the bank on December
14 and is purportedly ready to work with the AIIB on joint projects.56
Potential for Swiss companies Switzerland is well-placed to play a role in the development of these new trade routes. Not only is Switzer-land the first continental European country to have signed an FTA with China, it is also one of the first Western European states to have applied for membership in the AIIB. Moreover, Switzerland is currently positioning itself as one of the leading centers for the internationalization of the RMB in Europe. This cre-ates a strong foundation for Sino-Swiss cooperation on OBOR. With their strong track record of establishing clean energy and transport infrastructure, Swiss companies could play an important role in the development of the entire region under OBOR’s coverage. Swiss com-panies operating in areas such as agriculture, nutrition, financial services, transport as well as health and life sciences could benefit from increased demand that comes with economic development.
2.4. Asian Infrastructure Investment Bank As one of the first Western European countries to have applied for membership in the AIIB, Switzerland was thus involved in the preparation of this important new financial institution’s articles of agreement. In consequence, Switzerland has been well-positioned within the AIIB from the outset. This move will likely help strengthen relations with China and the wider Asian region. The AIIB is a Chinese initiative that was launched for the purpose of promoting economic development across Asia. Its main areas of activity will include the financing of infrastructure covering the energy, transport and telecommunications sectors as well as urban and rural development & the environment. The AIIB will be able to grant loans, acquire shareholdings and provide guarantees. It will be headquartered in Beijing and will initially have an authorized capital stock of USD 100 billion. Reflecting the regional charac-ter of the bank, its regional members will be the majority shareholders, holding approximately 75% of shares. Switzerland plans to contribute a total of USD 706.4 million to the capital stock of the AIIB, which will be equivalent to a 0.87% share of total votes. The bank’s articles of agreement were signed in Beijing on June 29 by representatives from 57 prospec-tive founding members (of which 20 were extra-regional). Swiss Federal Councilor Johann Schneider-Ammann signed the document for Switzerland. The new institution has the potential to become an im-portant new part of the international financial architecture and play a major role in the financing of infra-structure in Asia alongside existing development banks. The AIIB is expected to become operational in early 2016.
54
Formerly known as the BRICS Development Bank 55
European Commission (2015), ‘EU-China High Level Economic Dialogue, Beijing, 28/9/2015: Factsheet on “EU-China Investment Cooperation”’, European Commission,
September 28, at http://ec.europa.eu/priorities/jobs-growth-investment/plan/docs/factsheet-eu-china-investment-cooperation_en.pdf, accessed on December 6, 2015 56
Anthony Williams (2015), ‘EBRD Approves China Membership Application’, European Bank for Reconstruction and Development, December 14, at
http://www.ebrd.com/news/2015/ebrd-approves-china-membership-application.html, accessed on December 16, 2015
17
3 Foreign Trade
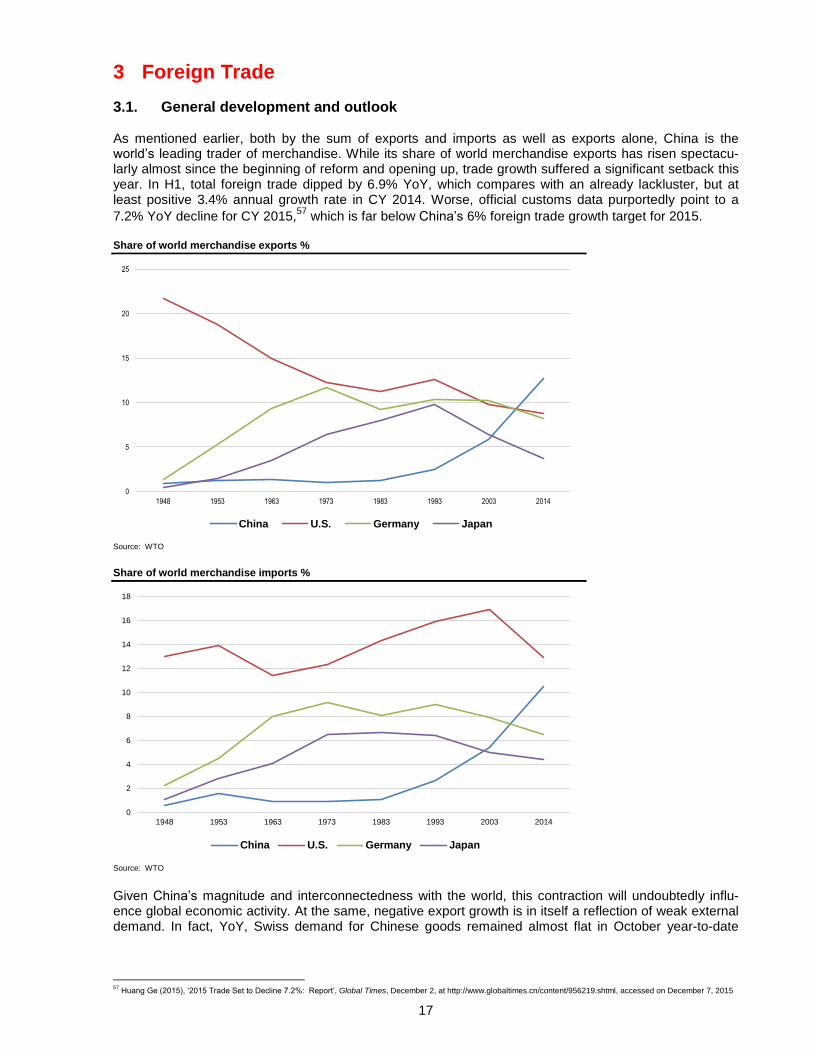
3.1. General development and outlook As mentioned earlier, both by the sum of exports and imports as well as exports alone, China is the world’s leading trader of merchandise. While its share of world merchandise exports has risen spectacu-larly almost since the beginning of reform and opening up, trade growth suffered a significant setback this year. In H1, total foreign trade dipped by 6.9% YoY, which compares with an already lackluster, but at least positive 3.4% annual growth rate in CY 2014. Worse, official customs data purportedly point to a
7.2% YoY decline for CY 2015,57
which is far below China’s 6% foreign trade growth target for 2015. Share of world merchandise exports %
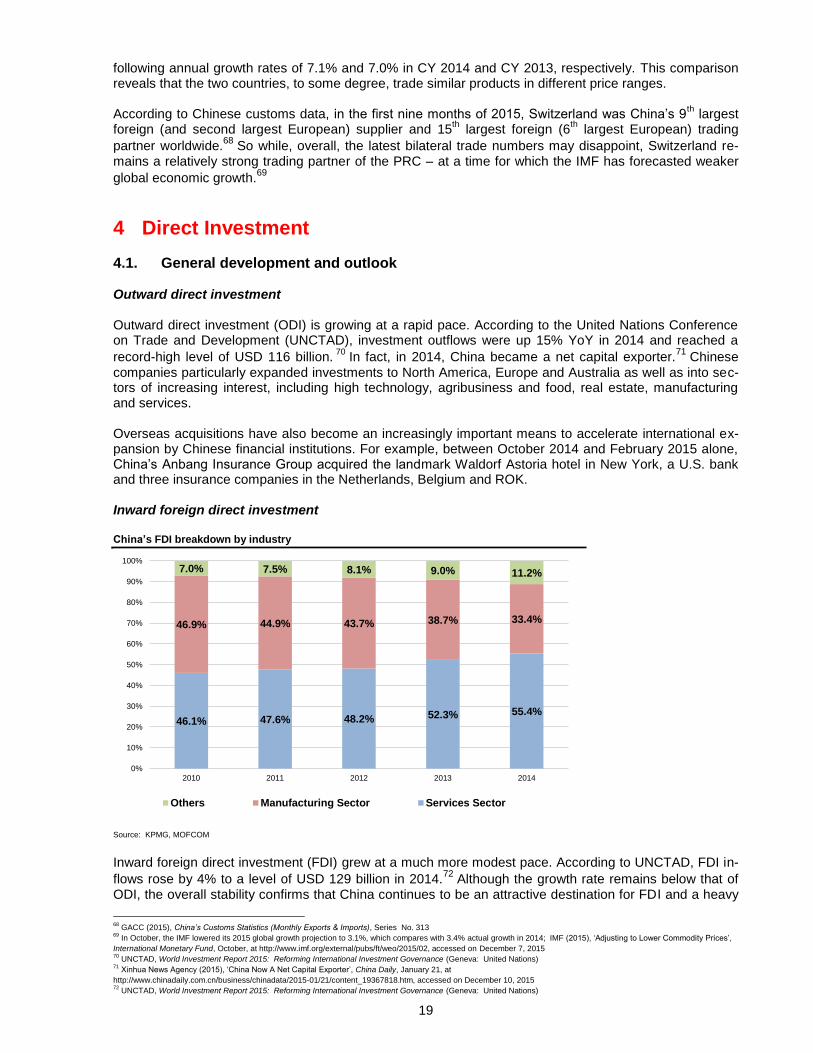
Source: WTO Share of world merchandise imports %
Source: WTO Given China’s magnitude and interconnectedness with the world, this contraction will undoubtedly influ-ence global economic activity. At the same, negative export growth is in itself a reflection of weak external demand. In fact, YoY, Swiss demand for Chinese goods remained almost flat in October year-to-date
57
Huang Ge (2015), ‘2015 Trade Set to Decline 7.2%: Report’, Global Times, December 2, at http://www.globaltimes.cn/content/956219.shtml, accessed on December 7, 2015
0
5
10
15
20
25
1948 1953 1963 1973 1983 1993 2003 2014
China U.S. Germany Japan
0
2
4
6
8
10
12
14
16
18
1948 1953 1963 1973 1983 1993 2003 2014
China U.S. Germany Japan
18
(YTD).58
Export growth aside, import growth saw an even wider contraction during the first eleven months
of this year, partially due to sinking commodity prices.59
Looking on the bright side, while Chinese customs statistics show that, YoY, in September the Mainland’s YTD trade with most of its key trading partners, including Hong Kong (-11.5%), Japan (-11.1%), ROK (-6.4%), Taiwan (-5.5%) and Germany (-11.1%), shrank substantially – the U.S. being an important excep-tion (+2.0%) given relatively strong export growth with that country (+6.0%) – during the same period, total trade grew with key ASEAN economies, including Thailand (+5.7%), Singapore (+3.8%), the Philippines (+3.8%), Vietnam (+12.0%) and Cambodia (+17.0%), as well as some nations along the Maritime Silk
Road, including Sri Lanka (+18.6%) and Maldives (+62.2%).60
Although the trade in merchandise weighs heavily on these growth rates, the increasing significance of Chinese trade in commercial services should not be discounted. In 2014, China was the fifth largest ex-porter (behind the U.S., the UK, France and Germany) and second largest importer (behind the U.S.) of
commercial services worldwide.61
Chinese annual export (+12%) as well as import (+15%) growth out-
paced average as well as those of leading providers of commercial services by far.62
Since Q2 2014 service sector growth in China has hovered around the 10% mark, while growth in the in-
dustrial sector has edged closer to zero.63
Moreover, the State Council is targeting trade in services worth USD 1 trillion by 2020 as part of its reform program under the New Normal, suggesting upside potential for future exports of Chinese services in spite of the country’s widened commercial services trade deficit (up
21% YoY in 2014 and 38% YoY in 2013).64
3.2. Trade with Switzerland65 The trade balance continues to be positive for Switzerland, amounting to a CHF 5.0 billion trade surplus with the Mainland and a CHF 21.5 billion trade surplus with the Mainland and Hong Kong combined in the first ten months of this year, YoY. During the same period, the total volume of goods traded with the Main-land stood at CHF 25.1 billion, up 7.4% over the same period in 2014, which compares with -6.0% YoY and 56.9% YoY growth in CY 2014 and CY 2013, respectively. While these growth rates point to a downward trend, it is important to recognize that Switzerland’s trade with China during the first 12 months since enforcement of the FTA grew much more strongly than Swit-
zerland’s trade with the rest of the world.66
During that period, Swiss exports to China rose by 3% and im-ports from China rose by at least 4%, while Swiss exports to the rest of the world increased by only
0.4%.67
Also, 7.4% annual trade volume growth in October YTD follows at a time when trade growth be-tween China and most of its key trading partners is negative. At the product type level, at the end of October YTD, YoY, the Swiss precision instrument and watch in-dustries lead export growth. Their numbers were up 4.1%, compared with -4.2% in CY 2014 and -3.4% in CY 2013. During the same period, Swiss machinery, apparatus and electronics exports decreased by 13.3% following growth rates of 6.7% and 6.0% in CY 2014 and CY 2013, respectively. Meanwhile, ex-ports from the Swiss chemicals and pharmaceuticals industries showed an increase of 1.8%, following strong growth rates of 22.1% and 43.0% in CY 2014 and CY 2013, respectively. Switzerland also imported machinery, apparatus and electronics from China, worth around 132% more than the total value of these goods exported to China, at the end of October YTD. These imports were down 3.1% YoY following annual growth rates of 7.4% and 18.4% in CY 2014 and CY 2013, respectively. During the same period, imports of Chinese precision instrument and watch products gained 17.1% YoY,
58
According to FCA data, which can be accessed here: https://www.swiss-impex.admin.ch, accessed on December 7, 2015 59
HSBC Global Research (2015), ‘China (Trade, November 2015)’, HSBC China Macro Series (Hong Kong: Hongkong and Shanghai Banking Corporation) 60
WTO (2015), International Trade Statistics 2015 (Geneva: World Trade Organization) 62
ibid. 63
Chi Lo (2015), ‘What Lies Beneath China’s Renminbi Shock?’, Chi on China Series (Hong Kong: BNPP IP) 64
Embassy estimates based on data gathered from WTO (2015), International Trade Statistics 2015 (Geneva: World Trade Organization), WTO (2014), International Trade Sta-
tistics 2014 (Geneva: World Trade Organization) & WTO (2013), International Trade Statistics 2013 (Geneva: World Trade Organization) 65
Unless otherwise indicated, FCA data was used for this section, which can be accessed here: https://www.swiss-impex.admin.ch, accessed on December 7, 2015 66
SECO (2015), ‘1st Anniversary of Free Trade Agreement Between Switzerland and China: A Milestone in Foreign Economic Policy’, State Secretariat for Economic Affairs,
June 30, at http://www.seco.admin.ch/aktuell/00277/01164/01980/index.html?lang=en&msg-id=57913, accessed on December 7, 2015 67
ibid.
19
following annual growth rates of 7.1% and 7.0% in CY 2014 and CY 2013, respectively. This comparison reveals that the two countries, to some degree, trade similar products in different price ranges. According to Chinese customs data, in the first nine months of 2015, Switzerland was China’s 9
th largest
foreign (and second largest European) supplier and 15th largest foreign (6
th largest European) trading
partner worldwide.68
So while, overall, the latest bilateral trade numbers may disappoint, Switzerland re-mains a relatively strong trading partner of the PRC – at a time for which the IMF has forecasted weaker
global economic growth.69
4 Direct Investment
4.1. General development and outlook Outward direct investment Outward direct investment (ODI) is growing at a rapid pace. According to the United Nations Conference on Trade and Development (UNCTAD), investment outflows were up 15% YoY in 2014 and reached a
record-high level of USD 116 billion. 70
In fact, in 2014, China became a net capital exporter.71
Chinese
companies particularly expanded investments to North America, Europe and Australia as well as into sec-tors of increasing interest, including high technology, agribusiness and food, real estate, manufacturing and services. Overseas acquisitions have also become an increasingly important means to accelerate international ex-pansion by Chinese financial institutions. For example, between October 2014 and February 2015 alone, China’s Anbang Insurance Group acquired the landmark Waldorf Astoria hotel in New York, a U.S. bank and three insurance companies in the Netherlands, Belgium and ROK. Inward foreign direct investment
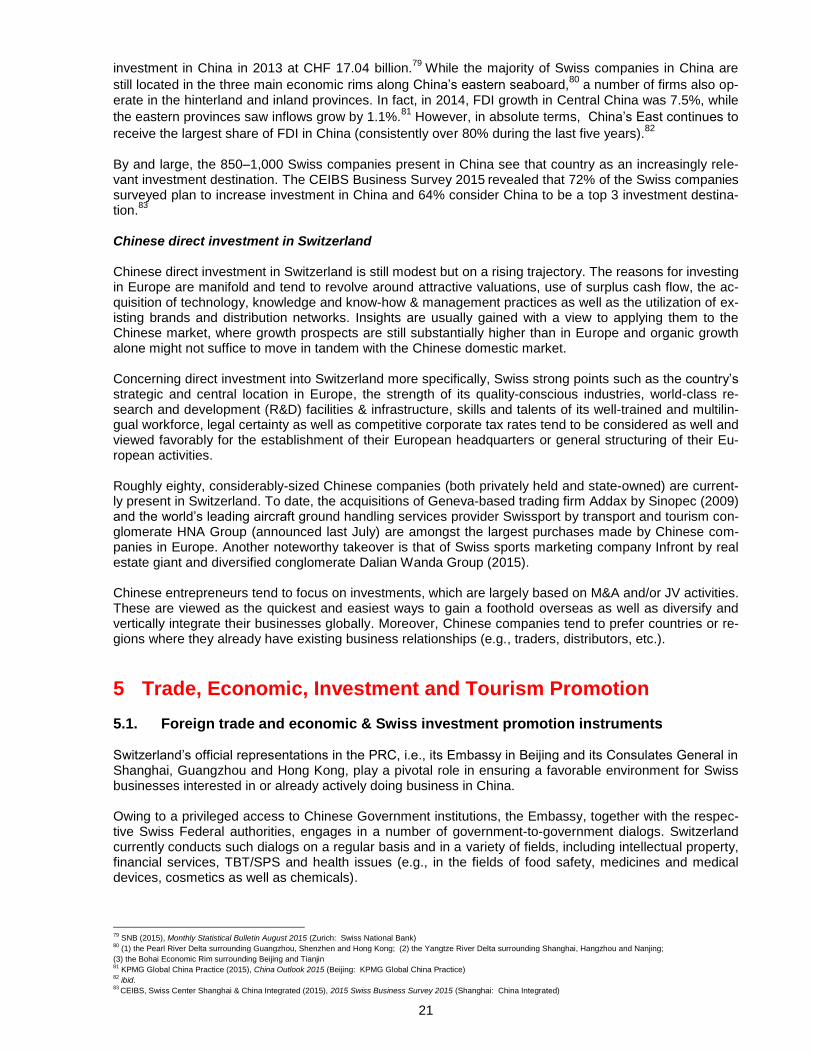
China’s FDI breakdown by industry
Source: KPMG, MOFCOM Inward foreign direct investment (FDI) grew at a much more modest pace. According to UNCTAD, FDI in-
flows rose by 4% to a level of USD 129 billion in 2014.72
Although the growth rate remains below that of ODI, the overall stability confirms that China continues to be an attractive destination for FDI and a heavy
In October, the IMF lowered its 2015 global growth projection to 3.1%, which compares with 3.4% actual growth in 2014; IMF (2015), ‘Adjusting to Lower Commodity Prices’,
International Monetary Fund, October, at http://www.imf.org/external/pubs/ft/weo/2015/02, accessed on December 7, 2015 70
UNCTAD, World Investment Report 2015: Reforming International Investment Governance (Geneva: United Nations) 71
Xinhua News Agency (2015), ‘China Now A Net Capital Exporter’, China Daily, January 21, at
http://www.chinadaily.com.cn/business/chinadata/2015-01/21/content_19367818.htm, accessed on December 10, 2015 72
UNCTAD, World Investment Report 2015: Reforming International Investment Governance (Geneva: United Nations)
46.1% 47.6% 48.2% 52.3% 55.4%
46.9% 44.9% 43.7% 38.7% 33.4%
7.0% 7.5% 8.1% 9.0% 11.2%
0%
10%
20%
30%
40%
50%
60%
70%
80%
90%
100%
2010 2011 2012 2013 2014
Others Manufacturing Sector Services Sector
20
weight by international standards. In fact, China has even surpassed the U.S. to become the world’s larg-est FDI recipient in 2014. MOFCOM statistics show that growth in the services sector was particularly strong, while manufacturing FDI saw a double-digit decline. With a view to keeping China attractive as a destination for FDI, the authorities have already made efforts to simplify and streamline the investment approval system. Smaller foreign investment projects in particu-lar could benefit from a more simple registration process – however, only if they are executed as part of a joint venture (JV) controlled by Chinese investors.
73
General outlook Looking ahead, weaker economic dynamics point to slowing investment growth. At the same time, a num-ber of factors suggest that, generally, conditions for direct investment should remain intact. As for ODI, some major elements of China’s national strategic initiatives will likely help spur growth. These include projects related to OBOR and the AIIB. Moreover, investment activities of Chinese companies ap-pear to increasingly target more value-added sectors including agribusiness and food, technology, high-end manufacturing and real estate across a broader range of countries and regions, notably including de-veloped markets. According to KPMG, this shifting focus from “quantity and speed” to “quality and efficiency” should bode well for future ODI dynamics, and Chinese companies are increasingly looking at strengthening their rela-tions with foreign partners in order to make use of local know-how and market opportunities in a most effi-
cient manner.74
This trend will likely continue as it brings clear benefits to both parties. Concerning the prospective development of inward FDI, a number of initiatives that may benefit foreign in-vestors are underway. For example, continuous efforts were made in 2014 to improve the business envi-ronment for the healthcare industry in China, allowing full foreign ownership of private hospitals in seven major cities and provinces. Additionally, further steps have been taken towards financial market liberaliza-tion and reducing competitive disadvantages faced by foreign players (particularly foreign banks) in China. Foreign Investment Law A new Foreign Investment Law (a draft version was released in January 2015) will likely relax foreign in-vestment regulations and streamline the currently rather fragmented regulatory framework.
75 While under
the current laws most new foreign investments are subject to a complex and lengthy approval process, the draft law adopts a “negative list” approach. Approval processes for projects that are not on the negative list will be shortened to a simple filing procedure.
76 Another notable change brought forward by the new
law is the abandonment of the existing, various foreign enterprise structures in favor of the so-called “Na-tional Treatment”, which would introduce the same incorporation scheme and governing body for both domestic and foreign companies. This measure could help create a more level playing field and reduce bureaucracy. On the downside, National Treatment would likely provide more scope for the government to increase its scrutiny of foreign investors, which is particularly relevant to foreign investors engaged in polit-ically sensitive areas.
77
4.2. Investment flows from and to Switzerland Swiss direct investment in China MOFCOM statistics show that Swiss direct investment in China amounted to USD 315 million in 2013. Figures published by the Swiss National Bank (SNB) differ significantly,
78 putting the stock of Swiss direct
73
KPMG Global China Practice (2015), China Outlook 2015 (Beijing: KPMG Global China Practice) 74
ibid. 75
Clifford Chance (2015), ‘China Proposes New Foreign Investment Law’, Clifford Chance Client Briefing, February 6, at
http://www.cliffordchance.com/briefings/2015/02/china_proposes_newforeigninvestmentlaw.html, accessed on December 8, 2015 76
KPMG Global China Practice (2015), China Outlook 2015 (Beijing: KPMG Global China Practice) 77
Dezan Shira & Associates (2015), ‘China Releases Draft Foreign Investment Law, Signaling Major Overhaul for Foreign Investment’, China Briefing, January 21, at
FDI data tends to be collected on both sides, i.e., in the country from which the direct investment originates and in the country in which the direct investment is received. Since
the entities collecting the data in both countries cannot exchange pertinent information due to confidentiality reasons, figures released by different countries are not aligned and
may therefore vary substantially, as in this case.
21
investment in China in 2013 at CHF 17.04 billion.79
While the majority of Swiss companies in China are
still located in the three main economic rims along China’s eastern seaboard,80
a number of firms also op-erate in the hinterland and inland provinces. In fact, in 2014, FDI growth in Central China was 7.5%, while
the eastern provinces saw inflows grow by 1.1%.81
However, in absolute terms, China’s East continues to
receive the largest share of FDI in China (consistently over 80% during the last five years).82
By and large, the 850–1,000 Swiss companies present in China see that country as an increasingly rele-vant investment destination. The CEIBS Business Survey 2015
revealed that 72% of the Swiss companies
surveyed plan to increase investment in China and 64% consider China to be a top 3 investment destina-tion.
83
Chinese direct investment in Switzerland
Chinese direct investment in Switzerland is still modest but on a rising trajectory. The reasons for investing in Europe are manifold and tend to revolve around attractive valuations, use of surplus cash flow, the ac-quisition of technology, knowledge and know-how & management practices as well as the utilization of ex-isting brands and distribution networks. Insights are usually gained with a view to applying them to the Chinese market, where growth prospects are still substantially higher than in Europe and organic growth alone might not suffice to move in tandem with the Chinese domestic market. Concerning direct investment into Switzerland more specifically, Swiss strong points such as the country’s strategic and central location in Europe, the strength of its quality-conscious industries, world-class re-search and development (R&D) facilities & infrastructure, skills and talents of its well-trained and multilin-gual workforce, legal certainty as well as competitive corporate tax rates tend to be considered as well and viewed favorably for the establishment of their European headquarters or general structuring of their Eu-ropean activities. Roughly eighty, considerably-sized Chinese companies (both privately held and state-owned) are current-ly present in Switzerland. To date, the acquisitions of Geneva-based trading firm Addax by Sinopec (2009) and the world’s leading aircraft ground handling services provider Swissport by transport and tourism con-glomerate HNA Group (announced last July) are amongst the largest purchases made by Chinese com-panies in Europe. Another noteworthy takeover is that of Swiss sports marketing company Infront by real estate giant and diversified conglomerate Dalian Wanda Group (2015). Chinese entrepreneurs tend to focus on investments, which are largely based on M&A and/or JV activities. These are viewed as the quickest and easiest ways to gain a foothold overseas as well as diversify and vertically integrate their businesses globally. Moreover, Chinese companies tend to prefer countries or re-gions where they already have existing business relationships (e.g., traders, distributors, etc.).
5 Trade, Economic, Investment and Tourism Promotion
5.1. Foreign trade and economic & Swiss investment promotion instruments Switzerland’s official representations in the PRC, i.e., its Embassy in Beijing and its Consulates General in Shanghai, Guangzhou and Hong Kong, play a pivotal role in ensuring a favorable environment for Swiss businesses interested in or already actively doing business in China. Owing to a privileged access to Chinese Government institutions, the Embassy, together with the respec-tive Swiss Federal authorities, engages in a number of government-to-government dialogs. Switzerland currently conducts such dialogs on a regular basis and in a variety of fields, including intellectual property, financial services, TBT/SPS and health issues (e.g., in the fields of food safety, medicines and medical devices, cosmetics as well as chemicals).
79
SNB (2015), Monthly Statistical Bulletin August 2015 (Zurich: Swiss National Bank) 80
(1) the Pearl River Delta surrounding Guangzhou, Shenzhen and Hong Kong; (2) the Yangtze River Delta surrounding Shanghai, Hangzhou and Nanjing;
(3) the Bohai Economic Rim surrounding Beijing and Tianjin 81
KPMG Global China Practice (2015), China Outlook 2015 (Beijing: KPMG Global China Practice) 82
ibid. 83
CEIBS, Swiss Center Shanghai & China Integrated (2015), 2015 Swiss Business Survey 2015 (Shanghai: China Integrated)
22
The Swiss Business Hub (SBH) China is fully integrated into the operations of the Embassy and Consu-lates General on the Mainland, while SBH Hong Kong is part of the Consulate General in Hong Kong. The SBH is the representative office of Switzerland Global Enterprise (S-GE), operating out of Beijing, Shang-hai, Guangzhou and Hong Kong. S-GE’s role as a center of excellence for internationalization is to foster exports, imports and investments, help Swiss companies develop new potential for their international businesses and strengthen Switzerland as an economic hub. As such, S-GE, with its global network of experienced advisers and experts is a strong and trusted partner for its customers, the cantons and the Swiss Government. SBH China is dedicated to promoting both Swiss exports to China and Chinese investments into Switzerland. Due to its official status and its estab-lished market position, the SBH has built a first-rate network of contacts, creating synergies for both man-dates. The export promotion mandate raises awareness of Swiss products and services in China and helps Swiss small and medium-sized enterprises (SMEs) to exploit market opportunities. It includes the provi-sion of services in the following areas:
Individual consulting and SME coaching
Market and product analysis
Search for representatives and import partners
Reporting on trade fairs in China
Organization of events and fact-finding missions for Swiss companies
Assistance with company setups The investment promotion activities position Switzerland as an ideal business location and aim to gener-ate greenfield investment from China. These include:
Identification of potential investors and businesses
Provision of information on the Swiss economy to Chinese companies and media
Promotion of Switzerland as an investment location Moreover, aside from organizing private dinners, seminars and roadshows to promote investment into Switzerland, SBH China also publishes brochures and manuals & gives presentations. The cantons and Swiss regional clusters also have their own investment promotion representatives in China who regularly participate in SBH activities. The Cleantech Switzerland platform will be dismantled at the end of 2015. The Cleantech mandate will be taken over by S-GE, which will add two Cleantech specialists to its base in Zurich. The interface in China will be handled by the SBH, which will be in charge of the cooperation with the Sino-Swiss Zhenjiang Eco-logical Industrial Park. SECO partner and other organizations such as the United Nations Industrial Devel-opment Organization (UNIDO) and the International Institute for Sustainable Development (IISD) have ex-ecuted projects in cleaner production and voluntary sustainability standards in the park. To strengthen bilateral cooperation in the fields of higher education, research and innovation, a swissnex office was opened in Shanghai in August 2008. swissnex China takes an active role in strengthening Switzerland’s leading position as a world-class location for science, education and innovation. Further-more, by carrying out multiple networking activities and tasks, swissnex promotes Switzerland as a nation known for its cutting-edge research, high quality, innovation and openness. In China, swissnex is repre-sented in Shanghai (swissnex office), Beijing (Embassy) and Guangzhou (Consulate General). The Swiss Chinese Chambers of Commerce, separately registered in China and Switzerland, are non-profit organizations serving the Sino-Swiss business community. The SwissCham China network counts around 600 members representing organizations (including leading Swiss companies in the industrial and financial sectors) and additional individual members. It is a networking and information platform for both Swiss companies in China and Chinese companies interested in Switzerland. Its main goal is to gather all members of the Sino-Swiss business community on a single platform, stimulate interaction between them and help develop business opportunities. Various private, Shanghai-based consultants (including China Integrated, sim and CBC) who operate across China and actively support Swiss companies to develop their Chinese businesses further support these activities.
23
The Embassy, the Consulates General, the SBH, swissnex and SwissCham work very closely together to promote Swiss business interests across China.
5.2. Interest and further development of Switzerland’s financial center China is rapidly gathering pace in positioning the RMB as an internationally used currency. Over the past few years, the RMB steadily increased its standing on the Society for Worldwide Interbank Financial Tele-communication (SWIFT) list of most commonly used payment currencies worldwide. With a share of 2.8% in global payments last August, the RMB recently overtook the Japanese yen (JPY) to become the world’s
fourth most-used currency.84
It has since fallen back to fifth position, according to SWIFT data.85
However, the trend suggests that it is only a matter of time before the RMB will more permanently cross that line again, having overtaken seven currencies during the last three years. Moreover, increased Chi-nese investment across Asia and elsewhere paired with the creation of funds and multilateral develop-ment banks will likely further accelerate the international use of the RMB. RMB’s share in global payments
Source: SWIFT As the internationalization of the renminbi opens up interesting new business opportunities in the financial sector, various international financial centers have intensified their efforts to position themselves as off-shore RMB hubs. Following an intense phase of discussions on Sino-Swiss cooperation in this area, a number of important new arrangements were agreed on in order to strengthen Switzerland’s role as a competitive and full-fledged European RMB hub:
In July 2014, the SNB and the PBoC signed a currency swap agreement with a limit of RMB 150
billion (or CHF 21 billion).
In January 2015, the PBoC decided to extend the pilot scheme of the RMB Qualified Foreign Insti-tutional Investor (RQFII) to Switzerland with a quota of RMB 50 billion. Zurich-based Swiss Re was the first company to apply for a share of the Swiss quota this year.
In January 2015, the SNB and the PBoC signed a Memorandum of Understanding on the estab-lishment of RMB clearing arrangements in Switzerland.
In order (among others) to take on the role of an RMB clearing bank in Switzerland, CCB is ex-pected open an office in Zurich shortly. It has been granted a banking license by the Swiss Finan-cial Market Supervisory Authority (FINMA).
As mentioned earlier, on November 9, 2015, the PBoC authorized direct trading between the RMB and the CHF.
Furthermore, the regular Financial Dialogue between the Swiss and the Chinese authorities will continue to explore ways of cooperation against the backdrop of RMB internationalization. The third round of this dialog took place in Beijing in early September 2015.
84
Gabriel Wildau (2015), ‘Renminbi Overtakes Japanese Yen as Global Payments Currency’, Financial Times, October 6, at
http://www.ft.com/cms/s/0/bb54b4f0-6bf2-11e5-aca9-d87542bf8673.html, accessed on December 9, 2015 85
SWIFT (2015), ‘RMB Falls Back to Position #5 as an International Payments Currency’, Society for Worldwide Interbank Financial Telecommunication, October 29, at
http://www.swift.com/about_swift/shownews?param_dcr=news.data/en/swift_com/2015/PR_RMB.xml, accessed on December 9, 2015
24
Also, with the Chinese – Swiss Financial Round Table, a private sector platform was created to discuss RMB-related topics and find new forms of collaboration. The second Round Table took place in Beijing in early September 2015.
5.3. Interest and further development of Switzerland as a location for tourism, educa-tion and other services
According to a Pew Research Center survey published last November, while a global median of 54% re-gard climate change as “a very serious problem”, a mere 18% of Chinese agreed that that was indeed the
case.86
Interestingly, the same survey revealed that 71% of Chinese would support their country to curb
greenhouse gas emissions as part of an international treaty.87
These seemingly contradictory outcomes demonstrate that while climate change tends to be considered as more of a long-term, indirect threat, the direct environmental ramifications of carbon dioxide emissions are perceived to be more urgent, which is reflective of the fact that less than 9% of China’s urban population lives in cities that meet national stand-ards for air quality.
88
Against this backdrop, immaterial values including nature, health and clean air are gaining in importance, making Switzerland an ideal destination for those in search of greater exposure to them. In fact, in China’s top-tier cities, as a side effect of the anti-corruption campaign, the high-end luxury sector is facing tremen-dous challenges, adding to the increasing popularity of those immaterial values.
89
Moreover, awareness for physical fitness is not just driven by increased spending on sport-related prod-ucts but also by Beijing’s recently successful bid to host the 2022 Winter Olympics. Given its aim to boost the sports industry as a new economic driver, there is reason to believe that the fitness industry will be one of the fastest-growing markets on the Mainland.
90 This presents Switzerland with an excellent oppor-
tunity to attract Chinese tourists to its winter sport regions. Moreover, Beijing’s 2022 Winter Olympics could contribute to a ski boom in the years to come. While the Swiss tourism industry has been feeling the effects of the strong CHF, expecting a 1.5% YoY drop in tourism demand this winter season,
91 there has been a steady increase in the share of tourists vis-
iting from the Mainland (4.19% in 2013, 4.80% in 2014 and 6.54% in September YTD 2015), Hong Kong (0.39% in 2013, 0.39% in 2014 and 0.50% in September YTD 2015) and Taiwan (0.36% in 2013, 0.42% in 2014 and 0.58% in September YTD 2015).
92 In absolute terms, combined, their numbers for the first nine
months of 2015 already exceeded those recorded during the entire year of 2014, by 87,550. As for education, Switzerland remains attractive to Chinese students. While Switzerland is well-known for its world-class hotel management colleges as well as for its high cost of living, the number of Chinese stu-dents studying there has been growing steadily. 1,335 Chinese nationals were enrolled at Swiss universi-ties for the academic year 2013/2014. Over the last decade, the number of Chinese students in Switzer-land has more than doubled – the main reasons being the high positions of Swiss universities in worldwide rankings and the increasing number of Master programs taught in English.
86
Bruce Stokes, Richard Wike & Jill Carle (2015), ‘Global Concern About Climate Change, Broad Support for Limiting Emissions’, Pew Research Center, November 15, at
http://www.pewglobal.org/2015/11/05/global-concern-about-climate-change-broad-support-for-limiting-emissions, accessed on November 18, 2015 87
ibid. 88
吕光一 (2015), ‘研究称仅 9%中国城市人口享有合格空气’, Caixin, October 21, at http://china.caixin.com/2015-10-21/100865175.html, accessed on November 18, 2015 89
Jamil Anderlini (2015), ‘Louis Vuitton Stung by China Luxury Woes‘, Financial Times, November 16, at
http://www.ft.com/cms/s/0/51e1dc9e-8c33-11e5-a549-b89a1dfede9b.html#axzz3roOmLvYf, accessed on November 18, 2015 90
Sun Xiaochen (2015), ‘Experts Call for Strategy to Give China’s Sports Industry a Boost’, China Daily, November 17, at
http://www.chinadaily.com.cn/business/2015-11/17/content_22468086.htm, accessed on November 18, 2015 91
swissInfo.ch (2015), ‘A Stagnant Winter Season for Swiss Tourism‘, swissInfo, October 23, at
http://www.swissinfo.ch/eng/strong-franc_a-stagnant-winter-season-for-swiss-tourism/41737406, accessed on November 18, 2015 92
According to Swiss Federal Statistical Office data, which can be accessed here: http://www.bfs.admin.ch/bfs/portal/en/index.html, accessed on December 9, 2015
25
6 Energy and Environment
6.1. Rebalancing the domestic energy mix According to BP, by 2035, China’s energy production will likely have risen by 47%, while consumption
may have grown by 60%.93
Moreover, coal’s dominance is expected to decline from 68% in 2015 to 51%
in 2035, while natural gas’ share of the energy mix could more than double to 12%.94
BP also expects fossil fuel demand to have expanded by 21% for coal, 67% for oil and 270% for gas, while renewable, nu-
clear and hydro could see strong growth rates of 580%, 910% and 50%, respectively.95
In spite of current energy conservation policies, these trends could see China become not just the world’s largest consumer
but also biggest importer of liquid fuels by 2035.96
Due to China’s fossil fuel-dominated energy structure and large industrial sector, the country is exposed to the price volatility of global energy markets. Sectors of the economy with high exposure to price risk ac-count for about 20% of GDP.
97 Moreover, as suggested earlier, there is a growing level of concern about
the state of the environment as well as pertinent health risks in China, which will likely increase with higher standards of living and already has grabbed the attention of the central government and policy-makers. To that end, China undoubtedly recognizes the necessity to gradually shift from fossil energy to clean en-ergy sources. In fact, the NDRC intends to increase the share of renewable energies from 8.6% in 2010 and 11.4% in 2015 to 15% of total energy production in 2020 (and to 20% in 2030) while lowering the on-
grid electricity price from RMB 0.90~1.00 per kWh in 2015 to RMB 0.60~0.80 per kWh by 2020.98
The Re-form Commission is looking at efforts to accelerate the development of wind power as an important way to reach the aforementioned goals, concentrating on Xinjiang and Inner Mongolia Autonomous Regions as
well as offshore wind farms in the Yellow Sea.99
A potential impediment to the achievement of such objectives is the current use of subsidies benefitting coal and fossil energy source-intensive industries. The IISD has identified eighteen pertinent subsidies in-cluding tax breaks, investment in fixed assets and the provision of oil infrastructure.
100 Whereas renewa-
bles subsidies have amounted to RMB 103 billion in 2015, aggregate coal and fossil fuel subsidies amounted to RMB 194 billion.
101
While domestic coal production decreased by 2.5% in 2014, followed by a 10.9% dip in coal imports dur-
ing the same year,102
several factors favor the continued use of coal:
Currently, around 5.8 million people are still employed in coal extraction in China.103
In parts of China (including Shanxi and Shaanxi Provinces as well as Inner Mongolia Autonomous Region), coal extraction continues to be a key driver of local economies.
International coal prices have followed crude oil prices downwards to reach record-low levels and are unlikely to change direction until a significant number of new coal-fired power plants currently
in the development pipeline enters the grid across APAC.104
On-going and future urbanization efforts will support rising energy consumption. Against this backdrop, it will undoubtedly be tempting to pit coal’s abundance, relative reliability and simple ex-
93
BP (2015), BP Energy Outlook 2035 (London: British Petroleum p.l.c.) 94
ibid. 95
ibid. 96
ibid. 97
Institute of Energy, Environment and Economy, Tsinghua University (2014), China and The New Climate Economy (Beijing: Tsinghua University) 98
Zhao Yongqiang (2015), ‘Competitiveness of Renewable Energy, Fair Play, Necessity of Energy and Environmental Tax’,
Coal and Renewable Energy: Building a Sustainable Electricity Sector in China, Beijing, September 16, Workshop hosted by IISD 99
ibid. 100
Ivetta Gerasimchuck (2015), ‘Coal Subsidies and Their Impact on Renewable Energy’,
Coal and Renewable Energy: Building a Sustainable Electricity Sector in China, Beijing, September 16, Workshop hosted by IISD 101
ibid. 102
ibid. 103
Gørild Heggelund & Per Ove Eikeland (2015), ‘Corporate Responses to Coal Policy in China’,
Coal and Renewable Energy: Building a Sustainable Electricity Sector in China, Beijing, September 16, Workshop hosted by IISD 104
Especially in ASEAN, where coal’s share of electricity generation will likely have risen to one-half in 2035 (from around one-third in 2013) according to the IEA; IEA (2013), Southeast Asia Energy Outlook (Paris: International Energy Agency)
26
traction against,105
for instance, the heavy mismatch between installed and actual capacities of
wind turbines.106
Subsidies aside, multiple factors could determine the successful development of renewable energies, in-
cluding the shape of economic restructuring, risks to technological upgrading and fluctuating oil prices.107
Source: ICE, Trading Economics, edited for illustrative purposes
6.2. China’s efforts to promote low-carbon growth Nonetheless, given the various risks associated with environmental pollution, the promotion of a low-carbon, resource-efficient economy has become an important priority of the Chinese Government. During last March’s NPC, Premier Li reiterated the urgency of having to fight the “war against pollution”, a year af-
ter his declaration of that war.108
That declaration was also an official acknowledgement that the environ-ment is an integral part of the economy and economic growth. Meanwhile, the government aims to fully implement the revised Environmental Protection Law (EPL), which entered into force on January 1, 2015. To date, the EPL is considered as the toughest measure against pollution in China, and its results have been almost immediate. During the first eight months of this
year, companies that had illegally discharged pollutants were fined a total of RMB 328 million.109
Further-
more, over 1,500 companies were ordered to shut production or end operations completely.110
Other re-cent developments in the environmental protection space have included the following:
China’s recently appointed Minister of Environmental Protection Chen Jining has vowed to en-hance the supervision of local governments.
Systems for managing cross-jurisdictional pollution and public reporting of environmental prob-lems have been set-up.
Local officials can now be demoted for misconduct, including the concealment of offenses, falsifi-cation of data, failure to publish environmental data, and for not ordering enterprises illegally dis-charging pollutants to be closed.
The Ministry of Science and Technology announced a five-year plan to control air pollution.
The Supreme People’s Procuratorate has planned a two-year crackdown on environmental crimes.
The Catalogue for the Guidance of Industries for Foreign Investment (jointly released by NDRC and MOFCOM) entered into force on April 10, giving another boost to the energy efficiency and environmental protection sectors.
105
The Economist (2014), ‘Coal: The Fuel of the Future, Unfortunately’, The Economist, April 19, at
http://www.economist.com/news/business/21600987-cheap-ubiquitous-and-flexible-fuel-just-one-problem-fuel-future, accessed on December 16, 2015 106
One of the many items prospective investors tend to look at is the scale of power generation infrastructure (more specifically, the equity capacity up for sale), which plays a
determining part in analyzing the economic attractiveness of the asset. 107
Gørild Heggelund & Per Ove Eikeland (2015), ‘Corporate Responses to Coal Policy in China’,
Coal and Renewable Energy: Building a Sustainable Electricity Sector in China, Beijing, September 16, Workshop hosted by IISD 108
Reuters (2014), ‘China to “Declare War” On Pollution, Premier Says’, Reuters, March 4, at
http://www.reuters.com/article/us-china-parliament-pollution-idUSBREA2405W20140305#41SqCwo3rg30EAVi.97, accessed on December 11, 2015 109
Zheng Jinran (2015), ‘Revised Law Boosts Ecological Cleanup’, China Daily, October 29, at
http://www.chinadaily.com.cn/china/2015cpcplenarysession/2015-10/29/content_22304048.htm, accessed on December 11, 2015 110
ibid.
27
Regulators have simplified the requirements for bonds issued to finance clean energy and natural gas projects.
The GACC lowered import tariffs for green technologies and energy-efficient products on January 1, 2015.
Green Public Procurement (GPP) is increasingly supported by the government on various levels. Howev-er, no overarching policies have been enacted so far. Green procurement and markets to foster green consumption through the establishment of low-carbon supply chains have been high on the agenda.
111
Additionally, the 13
th Five-Year Plan will almost certainly give a boost to the development and utilization of
clean technologies in power generation, building construction and water treatment, among others. Internationally, efforts have been underway as well. China is increasingly seizing the opportunity to play a leading role to promote low-carbon growth while upstreaming its own industry chain. In November 2014, China and the U.S. agreed to a Joint Announcement on Climate Change and Clean Energy Cooperation. The presidents of both countries reaffirmed the importance of strengthening bilateral cooperation in these areas and to adopt another legal instrument at the 2015 United Nations Climate Change Conference (COP 21).
112 China made its first voluntary commitment to peak its carbon dioxide
emissions by 2030. On June 30, 2015, China submitted its “intended nationally determined contribution” (INDC) to the United Nations Framework Convention on Climate Change (UNFCCC) Secretariat, making a number of commit-ments to the international community, including lowering carbon dioxide emissions per unit of GDP by 40-45% from 2005 levels by 2020 and increasing the share of non-fossil fuels in the primary energy mix to
about 15%, also by 2020.113
The signing of an international accord by 195 states, notably including China, at COP 21 in Paris on De-cember 12 to curb greenhouse gas emissions, limiting global temperature increase to below 2 degrees Celsius, among others, will likely serve as a push for the implementation of existing and introduction of fu-ture reforms aimed at environmental protection within China. As with recent exchange rate liberalization efforts, Chinese policy actions with international ramifications could help spur internal reforms and pave the way for structural changes required by the country’s economic transformation. Downside risks, however, remain. Enforcement aside, the success of China's reforms might hinge on how fast and to what extent the country rolls back subsidies and regulatory advantages for SOEs and opens up industries in the energy industry to the private sector. Moreover, tremendous efforts are not just re-quired by the government but also by the business community and general public in order to successfully curb greenhouse gas emissions. If these are not managed adequately at home, they might find less ex-pression internationally. Moreover, should economic growth slow more substantially than anticipated, poli-cy interventions that are designed to prop up the economy as swiftly as possible might not align to China’s strategic objectives, including those aimed at environmental protection.
* * *
111
IISD (2015), Green Public Procurement in China: Quantifying the Benefits (Winnipeg: International Institute for Strategic Development) 112
The Joint Announcement can be accessed here: https://www.whitehouse.gov/the-press-office/2014/11/11/us-china-joint-announcement-climate-change, accessed on December 11, 2015 113
China’s INDC can be accessed here: http://www4.unfccc.int/submissions/INDC/Published%20Documents/China/1/China's%20INDC%20-%20on%2030%20June%202015.pdf, accessed on December 11, 2015
Sources:1 IMF, World Economic Outlook Database, October 2014 (Estimates start after 2013) 2 World Bank, World dataBank, WDI & GDF, 20153 EIU Country Reports China, 2009-20154 National Bureau of Statistics, Statistical Yearbook 2012 & 2014
China: Essential Economic Data
30
Annex 2.2: Essential economic data (definitions)
China: Essential Economic Data - Definitions Figure Explanation Details
GDP (RMB billion)* Gross domestic product, current prices (National currency)
Expressed in billions of national currency units . Expenditure-based GDP is total final expenditures at purchasers’ prices (including the f.o.b. value of exports of goods and services), less the f.o.b. value of imports of goods and services. [SNA 1993]1
GDP (USD billion)* Gross domestic product, current prices (U.S. dollars)
Values are based upon GDP in national currency converted to U.S. dollars using market exchange rates (yearly average). Exchange rate projections are provided by country economists for the group of other emerging market and developing countries. Exchanges rates for advanced economies are established in the WEO assumptions for each WEO exercise. Expenditure-based GDP is total final expenditures at purchasers’ prices (including the f.o.b. value of exports of goods and services), less the f.o.b. value of imports of goods and services. [SNA 1993]1
GDP per capita (RMB)* Gross domestic product per capita, current prices (National currency)
GDP is expressed in current national currency per person. Data are derived by dividing current price GDP by total population.1
GDP per capita (USD)* Gross domestic product per capita, current prices (U.S. dollars)
GDP is expressed in current U.S. dollars per person. Data are derived by first converting GDP in national currency to U.S. dollars and then dividing it by total population.1
GDP growth (%)* Gross domestic product, constant prices (Percent change)
Annual percentages of constant price GDP are year-on-year changes; the base year is country-specific . Expenditure-based GDP is total final expenditures at purchasers’ prices (including the f.o.b. value of exports of goods and services), less the f.o.b. value of imports of goods and services. [SNA 1993]1
Total investment (% of GDP)*
Total investment (Percent of GDP) Expressed as a ratio of total investment in current local currency and GDP in current local currency. Investment or gross capital formation is measured by the total value of the gross fixed capital formation and changes in inventories and acquisitions less disposals of valuables for a unit or sector. [SNA 1993]1
Gross national savings (% of GDP)*
Gross national savings (Percent of GDP)
Expressed as a ratio of gross national savings in current local currency and GDP in current local currency. Gross national saving is gross disposable income less final consumption expenditure after taking account of an adjustment for pension funds. [SNA 1993] For many countries, the estimates of national saving are built up from national accounts data on gross domestic investment and from balance of payments-based data on net foreign investment.1
CPI inflation (%)* Inflation, average consumer prices (Percent change)
Annual percentages of average consumer prices are year-on-year changes. Expressed in averages for the year, not end-of-period data. A consumer price index (CPI) measures changes in the prices of goods and services that households consume. Such changes affect the real purchasing power of consumers’ incomes and their welfare. As the prices of different goods and services do not all change at the same rate, a price index can only reflect their average movement.1
Population (billion) * Population (Persons) For census purposes, the total population of the country consists of all persons falling within the scope of the census. In the broadest sense, the total may comprise either all usual residents of the country or all persons present in the country at the time of the census. [Principles and Recommendations for Population and Housing Censuses, Revision 1, paragraph 2.42]1
Unemployment rate (% of total labor force)*
Unemployment rate (Percent of total labor force)
Unemployment rate can be defined by either the national definition, the ILO harmonized definition, or the OECD harmonized def inition. The OECD harmonized unemployment rate gives the number of unemployed persons as a percentage of the labor force (the total number of people employed plus unemployed). [OECD Main Economic Indicators, OECD, monthly] As defined by the International Labour Organization, unemployed workers are those who are currently not working but are willing and able to work for pay, currently available to work, and have actively searched for work. [ILO, http://www.ilo.org/public/english/bureau/stat/res/index.htm]1
General government revenue (RMB billion)*
General government revenue (National currency)
Revenue consists of taxes, social contributions, grants receivable, and other revenue. Revenue increases government’s net worth, which is the difference between its assets and liabilities (GFSM 2001, paragraph 4.20). Note: Transactions that merely change the composition of the balance sheet do not change the net worth position, for example, proceeds from sales of nonfinancial and financial assets or incurrence of liabilities.1
General government total expenditure (RMB billion)*
General government total expenditure (National currency)
Total expenditure consists of total expense and the net acquisition of nonfinancial assets. Note: Apart from being on an accrual basis, total expenditure differs from the GFSM 1986 definition of total expenditure in the sense that it also takes the disposals of nonfinancial assets into account.1
General government structural balance (% of GDP)*
General government structural balance (National currency)
The structural budget balance refers to the general government cyclically adjusted balance adjusted for nonstructural elements beyond the economic cycle. These include temporary financial sector and asset price movements as well as on-off, or temporary, revenue or expenditure items.1
Current account balance (% of GDP)*
Current account balance (Percent of GDP)
Current account is all transactions other than those in financial and capital items. The major classifications are goods and services, income and current transfers. The focus of the BOP is on transactions (between an economy and the rest of the world) in goods, services, and income.1
External debt stocks, total (USD billion)**
External debt stocks, total (DOD, current US$)
Total external debt is debt owed to nonresidents repayable in foreign currency, goods, or services. Total external debt is the sum of public, publicly guaranteed, and private nonguaranteed long-term debt, use of IMF credit, and short-term debt. Short-term debt includes all debt having an original maturity of one year or less and interest in arrears on long-term debt. Data are in current U.S. dollars.2
External debt stocks (% of GNI) **
External debt stocks (% of GNI) Total external debt stocks to gross national income. Total external debt is debt owed to nonresidents repayable in foreign currency, goods, or services. Total external debt is the sum of public, publicly guaranteed, and private nonguaranteed long-term debt, use of IMF credit, and short-term debt. Short-term debt includes all debt having an original maturity of one year or less and interest in arrears on long-term debt. GNI (formerly GNP) is the sum of value added by all resident producers plus any product taxes (less subsidies) not included in the valuation of output plus net receipts of primary income (compensation of employees and property income) from abroad.2
Debt service on external debt, total (USD billion)**
Debt service on external debt, total (TDS, current US$)
Total debt service is the sum of principal repayments and interest actually paid in foreign currency, goods, or services on long-term debt, interest paid on short-term debt, and repayments (repurchases and charges) to the IMF. Data are in current U.S. dollars.2
Total debt service (% of exports of goods, services & income)**
Total debt service (% of exports of goods, services and income)
Total debt service is the sum of principal repayments and interest actually paid in foreign currency, goods, or services on long-term debt, interest paid on short-term debt, and repayments (repurchases and charges) to the IMF. 2
Total reserves incl.gold (USD billion)**
Total debt service (% of exports of goods, services and income)
Total reserves comprise holdings of monetary gold, special drawing rights, reserves of IMF members held by the IMF, and holdings of foreign exchange under the control of monetary authorities. The gold component of these reserves is valued at year-end (December 31) London prices. Data are in current U.S. dollars. 2
Reserves incl. gold in months of imports **
Total reserves in months of imports Total reserves comprise holdings of monetary gold, special drawing rights, reserves of IMF members held by IMF, and holdings of foreign exchange under control of monetary authorities. The gold component of these reserves is valued at year-end (Dec 31) London prices. This item shows reserves expressed in terms of Nr. of months of imports of goods and services they could pay for [Reserves/(Imports/12)].
Source: China's Custom Statistics
31
Annex 3.1: Trading partners of the PRC (exports)
Exports to Country/
Region Billion
Growth in % to a
comparable
Exports to Country/
Region Billion
Growth in % to a
comparable
USD previous period USD previous period
Jan - Dec 2014 Jan - Sept 2015
United States 396.1 16.9% 7.5% United States 302.8 18.2% 6.0%
Hong Kong 363.2 15.5% -5.5% Hong Kong 224.3 13.5% -11.5%
Japan 149.4 6.4% -0.5% Japan 100.5 6.0% -9.7%
South Korea 100.3 4.3% 10.1% South Korea 73.4 4.4% 0.0%
The negative sign indicates a backflow of capital. This is most likely due to the fact that subsidiaries in Switzerland, which are controlled by a group of compnies headquartered abroad, show demands to their sister companies in China. 3 SNB, Statistisches Monatsheft, 2011 and 2015; the statistics for stock 2014 will be published in late December 2015
Differences between Chinese and Swiss Statistics on FDI may exist due to different calculation methods.
Sources: 1 MOFCOM, Statistical Bulletin of China's outw ard FDI, 2010 in million USD.2 Confidential data of the SNB (direct inquiry) in million CHF.