2016 review and outlook China and Belt & Road Infrastructure www.pwchk.com/ February 2017 PwC | B&RWatch Gabriel Wong Partner Head of Corporate Finance PwC China & Hong Kong +86 21 2323 2609 [email protected]Simon Booker Partner Corporate Finance PwC Hong Kong +852 2289 2788 [email protected]Guillaume Barthe-Dejean Associate Director Corporate Finance PwC Hong Kong +852 2289 3587 [email protected]
Transcript
2016 review and outlook
China and Belt & Road Infrastructure
www.pwchk.com/
February 2017
PwC | B&RWatch
Gabriel WongPartnerHead of Corporate FinancePwC China & Hong Kong+86 21 2323 [email protected]
Simon BookerPartnerCorporate FinancePwC Hong Kong+852 2289 [email protected]
Guillaume Barthe-DejeanAssociate DirectorCorporate FinancePwC Hong Kong+852 2289 [email protected]
C0ntents
01 Introduction
02 2016 in review
03 Outlook
2
A word on assumptions, definitions and data compilation methodology
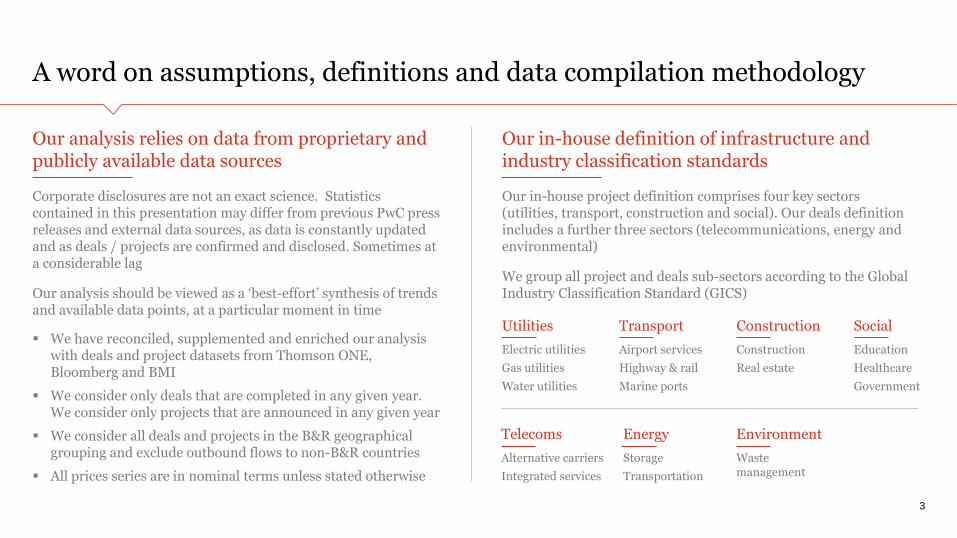
Our analysis relies on data from proprietary and publicly available data sources
Corporate disclosures are not an exact science. Statistics contained in this presentation may differ from previous PwC press releases and external data sources, as data is constantly updated and as deals / projects are confirmed and disclosed. Sometimes at a considerable lag
Our analysis should be viewed as a ‘best-effort’ synthesis of trends and available data points, at a particular moment in time
We have reconciled, supplemented and enriched our analysis with deals and project datasets from Thomson ONE, Bloomberg and BMI
We consider only deals that are completed in any given year. We consider only projects that are announced in any given year
We consider all deals and projects in the B&R geographical grouping and exclude outbound flows to non-B&R countries
All prices series are in nominal terms unless stated otherwise
Our in-house definition of infrastructure and industry classification standards
Our in-house project definition comprises four key sectors (utilities, transport, construction and social). Our deals definition includes a further three sectors (telecommunications, energy and environmental)
We group all project and deals sub-sectors according to the Global Industry Classification Standard (GICS)
Utilities
Electric utilities
Gas utilities
Water utilities
Transport
Airport services
Highway & rail
Marine ports
Telecoms
Alternative carriers
Integrated services
Social
Education
Healthcare
Government
Construction
Construction
Real estate
Energy
Storage
Transportation
Environment
Waste management
3
PwC’s Digital Services 4
Belt & Road: resurrecting the ancient silk route
01Introduction
The B&R region spans four continents and includes a total of 66 countries… from Lithuania to Indonesia
Belt & Road: resurrecting the ancient silk route
Unveiled in October 2013, the Belt & Road (B&R) initiative is a development framework promoting Eurasian trade and integration
Includes two complementary components : a terrestrial ‘Silk Road Economic Belt’ and a ‘Maritime Silk Road’
Underscores China’s drive to play a greater role in global affairs. Institutions supporting the initiative include Asia Infrastructure Investment Bank (AIIB)
A cornerstone of the proposed initiative is a vast infrastructural network connecting China to Europe via South, Central Asia and the Middle East
Seeks to unlock investments for priority projects in a number of ‘economic corridors’
5
Source: Wikimedia,
PwC proprietary research
Silk Road Economic Belt (SREB)
Maritime Silk Road (MSR)
The travels of Marco Polo (1276-1291)
The B&R region spans three continents and includes a total of 66 countries… from Lithuania to Indonesia
Albania Belarus Bosnia Bulgaria
Croatia Czech Republic Estonia Hungary
Latvia Lithuania Macedonia Moldova
Montenegro Poland Romania Russia
Serbia Slovakia Slovenia Ukraine
Central & Eastern Europe
Brunei Cambodia Indonesia Laos
Malaysia Myanmar Philippines Singapore
Taiwan Thailand Vietnam
Bahrain Egypt Iraq Israel
Jordan Kuwait Lebanon Oman
Palestine Qatar Saudi Arabia Syria
Turkey UAE Yemen
East Asia
Central & Western Asia
South East Asia
Armenia Azerbaijan
Georgia Kazakhstan
Kyrgyzstan Tajikistan
Turkmenistan Uzbekistan
China (incl. Hong Kong and Macau)
Mongolia
Middle East
Central & Eastern Europe
Central & Western Asia
East Asia
South East AsiaMiddle East
6
Afghanistan Bangladesh
Bhutan India
Iran Maldives
Nepal Pakistan
Sri Lanka
South Asia
South Asia
PwC’s Digital Services 7
Projects and deals generated a combined $494bn in value in 2016
022016 in review
A third of B&R project and deal value generated in 2016 was in China
Average project size in China rose by 14% in 2016
2016 saw a rise in project dollar value, as governments battled to revive growth. Available data points to a drop in M&A
Regional growth moderated in 2016 on the back of weaker Chinese demand
Rising oil and commodity prices fed into construction costs, heaping further pressure on sector profitability
Public expenditure on projects remained strong, however. China’s ‘silk road’ is materializing and driving investments across B&R
Available data suggests infrastructure project spend tends to be counter-cyclical, correlating negatively with economic activity. M&A activity is driven by investor confidence and is typically pro-cyclical
M&A activity points to a decline in volume and dollar value. Disclosures for 2016 are however still trickling in, meaning that there is still (limited) scope for more upside
Deals and project dollar value vs. B&R GDP growthDealsProjects
+2 .1 %
-6 0%
-4 0%
-2 0%
0%
2 0%
4 0%
6 0%
-48.7%Y
-o-Y
gro
wth
in
va
lue
201620152014201320122011
Projects Deals
B&R GDP growth
Deals and projects tend to move against one another
8Source: BMI, Thomson ONE, Bloomberg, PwC proprietary research
500
400
300
200
100
0
US
$b
n
0%
2 %
4 %
6 %
8 %
1 0%
20122011 2013 201620152014
Focus on new projects saw value rising 2.1% at the expense of M&A activity
Projects: countercyclical strength
Provisional numbers for 2016 see total new announced project value rising 2.1% to roughly US$400bn
Final numbers could see 2016 value rising by as much as 10%
600
500
400
300
200
100
0
401.3
2015
393.0
2014
378.6
2013
274.4
2012
+2.1%
2016(high)
432.3
2016(low)
385.2
2016 (base)
313.6
2011
282.9
China relatedOther into B&R
Total project dollar value in B&R markets
US
$ b
illi
on
Deals: pro-cyclical weakness
Economic headwinds were not as kind to deal activity, with available data pointing to a 49% fall in dollar value
The drop partly reflects peak levels reached in 2015, when deal activity rose to a record $180bn
China domestic deal value is also down, according to available data, but up 15% from 2014
0
150
100
200
250
50
-48.7%
2016
92.5
2015
180.2
2014
114.1
2013
128.9
2012
97.6
2011
96.9
Other into B&R China related
Total deals dollar value in B&R markets
US
$ b
illi
on
Source: BMI, Thomson ONE, Bloomberg, PwC proprietary research 9
After two bumper years that saw the Shanghai infrastructure index surge by 85% between 2014-2015, the index rose only by a modest 9.9% in 2016
Infrastructure equities trended at an average 4.1 percentage point (pp) discount to the Shanghai composite index, an average 6.9 pp discount to GDP, and a 12 pp discount to the MSCI China Index
1 001 1 0
1 2 01 3 01 4 0
1 5 01 6 0
1 7 0
OctJul Aug SepMarFebJan
Ind
ex:
Ja
n-1
5 =
10
0
Apr JunMay DecNov
After a bumper year in 2015…
90
95
100
105
110
115
120
Ind
ex:
Ja
n-1
6 =
10
0
Sep Oct Nov DecJan Feb AugJulMar May JunApr
MSCI China
SSE 180 Infra GDP growth (Y-o-Y 6.7%)
SSE Composite
…infra equities underperformed in 2016 SSE 180 infrastructure index vs SSE composite
Aug Sep Oct Nov DecFebJan Mar May JunApr Jul
-2 0%
-1 0%
0%
+1 0%
+2 0%
+3 0%Range (2011-2016)5-yr ave.20152016
10Source: IMF, MSCI, National Interbank Funding Center, Bloomberg, PwC proprietary research
Rising average project value points to a ‘flight to quality’
A multi-year trend of rising value
Available data sees average project value rising 47% in B&R and
14% in China, and suggests more value was generated despite an
absolute drop in projects
The trend was at play in all sub-sectors, with noteworthy rises in
utilities and transportation
Available data suggests average value has been on the rise since
2013, with a CAGR of 33% for B&R and 27% for China
Rising average project value is the flipside of growing
uncertainty and feeble growth in regional markets, with
investors and public authorities pooling investments away from
riskier, non-essential ventures
0
1 00
2 00
3 00
4 00
5 00
6 00
20132012 2014
US
$m
2015 2016
Construction All sectorsSocial Infrastructure
TransportEnergy & Utilities
Average B&R project value by sector
0
5 00
1 ,000
1 ,5 00
2 ,000
20152013
US
$m
201620142012
All sectors
Energy & Utilities
Social Infrastructure
Transport
Construction
Average China project value by sector
11
PwC’s Digital Services 12
The macro picture
Government policy across B&R was bullish for projects but bearish for deals
Project bulls
Monetary policy in China remained accommodative. Base rates hovered at their lowest level in two decades. New loans reached record highs
Fiscal policy continued to fuel growth in China and B&R
GDP growth rates soften across the region. This was a bullish driver for projects in 2016 as governments scrambled investments to offset declines
M&A bears
Monetary policy is fuelling lending and likely generating a real estate bubble. This weighed on investor sentiment
Real lending rates fell but were high for much of 2016
The yuan weakened in 2016, moderating China’s appetite for foreign acquisitions. This was compounded by lengthy regulatory approvals
Sagging fundamentals
Construction costs bounced back on rising crude and steel. This was bearish as reflected global markets and domestic production cuts more than rising domestic demand
Loosening fundamentals. Freight volumes, port throughput and industrial power demand fell. Overcapacity drove down fixed asset investments
Sovereign debts suffered a couple of downgrades in 2016 (although the picture is broadly stable)
13
-2 %
0%
2 %
4 %
6 %
8 %
1 0%
1 2 %
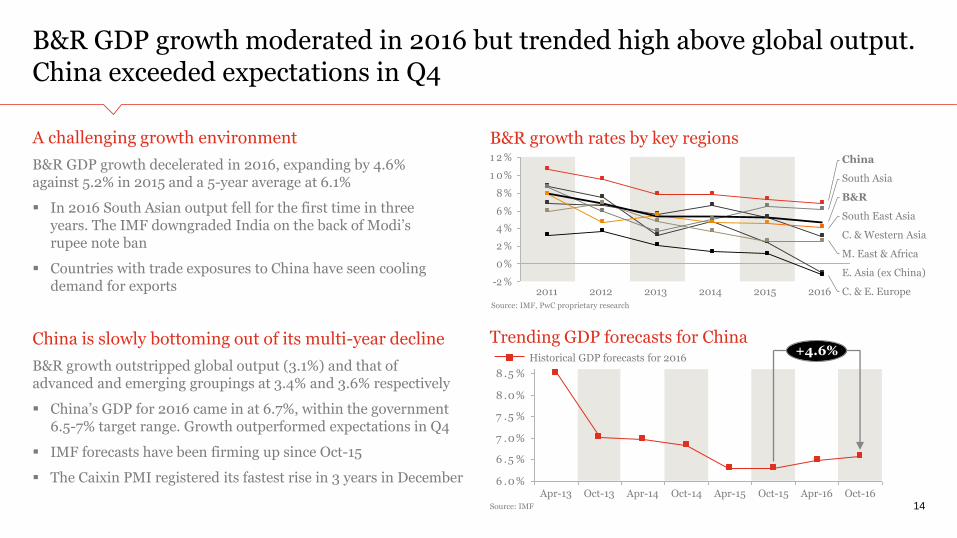
B&R GDP growth moderated in 2016 but trended high above global output. China exceeded expectations in Q4
A challenging growth environment
B&R GDP growth decelerated in 2016, expanding by 4.6% against 5.2% in 2015 and a 5-year average at 6.1%
In 2016 South Asian output fell for the first time in three years. The IMF downgraded India on the back of Modi’srupee note ban
Countries with trade exposures to China have seen cooling demand for exports
China is slowly bottoming out of its multi-year decline
B&R growth outstripped global output (3.1%) and that of advanced and emerging groupings at 3.4% and 3.6% respectively
China’s GDP for 2016 came in at 6.7%, within the government 6.5-7% target range. Growth outperformed expectations in Q4
IMF forecasts have been firming up since Oct-15
The Caixin PMI registered its fastest rise in 3 years in December
B&R growth rates by key regions
20122011 2016201520142013
6 .0%
6 .5 %
7 .0%
7 .5 %
8 .0%
8 .5 %
Apr-16 Oct-16
+4.6%
Oct-15Apr-15Oct-14Apr-14Oct-13Apr-13
Historical GDP forecasts for 2016
Trending GDP forecasts for China
Source: IMF 14
Source: IMF, PwC proprietary research
B&R
China
South Asia
South East Asia
M. East & Africa
C. & E. Europe
C. & Western Asia
E. Asia (ex China)
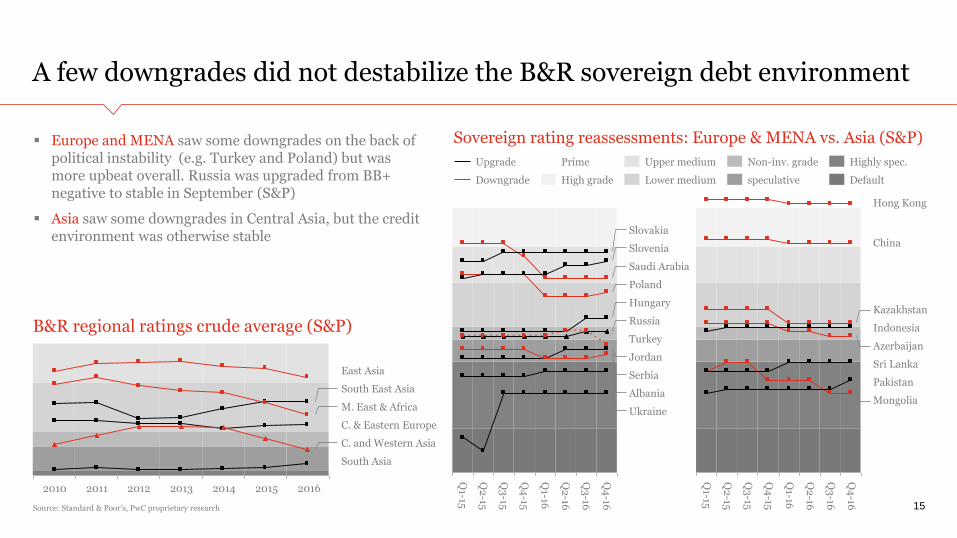
A few downgrades did not destabilize the B&R sovereign debt environment
Europe and MENA saw some downgrades on the back of political instability (e.g. Turkey and Poland) but was more upbeat overall. Russia was upgraded from BB+ negative to stable in September (S&P)
Asia saw some downgrades in Central Asia, but the credit environment was otherwise stable
Q3
-15
Q2
-15
Q1-15
Q4
-16
Q3
-16
Q2
-16
Q1-16
Q4
-15
Q3
-16
Q2
-16
Q1-16
Q4
-15
Q3
-15
Q2
-15
Q1-15
Q4
-16
Poland
Russia
Jordan
Saudi Arabia
Albania
Serbia
Hungary
Turkey
Ukraine
Slovenia
Slovakia
High grade
Upgrade
Downgrade
Prime Highly spec.
Defaultspeculative
Non-inv. grade
Lower medium
Upper medium
Sovereign rating reassessments: Europe & MENA vs. Asia (S&P)
C. & Eastern Europe
C. and Western Asia
South Asia
2011 2012 20142010 2013
South East Asia
East Asia
2015
M. East & Africa
2016
B&R regional ratings crude average (S&P)
Source: Standard & Poor’s, PwC proprietary research 15
Mongolia
Azerbaijan
Pakistan
Sri Lanka
China
Hong Kong
Kazakhstan
Indonesia
China’s fiscal stimulus announcements and infrastructure spending had another bumper year in 2016
Infrastructure remained a policy lever of choiceTotal spending is expected to reach 20 trillion yuan this year, which is more than 10% over that of 2015 and 40% more than the 5-yr average
Beijing announced a series of fiscal stimulus measures in infrastructure, including 4.7 trillion yuan package for transportation in June
In December, the Government announced plans to invest 3.5 trillion yuan in railway networks from 2017-2020 to connect 80% of China’s major cities
We believe infrastructure spending growth will come in at 14% for 2016, which is down slightly from an average five-year growth rate at 14.5%
Infrastructure spending will continue to grow robustly, however we expect its relative share to decelerate over time
Cumulative Government expenditure
Infra spending growth remains robust
15
10
20
5
Jan AprFeb Mar OctSep Nov DecAugJun JulMay
0
Trillio
n y
ua
n
Range (2011-2016)2016
5-yr ave.
2015
15.2
2014 2015
17.619.4
2016
+15.9%+10.4%
Trillio
n y
ua
n
OtherInfrastructure
+18% +14%
Source: CEIC, PwC proprietary research
Source: National Bureau of Statistics of China, PwC proprietary research
16
6 .6 7 .5 7 .8
8 .61 0.1 1 1 .6
0
5
1 0
1 5
2 0
2 5
3 0
Construction costs rise on the back of materials and wage inflation
Input costs recover from multi-year declinesRising input prices increased pressure points on the infrastructure value chain
Crude prices rebounded on the back of global tightening fundamentals and the US dollar trended low up until the December Fed rate hike
Domestic steel prices surged on construction demand, shrinking inventories and Beijing removing 45 million tonnes in capacity. Rebar prices rose higher still on Beijing moving to close coal mines
Indices for industrial and building materials bottomed out in 2016 and expanded for the first time in five and three years respectively
Nine provincial regions raised minimum wages in 2016. Construction wages will have risen somewhere between 5-8% in 2016
3 0
4 0
5 0
6 0
7 0
8 0
9 0
1 00
1 1 0
1 2 0
1 3 0
Ind
ex$/b
bl
DecNovOctSepAugJulJunMayAprMarFebJan
China steel indexBrent futuresUS$ Index
Crude and steel are up 70% since January
-6 %
-4 %
-2 %
0%
2 %
2 2 0
2 4 0
2 6 0
2 8 0
3 00
3 2 0
3 4 0
JulJunMayAprMarFebJan
CN
Y/ to
nn
e(cem
ent)
DecNovOctSepAug
Industrial materialsBuilding materials Cement
Key construction costs are rising
Source: National Bureau of Statistics of China, Bloomberg, PwC proprietary research
Source: Bloomberg, ICE, MyspiC steel index
17
PwC’s Digital Services 18
We see potential for significant growth in power, rail and healthcare in a number of middle-income B&R countries
03Outlook
M&A infrastructure could rebound in 2017
More broadly, we see five key themes shaping the outcome for 2017
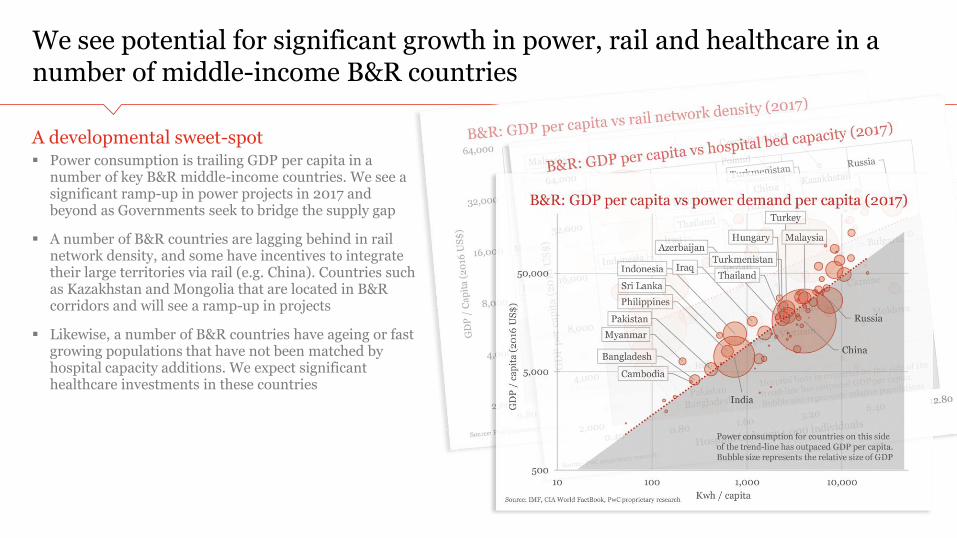
We see potential for significant growth in power, rail and healthcare in a number of middle-income B&R countries
19
A developmental sweet-spot Power consumption is trailing GDP per capita in a
number of key B&R middle-income countries. We see a significant ramp-up in power projects in 2017 and beyond as Governments seek to bridge the supply gap
A number of B&R countries are lagging behind in rail network density, and some have incentives to integrate their large territories via rail (e.g. China). Countries such as Kazakhstan and Mongolia that are located in B&R corridors and will see a ramp-up in projects
Likewise, a number of B&R countries have ageing or fast growing populations that have not been matched by hospital capacity additions. We expect significant healthcare investments in these countries
Trans-Eurasian rail networks will dramatically reduce the time between China and European consumer markets
20
Trans Siberian
Baikal-Amursk Mainland
European Rail Shuttle
Trans-Eurasian
Chinese Transcontinental Network
New Eurasian Land Bridge
Source: NATO Association of
Canada, PwC proprietary research
At the heart of China’s Belt & Road initiative is a planned network of railways connecting China to Western Europe
Beijing hopes to complete this project within a decade
The planned rail network will deepen economic integration in some of the word’s most densely populated regions
Once completed, it will provide a high capacity alternative for bulk-consumer good transportation. It will offer valuable freight time savings over ship transport
In January this year a freight train arrived in London after completing a 12,000 km fro Yiwu, China, via Kazakhstan and Russia and France
Urbanisation and population growth will spur continued demand for high-capacity transportation infrastructure
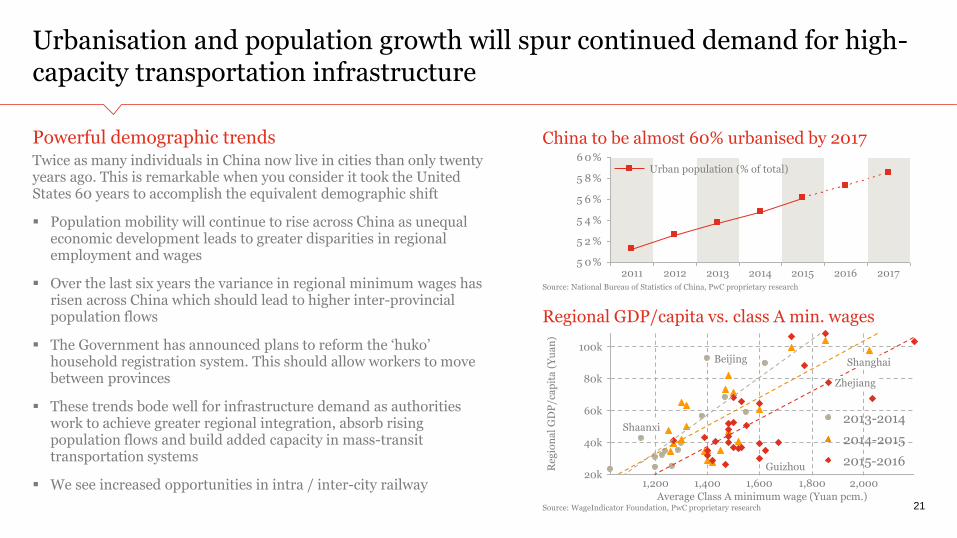
Powerful demographic trendsTwice as many individuals in China now live in cities than only twenty years ago. This is remarkable when you consider it took the United States 60 years to accomplish the equivalent demographic shift
Population mobility will continue to rise across China as unequal economic development leads to greater disparities in regional employment and wages
Over the last six years the variance in regional minimum wages has risen across China which should lead to higher inter-provincial population flows
The Government has announced plans to reform the ‘huko’ household registration system. This should allow workers to move between provinces
These trends bode well for infrastructure demand as authorities work to achieve greater regional integration, absorb rising population flows and build added capacity in mass-transit transportation systems
We see increased opportunities in intra / inter-city railway
21
5 0%
5 2 %
5 4 %
5 6 %
5 8 %
6 0%
2017201620152014201320122011
China to be almost 60% urbanised by 2017
Urban population (% of total)
20k2,0001,8001,6001,400
100k
80k
60k
1,200
40k
Average Class A minimum wage (Yuan pcm.)
Reg
ion
al
GD
P/c
ap
ita
(Yu
an
)
Zhejiang
Guizhou
Shanghai
Shaanxi
Beijing
2014-2015
2015-2016
2013-2014
Regional GDP/capita vs. class A min. wages
Source: National Bureau of Statistics of China, PwC proprietary research
Source: WageIndicator Foundation, PwC proprietary research
M&A infrastructure could rebound in 2017
22
China: domestic and inboundWe see potential for a rebound in domestic activity driven by a maturing and consolidation of the Chinese economy
Infrastructure will outperform on countercyclical spending and as investors shun manufacturing and industrial sectors with lower potential for organic growth
We do not expect a sharp rise in inbound M&A given rising interest rates and the accumulation of risks in overseas markets. Outbound restrictions will boost domestic M&A
Key signpost for 2017 is the Communist Party 19th Congress. Investors will weigh up the risk of new regulations
B&R and China outbound dealsNew regulation and capital controls will act as a drag on overall China M&A outbound transactions
The infrastructure sector is considered strategic. Transactions will not be subject to inhibitive levels of scrutiny
Outbound investments that dovetail with strategic objectives will instead be encouraged. Chinese investors with dollar reserves will have an advantage over pure Yuan players
B&R markets will continue to offer riskier but more attractive returns with higher potential for organic growth
B&R region remains politically volatile, however, and subject to adjustments to external pressures, current account imbalances and currency movements
Should the risks dashboard deteriorate we could see more sovereign downgrades affecting project economics
We see five key themes shaping the outcome for 2017
Investors broadening their horizons
Political leadership unveiling ambitious goals
Future-proofing against obsolescence
Sustainable infrastructure for the long term
Commodity-rich regions prioritize infrastructure
To increase their returns, Investors will tackle a broader range of opportunities and risks, including
Developing and ‘frontier’ markets with greater levels of country risk
Greenfield projects, with heightened development and construction risks
This transition from pure-play, low risk infrastructure requires new skill sets and capabilities in deal sourcing, evaluation and asset management
We see more project announcements across B&R in 2017 as governments continue to tackle economic slowdown
Many of these will come from China, as Beijing will need to supplement current announced packages to keep up the pace of investment and drive momentum behind its silk road ambitions
Ambitious infrastructure goals bring new challenges for policymakers. Spending will likely run up against budgetary constraints, and, even with the influx of private capital, there may not be enough to meet needs
Rapid urbanisation, climate change, shifts in global economic power, demographic changes, and technological breakthroughs – can cause even traditional assets to lose relevance quickly
As a result of these trends, infrastructure (which was traditionally seen as a conservative asset class) now faces new risks. To future-proof their infrastructure spending, governments and investors will need new assessments and skills to prepare for emerging opportunities and challenges
We see a growing push to decarbonise economies, implement green construction methods, and make cities more ecologically sustainable
Conflicts will of course arise between the green agenda and concerns about costs to consumers. These conflicts will be most apparent in countries where pressures from fast rising populations and urbanisation are the highest
The key question is whether governments prioritise short-term cost savings over longer-term benefits that come with sustainable development
B&R Countries rich in natural resources have suffered from the fall in commodity prices, with government budgets taking a hit.
Many of these countries however see infrastructure as a way to maintain growth, support vulnerable sectors of the economy, and eventually transition away from commodity-dependent growth models
We think governments will increasingly consider innovative private financing options and turn to the private sector to support these plans
23
PwC’s Digital Services
This publication has been prepared for general guidance on matters of interest only, and does not constitute professional advice. You should not act upon the information contained in this publication without obtaining specific professional advice. No representation or warranty (express or implied) is given as to the accuracy or completeness of the information contained in this publication, and, to the extent permitted by law, PricewaterhouseCoopers, its members, employees and agents do not accept or assume any liability, responsibility or duty of care for any consequences of you or anyone else acting, or refraining to act, in reliance on the information contained in this publication or for any decision based on it.