CHECK AGAINST DELIVERY 1 China and the Global Economy 1 Justin Yifu Lin Sr. Vice President and Chief Economist World Bank Remarks at the 20 th Anniversary of the University of Science and Technology Hong Kong, March 23, 2011 I. Introduction It is a great pleasure to be with you here today to commemorate the 20th anniversary of the Hong Kong University of Science and Technology. I was proud to be a member of its Business School faculty for 10 years from 1995 to 2005. Since its founding twenty years ago, this university has become one of the academic centers of excellence in the world; most notably, the Business School’s Kellogg-HKUST EMBA has topped Financial Times’ global rankings repeatedly. In the past 20 years the Chinese economy has also continued to develop and grow in extraordinary ways. As a student of the Chinese economy and economic development, I would like to use this auspicious occasion to reflect on the experience of China’s development, and I will organize my speech around the following three themes: (i) China’s achievements in the past 20 years, (ii) Prospects for China’s growth in the coming 20 years; (iii) Challenges for China’s growth; and (iv) China and the multi-polar growth world. II. China’s Achievements in the Past 20 Years Between 1979 and 1990, China’s average annual growth rate was 9.0 percent. At the end of that period and even up to early 2000s, many scholars still believed that China could not continue that growth rate much longer due to the lack of fundamental reforms. 2 But China’s annual growth rate during the period 1990-2010 increased to 10.4 percent. On the global economic scene, China’s growth over the last two decades has been unprecedented. This was a dramatic contrast with the depressing performance of other transitional economies in Eastern Europe and Former Soviet Union. As a result of the extraordinary performance, there has been a dramatic change in China’s status in the global economy. In 1990, China barely registered on the global economic scale, commanding a mere 1.6 percent of global GDP. Today, it is the world’s second largest economy and produces 8.6 percent of global GDP (in 2009). 1 I am grateful for David Rosenblatt’s help in preparing the paper. 2 The Coming Collapse of China by Gordon H. Chang, published in 2001 by Random House, was one representation of such views.
Transcript
CHECK AGAINST DELIVERY
1
China and the Global Economy1
Justin Yifu Lin Sr. Vice President and Chief Economist
World Bank
Remarks at the 20th Anniversary of the University of Science and Technology Hong Kong, March 23, 2011
I. Introduction
It is a great pleasure to be with you here today to commemorate the 20th anniversary of the Hong Kong University of Science and Technology. I was proud to be a member of its Business School faculty for 10 years from 1995 to 2005. Since its founding twenty years ago, this university has become one of the academic centers of excellence in the world; most notably, the Business School’s Kellogg-HKUST EMBA has topped Financial Times’ global rankings repeatedly. In the past 20 years the Chinese economy has also continued to develop and grow in extraordinary ways. As a student of the Chinese economy and economic development, I would like to use this auspicious occasion to reflect on the experience of China’s development, and I will organize my speech around the following three themes: (i) China’s achievements in the past 20 years, (ii) Prospects for China’s growth in the coming 20 years; (iii) Challenges for China’s growth; and (iv) China and the multi-polar growth world.
II. China’s Achievements in the Past 20 Years
Between 1979 and 1990, China’s average annual growth rate was 9.0 percent. At the end of that period and even up to early 2000s, many scholars still believed that China could not continue that growth rate much longer due to the lack of fundamental reforms.2
But China’s annual growth rate during the period 1990-2010 increased to 10.4 percent. On the global economic scene, China’s growth over the last two decades has been unprecedented. This was a dramatic contrast with the depressing performance of other transitional economies in Eastern Europe and Former Soviet Union.
As a result of the extraordinary performance, there has been a dramatic change in China’s status in the global economy. In 1990, China barely registered on the global economic scale, commanding a mere 1.6 percent of global GDP. Today, it is the world’s second largest economy and produces 8.6 percent of global GDP (in 2009).
1 I am grateful for David Rosenblatt’s help in preparing the paper. 2 The Coming Collapse of China by Gordon H. Chang, published in 2001 by Random House, was one representation of such views.
CHECK AGAINST DELIVERY
2
China’s average annual trade growth rate measured in current US dollar between 1990 and 2010 was an astonishing 17.6 percent. At the start of that period, China’s exports represented a mere 1.3 percent of global exports. Now China is the largest exporter of goods in the world with 8.4 percent of the global share.
In 1990, China was still a low-income country; in fact, its income per capita (measured in purchasing power parity) was 30 percent lower than Sub-Saharan Africa average. Today, its income per capita of $4,500 is over 3 times the level of Sub-Saharan Africa and can be counted firmly as a middle income country.
0%1%2%3%4%5%6%7%8%9%
10%
1990 2009
Figure 1: China's Share of World GDP (%)
Source: World Development Indicators
0%1%2%3%4%5%6%7%8%9%
1990 2009
Figure 2: China's Share of World Exports of Goods and Services (%)
Source: World Development Indicators
Merchandise Exports ($, trillions)
2009
China 1.20
Germany 1.13
United States 1.06
Japan 0.58
Source: World Development Indicators
CHECK AGAINST DELIVERY
3
Behind this growth, there has been a dramatic structural transformation—in particular, rapid urbanization and industrialization. At the start of economic reforms in the 1980s, China was primarily an agrarian economy. Even in 1990, 73.6 percent of its population lived in rural areas, and primary products comprised 27.1 percent of gross domestic product. The shares declined to 27.1 percent and 11.3 percent respectively in 2009. A similar change also occurred in the composition of China’s exports. In 1990 primary products comprised an important share of merchandise exports. Now, almost all of China’s exports are manufactures, as shown in the figures below.
-
0.5
1.0
1.5
2.0
2.5
3.0
3.5
1990 2009
Figure 3: China's GDP per capita (PPP)--Ratio to Sub-Saharan Africa
Source: World Development Indicators
CHECK AGAINST DELIVERY
4
Figures 4(a) and (b): The structural transformation of China’s exports—1990 and 2009
Source: WITS Database.
Accompanying the change in the composition of China’s exports is the accumulation of foreign reserves. In 1990, China’s foreign reserves were US $11.1 billion, barely enough to cover 2.5 months of imports, and its reserves today is nearly US $ 3 trillion--the largest in the world.
Food and live animals, 10.8%
Beverages and tobacco, 0.6%
Crude materials, inedible, except fuels,
5.6%
Mineral fuels, lubricants and related
materials, 8.3%
Animal and vegetable oils and fats, 0.3%
Chemicals, 6.2%
Manufact goods classified chiefly by
material, 20.6%
Machinery and transport equipment,
17.3%
Miscellaneous manufactured articles, 28.4%
Commodities & transactions not
classified according to kind, 1.9%
1990 Structure of Chinese Exports
Food and live animals, 2.7%
Beverages and tobacco, 0.1%
Crude materials, inedible, except
fuels, 0.7%
Mineral fuels, lubricants and
related materials, 1.7%
Animal and vegetable oils and fats, 0.0%
Chemicals, 5.1%
Manufact goods classified chiefly by
material, 15.4%
Machinery and transport equipment,
47.3%
Miscellaneous manufactured articles, 26.8%
Commodities & transactions not
classified according to kind, 0.1%
2009 Structure of Chinese Exports
CHECK AGAINST DELIVERY
5
Globally, China’s economic performance was outstanding during the East Asian financial
crisis (1998) and the current global (2008) crises. China withstood the shocks and maintained dynamic growth in both crises. China’s decision to maintain Reminbi’s stability helped other East Asian economies avoid a competitive devaluation, which contributed tremendously to quick recovery of the crisis-affected countries. China’s dynamic growth in the current global crises was a driving force for the global recovery.
Figures 5(a) and (b): China Glides Past Regional and Global Financial Crises
The reasons for China to have such a remarkable growth performance over the past twenty years were:
1. China adopted a dual-track approach and was able to achieve both stability and dynamic transformation simultaneously.
2. China was a latecomer, developed according to its comparative advantage, and tapped into the potential of advantage of backwardness3
Many authors, myself included, have written extensively about the Chinese government’s pragmatic approach to reforms. The result was to achieve “transition without tears.” This was no accident: it was based on the government’s recognition that big-bang reforms could be self-defeating. It was necessary to let private enterprise prosper wherever feasible, but to continue to support important state-owned enterprises while reforming them gradually.
3 For further discussions of these two points, see Justin Yifu Lin, “China Miracle Demystified,” Econometrica (forthcoming).
-2
0
2
4
6
8
10
1997 1998 1999 2000 2001
GDP Growth During the Asian Crisis, %
East Asia & Pacific
Source: WDI-3-2-10123456789
10111213141516
2005 2006 2007 2008 2009
GDP Growth During the Global Crisis, %
China
World
Source: WDI
CHECK AGAINST DELIVERY
6
The second point is the latecomer advantage, as I wrote in my article “China’s Miracle Demystified”4
:
“A developing country such as China, which started its modernization drive in 1949, potentially has the advantage of backwardness in its pursuit of technological innovation and structural transformation (Gerschenkron 1962). In advanced high-income countries technological innovation and industrial upgrading require costly and risky investments in research and development, because their vanguard technologies and industries are located on the global frontier. Moreover, the institutional innovation required to accommodate the potential of new technology and industry often proceeds in a costly trial-and-error, path-dependent, evolutionary process (Fei and Ranis 1997). By contrast, a latecomer country aspiring to be at the global technological and industrial frontiers can borrow technology, industry, and institutions from the advanced countries at low risk and costs. So if a developing country knows how to tap the advantage of backwardness in technology, industry, and social and economic institutions, it can grow at an annual rate several times that of high-income countries for decades before closing its income gap with those countries.“
III. Prospects for China’s Growth in the Coming 20 Years
Looking forward, China can still rely on the advantage of backwardness and has the potential to maintain dynamic growth for another 20 years or more because:
1. In 2008, China’s per capita income was 21 percent of US per capita income measured in purchasing power parity. 5
The income gap between China and the U.S. indicates that there is still a large technological gap between China and the industrialized countries. China can continue to enjoy the advantage of backwardness before closing up the gap.
2. Maddison’s estimation shows that China’s current relative status to the US is similar to Japan’s in 1951, Korea‘s in the 1977 and Taiwan, China’s in 1975. The annual growth rate of GDP grew 9.2 percent in Japan between 1951-1971, 7.6 percent in Korea between 1977-1997, and 8.3 percent in Taiwan between 1975-1995. China’s development strategy after the reform in 1979 is similar to that of Japan, Korea and Taiwan, China. China has the potential to achieve another 20 years of 8 percent growth. By that time, China’s per capita income measured in purchasing power parity may reach about 50 percent of U.S.’ per capita income. (Note that Japan’s per capita measured in purchasing power parity was 65.6 percent of that of U.S. in 1971, Korea’s was 50.2 percent in 1997, and Taiwan’s was 54.2 percent in 1995). Measured by purchasing power parity, China’s economic size may then be twice as large as the US; and measured by market exchange rates, China may be about the same size as the US.
4 ibid 5 The national data used in this and next paragraphs are taken from Angus Maddison’s Historical Statistics of the World Economy: 1-2008 AD. (www.ggdc.net/maddison/Historical_Statistics/horizontal-file_02-2010.xls).
CHECK AGAINST DELIVERY
7
That said, now China is becoming an innovator in its own right. As a middle-income country, in many sectors that China has comparative advantage, other higher income countries have graduated, or are close to graduating, from those sectors--for example, household electronics and the high-speed train. If China wants to maintain leadership in those sectors, China will need to develop the technology/product innovation when it reaches the frontier. China can then become a global technological/industrial leader in those sectors. There are also some new sectors, such as green technology, which are important for China’s sustainable growth. China has the potential to be a leader due to its large domestic market.
IV. Challenges of China’s Growth in the 12th Five Year Plan
Global crisis and the “New Normal” Over the last two and half years, the global economy has witnessed its most tumultuous
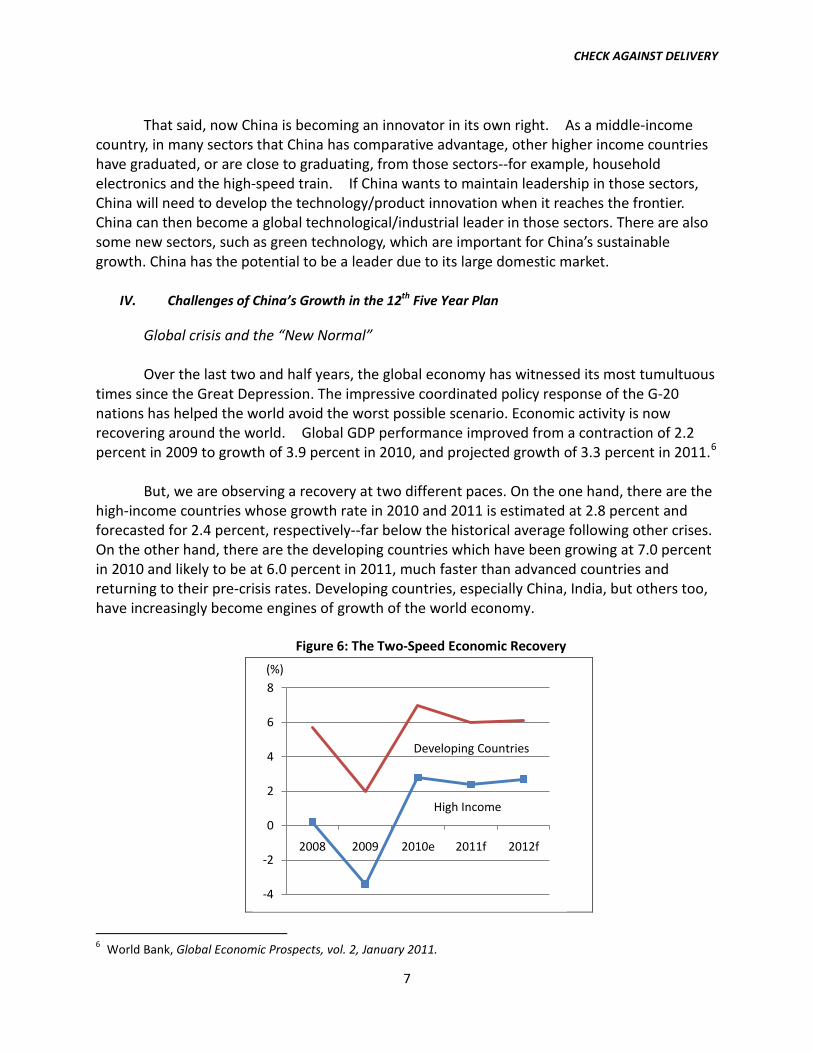
times since the Great Depression. The impressive coordinated policy response of the G-20 nations has helped the world avoid the worst possible scenario. Economic activity is now recovering around the world. Global GDP performance improved from a contraction of 2.2 percent in 2009 to growth of 3.9 percent in 2010, and projected growth of 3.3 percent in 2011.6
But, we are observing a recovery at two different paces. On the one hand, there are the high-income countries whose growth rate in 2010 and 2011 is estimated at 2.8 percent and forecasted for 2.4 percent, respectively--far below the historical average following other crises. On the other hand, there are the developing countries which have been growing at 7.0 percent in 2010 and likely to be at 6.0 percent in 2011, much faster than advanced countries and returning to their pre-crisis rates. Developing countries, especially China, India, but others too, have increasingly become engines of growth of the world economy.
Figure 6: The Two-Speed Economic Recovery
6 World Bank, Global Economic Prospects, vol. 2, January 2011.
-4
-2
0
2
4
6
8
2008 2009 2010e 2011f 2012f
(%)
Developing Countries
High Income
CHECK AGAINST DELIVERY
8
Source: World Bank Global Economic Prospects 2011: Navigating Strong Currents.
However, there are tremendous risks underneath this global outlook. First and most importantly, the high-income countries are still beset with high unemployment rates and large excess capacities in housing and manufacturing sectors, which repress private consumption and investment and dampen growth. The combination of low returns and high risks on financial investment in high-income countries, caused by low growth and high unemployment, has been referred to as the “new normal”.7
Second, the sovereign debts in a number of European countries and the government debts in some states in the U.S. may require restructuring, and they present a threat to the stability of global financial markets.
Third, the large short-term capital inflows to a number of middle-income countries create appreciation pressures and may damage their external competitiveness and stymie their growth prospects. The capital influx may also lead to the emergence of unsustainable bubbles in their equity and real estate markets.
Fourth, the surge in food, commodity and fuel prices in the last few months have hurt the poor, and threatened social stability, as demonstrated by events that unfolded in Tunisia and Egypt.
The above risks to a sustained recovery are directly or indirectly related to the simultaneous existence of large excess capacity in the high-income countries. In spite of the recovery, industrial production in high-income countries is estimated to be more than 10 percent below its peak in 2008.8
The challenge of triple imbalances
The high unemployment rate in high-income countries is a reflection of their large underutilization of capacity. The need for increasing social spending and undertaking stimulus efforts to counter high unemployment and underutilization of capacity at the same time that public revenue is under stress presents a dilemma. Fiscal deterioration is a looming concern and has led to state and sovereign debt problems in the US and several European countries. The adoption of low-interest rates in high-income countries as a countercyclical measure at the same time that investment opportunities are constrained by the underutilization of capacity encourages investors to seek high-yields, resulting in large short-term capital outflows to emerging markets and contributing to the spikes of food, fuel, and commodity prices.
Given the inevitable slowdown in the exports to high-income countries in the coming years and the need to reduce trade surplus, it is only prudent and pragmatic to consider ways to rebalance the Chinese economy towards domestic demand. Much is said about stimulating consumption, but the process should be balanced between consumption and continued strong growth in investment. The latter is critical for industrial upgrading, sustainable increase of per 7 Clarida, Richard (2010), “The Mean of the New Normal Is an Observation Rarely Realized: Focus Also on the Tails,” Global Perspectives, PIMCO, July. 8 World Bank (2011), ibid, p. 36.
capita income, as well as developing “green economy” sectors and investing in environmental protection. This shift towards domestic demand represents the first rebalancing.
A second form of rebalancing is a structural transformation to reduce income disparities. In spite of the general improvement of living standards, China has shifted from a relatively egalitarian society at the beginning of reforms in 1979 to a country with alarming income inequality. The Gini index reached 41.5 in 2005, approaching the level of Latin American countries.9
There is a third form of rebalancing that is overlooked by macroeconomists. China’s extraordinary growth has come with almost inevitable environmental costs. There is the need to rebalance short-term growth and long-term environmental sustainability. This poses a challenge for the future in terms of shifting the structure of production towards cleaner technologies.
The widening of disparity may threaten social stability and hinder economic growth.
The question then becomes: How can we engineer this triple rebalancing? Rebalancing towards domestic demand and reducing income disparities. The first two rebalancing themes are closely related in the case of China, since in the end, improving the distribution of income is the key to the rebalancing towards domestic demand.10
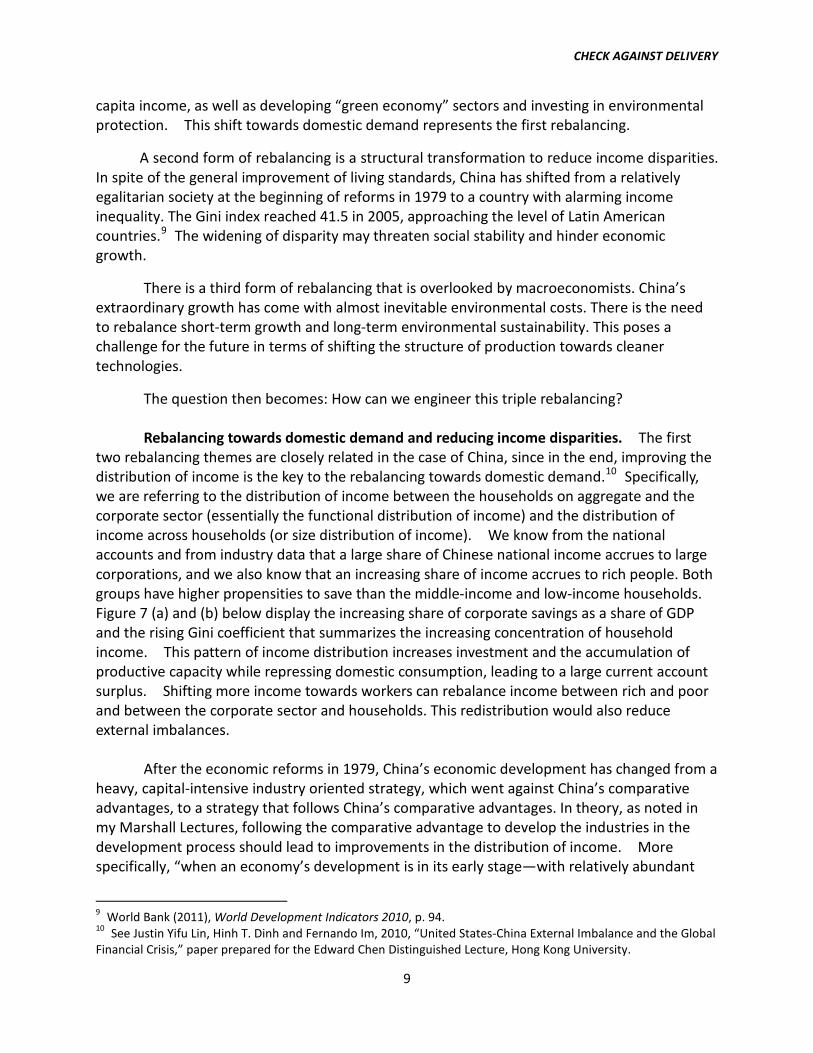
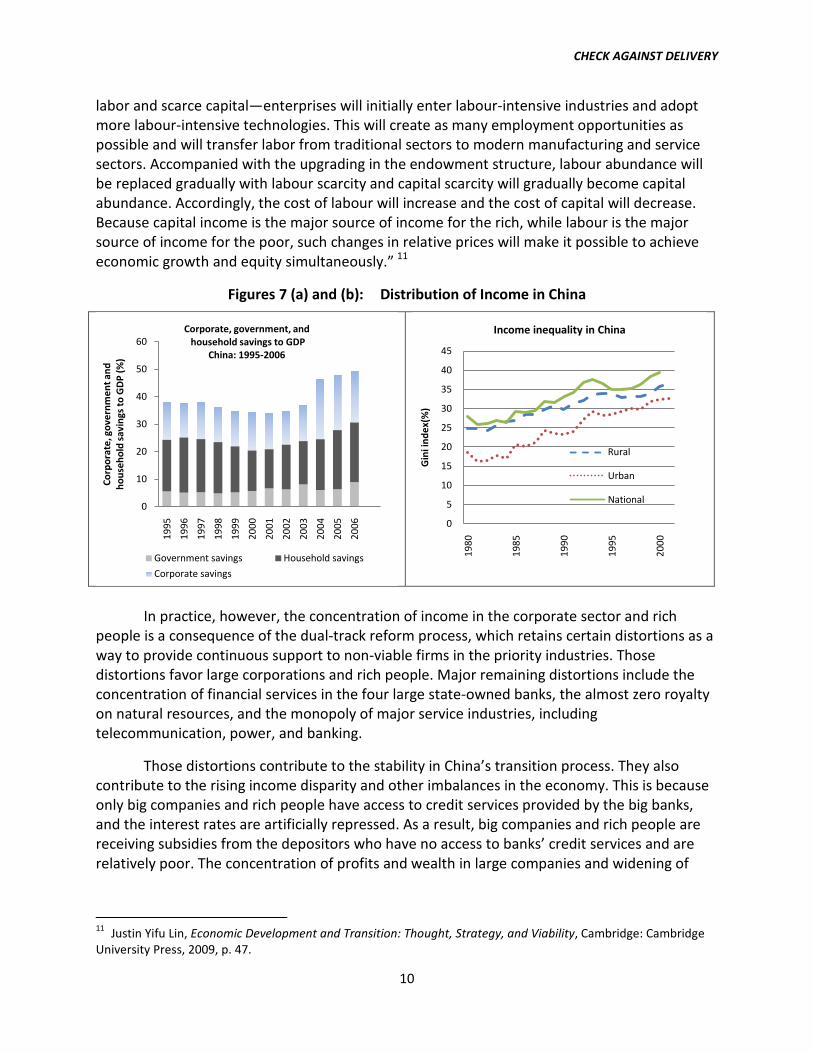
Specifically, we are referring to the distribution of income between the households on aggregate and the corporate sector (essentially the functional distribution of income) and the distribution of income across households (or size distribution of income). We know from the national accounts and from industry data that a large share of Chinese national income accrues to large corporations, and we also know that an increasing share of income accrues to rich people. Both groups have higher propensities to save than the middle-income and low-income households. Figure 7 (a) and (b) below display the increasing share of corporate savings as a share of GDP and the rising Gini coefficient that summarizes the increasing concentration of household income. This pattern of income distribution increases investment and the accumulation of productive capacity while repressing domestic consumption, leading to a large current account surplus. Shifting more income towards workers can rebalance income between rich and poor and between the corporate sector and households. This redistribution would also reduce external imbalances.
After the economic reforms in 1979, China’s economic development has changed from a heavy, capital-intensive industry oriented strategy, which went against China’s comparative advantages, to a strategy that follows China’s comparative advantages. In theory, as noted in my Marshall Lectures, following the comparative advantage to develop the industries in the development process should lead to improvements in the distribution of income. More specifically, “when an economy’s development is in its early stage—with relatively abundant
9 World Bank (2011), World Development Indicators 2010, p. 94. 10 See Justin Yifu Lin, Hinh T. Dinh and Fernando Im, 2010, “United States-China External Imbalance and the Global Financial Crisis,” paper prepared for the Edward Chen Distinguished Lecture, Hong Kong University.
CHECK AGAINST DELIVERY
10
labor and scarce capital—enterprises will initially enter labour-intensive industries and adopt more labour-intensive technologies. This will create as many employment opportunities as possible and will transfer labor from traditional sectors to modern manufacturing and service sectors. Accompanied with the upgrading in the endowment structure, labour abundance will be replaced gradually with labour scarcity and capital scarcity will gradually become capital abundance. Accordingly, the cost of labour will increase and the cost of capital will decrease. Because capital income is the major source of income for the rich, while labour is the major source of income for the poor, such changes in relative prices will make it possible to achieve economic growth and equity simultaneously.” 11
Figures 7 (a) and (b): Distribution of Income in China
In practice, however, the concentration of income in the corporate sector and rich
people is a consequence of the dual-track reform process, which retains certain distortions as a way to provide continuous support to non-viable firms in the priority industries. Those distortions favor large corporations and rich people. Major remaining distortions include the concentration of financial services in the four large state-owned banks, the almost zero royalty on natural resources, and the monopoly of major service industries, including telecommunication, power, and banking.
Those distortions contribute to the stability in China’s transition process. They also contribute to the rising income disparity and other imbalances in the economy. This is because only big companies and rich people have access to credit services provided by the big banks, and the interest rates are artificially repressed. As a result, big companies and rich people are receiving subsidies from the depositors who have no access to banks’ credit services and are relatively poor. The concentration of profits and wealth in large companies and widening of
11 Justin Yifu Lin, Economic Development and Transition: Thought, Strategy, and Viability, Cambridge: Cambridge University Press, 2009, p. 47.
0
10
20
30
40
50
60
1995
1996
1997
1998
1999
2000
2001
2002
2003
2004
2005
2006
Corp
orat
e, g
over
nmen
t and
ho
useh
old
savi
ngs
to G
DP
(%)
Corporate, government, andhousehold savings to GDP
China: 1995-2006
Government savings Household savings
Corporate savings
0
5
10
15
20
25
30
35
40
45
1980
1985
1990
1995
2000
Gin
i ind
ex(%
)
Income inequality in China
Rural
Urban
National
CHECK AGAINST DELIVERY
11
income disparities are unavoidable. The low royalty levies of natural resources and the monopoly in service sector have similar effects.
Therefore, it is imperative for China to address the structural imbalances, by removing the remaining distortions in the finance, natural resources and service sectors so as to complete the transition to a well-functioning market economy. The necessary reforms include: (1) Removing the financial repression and allowing the development of small, and local financing institutions, including local banks, so as to increase financial services, especially access to credit, to household farms as well as small- and medium-size enterprises in manufacturing and service sectors; (2) Reforming the pension system, removing the old retired worker’s pension burden from the state-owned mining companies and levying an appropriate royalty taxes on natural resources; and (3) Encouraging entry and competition in telecommunications, power and financial sectors.
In recent debates about the rebalancing toward domestic demand in China, much is made of the need for social safety nets to stimulate domestic demand. I will argue that the need for social safety net is for the purposes of social harmony rather than for increasing the ratio of consumption in China. This is because while households may increase the propensity for consumption with improved social safety nets, the government needs to increase savings in order to accumulate the provision funds for covering the costs of pension and other social spending. As a result, the total aggregate savings of private households and the government may not change much.12 The reforms in social safety nets are desirable mainly for protecting the vulnerable and for providing transitory support to relieve temporary shocks to jobs and health and to maintain social harmony. The reforms can be based on lessons from international experience from both developed and developing countries. Here, let me note that there have been mixed results from pension privatization reforms, despite the need for a fiscally sustainable old-age security system. The question of full funding can be addressed separately from the question of who manages the savings, and a multi-pillar design is generally recommended.13 In other social programs, the lessons from the experience of conditional cash transfers are quite positive, and this is something that China could explore.14
The environment: rebalancing short-term growth and long-term sustainability. Pollution and global warming are real challenges for long-term sustainability. China is a continental economy, and as a result environmental externalities from economic activity are internalized within China’s borders. This implies that there are direct impacts of pollution on the health of the population. Another challenge is that China is still on the high carbon phase of development. These challenges for sustainable growth create the opportunity for China to become a technological leader in green growth. Theory and experience has shown that 12 An example of this phenomenon is Singapore, which has one of the best social safety nets in the world, but its savings as a percentage of GDP have been as high as 40 percent. 13 See Robert Holzmann and Richard Hinz, 2005, Old-Age Income Support in the 21st Century: An International Perspective on Pension Systems and Reform, World Bank: Washington DC. 14 Conditional cash transfers (CCTs) form one of the most carefully analyzed public policy programs in developing countries with numerous impact evaluations completed. For a survey, see Ariel Fiszbein and Norbert Schady, 2009, Conditional Cash Transfers: Reducing Present and Future Poverty, World Bank: Washington D.C.
CHECK AGAINST DELIVERY
12
innovation in this area can have important positive spillover effects for technological upgrading more broadly in the economy, as well.
It should be noted that the reforms discussed above are the main items in the Twelfth Five-Year Plan.
V. China and the Multi-polar Growth World
It is important to place this moment in history in a broader historical context. After the Industrial Revolution, the world was polarized. Growth in industrialized countries accelerated. Later, in the 20th century, a few developing economies in East Asia were able to accelerate growth, and they caught up with the industrialized countries. Most other developing countries failed to have sustained and accelerated growth. As a result, there is a great divergence between the developed and developing countries as Figure 8 shows.
Figure 8: History of Economic Growth
Source: Based on Maddison dataset
Given this history, the global economy was dominated by the G7 economies consistently throughout the latter half of the 20th century. At market exchange rates, the G7 represented about two-thirds of the global economy. Even accounting for purchasing power parity, half of global income was concentrated in the G7, as displayed in figure 9 below.
Source: Author’s calculations based on World Development Indicators.
With the rapid growth in the past 20 years, China has become a major driving force for the emergence of a multi-polar growth world. As shown in figure 10, in the 1980s and the 1990s, except for China, the other top five contributors to the growth of global GDP were all members of the G7 industrialized countries and China’s contributions were respectively 13.4 percent and 26.7 percent of the contributions of the United States in these two decades. However, in the decade of 2000-2009, China became the top contributor to the growth of global GDP, among the G7 countries only the United States retained in the top-five list, and China’s contribution exceeded that of United States by 4 percentage points. There emerges a multi-polar growth world in the 21st century, with many of the new growth poles are emerging market economies.
CHECK AGAINST DELIVERY
14
Figures 10 (a-c): Top Five Contributors to Growth By Decade
Source: Author’s calculations based on data from the WDI. During the first decade of this century, a burst of convergence has occurred, as developing countries grew substantially faster than the high-income countries (HICs). As we can see in figure 11, this superior growth was widespread in developing countries across regions.
Figure 11: Growth acceleration in developing countries
Source: Data from World Development Indicators As a result of this superior growth in the developing world, we have witnessed a shift towards a more multi-polar growth world. Figure 12 shows this shift in economic weight from
05
1015202530
1980-1990
05
10152025303540
1990-2000
0
5
10
15
20
25
30
2000-2009
0
1
2
3
4
5
6
7
8
9
10
Developing Countries
East Asia & Pacific
South Asia Europe & Central Asia
Sub-Saharan Africa
Middle East & North
Africa
Latin American & Caribbean
(percentage points, avg. for 2000-2008)Additional Growth in Developing CountriesHICs Average Growth
CHECK AGAINST DELIVERY
15
the G7 economies to the developing economies—both the larger members of the G20 and other countries beyond the G20.
Figure 12: Rebalancing of the Global Economic Landscape
Source: Author’s calculations based on World Development Indicators.
As discussed in section I, China has the potential of maintaining an 8 percent annual growth rate for another two decades. If China can maintain this growth rate in the coming years, China may contribute to the multi-polar growth world in many other ways in addition to GDP growth and trade. There will be benefits shared and opportunities created by China’s growth – for both high-income countries and developing countries. For high-income countries, China’s growth will expand markets for their capital goods and intermediate goods exports. Many developing countries are still major producers of agricultural and natural resource commodities. Chinese consumption and production growth will continue to support adequate prices for commodity prices and thus help these exporters.
In addition, Chinese government and Chinese firms will also provide funds for natural resource and infrastructure investment in emerging markets and low income countries. This is already happening, and it is likely to continue into the future. In particular, there is a growing
CHECK AGAINST DELIVERY
16
role of Chinese finance in the Africa region—the developing region with the most constrained access to finance.15
The continued structural transformation of the Chinese economy will create other opportunities. As China undergoes industrial upgrading to more sophisticated product markets, it will leave the market space for other developing countries to enter the more labor-intensive industries. Chinese enterprises are expected to relocate their existing production to other lower wage countries as they upgrade to higher value-added industries, like Japan and East Asian economies did a few decade ago. The difference is that because of its size China may become a “leading dragon” for other developing countries instead of a “lead goose” in the traditional flying geese pattern of the international diffusion of industrial development.
16
China also has an important and expanding role in the new global economic architecture. As the economic landscape changes to a multi-polar growth world, the international architecture will reorganize, as evidenced by the shift from the old “G7” to the broader “G20.” China has become a key member in regional and international fora, such as the APEC and the G20. Over time, there is also the possibility of the gradual emergence of the Chinese Renminbi as a global reserve currency. This is something that would require many fundamental reforms in the Chinese economy; however, it is almost inevitable given the growing relative strength of China in the multi-polar world. Finally, as a Professor (on leave) and as the Chief Economist of the World Bank, I must mention the intellectual contribution that Chinese scholars can make to understanding the challenges of economic development and transition in the world. China’s growth experience of the last twenty years as well as Hong Kong and other East Asian economies’ growth in the post WWII period is extraordinary and unexpected in human history—both for its pace and for the policy framework that guided the process. Their policy framework often did not follow the recommendations based on the main stream economic theories. Since the birth of modern economics in the late 18th century, marked by the publication of Adam Smith’s Wealth of Nations, modern economic theories are based mostly on the experience of industrialized nations. China’s and other East Asian economies’ experiences provide a golden opportunity for rethinking the fundamental issues of the roles of the state, market, and other institutions in a developing country’s process of development and transition to catch up with the industrialized nations. The role of theory is to explain the observed phenomena and to guide policy choices. New theory comes from new phenomena. You, my friends, at the University of Science and Technology, based here in Hong Kong, are particularly well placed to draw from China’s and other East Asian economies’ experiences and make a contribution to the theoretical development of modern economics.
15 Yan Wang, “Development Partnership for Growth and Poverty Reduction: a synthesis of the first event organized by the China-DAC Study Group on ―Development Partnerships for Growth and Poverty Reduction”, held in Beijing on October 28-29, 2009. 16 For the flying geese pattern of industrial diffusion, see Akamatsu, Kaname. 1962. "A Historical Pattern of Economic Growth in Developing Countries. In: The Development Economies, Tokyo, Preliminary Issue No. 1, pp.3-25.