24
China-Australia Free Trade Agreement – Highlights Group Economics November 2014 more give, less take Economic Report Photo: Renato Ganoza https://flic.kr/p/6peiQa

China-Australia Free Trade Agreement – Highlights Group Economics November 2014
more give, less take
Economic Report
Photo: Renato Ganoza https://flic.kr/p/6peiQa

Introduction
The Chinese-Australia Free Trade Agreement (FTA)
• Improved access for Australian food exports – phased tariff removal on dairy, beef,
sheep-meat, wine, horticulture, seafood, hides-skins-leather
• Agreement allows discretionary barriers for beef and whole milk powder, for
Australian exports above an agreed volume
• Some industries miss out (rice, cotton, sugar) – sensitive domestic sectors in China
• Improved access for Australian resource exports – tariff removal on coal, alumina
and several other mineral ores
• Improved market access for Australian service providers – including finance,
healthcare, legal services, construction and mining services
• Facilitates increased Chinese investment in Australia – increasing FIRB screening
threshold for private sector investment projects
• This FTA generally well received by business, unlike some previous FTAs where lack
of progress in market access in key areas was criticised
• These are all valuable initiatives but need to see more detail
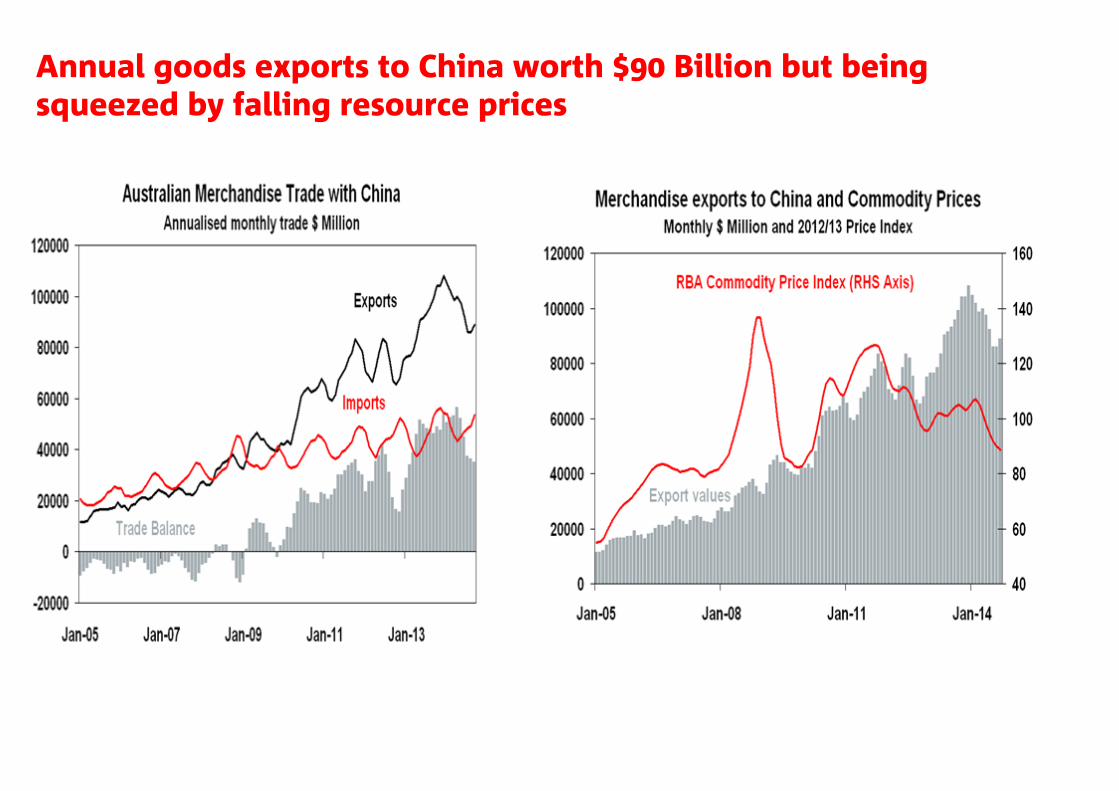
Annual goods exports to China worth $90 Billion but being squeezed by falling resource prices

China our biggest export market, displaced Japan and now takes one-third of all merchandise sold

Commodity base of goods trade – iron ore accounts for over 50% of total exports
0
50
100
150
200
2007 2008 2009 2010 2011 2012 2013 20140
50
100
150
20063.5% iron content (LHS)
62% iron content (LHS)
Source: Bloomberg, Thomson Datastream, NAB Economics
US$/t (incl. cost of freight)
Chinese iron ore stocks (RHS)
Mt
Iron ore prices have trended down since late 2013

Biggest bilateral trade flows involve WA – 70% of Australian exports and over half WA total
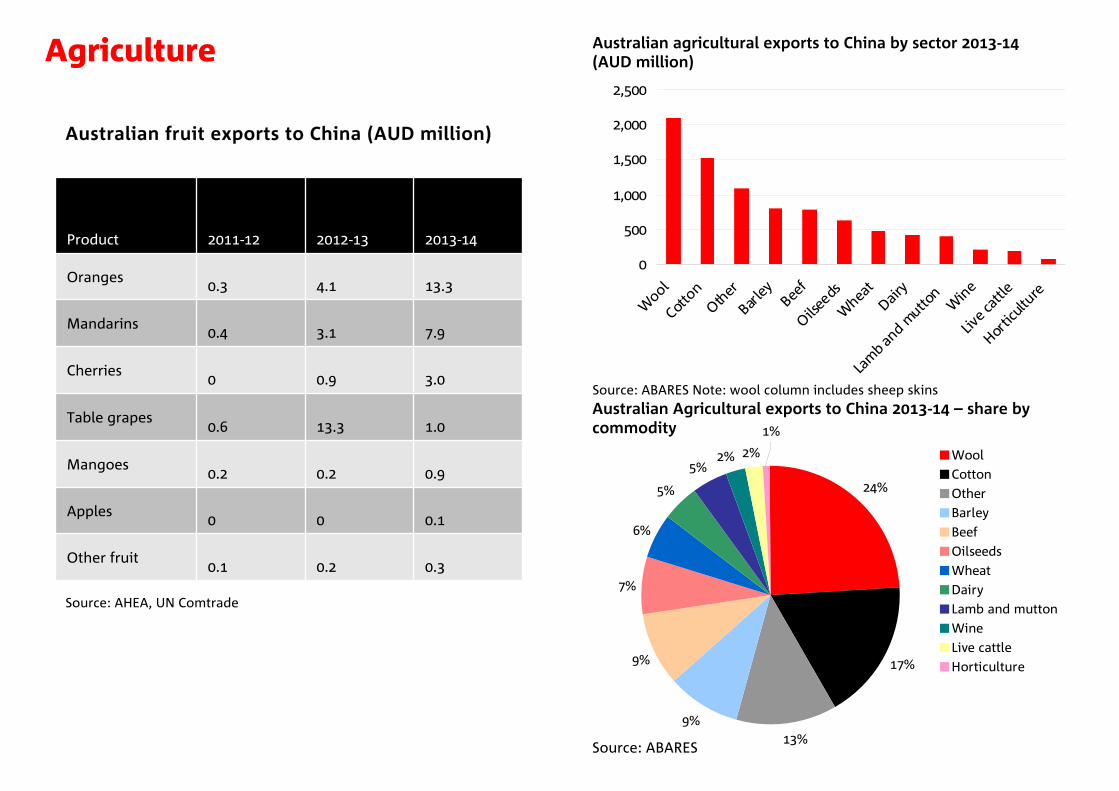
Australian agricultural exports to China by sector 2013-14 (AUD million)
Source: ABARES Note: wool column includes sheep skinsAustralian Agricultural exports to China 2013-14 – share by commodity
Source: ABARES
Agriculture
0
500
1,000
1,500
2,000
2,500
Wool
Cotto
nOth
erBar
ley Beef
Oilsee
dsW
heat
Dairy
Lam
b and m
utton
Win
eLiv
e cat
tleHor
ticult
ure
24%
17%
13%9%
9%
7%
6%
5%
5%2% 2%
1%
WoolCottonOtherBarleyBeefOilseedsWheatDairyLamb and muttonWineLive cattleHorticulture
Product 2011-12 2012-13 2013-14
Oranges0.3 4.1 13.3
Mandarins0.4 3.1 7.9
Cherries0 0.9 3.0
Table grapes0.6 13.3 1.0
Mangoes0.2 0.2 0.9
Apples0 0 0.1
Other fruit0.1 0.2 0.3
Australian fruit exports to China (AUD million)
Source: AHEA, UN Comtrade

0
1,000
2,000
3,000
4,000
5,000
6,000
7,000
8,000
9,000
10,000
2008–09 2009–10 2010–11 2011–12 2012–13 2013–14
Other
Dairy
Wool
Lamb and mutton
Live cattle
Beef
Horticulture
Wine
Cotton
Oilseeds
Wheat
Barley
Chinese tariff reductions for Australian producers
Source: DFAT *for most products
Australian agricultural exports to China (AUD million)
• The FTA includes significant reductions Chinese tariffs applied to Australian imports. The FTA will reduce tariffs to zero over several years for Australian dairy, beef, live animals, lamb and mutton, wine, horticulture, barley, seafood, hides skins and leather as well as processed foods. The FTA also creates an Australia-only duty free quota for wool. There are no changes to tariffs or market access for Australian rice, wheat, cotton or sugar.
• China is Australia’s largest agricultural export market, valued at AUD8.7 billion in 2013-14 –23% of Australia’s total agricultural exports for the year. This is up from only 11% five years earlier.
• Australia’s agricultural exports to China are dominated by fibres. Over 40% of the total export value in 2013-14 was fibres – wool, cotton and animal skins. Grains, in particular barley, wheat and oilseeds, are also important, as is beef.
CommodityCurrent tariff New tariff Timeline
Dairy 12-25% 0% 4-11 years
Beef 12-25% 0% 9 years
Live animals 10% 0% 4 years
Lamb and mutton 12-23% 0% 8 years
Wine 14-20% 0% 4 years
Horticulture Up to 30% 0% 4 years*
Barley 3% 0% Immediately
Seafood 14-15% 0% 4 years
Hides, skins, etc. 5-14% 0% 2-7 years
Agriculture
Commodity Quota (kt)In quota tariff
Over quota tariff
Wheat 9636 1% 68%
Corn 7200 1% 50%
Rice (short/medium) 2660 1% 50%
Rice (long grain)2660 1% N/A
Cotton 894 1% Variable
Sugar 1945 15% 50%
Wool 287 1% 38%
Wool tops 80 3% 38%
Chinese WTO tariff rate quotas for Agricultural Commodities
Source: USDA

Share of total Australian agricultural exports sent to China
ABARES projected increase in Chinese food demand to 2050 (2009 USD billion)
Source: ABARES
• While reductions in tariffs for Australian, dairy, beef, lamb, wine and horticultural producers are welcome, these five sectors make up only 22% of agricultural exports to China.
• Agricultural sectors more heavily dependent on exports to China, such as wool and cotton, do not enjoy much more favourable treatment under this FTA, notwithstanding the Australia-only duty free quota for wool. Sectors increasingly dependent on China, such as oilseeds and barley, have mixed fortunes. While China’s already low 3% tariff on Australian barley is cut to zero effective immediately, oilseeds do not enjoy improved tariff rates or market access.
• Forecasts by the USDA and ABARES highlight the extent of potential growth in Chinese food demand, flowing into greater imports. Between 2013 and 2023 the USDA predicts a virtual doubling in Chinese imports of cotton and beef, 60% rises in pork and oilseeds and 30% in barley. Wheat and sorghum imports are not expected to grow. ABARES modelling forecasts that between 2009 and 2050 Chinese imports of beef should rise 10 fold, fruit by 200%, dairy by 165%, sugar by 100% and cereals by 50%. Sheep and goat meat has the biggest predicted rise in imports between 2009 and 2050 – almost 20 fold.
0%10%20%30%40%50%60%70%80%90%
100%
2008
–09
2009
–10
2010
–11
2011
–12
2012
–13
2013
–14
Barley
Wheat
Oilseeds
Cotton
Wine
Horticulture
Beef
Live cattle
Lamb and mutton
Wool
Dairy
Other
0 50 100 150 200 250 300
Vegetables
Cereals
Oilseeds
Beef
Dairy20502009
Agriculture

Australian annual wool exports to China (tonnes)
Source: UN Comtrade Note: chart shows wool, not combed or carded
Australian beef exports
Source: Meat and Livestock Australia
• This FTA is quite ‘clean’ in introducing few limits on the volume of agricultural imports that can be brought in duty free. Nevertheless China retains a few discretionary safeguards for beef and whole milk powder imports.
• The FTA imposes discretionary safeguards for Australian beef and whole milk powder above trigger points of 170,000 tonnes and an unpublished rate above current levels respectively. Australian beef exports to China stood at 154,294 tonnes in 2013, but have fallen in 2014. Nonetheless, the beef safeguard will allow China a trigger to impose tariffs should exports to China grow much beyond current levels.
• For wool, China already provides a WTO tariff rate quota of 287,000 tonnes, in which tariffs are 1%. The FTA will provide Australia with an additional quota of 30,000 tonnes (clean wool) that scales up over time. While China may impose a tariff of 38% beyond the 287,000 tonne quota, it generally declines to do so and the additional clean wool quota may not be used much.
Agriculture – discretionary safeguards
0
50,000
100,000
150,000
200,000
250,000
300,000
1988
1990
1992
1994
1996
1998
2000
2002
2004
2006
2008
2010
2012

0
2,000
4,000
6,000
8,000
10,000
12,000
1999
-00
2000
-01
2001
-02
2002
-03
2003
-04
2004
-05
2005
-06
2006
-07
2007
-08
2008
-09
2009
-10
2010
-11
2011
-12
2012
-13
NSW VIC QLD SA WA TAS
Australian dairy exports to China by type (AUD million)
Source: ABARES, NAB Group Economics
Australian milk production (million litres per year)
Source: Dairy Australia
New Zealand dairy exports (USD million)
Source: UN Comtrade, NAB Group Economics
• The New Zealand-China FTA is often credited with boosting NZ’s dairy exports since coming into force in October 2008. There has been a substantial increase in NZ dairy exports to China since 2008.
• Longer term trends for Australian dairy have been less favourable and characterised by industry consolidation and lower milk production. Total Australian milk production fell 15.2% between 1999-00 and 2012-13.
• To fully capitalise on the FTA, Australian dairy producers require further economies of scale in farming and investment in processing capacity, as well as strategies to mitigate the effects of future droughts.
0
2,000
4,000
6,000
8,000
10,000
12,000
1989
1992
1995
1998
2001
2004
2007
2010
2013
Rest of world China
FTA enters force
0
100
200
300
400
50020
08–0
9
2009
–10
2010
–11
2011
–12
2012
–13
2013
–14
Butter Cheese
Casein Skim milk powder
Whole milk powder Other dairy products
Agriculture – dairy sector
NZ FTA enters force

China’s cotton imports by source (tonnes)
Source: UN Comtrade, NAB Group Economics
World cotton prices
• Cotton is one of Australia’s biggest agricultural export earners in China but the FTA delivered no improvement in market access. This reflected the sensitivity of the sector; China has already accumulated a very big stockpile of cotton because of industry support arrangements.
• This price support system entails over $US5 billion in subsidies annually. The regime of minimum support acquisition prices and stock accumulation is to be replaced in 2014/15 by a direct subsidy to Xinjiang farmers.
• Facing this high cost policy that has created a big overhang of stocks, the Chinese will restrict cotton imports to the 894 kt specified in their WTO commitments, signalling zero allocation for the sliding scale discretionary quota that exceeds that amount and leaving importers of additional cotton facing a 40% tariff.
• This is not a favourable environment for Australian growers to get improved market access in China.
Agriculture – cotton sector
Chinese cotton situation Million Bales (USDA)2012/13 2013/14 2014/15 (f)
Production 35 32.75 30Consumption 36 34.5 37.5Imports 20.3 14.12 7Start stocks 31.08 50.36 62.71End stocks 50.36 62.71 62.16

The FTA includes the removal of tariffs on resource and energy products (e.g. coal) and transformed resource & energy products (refined metals).
The most significant of these relate to tariffs on coal exports – Australia’s second largest export behind iron ore. A 3% tariff on coking coal is to be removed immediately, while the 6% tariff on thermal coal will be phased out over 2 years.
The impact of China’s coal tariffs is not easy to see in the export data since they were only reintroduced in October of this year (trade data are only available to September). The tariffs affect Australia and Russia (China’s 2nd and 3rd largest coal sources) disproportionately as Indonesia (China’s largest source of coal imports) was already exempt under an FTA between China and ASEAN.
Australian coal producers face a softening demand environment in China, so the removal of these (short-lived) tariffs will help to buffer some of the weakness. However, this is more true for Australian coking coal producers which tend to have a production cost advantage. Australian thermal coal on the other hand tends to be further up the cost curve and will continue to face difficulties with competitiveness regardless.
Resources & Energy
Chinese Coal Imports
0
2
4
6
8
10
12
14
16
2008 2009 2010 2011 2012 2013 2014
Australia Indonesia Russia
Mt
Source: CEIC
Sample of tariff reductions for minerals
Source: DFAT; BREE
CommodityCurrent tariff
New tariff Timeline
% of Min. exp.
Coking coal 3% 0% Immediately 12%
Thermal coal 6% 0% <2 years 8½%
Refined copper & alloy
1% & 2% 0% Immediately 4½%
Aluminium5% & 7% 0% Immediately 3%
Alumina 8% 0% Immediately 2%
Nickels 3% 0% Immediately <2%
Zinc 3% 0% Immediately <2%

Trade liberalised across many areas of services
Market access for many Australian service providers could improve significantly
–
Industry Proposed liberalisation
Medical services can establish wholly owned hospitals and aged care facilities – opportunity for firms like Ramsay Health Care
Law firms allowed to link in with Chinese law firms in Shanghai Free Trade Zone “without restrictions on where clients may be located”
Telecom firms guaranteed new market access to specific telecom services in Shanghai Free Trade Zone
BanksMore liberal access through shorter waiting times, streamlined approvals for pre- existing Australian banks and removal of minimum working capital requirements for Australian branches operating as subsidiaries in China
Fund managers able to invest offshore RMB in Chinese onshore financial assets under the RQFII program (50 Billion RMB initial quota)
Insurers allowed to access China’s statutory 3rd party car insurance market
Currency traders Official RMB clearing bank to be established in Sydney, giving a more direct way for cross-border RMB transactions than was available before (already announced)
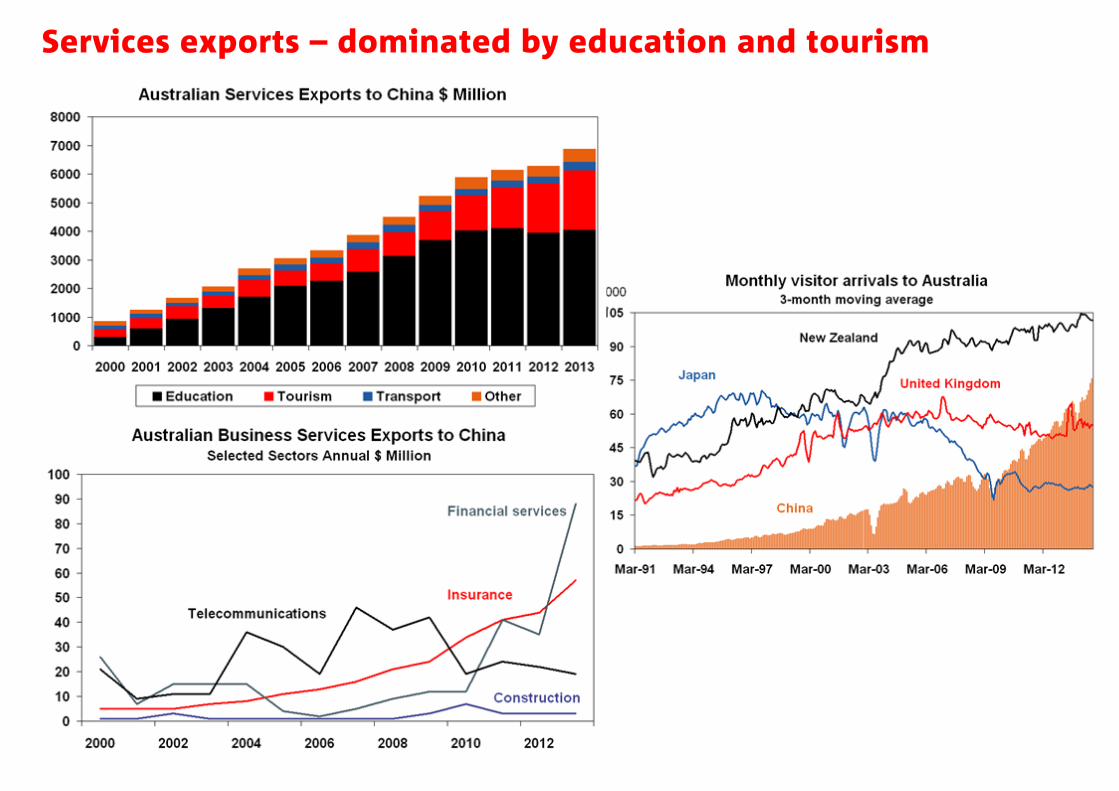
Services exports – dominated by education and tourism

Healthcare
• China’s population is ageing and life expectancy is rising - demand for healthcare is set to increase in coming years.
• Current private hospital system - Mostly joint-ventures with domestic investors, and tends to serve foreign workers and high wealth Chinese – comparatively high costs are not covered by basic medical insurance schemes.
• Recent changes - In August, China’s government announced it will allow overseas-owned private hospitals to open in major developed cities. Aim is to encourage the development of high-end medical services and encourage public hospitals to lift standards.
• Challenges remain, and must be overcome for wider growth – High cost could remain a constraint on the sector
• In most cities, China’s doctors require permission from state- owned hospitals in order to practice in the private sector – many public hospitals are reluctant to let their better doctors go.
• In August, Beijing became the first municipality to allow doctors to work in multiple locations without permission from their public employer.
• Impact of FTA - China will allow Australian health service suppliers to establish wholly owned hospitals and aged care institutions in China.
• Ramsay Health Care has signed a memorandum of understanding to take a 50% share of Jinxin Group’s healthcare assets in Chengdu (the fourth most populous city in mainland China (2010 census).
16
0
5
10
15
20
25
30
35
40
1950 1960 1970 1980 1990 2000 2010 2020 2030 2040 2050
Australia
China
World
Source: UN population database, NAB Economics
% (ratio of older age to working age population)
China’s ageing population a driver of health demand
0
50
100
150
200
250
300
350
Cardiovascular Respiratory Diabetes0
20
40
60
80
100
120
140
Age standardised deaths per 100 000 of populationSource: World Health Organisation, NAB Economics
Mortality rate Mortality rate
LHS RHS
China
United States
Australia
Higher mortality rates from non-communicable diseases

Finance
Banking• Reduction in waiting time for Australian banks conducting
RMB business from 3 to 1 year.• Ending of 2-year profit-making requirement before banks
can provide RMB services.• Streamlined approval process for RMB business for
additional branches of an already approved Australian bank already operating in China .
• Removal of RMB 100 million working capital needed by branches of Australian banks.
Insurance • Access to statutory third-party liability car insurance market.
Fund managers and securities firms• Australian financial institutions allowed to invest offshore
RMB in Chinese onshore financial assets (bonds, equity) under RQFII program.
• Australian securities firms benefit from increased foreign equity participation limits when underwriting Chinese domestic shares.
• Australian securities brokerage and advisory firms to provide cross-border securities trading accounts, custody, advice and portfolio management services to selected Chinese investors who are approved to invest offshore.
17
Ramping up of bank lending to Chinese borrowers
Australian finance sector earnings in China

Chinese direct investment in Australia has been growing strongly in recent years, reaching around $20 billion in 2013.
Although this is still quite small relative to our biggest foreign investors in the United States and United Kingdom, China has been quickly closing the gap with countries such as Singapore and the Netherlands.
According to the most recent data published by the FIRB (for 2012-13), most of China’s direct investment is concentrated in the mining sector as well as property – which aligns with the dominance of resources in Australia’s export mix to China.
The main outcome for investment from the FTA is the raising of the threshold at which investments in non- sensitive sectors by private sector entities from China are considered by the Foreign Investment Review Board (FIRB) from $248 million to $1,078 million.
Chinese Investment in Australia
Major countries investing in Australia 2012-13 ($m)
Source: FIRB
CountryNo. of approvals Agri
Finance & insurance Manuf. Mining
Real Estate
Resource process Services Tourism Total
USA 264 880 1,647 1,563 5,381 4,406 60 6,666 25 20,627
Switzerland 51 - - 12 15,763 346 - 2,266 - 18,387
China 6,102 328 23 957 8,273 5,932 - 291 - 15,803
Canada 218 553 - 355 1,545 4,926 25 6,987 - 14,392
UK 1,197 - 159 494 3,198 1,671 - 1,318 - 6,849
Japan 111 - 129 - 2,906 895 - 654 - 4,589
Total 13,421 2,858 2,924 6,509 45,142 51,907 422 25,909 25 135,699
Direct Investment in Australia $ billion ABS Data (stock)
0
20
40
60
80
100
120
140
160
2005 2006 2007 2008 2009 2010 2011 2012 2013
United States
United Kingdom
Japan
China
Netherlands
Singapore

More to be done on investment Most of the benefit should come from shorter planning
times due to the reduction of ‘red tape’ – 80% of all foreign investment in Australia comes from arrangements valued more than $100 million. Heritage Foundation data also suggests that the majority of Chinese investment projects in Australia are above US$100 million.
The FIRB has not been a major hurdle to (private) foreign investment. Only a small number of applications have been rejected since 2007 – despite some high profile exclusions based on national interest/national security grounds.
The FTA does not appear to abolish the ‘national interest test’ and in fact re-enforces it for industries such as media, telecommunications and defence- related industries (as well as maintaining additional safeguards in agriculture). Most importantly, the FTA does not increase the threshold for SOEs.
Third party data provided by The Heritage Foundation (which tracks Chinese foreign investments valued over US$100 million) shows that in 2012/13 most Chinese investment in Australia was undertaken by SOEs (the bulk of which occurred in the mining sector).
Only 3 proposed Chinese projects in Australia in 2012/13 did not proceed (only one involved a private Chinese investor) – the failure of the project was not a direct result of red tape.
China FDI in Australia (2012/13)*
0
2000
4000
6000
8000
10000
12000
Mining Agriculture/property Troubled transactions
SOE (or affiliated)Private (or JV)
* Valued over $100 millionSource: Heritage Foundation; NAB Economics
USD mn
None due to FIRB
rejection
Number of FIRB applications considered (all global investors)
Source: FIRB
2008/09 2009/10 2010/112011/1 2 2012/13
Approved:
Unconditional 2,266 2,672 4,606 4,900 5,535
Conditions 3,086 1,729 5,687 5,803 7,196
Rejected 3 3 43 13 -
Withdrawn 341 167 390 534 446
Exempt 125 132 139 170 145
Total 5,821 4,703 10,865 11,420 13,322

The NAB Australia-Asia Business Engagement Index asks Australian businesses about their trade engagement. The index differs from other measures of trade by capturing engagement at the business level rather than at the output level and it looks at business overall (QBS) as well as small (SME) and large (ASX300) firms.
Business engagement is clearly strongest with China (versus other economies) across all firm size ranges.
The level of engagement also varies by business activity. For example, engagement with China is strongest in product imports followed by off-shoring of product. Consequently, although most of the attention has focussed on farm exporters, the largest single group of businesses impacted by the China FTA are firms bringing products into Australia.
Variation in Business Engagement with China across firm types
Business Engagement by Type - China
0
10
20
30
40
50
60
70
80
90
100
Imp
ort
Pro
du
cts
Off
sho
rePr
od
uct
s
Exp
ort
Serv
ices
Imp
ort
Serv
ices
Exp
ort
Pro
du
cts
Off
sho
reSe
rvic
es
QBS/Economy ASX 300 SMEs
Engagement by Country: Weighted by Type of Engagement
0
5
10
15
20
25
30
35
40
45
50
Chin
a
Sin
gap
ore
Jap
an
Mal
aysi
a
Thai
lan
d
Ind
ia
Ind
on
esia
Ho
ng
Ko
ng
Sou
th K
ore
a
Oth
er
Taiw
an
Vie
tnam
Phili
pp
ines
QBS/Economy ASX 300 SMEs

21
Manufacturing to face more pressure Manufacturing output has been trending down as high cost domestic producers face rising competition from offshore
competitors. China is a key supplier of low cost manufactured goods and Australian imports from China are dominated by a wide range of manufactured goods with light manufactured consumer articles like textiles clothing and footwear plus electronic and electrical goods featuring strongly. The high $A has hit Australian manufactured exporters.
The FTA contains provisions that cushion its impact on Australian manufacturers
1. Trade remedies under the WTO such as Anti-dumping and Countervailing measures are still available
2. The China FTA has an additional temporary safeguard measure in case an Australian industry faces “serious injury” due to a surge in imports following the tariff cuts it contains
3. Although all Australian tariffs on manufactured imports from China will be removed, 2 to 4 year phase out periods are included for sensitive sectors like steel, aluminium, canned fruit, carpets, clothing and footwear. Industry lobby groups intend to explore just how extensive these phase out provisions are across sectors with the Government.
Source: DFAT. STM: simply transformed manufactures; ETM: elaborately transformed manufactures

Conclusion• The FTA offers considerable potential for Australian agricultural and services firms as a result of their improved
market access
• Market access being improved in sectors where growth outlook strong (protein demand, fresh fruit, services) as
Chinese growth model re-balances toward consumption and with less focus on investment and less metal
intensive activity
• FTAs usually involve winners and losers with Governments focusing attention on the former, we need to see the
details to establish the balance more precisely
• Dairy, meat and horticulture stand to gain significantly but little is on offer to the wool and cotton industries that
account for a large share of rural exports
• This FTA helps levels the playing field for market for Australian industries facing rival producers who already have
FTAs (NZ dairy, Chilean horticulture)
• Lower tariffs are a big help in boosting market position of Australian exporters but other things also very
important (eg lifting Victorian dairy output, good record on phytosanitary for horticulture exports from Sunraysia)
• Almost all resource exports will end up having duty free access but the tariff reductions on coal just ending new
restrictions recently introduced
• Improved access for Australian services providers could end up delivering sizeable benefits eventually, although
current trade flows are relatively small
• The FTA aims to lift inward investment by cutting red tape but key controls remain covering SOEs as well as
ongoing national interest tests, special controls for sensitive sectors and the close screening of farm land and
agri-business investment over threshold values

Important information
DISCLAIMER: “[While care has been taken in preparing this material,] National Australia Bank Limited (ABN 12 004 044 937) does not warrant or represent that the information, recommendations, opinions or conclusions contained in this document (“Information”) are accurate, reliable, complete or current. The Information has been prepared for dissemination to professional investors for information purposes only and any statements as to past performance do not represent future performance. The Information does not purport to contain all matters relevant to any particular investment or financial instrument and all statements as to future matters are not guaranteed to be accurate. In all cases, anyone proposing to rely on or use the Information should independently verify and check the accuracy, completeness, reliability and suitability of the Information and should obtain independent and specific advice from appropriate professionals or experts.To the extent permissible by law, the National shall not be liable for any errors, omissions, defects or misrepresentations in the Information or for any loss or damage suffered by persons who use or rely on such Information (including by reasons of negligence, negligent misstatement or otherwise). If any law prohibits the exclusion of such liability, the National limits its liability to the re-supply of the Information, provided that such limitation is permitted by law and is fair and reasonable. The National, its affiliates and employees may hold a position or act as a price maker in the financial instruments of any issuer discussed within this document or act as an underwriter, placement agent, adviser or lender to such issuer.”

24
Group EconomicsAlan OsterGroup Chief Economist+61 3 8634 2927
Jacqui BrandPersonal Assistant+61 3 8634 2181
Australian Economics and CommoditiesRob BrookerHead of Australian Economics+61 3 8634 1663
James GlennSenior Economist – Australia +(61 3) 9208 8129
Phin ZiebellEconomist – Agribusiness+(61 3) 8634 0198
Karla BulauanEconomist – Australia+(61 3) 86414028
Industry AnalysisDean PearsonHead of Industry Analysis+(61 3) 8634 2331
Robert De IureSenior Economist – Industry Analysis+(61 3) 8634 4611
Brien McDonaldSenior Economist – Industry Analysis+(61 3) 8634 3837
Amy LiEconomist – Industry Analysis+(61 3) 8634 1563
International EconomicsTom TaylorHead of Economics, International+61 3 8634 1883
Tony KellySenior Economist – International+(61 3) 9208 5049
Gerard BurgSenior Economist – Asia+(61 3) 8634 2788
John SharmaEconomist – Sovereign Risk+(61 3) 8634 4514
Global Markets Research Peter JollyGlobal Head of Research+61 2 9237 1406
AustraliaEconomicsDavid de GarisSenior Economist+61 3 8641 3045
FX StrategyRay AttrillGlobal Co-Head of FX Strategy+61 2 9237 1848
Emma LawsonSenior Currency Strategist+61 2 9237 8154
Interest Rate StrategySkye MastersHead of Interest Rate Strategy+61 2 9295 1196
Rodrigo CatrilInterest Rate Strategist+61 2 9293 7109
Credit ResearchMichael BushHead of Credit Research+61 3 8641 0575
Simon FletcherSenior Credit Analyst – FI +61 29237 1076
DistributionBarbara LeongResearch Production Manager+61 2 9237 8151
New ZealandStephen ToplisHead of Research, NZ+64 4 474 6905
Craig Ebert Senior Economist+64 4 474 6799
Doug Steel Markets Economist+64 4 474 6923
Kymberly Martin Senior Market Strategist+64 4 924 7654
Raiko ShareefCurrency Strategist+64 4 924 7652
Yvonne LiewPublications & Web Administrator+64 4 474 9771
AsiaChristy TanHead of Markets Strategy/Research, Asia, + 852 2822 5350
UK/EuropeNick Parsons Head of Research, UK/Europe, and Global Co-Head of FX Strategy+ 44207710 2993
Gavin FriendSenior Markets Strategist+44 207 710 2155
Derek AllassaniResearch Production Manager+44 207 710 1532
Important NoticeThis document has been prepared by National Australia Bank Limited ABN 12 004 044 937 AFSL 230686 ("NAB"). Any advice contained in this document has been prepared without taking into account your objectives, financial situation or needs. Before acting on any advice in this document, NAB recommends that you consider whether the advice is appropriate for your circumstances. NAB recommends that you obtain and consider the relevant Product Disclosure Statement or other disclosure document, before making any decision about a product including whether to acquire or to continue to hold it. Please click here to view our disclaimer and terms of use.


