Contents Spot Market Price Changes China Posts Positive Economic Growth in 1H 2011 News 2 Copper 2 Aluminum 7 Zinc 9 Lead 12 Nickel 14 Appendix 18 Terms of Use 24 CHINA BASE METAL BRIEFING Jul 18, 2011 Figures Data Source: SMM, China Customs, CNIA, NBS Contact us: Tel: +86 (21) 5155-0306 Mail: [email protected]Fax: +86 (21) 5282-6090/91*8307 Website: http://en.smm.cn RMB/mt USD/mt % WoW % MoM USD/mt % WoW % MoM RMB/mt % WoW % MoM Copper 71,606 11,073 1.4% 4.6% 9,649 0.9% 7.9% -20 71,640 0.8% 5.8% Aluminum 17,640 2,728 0.5% 2.5% 2,510 -2.0% -3.0% -31 17,490 0.5% 2.5% Alumina (Non-Chalco) 2,660 411 0.0% 1.7% NA NA NA NA NA NA NA Zinc 17,925 2,772 1.1% 4.1% 2,372 -0.7% 4.6% -29 18,150 1.2% 4.4% Lead 17,025 2,633 2.1% 5.3% 2,680 -0.1% 4.5% -12 NA NA NA Nickel 173,700 26,862 2.8% 2.2% 24,050 3.0% 8.4% -33 NA NA NA Exchange rate, USD : RMB=1 : 6.4665 Notes: 1. Domestic spot price is aggregated price of major China markets. 2. LME and SHFE prices are 3-month future prices. 3. Premium = Spread of cash month to 3-month Price Updates of Major Spot and Future Markets China Spot Price_Jul 15 LME_Jul 15 Premium SHFE_Jul 15 Data Source: SMM, LME, SHFE Note: All prices include 17% VAT and are per tonne, unless otherwise stated. Highlights: China’s National Bureau of Statistics announced on July 13th that GDP for 2Q slowed to 9.5% YoY, down from 9.7% in 1Q, but still higher than market expectations of 9.3%. China’s GDP growth for 1H 2011 was 9.6%, and is a reflection of strong positive growth in the economy, as well as growth in investments. SMM expects China’s economic growth to edge lower during 3Q and 4Q, but still be subject to tightening monetary policies and structural adjustments. ● Copper: According to the NBS, China’s output of refined copper was 477,000 mt in June, a new record high. SMM expects China’s refined copper output to fall to between 450,000-470,000 mt in July. (Page 2) ● Aluminum: Weakening demand during the present seasonal low demand period is adding pressure to spot aluminum inventories, and SMM predicts inventories will gradually stabilize or even rise in the medium-to-long term. (Page 7) ● Zinc: 338.3 kt/yr of outdated zinc smelting capacity will be eliminated during 2011. (Page 9) ● Lead: LME lead prices rebounded to USD 2,700/mt and domestic spot prices rose from RMB 16,720/mt to RMB 17,100/mt. (Page 12) ● Nickel: Traded prices for NPI advanced from a week earlier. Transactions for nickel ore may increase in the coming week. (Page 14) Read more about these articles inside... kt May/11 Apr/11 MoM 2011 Annulized Copper Production Copper Concentrate 110.0 109.0 0.9% 1,217 Refined Copper 439.0 454.0 -3.3% 5,179 Imports Copper Concentrate 465.6 465.8 0.0% 5,644 Refined Copper 149.2 160.2 -6.9% 2,173 Scrap Copper 398.7 378.5 5.4% 4,260 Exports Refined Copper 20.2 44.6 -54.8% 345 Aluminum Production Alumina 3,009.7 2,985.2 0.8% 34,236 Aluminum 1,541.3 1,451.5 6.2% 16,790 Imports Bauxite 4,501.9 4,138.2 8.8% 41,786 Alumina 113.5 130.6 -13.1% 2,267 Aluminum 18.1 12.8 42.1% 253 Scrap Aluminum 224.9 233.1 -3.5% 2,442 Exports Aluminum 17.6 3.7 377.1% 70.0 Aluminum Semi-Finished 340.0 260.0 30.8% 2,952.0 Zinc Production Zinc Concentrate 360.0 322.5 11.6% 3,323.4 Zinc 417.8 427.1 -2.2% 4,968.9 Imports Zinc Concentrate 236.2 225.2 4.9% 2,860.1 Zinc 25.1 29.7 -15.4% 340.7 Exports Zinc 2.7 18.4 -85.2% 71.6 Lead Production Lead Concentrate 209.1 168.6 24.0% 1,805.5 Lead 332.1 389.3 -14.7% 4,265 Imports Lead Concentrate 83.8 134.7 -37.8% 1,371.4 Exports Lead 1.6 0.9 81.6% 9.7 Nickel Production Nickel Ore 7.5 8.6 -13.1% 91.8 Nickel 14.7 13.4 9.5% 158.5 Imports Nickel Ore 4,191.8 2,450.0 71.1% 29,476 Nickel 18.7 17.7 5.8% 205.0 Exports Nickel 5.1 3.5 44.8% 44.0
Transcript
Contents
Spot Market Price Changes
China Posts Positive Economic Growth in 1H 2011
News 2 Copper 2 Aluminum 7 Zinc 9 Lead 12 Nickel 14 Appendix 18 Terms of Use 24
Zinc 17,925 2,772 1.1% 4.1% 2,372 -0.7% 4.6% -29 18,150 1.2% 4.4%Lead 17,025 2,633 2.1% 5.3% 2,680 -0.1% 4.5% -12 NA NA NANickel 173,700 26,862 2.8% 2.2% 24,050 3.0% 8.4% -33 NA NA NA
Exchange rate, USD : RMB=1 : 6.4665
Notes:1. Domestic spot price is aggregated price of major China markets.2. LME and SHFE prices are 3-month future prices.3. Premium = Spread of cash month to 3-month
Price Updates of Major Spot and Future MarketsChina Spot Price_Jul 15 LME_Jul 15
PremiumSHFE_Jul 15
Data Source: SMM, LME, SHFENote: All prices include 17% VAT and are per tonne, unless otherwise stated.
Highlights: China’s National Bureau of Statistics announced on July 13th that GDP for 2Q slowed to 9.5% YoY, down from 9.7% in 1Q, but still higher than market expectations of 9.3%. China’s GDP growth for 1H 2011 was 9.6%, and is a reflection of strong positive growth in the economy, as well as growth in investments. SMM expects China’s economic growth to edge lower during 3Q and 4Q, but still be subject to tightening monetary policies and structural adjustments. ● Copper: According to the NBS, China’s output of refined copper was 477,000
mt in June, a new record high. SMM expects China’s refined copper output to fall to between 450,000-470,000 mt in July. (Page 2)
● Aluminum: Weakening demand during the present seasonal low demand
period is adding pressure to spot aluminum inventories, and SMM predicts inventories will gradually stabilize or even rise in the medium-to-long term. (Page 7)
● Zinc: 338.3 kt/yr of outdated zinc smelting capacity will be eliminated
during 2011. (Page 9) ● Lead: LME lead prices rebounded to USD 2,700/mt and domestic spot prices
rose from RMB 16,720/mt to RMB 17,100/mt. (Page 12) ● Nickel: Traded prices for NPI advanced from a week earlier. Transactions for
nickel ore may increase in the coming week. (Page 14) Read more about these articles inside...
July 18, 2011 China Posts Positive Economic Growth in 1H 2011
According to the Ministry of Industry and Information Technology (MIIT), China has 4.155 million mt in outdated copper, aluminum, lead and zinc ferroalloy capacity which will be eliminated during 2011. This total capacity is located at 287 enterprises, with 338 kt/yr of zinc smelting capacity at 32 enterprises. The zinc smelting capacity to be eliminated this year is located in six provinces. 167.5 kt/yr in capacity will be eliminated at six enterprises in Hunan province, accounting for 50% of the total. 87.8 kt/yr of outdated capacity is from 17 enterprises in Yunnan province, or 26% of the total capacity, while the remaining 8.9%, or 30 kt/yr in capacity, is found in Gansu province. 23 kt/yr and 10 kt/yr of outdated capacity will be phased out in Hebei and Shanxi provinces respectively, while 20 kt/yr of obsolete capacity from one enterprise in Liaoning province will be eliminated.
338 kt/yr Zinc Smelting Capacity to be Eliminated
The task of eliminating outdated lead smelting capacity during 2011 will fall heaviest in Hunan and Henan provinces, which will account for 63.4% of the total. The Ministry of Industry and Information Technology (MIIT) released the list of companies required to eliminate outdated lead smelting capacity in 2011, targeting 38 enterprises in 11 provinces. During 2011, the total capacity to be eliminated is 661 kt, more than twice the 265.8 kt capacity eliminated during 2010. Hunan province will eliminate 245 kt of outdated lead smelting capacity at 18 companies, 1.5 times more than the 98 kt in 2010. The 18 companies are mainly smaller smelters where obsolete sintering equipment and other smelting technologies will be eliminated. Larger smelters are not yet affected by the MIIT plans. Henan province will eliminate 173.9 kt in outdated capacity at four companies. Anyang Mingshan, Jiyuan Jinli, and Jiyuan Wanyang will eliminate 63 kt, 60 kt and 50 kt, respectively, and these three smelters are also planning to upgrade or have already eliminated obsolete sintering technologies. Anyang Mingshan Nonferrous Metal Company replaced its 70kt sintering system with new oxygen bottom blowing and liquid slag direct reduction technologies. Jiyuan Wanyang Smeltery Group also begun to replace outdated sintering technology with rich-oxygen bottom blowing smelting technology, which should come online sometime during 2H 2011. Jiyuan Jinli Smelting Company already commissioned its rich oxygen bottom blowing furnace in late May, and is planning to eliminate existing sintering equipment. Along with eliminating outdated capacity, smelting technology will be upgraded as well. New lead smelting capacity brought online during 2011 has so far exceeded 700 kt, so elimination of outdated technology will have a limited impact on China’s total lead smelting capacity.
2011 Outdated Lead Capacity Concentrated in Hunan and Henan Provinces
Survey A recent SMM survey of 20 major domestic copper plate, sheet, strip and foil producers (total capacity: 957 kt/yr) revealed the following insights:
July 18, 2011 China Posts Positive Economic Growth in 1H 2011
1) Operating Rates in June Continue to Fall
The average operating rate at the 20 major domestic copper plate, sheet, strip and foil producers was 61.8% in June, down slightly 2% from May and down 1.5% from the same period last year. Most producers in the survey told SMM that production in June was down from May, but declines in operating rates were less than expected. The slight declines in operating rates were due largely to narrow copper price fluctuations during June, which helped guarantee orders for copper plate, sheet, strip and foil producers. Although operating rates at copper foil producers were better than copper plate, sheet and strip producers, some copper foil producers reported consumption of copper foils was down in June. In addition, both surveyed producers and downstream consumers were facing tight cash flows during June, which is the end of 2Q, also negatively impacting orders and operating rates. On-going electricity restrictions and high temperatures also affected production during June at the surveyed producers. Since orders from downstream producers were lower due to significant increases in copper prices during July, SMM believes operating rates at copper plate, sheet, strip and foil producers will continue to fall during July.
2) Raw Material Inventories Up Slightly
Raw material inventories at the 20 surveyed producers were 22.9% of production, up slightly by 2.1% from May’s 20.8%, and mainly the result of significant stock replenishment by producers before copper prices rebounded in late June. Most of the surveyed producers told SMM that they are keeping copper inventories low in order to cut raw material costs, with some reporting they are unable to increase inventory levels due to cash flow problems.
3) Copper Price Forecast
No Opinion,20%
Down, 10%
Fluctuate25%
Up, 45%
Data Source: SMM
4) Sales Forecast
No Opinion,10%
Stable, 25%
Decrease, 65%
Data Source: SMM
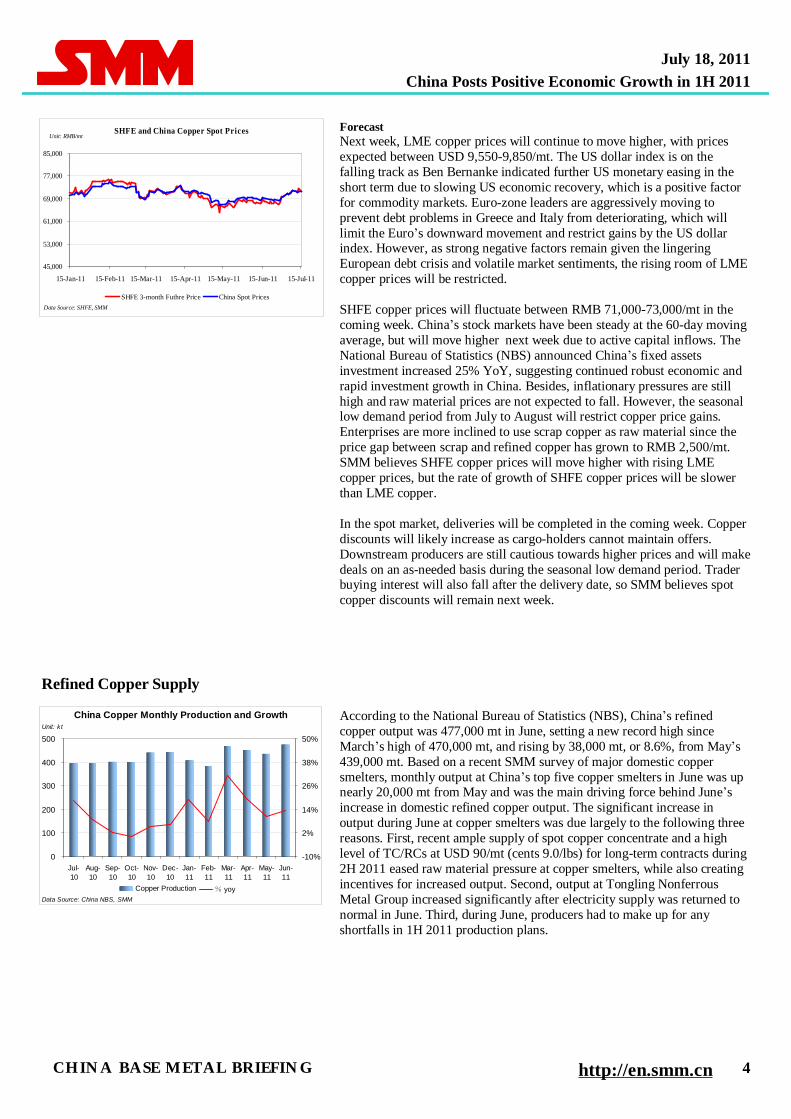
Review Last week, LME copper prices moved higher. Early in the week, Moody’s downgraded Ireland’s credit rating to junk status, while debt woes in Greece and Italy sent the Euro down and helped the US dollar index break above 76, dampening upward momentum of LME copper prices. Later, LME copper prices gained buying support around USD 9,500/mt and the US dollar index fell sharply when the US Federal Reserve chairman implied on Wednesday that the US would continue loose monetary policies. Coupled with positive economic data from China, LME copper prices climbed up to a high level of USD 9,750/mt for the week. LME copper prices found support at the 5-day moving average, but experienced sell-offs at USD 9,800/mt. China’s Shanghai Composite Index returned above 2,800 points, lifted by positive domestic economic results announced on Wednesday. SHFE copper prices moved higher, reaching a weekly high of RMB 72,460/mt. SHFE copper prices will continue to move higher, while consolidating at RMB 71,000/mt.
Forecast Next week, LME copper prices will continue to move higher, with prices expected between USD 9,550-9,850/mt. The US dollar index is on the falling track as Ben Bernanke indicated further US monetary easing in the short term due to slowing US economic recovery, which is a positive factor for commodity markets. Euro-zone leaders are aggressively moving to prevent debt problems in Greece and Italy from deteriorating, which will limit the Euro’s downward movement and restrict gains by the US dollar index. However, as strong negative factors remain given the lingering European debt crisis and volatile market sentiments, the rising room of LME copper prices will be restricted. SHFE copper prices will fluctuate between RMB 71,000-73,000/mt in the coming week. China’s stock markets have been steady at the 60-day moving average, but will move higher next week due to active capital inflows. The National Bureau of Statistics (NBS) announced China’s fixed assets investment increased 25% YoY, suggesting continued robust economic and rapid investment growth in China. Besides, inflationary pressures are still high and raw material prices are not expected to fall. However, the seasonal low demand period from July to August will restrict copper price gains. Enterprises are more inclined to use scrap copper as raw material since the price gap between scrap and refined copper has grown to RMB 2,500/mt. SMM believes SHFE copper prices will move higher with rising LME copper prices, but the rate of growth of SHFE copper prices will be slower than LME copper. In the spot market, deliveries will be completed in the coming week. Copper discounts will likely increase as cargo-holders cannot maintain offers. Downstream producers are still cautious towards higher prices and will make deals on an as-needed basis during the seasonal low demand period. Trader buying interest will also fall after the delivery date, so SMM believes spot copper discounts will remain next week.
Refined Copper Supply
China Copper Monthly Production and Growth
0
100
200
300
400
500
Jul-10
Aug-10
Sep-10
Oct-10
Nov-10
Dec-10
Jan-11
Feb-11
Mar-11
Apr-11
May-11
Jun-11
-10%
2%
14%
26%
38%
50%
Copper Production % yoyData Source: China NBS, SMM
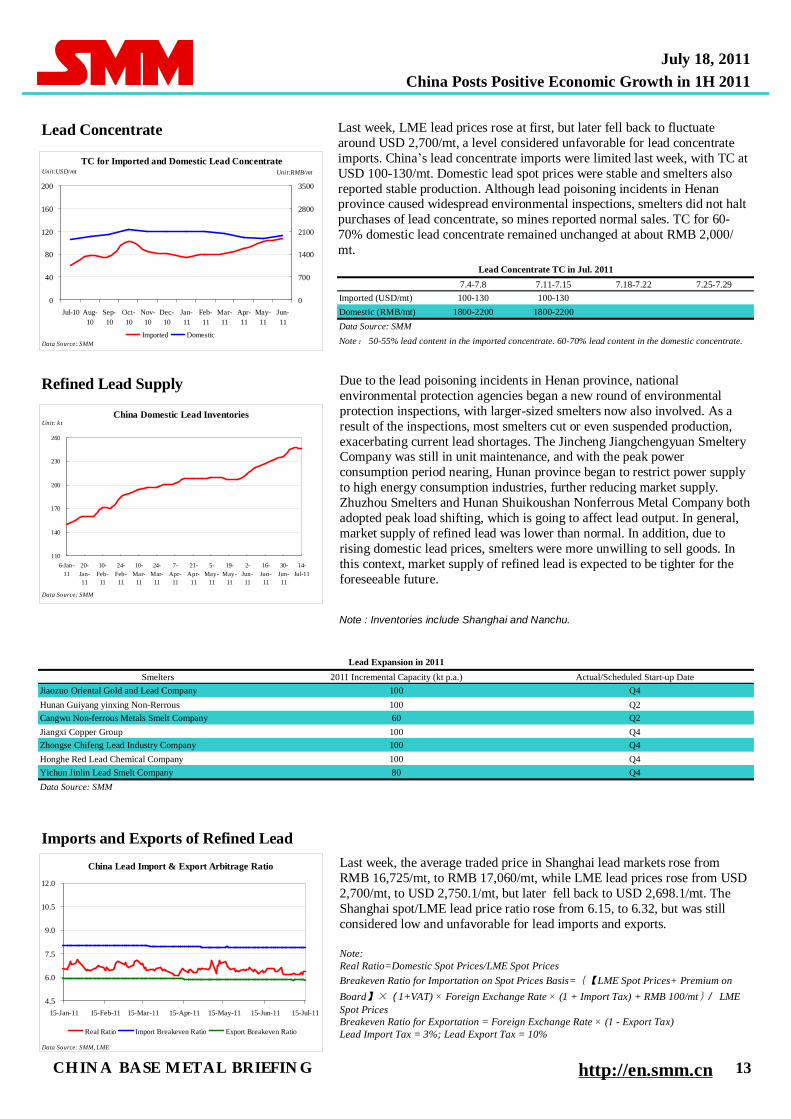
Unit: ktAccording to the National Bureau of Statistics (NBS), China’s refined copper output was 477,000 mt in June, setting a new record high since March’s high of 470,000 mt, and rising by 38,000 mt, or 8.6%, from May’s 439,000 mt. Based on a recent SMM survey of major domestic copper smelters, monthly output at China’s top five copper smelters in June was up nearly 20,000 mt from May and was the main driving force behind June’s increase in domestic refined copper output. The significant increase in output during June at copper smelters was due largely to the following three reasons. First, recent ample supply of spot copper concentrate and a high level of TC/RCs at USD 90/mt (cents 9.0/lbs) for long-term contracts during 2H 2011 eased raw material pressure at copper smelters, while also creating incentives for increased output. Second, output at Tongling Nonferrous Metal Group increased significantly after electricity supply was returned to normal in June. Third, during June, producers had to make up for any shortfalls in 1H 2011 production plans.
However, since the start of July, despite ample raw material supply, SMM believes refined copper output will likely be lower due to electricity shortages, with output in July expected between 450,000-470,000 mt.
July 18, 2011 China Posts Positive Economic Growth in 1H 2011
Refined Copper Imports Last week, spot discounts failed to narrow significantly, remaining generally between negative RMB 150-50/mt. With the arrival of the delivery date, cargo-holders were unwilling to move goods due to large spot discounts, choosing instead to maintain firm offers, which reduced market supply.
Margin Real Ratio for Importation Breakeven Ratio for Importation
Data Source: SMM, LME
Note: Breakeven Ratio for Importation on Spot Prices Basis={【LME Spot Prices+ Premium on Board】× (1+VAT) ×Foreign Exchange Rate× (1+Import Tax) +RMB 100/mt}/ LME Spot Prices Real Ratio for Importation = China Domestic Spot Prices/ LME Spot Prices Copper Import Tax = 0%, Premium on Board refers to the Chile-origin cargoes. If Real Ratio>Breakeven Ratio, imports are profitable.
Scrap Copper Last week, mainstream prices of scrap copper were between RMB 61,500-62,600/mt. Overall trading sentiment was moderate, but cargo-holders were generally unwilling to move goods. Last week, low-oxygen copper rod producers reported stable sales, resulting in active raw material purchases. However, high copper prices over several days triggered market concerns over possible price corrections, keeping buyers cautious. Cargo-holders kept offers firm due to an optimistic outlook and those with low stocks were unwilling to move goods at current prices. Supply of scrap red copper in south China improved with the arrival of imports during May. In addition, rising copper prices encouraged recyclers in northeast and midwest China to move goods, but supply of brass in north China was still tight. Recently, the price gap of scrap copper in different regions narrowed. In the past, scrap copper prices in Jiangsu province were generally RMB 500-600/mt lower than prices in north China, but prices on Thursday in Jiangsu province for domestic scrap copper were RMB 62,000/mt, slightly higher than prices in north China. In other news, prices for imported goods remained firm, reducing trader interest in imports. According to SMM sources, foreign suppliers showed strong interest in moving goods given the ample supply of high-grade scrap copper.
China Scrap Copper Monthly Imports andGrowth
0
100
200
300
400
500
600
Jul-10
Aug-10
Sep-10
Oct-10
Nov-10
Dec-10
Jan-11
Feb-11
Mar-11
Apr-11
May-11
Jun-11
-50%
-25%
0%
25%
50%
75%
100%
Scrap Copper Imports YoYData Source: China NBS, SMM
Unit: kt
According to China Customs, China’s imports of scrap copper were 420,000 mt in June, up 5.33% YoY and 18.92% MoM, a new record high for 1H 2011. Although scrap copper imports continued to rise in June, supply in spot scrap copper markets remained tight. Based on an SMM survey, increases in imports of scrap copper were largely due to increases in low-quality scrap copper from dismantled motors. Since the start of 2011, importers reduced imports of high-quality scrap copper due to tight market supply, and poor profits, but increased imports of low-quality scrap copper, including scrap motors and scrap wires and cables. In addition, some importers increased imports of scrap copper during April and May, when copper prices experienced significant declines, resulting in increased imports of scrap copper during May and June. Also from the SMM survey, imports volumes of high-quality copper and brass were reported to be stable, on top of higher imports of low-quality scrap copper. In scrap red copper markets, copper smelters and downstream copper rod processors made direct purchases in overseas markets due to tight domestic supply of high-quality scrap copper, which contributed to stable import volumes. Prices for brass scrap were relatively stable, but market sentiment was mixed. Some buyers cut purchases believing prices were high, while others chose to build stocks believing prices would rise.
July 18, 2011 China Posts Positive Economic Growth in 1H 2011
Downstream Demand
Last week, traded spot copper prices rose nearly RMB 1,000/mt on a weekly basis. High prices kept downstream producers away from the market, while traders were active. In general, market supply exceeded demand. According to the NBS, China’s output of copper semis during June also hit an all-time high of 1,054,000 mt, up 75,000 mt from May’s 979,000 mt. The surprisingly increase in output was due mainly to copper price declines during June, which provided end-users a good opportunity to place orders and make up for orders held-back in May when prices were high. Since early July, copper prices have been rising and spot copper prices in domestic markets have returned above RMB 71,000/mt. Coupled with the growing impact from the seasonal low demand period, SMM believes copper semis output in July will experience sharp declines, falling below 1,000,000 mt. Based on preliminary data from China Customs, China’s total imports of unwrought copper and copper semis were 280,000 mt in June, up 25,300 mt from May’s 254,700 mt and an increase of 9.92% YoY. Market players were surprised by the drop in copper imports in May, since improvements in the SHFE/LME copper price ratio and low inventories at bonded warehouses would normally cause imports to rise. The rebound in June’s imports indicates a recovery in the import market, as previously predicted by SMM. Based on SMM sources among copper importers, copper imports will increase in July due to a surge in arrivals during late June and early July. However, due to labor strikes at mines in Chile, as well as the seasonal low demand period, SMM believes copper import growth in July will not exceed June, with imports expected near 300,000 mt.
Note: 1. Price spread (A-B) for copper rod producers. Price spread (A-C) for other scrap copper smelters. 2. If price spread between refined and scrap copper is less than the SMM Reasonable Price Spread, buyers will prefer to purchase refined copper.
Price Spread Between Refined & Scrap Copper (RMB/mt)
DatePrice Spread (A-B) Price Spread (A-C)
Review The European debt crisis spread to Portugal and Italy, while the US debt ceiling crisis is still unresolved. As a result, the US dollar index trimmed earlier gains, with resistance still reported at 75. LME aluminum prices slipped at first, but moved higher later last week, with prices climbing steadily after first falling below USD 2,500/mt. Negative economic conditions, however, continued to dampen upward momentum in LME aluminum prices, with LME prices failing to reverse early week losses due to strong resistance at USD 2,530/mt. Last week, SHFE 1109 aluminum contract prices frequently tested RMB 17,400/mt, but failed to break through due to strong short selling. Daily trading volumes were only about 20,000 lots and SHFE 1109 aluminum contract prices continued to fluctuate between RMB 17,200-17,400/mt. Spot aluminum prices in Shanghai rebounded after falling slightly early last week, and although spot prices failed to return above RMB 17,600/mt, strong support was still found at RMB 17,500/mt. Spot aluminum transactions were limited.
Aluminum — Declines in Spot Aluminum Inventories Slow
July 18, 2011 China Posts Positive Economic Growth in 1H 2011
Forecast Three major US credit rating agencies which frequently adjusted credit ratings for Euro-zone members have recently shifted focuses to US debt. Moody's and Standard and Poor's have already placed US 'AAA' long-term and 'A-1+' short-term sovereign credit ratings under review since no resolution in raising the government's debt ceiling has been reached. The Federal Reserve chairman hinted at the possibility of a third round of quantitative easing (QE3), but also said the Federal Reserve will not consider buying more government bonds temporarily. Uncertainties over the US economy will push down the US dollar index to 76, despite the spreading of Euro-zone debt crisis. SMM predicts LME aluminum prices will continue to struggle at USD 2,500/mt in the coming week, with prices expected to move between USD 2,450-2,550/mt. SHFE 1109 aluminum contracts will remain the most actively traded contracts in the coming week, even after the delivery date of SHFE current-month aluminum contracts. Although declines in spot aluminum inventories slowed, lower inventories will still allow SHFE aluminum prices to remain steady at RMB 17,200/mt, with SHFE prices expected between RMB 17,200-17,500/mt. The unwillingness of cargo-holder to sell goods in spot aluminum markets helped boost market confidence for prices at RMB 17,400/mt. Downstream processors purchased goods on an as-needed basis, while middlemen made few purchases, keeping overall market sentiment muted. SMM predicts premiums for spot aluminum will move between negative RMB 50/mt and positive RMB 50/mt over SHFE current-month aluminum contract prices in the coming week.
Last week, mainstream traded prices for non-CHALCO alumina remained stable between RMB 2,620-2,700/mt. The latest data released by China’s National Bureau of Statistics shows China’s alumina output was 17.49 million mt during 1H 2011, up 17.8% YoY. Customs data reveals China’s imports of alumina were 1.02 million mt during 1H 2011, down 56.7% YoY, and is a sign that China’s self-sufficiency rate for alumina has increased continuously and will help support development of China’s domestic alumina markets.
Last Thursday, stocks of aluminum ingot were 202 kt in Shanghai, 81 kt in Wuxi, and 74 kt in Nanhai. Stocks of aluminum ingot in Hangzhou were 34 kt, bringing total domestic inventories of aluminum ingot (including Shanghai, Wuxi, Hangzhou, and Nanhai) to 391 kt, down 19 kt from a week earlier. Inventories in Nanhai declined significantly due to strong demand, with high premiums for spot aluminum over aluminum prices offered by Nanchu Depository Management Company. Inventories in east and central China fell slower due to weak demand, and downstream inventories of semi-finished products also grew. SMM believes spot aluminum inventories will gradually stabilize or even rise in the medium-to-long term.
Domestic alumina spot prices were stable last week. Prebaked anode producers were using July ex-works prices in quoting new orders, and prebaked anode prices remained stable last week. Prices for dry-processed aluminum fluoride slipped to RMB 9,650-10,000/mt, and profit margins of dry-processed aluminum fluoride were lower due to rising prices for fluorite and sulfuric acid. SMM believes fluoride salt prices will move higher for the foreseeable future. Aluminum prices rebounded on Friday after falling slightly early last week, and coupled with stable raw material costs, profit margins at aluminum producers were up slightly.
Aluminum Costs
Zinc — LME, SHFE Zinc Prices Fall Slightly, Discounts Expand
Review Last week, the US economic recovery dominated the market. The number of US non-farm jobs rose by only 18,000 in June, the smallest increase since September 2010 and much lower than forecasts. In this context, the US dollar index rose over three consecutive days to hit 76.7 on Tuesday, pushing down LME zinc prices to USD 2,302/mt, although prices later rallied. The US dollar index fell to 75 on speculation that QE3 monetary policies may be implemented by the US Federal Reserve if the US economy remains sluggish. In this context, LME zinc prices rallied slightly, but still struggled at USD 2,400/mt. SHFE 1109 zinc contract prices tracked LME zinc prices, falling below the 10-day moving average to RMB 17,800/mt, but later rallying to RMB 18,000/mt. Spot transactions were mainly made among traders, with traded prices between RMB 17,600-18,000/mt. Spot discounts expanded to negative RMB 350-400/mt as SHFE zinc prices rose. Spot discounts against spot-month zinc contract prices also grew as the delivery date neared, presenting an opportunity for traders buying spot zinc and selling SHFE zinc contracts.
Forecast Next week, economic recovery in Europe and the US will be the market focus. A number of Euro-zone countries have had their credit ratings downgraded, and there is no official word on whether or not the US will continue QE3. In this context, the US dollar index should fluctuate between 75 and 76, and LME zinc prices should break through USD 2,400/mt. SHFE 1110 zinc contracts will become the most actively traded. LME zinc prices should rise to RMB 18,500/mt, with spot discounts expanding to negative RMB 400-600/mt.
July 18, 2011 China Posts Positive Economic Growth in 1H 2011
TC for Zinc Concentrate
4,000
5,000
6,000
7,000
8,000
9,000
Jul-10 Aug-10
Sep-10
Oct-10
Nov-10
Dec-10
Jan-11
Feb-11
Mar-11
Apr-11
May-11
Jun-11
50
100
150
200
250
300
TC for Domestic Concentrate (LHS) TC for Imported Concentrate (RHS)
Unit: k t
Data Source: SMM
Last week, TC for zinc concentrate (48-53%) was between RMB 4,600-5,800/mt, with mainstream traded prices around RMB 5,200/mt. TC for imported zinc concentrate was between USD 90-100/mt. Domestic TC remained relatively unchanged, with mainstream traded prices of zinc concentrate (50%) still around RMB 5,200/mt. In general, domestic mining operators reported normal production during 1H 2011. Domestic zinc concentrate output has been rising YoY since March due to new capacity coming online, however, output from existing capacity was lower than expected due to the cold weather and the Chinese New Year holiday. In addition, raw material shortages have significantly restricted output at domestic smelters, causing TC for both domestic and oversea zinc concentrate to fall. Raw material shortages at domestic zinc smelters is a result of deteriorating ore grades, fluctuating zinc prices, safety inspections, expanding zinc smelting capacity, and falling ore imports. Imported TC continues to fall due to the possibility of ore shortages, fluctuating between USD 90-100/mt.
Note: 50-55% zinc content in both the imported and the domestic concentrate.
Zinc Concentrate TC in Jul. 2011
Last week, domestic spot inventories continued to grow. Inventories in east China grew 2,000mt, to 451.4 kt, and inventories in south China grew 3,000 mt, to 152 kt. Inventories in north China were unchanged. These changes were a result of traders aggressively buying spot goods and selling SHFE zinc contracts due to expanding spot discounts against SHFE spot-month zinc contract prices as the delivery date neared. LME inventories grew by 22,925 mt, to a high 893,975 mt, during the week ending Thursday, and with goods mainly from the US city of New Orleans. Spot discounts against LME three-month zinc contract prices also moved to negative USD 30/mt, up from negative USD 25/mt the previous week.
China Zinc Domestic Stocks
250
340
430
520
610
700
22-Jan-11
11-Feb-11
25-Feb-11
11-Mar-
11
25-Mar-
11
8-Apr-11
22-Apr-11
6-May-
11
20-May-
11
3-Jun-11
17-Jun-11
1-Jul-11
15-Jul-11
Unit: k t
Data Source: SMM
Refined Zinc Supply
Region Company Names Brand (2011-7-8) (2011-7-15) Up/DownNortheast Huludao Zinc Industry HX 18850 19200 350
South China Shaoguan Smleter NH-SHG —— —— ——Cetral China Zhuzhou Smelter TORCH SHG 19900 19850 -50Northwest Baiyin Non-ferrous IBIS 18450 18650 200
Major Zinc Smelters Ex-plant Quotation for #0 Zinc (RMB/mt)
Data Source: SMM
Region 2011/7/8 2011/7/15 Up/Down Inventory (kt)Shanghai Around 17850 17900-17950 75 451.4Nanchu 17800-17850 17850-17950 75 152Tianjin 17850-18750 17900-19100 200 8
July 18, 2011 China Posts Positive Economic Growth in 1H 2011
Smelters Capacity(kt p.a.) Start Date Remark
Liaoning Huludao Zinc 390 2011.5 Operating rate of 65%
Hanzhong Zinc 360 2010.11 Operating rate of 60%Shenzhen Zhongjin Lingnan Nonfemet Co., Ltd. 310 2010.9 Operating rate of 33%Shannxi Dongling 210 2011.3 Operating rate of 70%Hechi Nanfang Non-ferrous Metal Smelt Co., Ltd. 200 2011.3 Operating rate of 85%Sichuan Hongda 200 2011.5 Operating rate of 50%Bayan Zhuoer Zijin 200 2010.11 Operating rate of 50%Gansu Baiyin 190 2011.3 Operating rate of 90%Shanxi Shangluo 180 2010.9 Operating rate of 100%Xiangyun Feilong Industry Co., Ltd. 180 2011.3 Operating rate of 40%Yunnan Chihong 180 2011.5 Operating rate of 60%Yunnan Luoping Xindian Group 120 2011.4 Operating rate of 40%Yunxi Group Zinc Co., Ltd. 20 2011.4 Operating rate of 50%Yinli Import and Export Co., Ltd. 100 2010.5 Operating rate of 10%Inner Mongolia Xing'an 10 2011.5 Operating rate of 40%Yuntong Zinc Industry Co., Ltd. 100 2011.4 Operating rate of 80%Jinshan Indium-Germanium Industry Co., Ltd 60 2011.1 Operating rate of 80%Xichang Zinc 60 2010.1 Operating rate of 70%Gansu Chengzhou Zinc Smelter 50 2011.3 Operating rate of 50%Shaanxi Xingwang Zinc Industry Co., Ltd. 50 2010.5 Operating rate of 70%Hunan Taifeng Group 50 2011.6 Operating rate of 50%Liuzhou China Tin Group 50 2010.8 Operating rate of 40%Hunan King Stone Minerals Group 50 2010.6 Operating rate of 70%Guangxi Tanghan Zinc and Indium Co., Ltd. 20 2010.1 Operating rate of 70%Data Source: SMM
Maintenance or Shutdown at Major Domestic Zinc Smelters
Smelters Incremental Capacity (kt p.a.) Total Capacity (kt p.a.) Actual/Scheduled Start-up Date
Anhui Tongguan 100 100 2010 postponedGansu Baiyin 150 340 2010 postponedChifeng Hongye 100 210 Jun, 2011Yunnan Jinding 100 240 go into operation in 2011Gansu Chengzhou 50 100 Jun, 2011Xichang Heli Zinc 40 100 2010 postponedShaanxi Hanzhong Zinc 100 460 go into operation in 2011Yunnan Mengzi 50 100 go into operation in 2011Liuzhou Huaxi 50 100 go into operation in 2011Hunan Xuanhua Zinc Industry Co., Ltd. 50 80 go into operation in 2011Gansu Baohui 100 160 2010 postponedGuizhou Xianjin Zinc 30 110 2010 postponedJinshan Indium-Germanium Industry 100 160 go into operation in 2011Jiangxi Copper 100 100 go into operation in 2011Yunnan Chihong 100 180 go into operation in 2011Total 1220Data Source: SMM
New Capacity in 2011
Imports and Exports of Refined Zinc
Last week, the SHFE/LME zinc price ratio was stable between 7.5 and 7.7, with import premiums between USD 80-90/mt. Traders were actively buying spot goods given expanding discounts, but only registered brands, keeping transactions for imported zinc quiet.
July 18, 2011 China Posts Positive Economic Growth in 1H 2011
Zinc Oxide
Last week, traded prices of zinc oxide (99.7%) were between RMB 17,500-17,900/mt. Zinc oxide enterprises have also been affected by recent power restrictions, and according to SMM’s sources, power supply was restricted in Wenzhou, Zhejiang province, from 8 am to 6 pm, but was not restricted during evening hours.
Lead — LME Lead Prices Slow Growth, Domestic Prices Rise to RMB 16,700/mt
Review Last week, LME lead prices fell at first to a low of USD 2,632.5/mt, but later found strong support at daily moving averages. In mid-week trading, China’s better-than-expected economic data and the possibility of QE3 monetary policies in the US pushed LME lead prices up to USD 2,773/mt, a record high since May. However, LME lead prices lost previous gains over the weekend and fell below the 5 and 10-day moving averages after the US Federal Reserve chairman’s new statement weakened market expectation of QE3. SHFE lead prices fluctuated between RMB 17,050-17,250/mt in early week trading, then rose to RMB 17,700/mt in mid-week, with a daily gain of RMB 510/mt, or 2.97%. Over the weekend, SHFE lead prices erased pervious gains and moved down to RMB 17,550/mt. In China’s domestic lead spot markets, well-known branded lead mainly traded between RMB 16,720-16,800/mt in early week trading. Other brands such as Hongwu, Jinguan, and Shuikoushan brands traded between RMB 16,620-16,700/mt, with spot discounts narrowing from RMB 600/mt two weeks ago, to RMB 350-500/mt. In mid-week trading, production suspensions at smelters in Henan province, as well as gains by SHFE lead, pushed spot prices above RMB 17,000/mt. In response, spot discounts expanded to RMB 500-550/mt. Traders were unwilling to sell goods due to smaller arbitrage profits, while downstream producers refused to purchase at higher prices. In general, transactions last week were only moderate.
Forecast The European debt crisis appears to be spreading to Italy, and after the high June CPI was reported in China, markets expect further monetary policy adjustments. After the US Federal Reserve chairman’s new statement weakened market expectation of QE3, the US dollar index moved up slightly, but was still considered weak and unlikely to move up significantly in the near term. Meanwhile, LME lead prices are showing signs of upward momentum technically, and coupled with steadily falling LME lead stocks, SMM expects LME lead prices will fluctuate between USD 2,650-2,790/mt in the short term, with low-end prices up slightly. SHFE lead prices are expected to fluctuate between RMB 17,000-17,900/mt over the near term. In China’s domestic lead spot markets last week, spot discounts narrowed further to RMB 400-500/mt. Smelters in Henan province have cut output due to environmental protection inspections, and the resulting lower market supply supported spot prices. Traders were largely unwilling to sell goods due to bullish sentiment, and coupled with production cuts in Henan province, lead spot prices rose to RMB 16,800-17,300/mt. Some downstream producers restarted production, but purchased only cautiously at current high prices, keeping transactions muted.
July 18, 2011 China Posts Positive Economic Growth in 1H 2011
Last week, LME lead prices rose at first, but later fell back to fluctuate around USD 2,700/mt, a level considered unfavorable for lead concentrate imports. China’s lead concentrate imports were limited last week, with TC at USD 100-130/mt. Domestic lead spot prices were stable and smelters also reported stable production. Although lead poisoning incidents in Henan province caused widespread environmental inspections, smelters did not halt purchases of lead concentrate, so mines reported normal sales. TC for 60-70% domestic lead concentrate remained unchanged at about RMB 2,000/mt.
Data Source: SMMNote: 50-55% lead content in the imported concentrate. 60-70% lead content in the domestic concentrate.
Refined Lead Supply
Note : Inventories include Shanghai and Nanchu.
Due to the lead poisoning incidents in Henan province, national environmental protection agencies began a new round of environmental protection inspections, with larger-sized smelters now also involved. As a result of the inspections, most smelters cut or even suspended production, exacerbating current lead shortages. The Jincheng Jiangchengyuan Smeltery Company was still in unit maintenance, and with the peak power consumption period nearing, Hunan province began to restrict power supply to high energy consumption industries, further reducing market supply. Zhuzhou Smelters and Hunan Shuikoushan Nonferrous Metal Company both adopted peak load shifting, which is going to affect lead output. In general, market supply of refined lead was lower than normal. In addition, due to rising domestic lead prices, smelters were more unwilling to sell goods. In this context, market supply of refined lead is expected to be tighter for the foreseeable future.
China Domestic Lead Inventories
110
140
170
200
230
260
6-Jan-11
20-Jan-11
10-Feb-
11
24-Feb-11
10-Mar-
11
24-Mar-
11
7-Apr-
11
21-Apr-
11
5-May-
11
19-May-
11
2-Jun-11
16-Jun-11
30-Jun-11
14-Jul-11
Data Source: SMM
Unit: k t
Smelters 2011 Incremental Capacity (kt p.a.) Actual/Scheduled Start-up DateJiaozuo Oriental Gold and Lead Company 100 Q4Hunan Guiyang yinxing Non-Rerrous 100 Q2Cangwu Non-ferrous Metals Smelt Company 60 Q2Jiangxi Copper Group 100 Q4Zhongse Chifeng Lead Industry Company 100 Q4Honghe Red Lead Chemical Company 100 Q4Yichun Jinlin Lead Smelt Company 80 Q4Data Source: SMM
Lead Expansion in 2011
Imports and Exports of Refined Lead China Lead Import & Export Arbitrage Ratio
Real Ratio Import Breakeven Ratio Export Breakeven Ratio
Data Source: SMM, LME
Note: Real Ratio=Domestic Spot Prices/LME Spot Prices Breakeven Ratio for Importation on Spot Prices Basis={【LME Spot Prices+ Premium on Board】× (1+VAT) × Foreign Exchange Rate × (1 + Import Tax) + RMB 100/mt}/ LME Spot Prices Breakeven Ratio for Exportation = Foreign Exchange Rate × (1 - Export Tax) Lead Import Tax = 3%; Lead Export Tax = 10%
Last week, the average traded price in Shanghai lead markets rose from RMB 16,725/mt, to RMB 17,060/mt, while LME lead prices rose from USD 2,700/mt, to USD 2,750.1/mt, but later fell back to USD 2,698.1/mt. The Shanghai spot/LME lead price ratio rose from 6.15, to 6.32, but was still considered low and unfavorable for lead imports and exports.
July 18, 2011 China Posts Positive Economic Growth in 1H 2011
Downstream Demand Last week, most downstream producers purchased slowly due to the high lead prices. Operating rates at downstream producers did not improve significantly even though some battery producers in Zhejiang and Guangdong provinces restarted production. With market supply tight, prices for e-bike batteries were raised by between 10-15% in some regions. Other categories of batteries were also in tight supply, but no significant price changes were reported. According to the China Association of Automobile Manufacturers (CAAM), production and sales of automobiles were up after two months of declines. Production and sales in June were 1.4037 and 1.4359 million units, respectively, up 3.83% and 3.62% MoM and up 0.65% and 1.40% YoY. Production and sales during 1H were 9.1560 and 9.3252 million units, respectively, up 2.48% and 3.35% YoY. The global economic recovery boosted China’s automobile exports, and according to CAAM, exports during 1H 2011 were 381,100 units, up 56.99% YoY, while exports in June exceeded 80,000 units. Since many unfavorable factors still exist, CAAM officials predict growth in production and sales should be around 5% for 2011.
Nickel — LME Nickel Prices Advance to USD 24,000/mt, Jinchuan Group Raises Prices to RMB 174,000/mt
Review Last week, LME nickel prices initially fell, but later rallied. Last Friday’s disappointing US non-farm employment data, as well as fears of a growing European debt crisis sent base metal prices down sharply, with LME nickel prices recording an intraday decline of 2.9%. Later, the US Federal Reserve hinted at a possible QE3, weighing down the US dollar to 75 and boosting base metal prices, with LME nickel prices rebounding above USD 24,000/mt. Marco economic reports were mixed last week, with China reporting better-than-expected GDP for 1H 2011,with news of credit rating downgrades for Greece and Ireland and Ben Bernanke’s deny of QE3. In this context, base metal prices, including LME nickel to fluctuate even wider. As of last Thursday, LME nickel prices closed at USD 24,075/mt, up USD 160/mt from a week earlier. LME nickel inventories were 103,644 mt, down 1,038 mt, while Asian and European inventories were down 36 mt and 1,002 mt respectively. Cancelled warrants were down by 2,940 mt. With support from Jinchuan Group's increase in nickel prices to RMB 172,000/mt on July 8th, Shanghai nickel spot prices were stable around RMB 172,000/mt last week. The average weekly price of SMM #1 nickel was RMB 172,450/mt, up RMB 3,560/mt. As a result of last Monday’s significant decline in LME nickel prices, spot nickel prices fell sharply on Tuesday, depressing trading sentiment, which resulted in cautious and quiet transactions. Later, LME nickel prices rebounded to above USD 24,000/mt as the US dollar moved lower, which also pushed up spot nickel prices to between RMB 173,500-175,000/mt on Thursday. As LME nickel prices advanced, Jinchuan Group raised ex-works nickel prices to RMB 174,000/mt last Friday. LME nickel prices fluctuated wider given recent mixed economic news, which also dampened cargo-holder confidence. Markets were generally pessimistic, with traders only replenishing stocks while maintaining a wait-and-see attitude.
Forecast LME Nickel Price Forecast At present, investors are mainly focused on the European debt crisis, the US debt limit debate, and the possibility of new QE3 from the US Federal Reserve. At present, the European sovereign debt crisis continues, with markets concerned the crisis may spread to Italy and Spain. Although Italian government bonds were auctioned successfully and the Italian Parliament passed an austerity budget, investors are still concerned policy-makers cannot prevent the spread of the debt crisis. Greece is still experiencing severe economic conditions, so the risk of debt default is still high. Many believe US economic growth is slowing. The US Congress has not reached a consensus on raising the US debt limit, intensifying short sentiment in markets. Although the US Federal Reserve chairman officially denied the launch of QE3, other stimulus policies are still possible. Although some credit rating agencies have put the US’s AAA credit rating on watch and the , possibility for the US to raise debt limit is very high. Technically speaking, LME nickel prices will meet short-term resistance at USD 24,300/mt, but find support at USD 23,800/mt. Due to the lack of clear macro-economic indicators, SMM expects LME nickel prices will continue to move higher, but the range of price fluctuation will widen. LME nickel prices are expected to advance to USD 25,000/mt after breaking through USD 24,300/mt.
Domestic Nickel Price Forecast Jinchuan Group raised ex-works nickel prices to RMB 174,000/mt last Friday, supporting spot nickel prices. Due to bullish sentiment towards LME nickel prices, SMM expects Shanghai spot nickel prices will move in the RMB 174,000-176,000/mt range in the coming week.
LME nickel prices fluctuated higher last week, but since NPI demand from downstream stainless steel mills was soft, NPI producers were purchasing nickel ore with caution, which failed to give a strong signal of support to LME nickel prices. However, traded prices of nickel ore were still stable, with mainstream offers for high grade nickel ore (Ni 1.8-1.9%) between 700-820/wmt, unchanged from a week earlier. Mainstream traded prices for nickel ore (Ni 1.8%) were RMB 720-730/wmt, and nickel ore (Ni 1.9%) was between RMB 820-830/wmt. Mainstream traded prices of high grade nickel ore (Ni 1.9-2.0%) were in the RMB 820-940/wmt, range, unchanged from a week earlier. Traders were reluctant to move goods since supply of nickel ore with grades above 1.8% was limited. NPI producers' acceptance for current nickel ore prices was low given current sluggish NPI prices and despite their strong demand for high grade nickel ore. In this context, transactions for high grade nickel ore were lackluster. According to one domestic trader, costs for nickel ore (Ni 2.2%) were RMB 1,000/mt, so traders are reluctant to sell below this level. Most NPI producers however will not accept this price. Mainstream traded prices for medium grade nickel ore (Ni 1.4-1.6%) were between 350-500/wmt, unchanged from a week earlier, while low grade nickel ore (Ni 0.9-1.1%) was between 300-320/wmt, also unchanged from a week earlier. Mainstream traded prices of nickel ore (Ni 1.7%) were in the RMB 600-620/wmt range.
July 18, 2011 China Posts Positive Economic Growth in 1H 2011
Mixed outlook by market players and the lack of clear LME nickel price trends resulted in quiet trading sentiment. The price spread between long-term contract nickel ore and spot nickel ore has narrowed, and NPI producers are generally purchasing spot nickel ore on an as-needed basis, with purchase volumes between 3,000-5,000 mt. Transactions for nickel ore did not improve significantly in domestic markets, and demand for NPI from stainless steel mills will not likely improve in the short term. However, with existing inventories of high grade nickel ore gradually being consumed, some NPI producers are considering replenishing stocks, lending support for nickel ore prices to an extent. SMM expects that inquires and transactions of nickel ore will begin to increase next week.
Sea freight charges between Indonesia and Tianjin port were USD 20/mt, and USD 19.5/mt between Indonesia and Lianyungang and Rizhao ports. Sea freight charges between the Philippines and Tianjin port were around USD 16/mt, and around USD 15.5/mt between the Philippines and Lianyungang and Rizhao ports.
Notes:Major Ports are Tianjin,Rizhao,Lianyungang
Lateritic Stock at China Major Ports
2,000
4,000
6,000
8,000
10,000
12,000
27-Jan-11
17-Feb-11
24-Feb-11
10-Mar-
11
24-Mar-
11
7-Apr-
11
21-Apr-
11
5-May-
11
19-May-
11
2-Jun-11
16-Jun-11
30-Jun-11
14-Jul-11
Data Source: SMM
Unit: kt
Nickel Supply Approximately 800 mt of nickel entered domestic markets last week. Trading inventories in Shanghai remained around 16,000 mt (excluding bonded areas). Inventories in south China were 699 mt, down 25 mt from a week earlier and with nickel mainly from Jinchuan Group.
Trades between high grade NPI producers and stainless steel mills were stagnant. Prices of high grade NPI were up RMB 45/mtu from a week earlier. Although LME nickel prices surged above USD 24,000/mt last week, mainstream traded prices of high grade NPI (10-15%) did not advance significantly, with prices still in the RMB 1,600-1,620/mtu range and up only RMB 450/mtu. Although some NPI producers raised offers to RMB 1,650/mtu, most downstream stainless steel mills only accepted prices between RMB 1,600-1,620/mtu. A recent SMM survey of NPI producers and stainless steel mills revealed the following insights.
July 18, 2011 China Posts Positive Economic Growth in 1H 2011
Sluggish sentiment in NPI markets improved and transactions for NPI were up slightly. Orders were also up, with some high grade NPI producers even reporting full orders for July, which caused supply of high grade NPI to gradually tighten. In this context, most market insiders believe prices of high grade NPI will not fall in the near term. In Inner Mongolia, Jiangsu, and Liaoning provinces, some NPI producers reported strong orders, and many producers reported slightly tight NPI supply. Producers still maintained a wait-and-see attitude toward pricing of future orders and temporarily declined to quote offers. Based on results from the SMM survey of stainless steel producers, most stainless steel mills believe the latest rebound in prices is a correction of previous excessive declines, and approximately 50% of surveyed companies were not optimistic towards the LME nickel price outlook. Around 30% of surveyed companies believe current LME nickel prices have reversed their downward trend and still have room to advance. The remaining 20% of surveyed companies were unclear toward the LME nickel price outlook. Most stainless steel mills were still purchasing cautiously. Given that both suppliers and buyers adopted a wait-and-see attitude, NPI prices will not likely advance significantly. SMM expects the NPI market will not become bullish until the end of the stainless steel low-demand period. Prices for medium grade NPI were supported by increase in high grade NPI prices, pushing up ex-works prices for medium grade NPI (6-8%) to RMB 1,540-1,550/mtu, a gain of RMB 15/mtu, and sending up ex-works prices for medium grade NPI (4-6%) to RMB 1,520-1,540/mtu, a gain of RMB 10/mtu. Transactions for medium grade NPI were not as brisk as high grade NPI, with both suppliers and buyers reporting quiet market activity. Traded prices for low-grade NPI (1.6-1.7%) were RMB 3,550/mt, up RMB 50/mt from a week earlier. Since supply of low grade NPI in markets was limited, producers kept offers firm. Deals for low grade NPI largely made at RMB 3,550/mt. Most deals were generally made with long-term contracts, with only limited spot transactions reported.
Downstream Demand-Stainless Steel Stainless steel spot prices rebounded to RMB 22,900/mt, rising at a slower pace compared with LME nickel. Soft stainless steel downstream demand and quiet trading sentiment were still major reasons behind weak growth in stainless steel prices.
July 18, 2011 China Posts Positive Economic Growth in 1H 2011
Appendix China's Bauxite&Alumina&Aluminum Apparent Consumption, Jan 2010 - May 2011 (Tons in Thousands, Percent)
(in kt) % YoY % MoM % YoY % MoM % YoY % MoM % YoY % MoM % YoY % MoMJan 10 na na na 1,792 64% -31% 0.0 na na 1,792 64% -31% na na naFeb 10 na na na 1,938 83% 8% 0.0 na na 1,938 83% 8% na na naMar 10 na na na 2,573 174% 33% 0.0 na na 2,573 174% 33% na na naApr 10 na na na 2,456 143% -5% 0.0 na na 2,456 143% -5% na na naMay 10 na na na 2,452 59% 0% 0.0 na na 2,452 59% 0% na na naJun 10 na na na 3,952 158% 61% 0.0 na na 3,952 158% 61% na na naJul 10 na na na 3,015 55% -24% 0.0 na na 3,015 55% -24% na na naAug 10 na na na 2,514 57% -17% 0.0 na na 2,514 57% -17% na na naSep 10 na na na 3,143 17% 25% 0.0 na na 3,143 17% 25% na na naOct 10 na na na 1,782 21% -43% 0.0 na na 1,782 21% -43% na na naNov 10 na na na 2,617 13% 47% 0.0 na na 2,617 13% 47% na na naDec 10 na na na 3,127 20% 19% 0.0 na na 3,127 20% 19% na na naJan 11 na na na 2,971 66% -5% 0.0 na na 2,971 66% -5% na na naFeb 11 na na na 2,224 15% -25% 0.0 na na 2,224 15% -25% na na naMar 11 na na na 3,577 39% 61% 0.0 na na 3,577 39% 61% na na naApr 11 na na na 4,138 69% 16% 0.0 na na 4,138 69% 16% na na naMay 11 na na na 4,502 84% 9% 0.0 na na 4,502 84% 9% na na na2011Annualized na na na 41,786 33% na 0.0 na na 41,786 33% na na na na
July 18, 2011 China Posts Positive Economic Growth in 1H 2011
Terms of Use
This report is a compilation originally created by SMM Information & Technology Co., Ltd. and SMM Information & Technology Co., Ltd. owns the copyright, which is protected by the “Copyright Law of The People’s Republic of China” and other laws, regulations and applicable international treaties. This report shall not be reprinted, modified, sold, transferred, showed, translated, complied and transmitted without written permission. The content in this report, which includes but not limited to information, articles, data, charts, pictures, sound, videos, logos, advertising, trademarks, trade names, domain names, layout designs of any or all of the information, are protected under the “Copyright Law of The People’s Republic of China”, “Trademark Law of The People’s Republic of China”, “Anti-Unfair Competition Law of The People’s Republic of China” and other laws, regulations, and applicable international treaties in relation to copyright, trademark right, domain name right, property right of trade data and information and other rights. This report is owned or held by SMM Information & Technology Co., Ltd. and the company’s relevant rights holders. This report shall not be reprinted, modified, used, sold, transferred, showed, translated, compiled and transmitted without written permission.