14
China Healthcare Market – Potentials and Opportunities Ritupon Gogoi, Shanghai, Jan 2015
| Date post: | 15-Jul-2015 |
| Category: |
Healthcare |
| Upload: | ritupon-gogoi |
| View: | 319 times |
| Download: | 1 times |

China Healthcare Market – Potentials and Opportunities
Ritupon Gogoi, Shanghai, Jan 2015

•$9.240 trillionGDP (current US$)
•1.370 billionPopulation, total
•Upper middle incomeIncome level
China
•54% of the population is urban (756,300,115 people in 2014), China’s population is becoming increasingly urbanized with large numbers moving to towns and cities. •Over 71% of the Chinese population is of working age, aged between 15 and 64. •By 2050, a third of China’s citizens will be over 60, over twice the current proportion.•By 2022, McKinsey predicts that 54% of urban households in China will become upper-middle-class consumers earning $16,000-$34,000 annually
Sources: National Bureau of Statistics of China, world bank

The World Bank projects China will have 7.1 percent growth in GDP in 2015, followed by 6.9 percent in 2016 .
Healthcare expenditures as a percentage of GDP have been increasing in China; 5% in 2010, 5.1% in 2011, 5.4% in 2012.
The nation’s healthcare spending is projected to grow from $357 billion in 2011 to $1 trillion in 2020.
China’s aging population will prompt growth in markets for cardiovascular diseases, dementia, and other age-linked conditions.
Increasing affluence is causing a sharp rise in lifestyle diseases such as diabetes and obesity.
China - Health Care

China’s total health expenditure (THE) as a share of GDP increased from 4.6 percent to 5.1 percent, which is moderate compared to an increase from 5.7 percent to 6.1 percent among upper middle income countries.
2004 2005 2012 2013
GNI per capita, PPP (current international $)
4,330.0 4,920.0 10,920.0 11,850.0
Population, total (in millions)
1,296.1 1,303.7 1,350.7 1,357.4
GDP (current US$) (in millions)
1,931,644.3 2,256,902.6 8,229,490.0 9,240,270.5
GDP growth (annual %) 10.1 11.3 7.7 7.7
Life expectancy at birth, total (years)
73.8 74.1 75.2
Source – The world bank
China - Health Care

0.00
2000.00
4000.00
6000.00
8000.00
10000.00
12000.00
Government HealthExpenditure
Social Security Fund HealthExpenditure
Out-of-pocket HealthExpenditure
Health Expenditure in Urban
Health Expenditure Rural
Health Expenditure aspercentage of GDP (%)
Units in 100 million RMB ¥
01 02 03 04 05 06 07 08 09 10 11 12 YearSource -China Health Statistics Yearbook 2012
China - Health Care Expenditure Trend 2001 - 2012
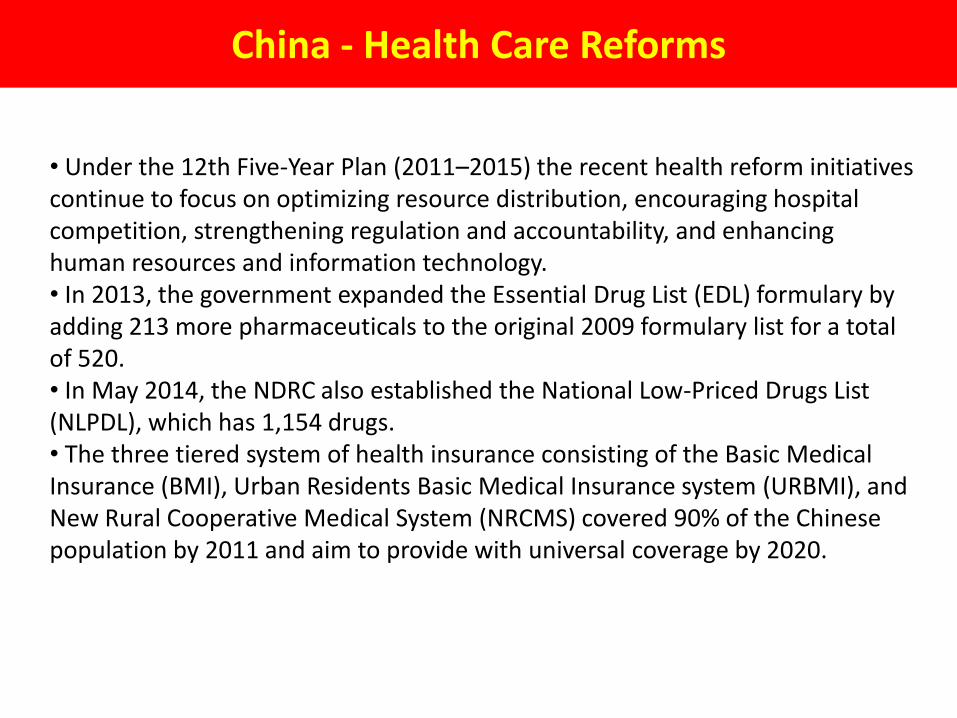
• Under the 12th Five-Year Plan (2011–2015) the recent health reform initiatives continue to focus on optimizing resource distribution, encouraging hospital competition, strengthening regulation and accountability, and enhancing human resources and information technology.• In 2013, the government expanded the Essential Drug List (EDL) formulary by adding 213 more pharmaceuticals to the original 2009 formulary list for a total of 520.• In May 2014, the NDRC also established the National Low-Priced Drugs List (NLPDL), which has 1,154 drugs. • The three tiered system of health insurance consisting of the Basic Medical Insurance (BMI), Urban Residents Basic Medical Insurance system (URBMI), and New Rural Cooperative Medical System (NRCMS) covered 90% of the Chinese population by 2011 and aim to provide with universal coverage by 2020.
China - Health Care Reforms

NA, 345, 44%
EU, 184, 24%
EMAP, 178, 23%
Japan, 72, 9%
Rest of EMAP,
70, 40%
China, 63, 35%
Brazil, 22, 12%
Russia, 12, 7%
India, 10, 6%
Global pharmaceutical market accounts to $780 Bn for MAT Sep 2014. Of which China holds 8%
China – Pharmaceutical Market

33,721 39,830
52,034
60,227 67,907
-
10,000
20,000
30,000
40,000
50,000
60,000
70,000
80,000
Mat Sep2010
Mat Sep2011
Mat Sep2012
Mat Sep2013
Mat Sep2014
Sale
s ($
Mn
)
CAGR
19%
China Pharma Market, US$ Mn 2010 - 2014
China Pharmaceutical market is growing with a CAGR of 19%
Source: MAT Sep 2014
China – Pharmaceutical Market

Rank CompanySales $ Mn(MAT Sep
2014)
CAGR (2010-2014)
AnnualGrowth
2013-2014
1 Ke Lun Group 1023 24% 15%
2 Shandong Qilu Fty 976 27% 14%
3 Js.Yangzijiang Fty 943 19% 16%
4 Shanghai Fosun Ph 831 26% 13%
5 Jiangsu Hengrui 804 23% 20%
6 C.T-Tianqing Gp. 661 40% 18%
7 Sihuan Group 634 28% 28%
8 Shandong Ruiyang 534 17% 15%
9 Bj.Shuanglu Pharm 481 28% 14%
10 Jiangsu Hansoh 466 22% 14%
Total of Top 10 7353 25% 16%
Total China Market 62,818 19% 13%
Rank CompanySales £ Mn(MAT Sep
2014)
CAGR (2010-2014)
AnnualGrowth
2013-2014
1 Pfizer 1,501 23% 16%
2 Astrazeneca 1,236 20% 25%
3 Sanofi 945 15% 12%
4 Bayer 909 15% 9%
5 Roche 871 20% 11%
6 Novartis 804 23% 22%
7 Merck & Co 678 20% 15%
8 Novo Nordisk 595 17% 10%
9 Fresenius 534 14% 9%
10 GSK 450 9% -21%
Total of Top 10 8,523 18% 12%
Total China Market 62,818 19% 13%
Top 10 MNCs and Domestic Pharmaceutical Companies in China
Source: IMS Sep 2014
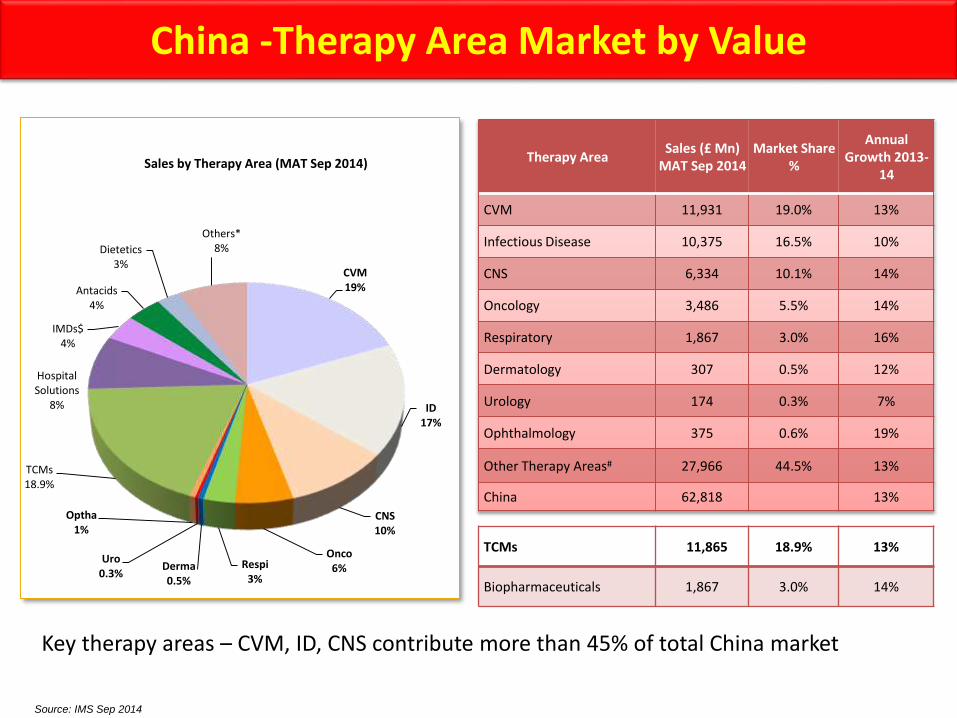
China -Therapy Area Market by Value
CVM19%
ID17%
CNS10%
Onco6%Respi
3%Derma0.5%
Uro0.3%
Optha1%
TCMs18.9%
Hospital Solutions
8%
IMDs$4%
Antacids4%
Dietetics3%
Others*8%
Sales by Therapy Area (MAT Sep 2014) Therapy AreaSales (£ Mn)
MAT Sep 2014Market Share
%
Annual Growth 2013-
14
CVM 11,931 19.0% 13%
Infectious Disease 10,375 16.5% 10%
CNS 6,334 10.1% 14%
Oncology 3,486 5.5% 14%
Respiratory 1,867 3.0% 16%
Dermatology 307 0.5% 12%
Urology 174 0.3% 7%
Ophthalmology 375 0.6% 19%
Other Therapy Areas# 27,966 44.5% 13%
China 62,818 13%
TCMs 11,865 18.9% 13%
Biopharmaceuticals 1,867 3.0% 14%
Source: IMS Sep 2014
Key therapy areas – CVM, ID, CNS contribute more than 45% of total China market

Therapy AreaSU (Mn) MAT
Sep 2014Market Share %
Annual Growth 2013-
14
CVM 31,960 16.4% 11%
Infectious Disease 10,894 5.6% 6%
CNS 10,358 5.3% 8%
Oncology 635 0.3% 11%
Respiratory 8,388 4.3% 9%
Dermatology 6,928 3.6% 10%
Urology 541 0.3% 6%
Ophthalmology 12,277 6.3% 6%
Other Therapy Areas# 112,834 57.9% 8%
China 194,815 9%
TCMs 81,056 41.6% 9%
Biopharmaceuticals 213 0.1% 11%
CVM16%
ID6% CNS
5%
Onco0.3%
Respi4%
Derma4%
Uro0.3%Optha
6%
TCMs41.6%
Hospital Solutions
3%
IMDs$1%
Antacids2%
Dietetics6%
Others*5%
Volume by Therapy Area (MAT Sep 2014)
11
Source: IMS MAT Sep 2014
China - Therapy Area Market by volume
• TCMs are the biggest market holders as a class in China in 2013-14, in terms of volume (~42%)
• Except CVM, Oncology and Dermatology other Therapy areas are growing slower than overall China volume market

China – New Drug Market Approval Process
Source - CMS Lifesciences Guide

China – Retail Drug pricing approach
Drug category Rate of salesexpenses
Profit margin
Class I new drug: New drug never marketed indomestic or overseas market
30% 45%
Class II new drug: New drug never marketed in domestic market but marketed overseas which includes a new administration path (oral, injection, etc.) never marketed in either domestic andoverseas markets
20% 25%
Class III new drug: New combination of chemicalSubstances
18% 18%
Class IV new drug: Domestically marketed drug with a new administration path or a new dosage form
15% 15%
Class V new drug: Drug marketed in domesticmarket with new applications
12% 12%
Generics 10% 10%
The retail price cap is calculated based on the sum of the cost of ex-factory orex-port drugs, tax, reasonable sales expenses, and reasonable profit margin.The NDRC sets different standards for maximum rates of sales expenses and profit margins for different drugs as per the following table:

• Rapidly changing regulatory , competitive landscape and shifting stakeholder landscape. • Global off-patent drugs will have a significant drop in usage as the government will only reimburse them at a price equivalent to a local generic. • Although multinational pharmaceutical companies are largely not affected by the essential drug list (EDL) until now, in future if it is to be expanded to a list of 800 and more effectively implemented, then these companies may need to reconsider their approach to the Chinese market.• The market will remain very difficult for innovative Pharmaceutical MNCs, which will have to wait years for a possible NRDL inclusion.• Because of the rapid development of the legislative environment and the regulatory framework, there is a constant flow of amendments to policies. Which take some time for the government, the legislature, and enforcement agencies, as well as industry, to understand fully what those new regulations meant.
China – Pharmaceutical & Health Care Market Challenges


