109


China Purchasing Development Report
(2010)
For more information
Li & Fung Research CentreMember of Li & Fung Group11/F, LiFung Tower,
868 Cheung Sha Wan Road,
Hong Kong
Tel : (852) 2300 2470
Fax : (852) 2635 1598
Email : [email protected]
Website : www.lifunggroup.com
China Federation of Logistics & PurchasingThe Specialized Committee for Purchasing andSupply China ManagementRm 1515 Henghua International Business Centre,
26 Yuetan Beijie, Beijing, China 100045
Phone : (010) 5856 6588 -191 / -195 / -183
Fax : (010) 5856 6579
Website : www.chinawuliu.com.cn
!"#$#%&'(#)*+*,-./#0*'1-* 2

The Report
In view of the growing importance of sourcing in China, the China Federation of Logistics and
Purchasing (CFLP), the most authoritative industry organization in areas of sourcing, logistics
and supply chain management in China, published the !rst and second annual China Purchasing
Development Reports1 in 2008 and 2009. The reports give a comprehensive account of the
latest development of sourcing activities in China, and were well received by the academia and
practitioners. The CFLP publishes the third report in 2010.
Li & Fung Research Centre of the Li & Fung Group is delighted to work jointly with the CFLP
in the China Purchasing Development Report project, and is solely responsible for the content
of the English version of the report. This English version summarizes the key takeaways of the
full report in Chinese. We hope our readers can get an overview of the sourcing environment in
China.
1 The English version of the 2008 and 2009 reports can be found here: http://www.lifunggroup.com/research/pdf/ChinaPurchasingDevelopmentReport08.pdf (2008) and http://www.lifunggroup.com/research/pdf/ChinaPurchasingDevelopmentReport09.pdf (2009).
0/"',#3&-./,+"'(#4*5*6789*'1#)*87-1#:;<2<=;

! ! Table of Content
! "! #$%!&%'(&#!
! )! #*+,%!(-!.(/#%/#
! 0! *+(1#!#$%!(&2*/34*#3(/5!
! 6! .$3/*!5(1&.3/2!51&7%8!
! 09! */!*/*,8535!(-!'1&.$*53/2!*.#373#3%5!*/:!5(1&.3/2!53#1*#3(/5!;3#$!'<3!*/:!/<3
! 6=! 5(1&.3/2!,32$#><*/1-*.#1&%:!.(/51<%&!'&(:1.#5!3/!.$3/*?!.(5#!#&%/:5!*/:!
(1#,((@
! 9A! #$%!'(5#>-3/*/.3*,!.&3535!5#&*#%23%5!(-!.$3/*B5!<*/1-*.#1&%&5!*/:!5(1&.3/2!
+153/%55%5
! CD=! *''%/:3E?!*+(1#!#$%!CHINA PURCHASING DEVELOPMENT REPORT (CHINESE VERSION)
!"#$#%&'(#)*+*,-./#0*'1-* >

About the organizations
China Federation of Logistics & Purchasing (CFLP) is the !rst logistics and purchasing
industry association approved by the State Council. CFLP’s mission is to promote the
development of the logistics industry and the sourcing businesses of both government and
enterprises, as well as to facilitate the circulation of factors of production in China. The CFLP is
also China’s representative in the Asian-Paci!c Logistics Federation (APLF) and the International
Federation of Purchasing and Materials Management (IFPMM).
China Society of Logistics is a non-pro!t making academic organization comprising experts,
academia and practitioners in the logistics sector in China, with special focuses on logistics
theories, management science of logistics and modernization of logistics technology. The
Society endeavors to channel members’ opinions to relevant government departments, organize
activities for exchanging knowledge and experiences, nurture talents for the sector, and publish
logistics publications and information.
The Li & Fung Group is a Hong Kong-based multinational company with three distinct core
businesses: export trading, distribution and retailing. Founded in Guangzhou in 1906, the Li &
Fung Group achieved an annual turnover exceeding US$16 billion in 2009. Today, the Li & Fung
Group operates in some 40 countries and regions and employs over 35,500 people worldwide.
One of its core competencies is supply chain management.
In 2009, the Li & Fung Group’s revenue in China exceeded USD 8 billion. The extensive sourcing
network of Li & Fung Limited, the export trading arm of the Li & Fung Group, covers over 10,000
suppliers through more than 20 of!ces in China. China has become Li & Fung Limited’s most
important market in global sourcing. In 2009, 54% of its global sourcing was from China.
The Li & Fung Research Centre serves as a knowledge bank for the Li & Fung Group on
China’s economy, industries, logistics and the distribution sector, with its research scope
spanning the entire supply chain, from ideas, production, distribution, retailing to end-
consumers.
The Centre has been actively promoting the application of supply chain management. In
2003, the Centre published the book “Li & Fung: the Orchestrator of Global Supply Chain
Management”. The book is now regarded as a very useful reference among businessmen and
academics in China. The revised and expanded edition was published in August 2009.
0/"',#3&-./,+"'(#4*5*6789*'1#)*87-1#:;<2<=?

China sourcing survey
The CFLP conducted its !rst annual survey on sourcing activities of enterprises in China in 2008
in order to have a systematic review and analysis of China’s sourcing environment. The 2010
survey is the third exercise. This year, the CFLP expanded the scope of the survey to cover new
aspects such as green sourcing. A total of 204 valid responses were collected. The sampled
enterprises are broadly representative, in terms of industry, ownership structure and size. More
information on the pro!le of the respondents is provided in exhibits 1 to 4.
Several trends are observed. First, during the post-crisis period, the majority of the surveyed
enterprises witnessed growth in sales income. However, unreliable suppliers, increasing
operation costs and on-time delivery to clients were named the biggest challenges for them.
Second, the recognition of importance of sourcing is improving. About 60% of the sourcing
departments of the respondents directly reported to either the general manager or the vice
president overseeing sourcing. 76% of the respondents agreed that the top management had
paid more attention to the development of the sourcing department. The sourcing department
also had in"uences over other departments especially the production department and the
logistics & transportation department. Nonetheless, professional training for sourcing personnel
was inadequate, and the proportion of sourcing staff with formal training was below 50%.
Third, the application of modern management skills, approaches or systems in sourcing received
more attention, but there is still room for improvement. 67.8% of the surveyed enterprises
ful!lled or even outperformed their sourcing plans, showing signi!cant improvement from the
previous year (below 30%). 51.7% of the respondents said the sourcing performance evaluation
was closely integrated with their operational objectives, improving from 49.8% of last year. In
terms of informatization, still, less than 50% of the surveyed enterprises adopted the bar code
system across various businesses and operational units within the enterprises. Also, apart from
Enterprise Resource Planning (ERP), the adoption rate of other information systems such as
Management Information System (MIS) and Decision Support System (DSS) remained low.
Fourth, better supplier management was observed. 51.3% of the respondents thought that their
execution of the supplier evaluation system had been good or very good. 64.2% of the surveyed
enterprises managed to maintain stable relationship with over 50% of their suppliers this year, up
from 48.4% of last year.
!"#$#%&'(#)*+*,-./#0*'1-* @
China sourcing survey

Finally, green sourcing and corporate social responsibility are gaining attention among the
surveyed enterprises. 75.5% of the suppliers of the surveyed enterprises provided products
meeting national green standards. 68.1% of the surveyed enterprises required their suppliers to
comply with certain corporate social responsibility requirements. If their suppliers fail to do so,
the majority of the respondents would require them to make improvements.
1. Pro!le of the surveyed enterprises
Exhibit 1 shows the types of enterprises covered in the 2010 survey. They were mainly from the
manufacturing sector, which accounted for 82.9% of the total. 31.4% engaged in mechanical
equipment, and enterprises engaging in the light industry and electronic communications
equipment accounted for 17.2% and 14.7% respectively (see exhibit 2).
Exhibit 1: Types of Enterprises
SECTOR SHARE OF TOTAL
Manufacturing 82.9%
Services 7.8%
Others (e.g. construction) 9.3%
Exhibit 2: Breakdown of industries of manufacturing sector
INDUSTRY SHARE OF TOTAL
Mechanical equipment 31.4%
Light Industry 17.2%
Electronic communications equipment 14.7%
Metal & non-metal processing 10.8%
Petrochemical (including chemical !bres, 8.8%
rubber, plastics & pharmaceuticals)
Among the surveyed enterprises, 48.0% were private enterprises (PEs); 36.8% were foreign-
invested enterprises (FIEs), which included the Hong Kong- and Taiwan-invested enterprises; and
state-owned enterprises (SOEs) accounted for 9.8% of the total (see exhibit 3).
0/"',#3&-./,+"'(#4*5*6789*'1#)*87-1#:;<2<=A

Exhibit 3: Forms of ownership of enterprises
Among the respondents, 44.1% were large-sized enterprises, 35.8% were medium-sized
enterprises and 20.1% were small-sized enterprises.1 More information can be found in exhibit 4.
Exhibit 4: Size of enterprises
1 In this survey, enterprises with sales volume over 300 million are classi!ed as “large-sized enterprises”; those with sales volume over 30 million and below 300 million are classi!ed as “medium-sized enterprises”; and with sales volume below 30 million, “small-sized enterprises”.
!"#$#%&'(#)*+*,-./#0*'1-* B
China sourcing survey
2. Sourcing in the post-crisis period
i. Sales income and sourcing volume
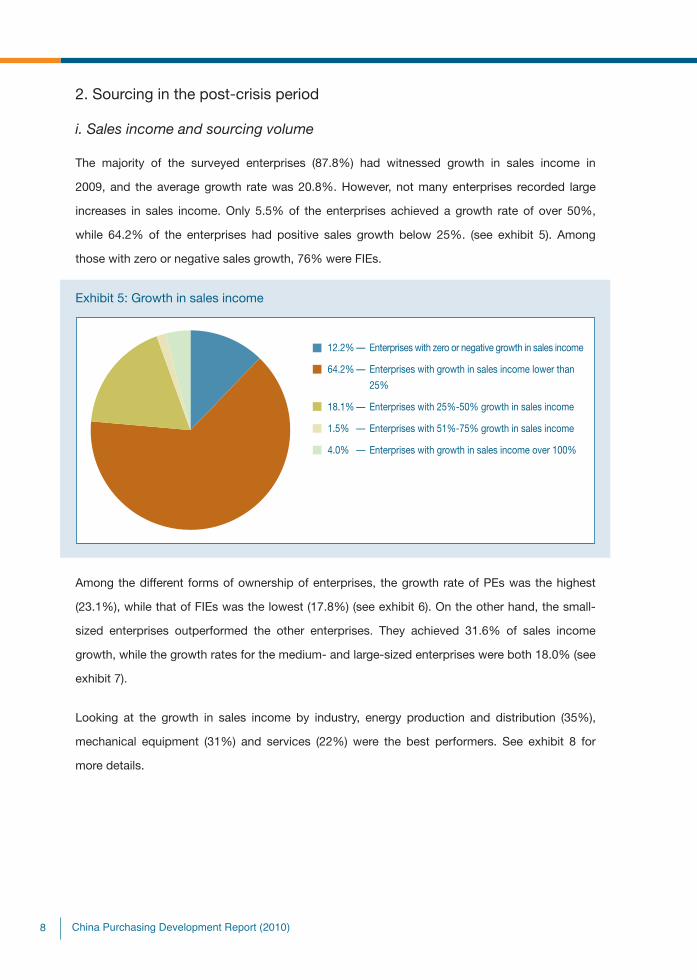
The majority of the surveyed enterprises (87.8%) had witnessed growth in sales income in
2009, and the average growth rate was 20.8%. However, not many enterprises recorded large
increases in sales income. Only 5.5% of the enterprises achieved a growth rate of over 50%,
while 64.2% of the enterprises had positive sales growth below 25%. (see exhibit 5). Among
those with zero or negative sales growth, 76% were FIEs.
Exhibit 5: Growth in sales income
Among the different forms of ownership of enterprises, the growth rate of PEs was the highest
(23.1%), while that of FIEs was the lowest (17.8%) (see exhibit 6). On the other hand, the small-
sized enterprises outperformed the other enterprises. They achieved 31.6% of sales income
growth, while the growth rates for the medium- and large-sized enterprises were both 18.0% (see
exhibit 7).
Looking at the growth in sales income by industry, energy production and distribution (35%),
mechanical equipment (31%) and services (22%) were the best performers. See exhibit 8 for
more details.
0/"',#3&-./,+"'(#4*5*6789*'1#)*87-1#:;<2<=C

Exhibit 6: Average growth in sales income by form of ownership of enterprises
Exhibit 7: Average growth in sales income by size of enterprises
Exhibit 8: Average growth in sales income by industry
In terms of sourcing volume, the majority of the surveyed enterprises (88.2%) saw an increase,
and they recorded an average increase of 18.2%. However, not many enterprises had remarkable
growth in sourcing volume. Over 70% of the enterprises reported that their increases in sourcing
volume were lower than 25% (see exhibit 9). Among those with zero or negative growth, 80%
were FIEs.
!"#$#%&'(#)*+*,-./#0*'1-* D
China sourcing survey

Exhibit 9: Growth in sourcing volume
Among different forms of ownership of enterprises, PEs had the biggest increase in sourcing
volume (24.9%), while that of FIEs was the smallest (9.5%) (see exhibit 10). Among the different
sizes of enterprises, the small-sized enterprises outperformed their counterparts. They achieved
a volume increase of 36.0%, compared to 10.8% volume increase of the large-sized enterprises
(see exhibit 11). Among different industries, mechanical equipment (25%) and electronic
communications equipment (24%) were the best performers (see exhibit 12).
Exhibit 10: Average growth in sourcing volume by form of ownership of enterprises
Exhibit 11: Average growth in sourcing volume by size of enterprises
0/"',#3&-./,+"'(#4*5*6789*'1#)*87-1#:;<2<=2<

Exhibit 12: Average growth in sourcing volume by industry
ii. Major challenges of sourcing management
When asked about the greatest challenge, 51.0% of the respondents named unreliable suppliers.
Increasing operational costs (46.6%) and on-time delivery to clients (44.6%) were also major
challenges faced by the enterprises. Exhibit 13 gives you more information.
Exhibit 13: Major challenges of sourcing management
Note: Multiple responses allowed
Looking at different forms of ownership of enterprises, unreliable suppliers (50.0%), increasing
operational costs (50.0%) and risk management (50.0%) were the biggest challenges for SOEs.
Only 20.0% of SOEs regarded on-time delivery to clients as a major challenge. As for FIEs, their
pressure came mainly from unreliable suppliers (49.3%), on-time delivery to clients (49.3%) and
stiff competition (46.7%). PEs suffered most from unreliable suppliers (51.0%), on-time delivery
to clients (49.3%) and increasing operational costs (49.0%) (see exhibit 14).
!"#$#%&'(#)*+*,-./#0*'1-* 22
China sourcing survey

Exhibit 14: Major challenges of sourcing management by form of ownership of enterprises
Note: Multiple responses allowed
iii. Measures to overcome challenges
As most enterprises considered “unreliable suppliers” their biggest challenge, various measures
were taken to overcome it. Maintaining long term and stable relationship with suppliers (83.3%)
and developing new suppliers (77.3%) were the most commonly named measures. Exhibit 15
gives more information.
Exhibit 15: Measures to overcome challenges
0/"',#3&-./,+"'(#4*5*6789*'1#)*87-1#:;<2<=2;

3. Strategic importance of sourcing within enterprises
i. Head of the sourcing department
Results revealed that the importance of sourcing was well recognized among the surveyed
enterprises. As shown in exhibit 16, nearly 60% of the sourcing departments of the respondents
reported directly to either the general managers or the vice presidents who oversee sourcing.
Only 9% of the sourcing department of the surveyed enterprises reported to chief procurement
of!cers, chief executive of!cers or chief supply chain of!cers. Also, most of the SOEs did not
have a chief operation of!cer or chief procurement of!cer. It re"ects that sourcing has yet to
develop as a specialized division, especially for SOEs (see exhibit 16).
Exhibit 16: Head of sourcing department
ii. Importance of the sourcing department
In terms of involvement in other business functions, the sourcing department did show its
in"uences over other departments’ decision making, especially the production and logistics &
transportation departments. The proportions of sourcing department having high and medium
involvement in the aforesaid departments were 71.6% and 67.7% respectively (see exhibit 17).
!"#$#%&'(#)*+*,-./#0*'1-* 2>
China sourcing survey

Exhibit 17: Involvement of sourcing departments in other business functions
Note: Multiple responses allowed
Among different forms of ownership of enterprises, the sourcing departments in SOEs involved
signi!cantly less in other business functions, when compared with their counterparts in FIEs and
PEs (see exhibit 18). On the other hand, the sourcing departments in small-sized enterprises had
much lower involvement in strategic planning when compared with their counterparts in medium-
and large-sized enterprises. (see exhibit 19).
0/"',#3&-./,+"'(#4*5*6789*'1#)*87-1#:;<2<=2?

Exhibit 18: Involvement of sourcing departments in other business functions by form of
ownership of enterprises
Other business functions Levels of involvement SOEs PEs FIEs
Information technology High 15.0% 17.3% 6.7%
Medium 50.0% 34.7% 36.0%
Low 10.0% 22.4% 29.3%
No involvement 25.0% 25.5% 28.0%
Logistics & transportation High 30.0% 32.7% 38.7%
Medium 30.0% 33.7% 32.0%
Low 10.0% 16.3% 17.3%
No involvement 30.0% 17.3% 12.0%
Non-production operation High 0.0% 8.2% 8.0%
Medium 35.0% 27.6% 28.0%
Low 25.0% 23.5% 38.7%
No involvement 40.0% 40.8% 25.3%
Production High 40.0% 40.8% 48.0%
Medium 25.0% 27.6% 28.0%
Low 10.0% 13.3% 14.7%
No involvement 25.0% 18.4% 9.3%
Customer support High 15.0% 12.2% 16.0%
Medium 25.0% 32.7% 22.7%
Low 15.0% 26.5% 26.7%
No involvement 45.0% 28.6% 34.7%
Marketing & advertising High 0.0% 4.1% 1.3%
Medium 10.0% 17.3% 13.3%
Low 30.0% 30.6% 29.3%
No involvement 60.0% 48.0% 56.0%
Sales & business development High 10.0% 22.4% 5.3%
Medium 10.0% 25.5% 34.7%
Low 35.0% 20.4% 24.0%
No involvement 45.0% 31.6% 36.0%
Product & service development High 15.0% 23.5% 16.0%
Medium 35.0% 26.5% 42.7%
Low 25.0% 28.6% 26.7%
No involvement 25.0% 21.4% 14.7%
Research & development High 15.0% 24.5% 25.3%
Medium 15.0% 22.4% 29.3%
Low 45.0% 28.6% 26.7%
No involvement 25.0% 24.5% 18.7%
Strategic planning High 10.0% 16.3% 17.6%
Medium 45.0% 42.9% 39.2%
Low 10.0% 17.3% 25.7%
No involvement 35.0% 23.5% 17.6%
!"#$#%&'(#)*+*,-./#0*'1-* 2@
China sourcing survey

Exhibit 19: Involvement of sourcing departments in other business functions by size of
enterprises
Other business Levels of Large-sized Medium-sized Small-sized
functions involvement enterprises enterprises enterprises
Information technology High 13.3% 11.0% 14.6% Medium 34.4% 53.4% 14.6% Low 28.9% 20.5% 17.1% No involvement 23.3% 15.1% 53.7%Logistics & transportation High 31.1% 45.2% 26.8% Medium 35.6% 28.8% 31.7% Low 16.7% 15.1% 12.2% No involvement 16.7% 11.0% 29.3%Non-production operation High 6.7% 9.6% 2.4% Medium 26.7% 39.7% 14.6% Low 38.9% 21.9% 19.5% No involvement 27.8% 28.8% 63.4%Production High 47.8% 49.3% 29.3% Medium 27.8% 26.0% 26.8% Low 12.2% 12.3% 14.6% No involvement 12.2% 12.3% 29.3%Customer support High 14.4% 16.4% 7.3% Medium 25.6% 34.2% 26.8% Low 25.6% 23.3% 24.4% No involvement 34.4% 26.0% 41.5%Marketing & advertising High 4.4% 1.4% 0.0% Medium 13.3% 16.4% 19.5% Low 34.4% 28.8% 17.1% No involvement 47.8% 53.4% 63.4%Sales & business development High 13.3% 12.3% 19.5% Medium 25.6% 34.2% 22.0% Low 27.8% 24.7% 12.2% No involvement 33.3% 28.8% 46.3%Product & service development High 22.2% 21.9% 14.6% Medium 30.0% 42.5% 26.8% Low 30.0% 23.3% 24.4% No involvement 17.8% 12.3% 34.1%Research & development High 25.6% 28.8% 19.5% Medium 26.7% 19.2% 26.8% Low 30.0% 28.8% 22.0% No involvement 17.8% 23.3% 31.7%Strategic planning High 14.4% 13.9% 31.7% Medium 43.3% 44.4% 26.8% Low 23.3% 19.4% 12.2% No involvement 18.9% 22.2% 29.3%
0/"',#3&-./,+"'(#4*5*6789*'1#)*87-1#:;<2<=2A

In general, the importance of the sourcing department has grown signi!cantly in recent years.
It can be proved by the fact that 76% of the respondents agreed that the top management had
paid more attention to the development of the sourcing department.
iii. Contribution of the sourcing department to enterprises
According to the survey, the most important contribution of the sourcing department to
enterprises lay in cost control, followed by quality improvement and risk management.
4. Sourcing Performance
I. Criteria of sourcing performance evaluation
i. Implementation of sourcing plan
67.8% of the surveyed enterprises ful!lled or even outperformed their sourcing plans. However,
32.2% of respondents were not sure if they had ful!lled their sourcing plans (see exhibit 20).
Among different forms of ownership of enterprises, FIEs did better than other enterprises, with
78.9% of FIEs ful!lled or outperformed their sourcing plans (see exhibit 21). Large- and medium-
sized enterprises also had a higher implementation rate of their sourcing plans (see exhibit 22).
Exhibit 20: Implementation rate of sourcing plan
!"#$#%&'(#)*+*,-./#0*'1-* 2B
China sourcing survey

Exhibit 21: Implementation rate of sourcing plan by form of ownership of enterprises
Exhibit 22: Implementation rate of sourcing plan by size of enterprises
ii. Accuracy of order processing
Exhibit 23 demonstrates the accuracy rate of order processing of the surveyed enterprises. In
overall terms, 86.1% of orders were processed accurately. Among different forms of ownership of
enterprises, FIEs again outperformed SOEs and PEs (see exhibit 23). When it comes to different
size of enterprises, small-sized enterprises noticeably lagged behind their counterparts (see
exhibit 24).
Exhibit 23: Accuracy rate of order processing by form of ownership of enterprises
Exhibit 24: Accuracy rate of order processing by size of enterprises
0/"',#3&-./,+"'(#4*5*6789*'1#)*87-1#:;<2<=2C

II. Sourcing performance management
i. Indicators for sourcing performance evaluation
When asked about the indicators for sourcing performance evaluation, most respondents of all
forms of ownership chose price/cost: FIEs (98.6%), PEs (94.9%) and SOEs (100%). Product
quality, inventory and continuity of supply were also important. By contrast, technology,
innovation and introduction of new products was the least chosen indicator by the respondents
(see exhibit 25).
Exhibit 25: Indicators for sourcing performance evaluation by form of ownership of
enterprises
Note: Multiple responses allowed
ii. Integration between sourcing performance evaluation and the overall
operational objectives
Integrating sourcing performance evaluation with the overall operational objectives is another
important sourcing management strategy. About half of the surveyed enterprises said the
sourcing performance evaluation was closely integrated with their operational objectives. Exhibit
26 gives a more detailed picture. Among different forms of ownership and sizes of enterprises,
FIEs again outperformed PEs and SOEs (see exhibit 27), while large-sized enterprises did better
than medium- and small-sized enterprises (see exhibit 28).
!"#$#%&'(#)*+*,-./#0*'1-* 2D
China sourcing survey
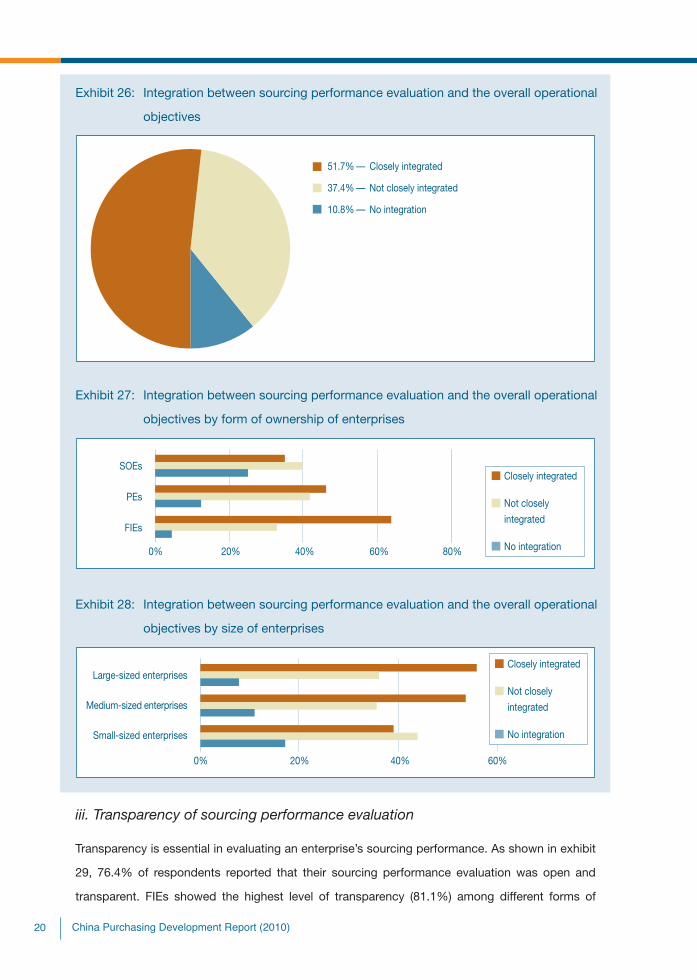
Exhibit 26: Integration between sourcing performance evaluation and the overall operational
objectives
Exhibit 27: Integration between sourcing performance evaluation and the overall operational
objectives by form of ownership of enterprises
Exhibit 28: Integration between sourcing performance evaluation and the overall operational
objectives by size of enterprises
iii. Transparency of sourcing performance evaluation
Transparency is essential in evaluating an enterprise’s sourcing performance. As shown in exhibit
29, 76.4% of respondents reported that their sourcing performance evaluation was open and
transparent. FIEs showed the highest level of transparency (81.1%) among different forms of
0/"',#3&-./,+"'(#4*5*6789*'1#)*87-1#:;<2<=;<

ownership of enterprises (see exhibit 30). According to the survey, the larger the enterprise, the
higher level of transparency was observed (see exhibit 31).
Exhibit 29: Transparency of sourcing performance evaluation
Exhibit 30: Transparency of sourcing performance evaluation by form of ownership of
enterprises
Exhibit 31: Transparency of sourcing performance evaluation by size of enterprises
!"#$#%&'(#)*+*,-./#0*'1-* ;2
China sourcing survey

5. Sourcing management
i. Degree of centralization of sourcing activities
Exhibit 32 gives a brief picture on the degree of centralization of sourcing activities within
the enterprises surveyed. Most of them (63.7%) adopted both centralized and decentralized
approaches. It is believed that enterprises opted for more "exible sourcing approaches to
cope with the challenging business environment. Besides, SOEs have the highest tendency to
implement centralized sourcing, which could be explained by their larger size.
Exhibit 32: Degree of centralization of sourcing activities
ii. Sourcing network
The majority of the surveyed enterprises (74.3%) sourced within China. About half of the
respondents adopted internal sourcing (sourcing from the factories owned by the enterprises).
Among various forms of ownership of enterprises, it is not surprising that FIEs practised global
sourcing the most given their global network and relevant experience. Large-sized enterprises
were also more active in global sourcing than medium- and small-sized enterprises (see exhibits
33 and 34).
0/"',#3&-./,+"'(#4*5*6789*'1#)*87-1#:;<2<=;;
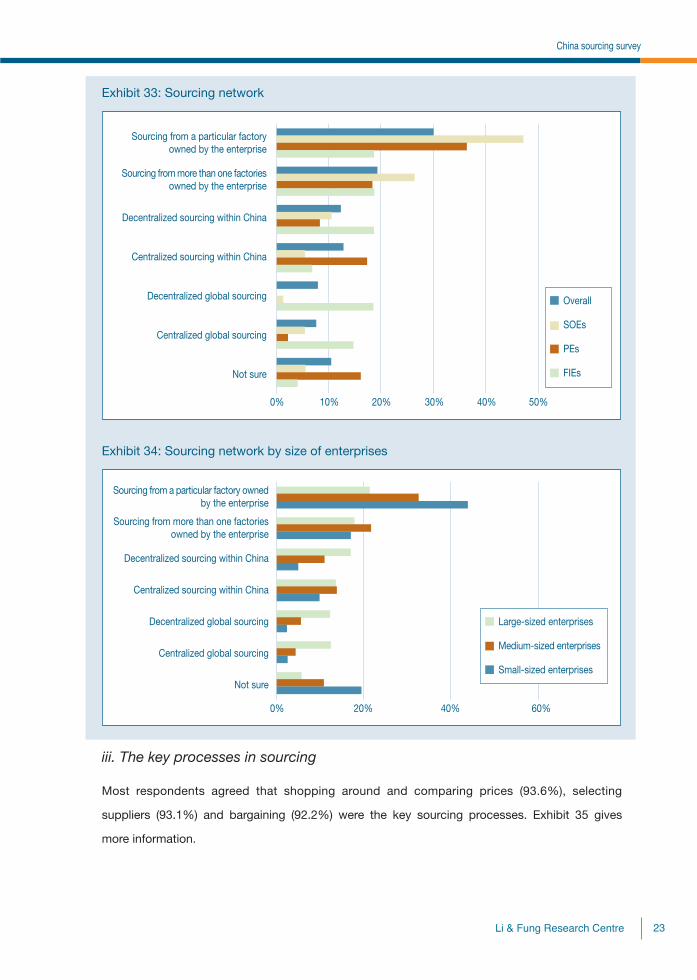
Exhibit 33: Sourcing network
Exhibit 34: Sourcing network by size of enterprises
iii. The key processes in sourcing
Most respondents agreed that shopping around and comparing prices (93.6%), selecting
suppliers (93.1%) and bargaining (92.2%) were the key sourcing processes. Exhibit 35 gives
more information.
!"#$#%&'(#)*+*,-./#0*'1-* ;>
China sourcing survey

Exhibit 35: The key processes in sourcing
Note: Multiple responses allowed
iv. Means of cost control in sourcing
Cost control is always the top priority in sourcing, especially at times of economic turbulence.
Same as last year’s results, the traditional way of shopping around and sorting out the most
competitive offer was the most common way of cost control in sourcing for nearly all sizes and
forms of ownerships of enterprises. Forming strategic alliance with reliable suppliers came
second, with 74.4% of respondents chose it as a means of cost control. Exhibits 36 and 37
present a more detailed picture.
0/"',#3&-./,+"'(#4*5*6789*'1#)*87-1#:;<2<=;?

Exhibit 36: Means of cost control by form of ownership of enterprises
Note: Multiple responses allowed
Exhibit 37: Means of cost control by size of enterprises
Note: Multiple responses allowed
!"#$#%&'(#)*+*,-./#0*'1-* ;@
China sourcing survey

v. Outsourcing sourcing functions
45.8% of the surveyed enterprises did outsource their sourcing functions. FIEs were more
receptive to the concept of outsourcing, which was less welcomed by PEs (see exhibit 38).
Exhibit 38: Outsourcing sourcing functions
vi. Implementation of standard procedures for sourcing
The standard procedures for sourcing can be divided into four stages: “from application
to approval”, “from approval to placing order”, ‘from placing order to delivery” and “from
delivery to payment”. In general, the surveyed enterprises did not do a good job in following
the standard procedures of sourcing. The situation was even worse when they were asked
about the contingency measures in the face of problems such as delivery of !nal products with
substandard quality. Enterprises are advised to enhance the implementation of the standard
procedures for sourcing, especially developing contingency plans for different sourcing stages
(see exhibits 39 and 40).
0/"',#3&-./,+"'(#4*5*6789*'1#)*87-1#:;<2<=;A

Exhibit 39: Implementation of standard procedures for sourcing by form of ownership of
enterprises
Overall SOEs PEs FIEs
From application Product quality examination 67.3% 65.0% 72.4% 61.4%
to approval Supplier audit 59.8% 65.0% 53.1% 70.0%
Budgeting 67.3% 65.0% 64.3% 70.0%
Feasible contingency plan 31.2% 45.0% 30.6% 28.6%
From approval to Placing order 94.4% 95.0% 93.8% 95.6%
placing order Con!rming order by supplier 64.3% 65.0% 59.8% 72.1%
From placing order Notice of delivery by supplier 66.8% 85.0% 71.4% 60.6%
to delivery Checking the procured products 57.8% 65.0% 54.1% 66.2%
Payment approval 62.3% 65.0% 56.1% 67.6%
Informing related staff of the 49.2% 55.0% 56.1% 40.8%
problems of the procured
products, if any
Looking for alternative suppliers, 38.2% 40.0% 36.7% 39.4%
if the procured products are
found not up to standard
From delivery Arranging payment 88.8% 90.0% 85.6% 93.0%
to payment Mediating disputes, if any 41.1% 40.0% 40.2% 43.7%
Feasible contingency plan 32.5% 40.0% 28.9% 35.2%
Rectifying problems by 27.4% 25.0% 25.8% 31.0%
supplier, if any
Notifying supplier after 43.1% 50.0% 46.4% 39.4%
payment
Keeping record of supplier’s 26.4% 20.0% 25.8% 28.2%
performance
!"#$#%&'(#)*+*,-./#0*'1-* ;B
China sourcing survey
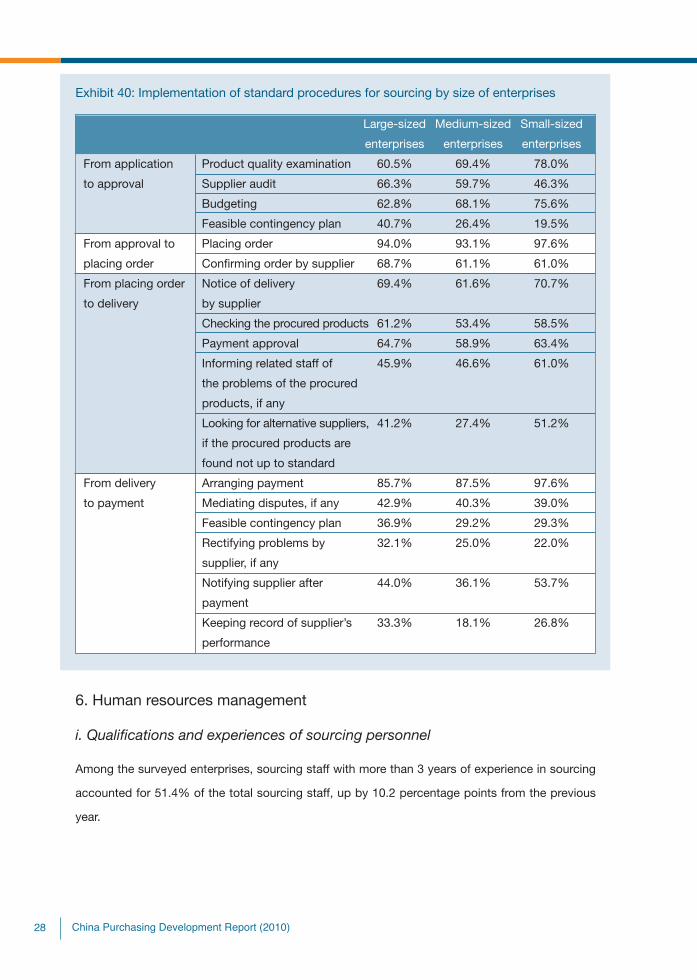
Exhibit 40: Implementation of standard procedures for sourcing by size of enterprises
Large-sized Medium-sized Small-sized
enterprises enterprises enterprises
From application Product quality examination 60.5% 69.4% 78.0%
to approval Supplier audit 66.3% 59.7% 46.3%
Budgeting 62.8% 68.1% 75.6%
Feasible contingency plan 40.7% 26.4% 19.5%
From approval to Placing order 94.0% 93.1% 97.6%
placing order Con!rming order by supplier 68.7% 61.1% 61.0%
From placing order Notice of delivery 69.4% 61.6% 70.7%
to delivery by supplier
Checking the procured products 61.2% 53.4% 58.5%
Payment approval 64.7% 58.9% 63.4%
Informing related staff of 45.9% 46.6% 61.0%
the problems of the procured
products, if any
Looking for alternative suppliers, 41.2% 27.4% 51.2%
if the procured products are
found not up to standard
From delivery Arranging payment 85.7% 87.5% 97.6%
to payment Mediating disputes, if any 42.9% 40.3% 39.0%
Feasible contingency plan 36.9% 29.2% 29.3%
Rectifying problems by 32.1% 25.0% 22.0%
supplier, if any
Notifying supplier after 44.0% 36.1% 53.7%
payment
Keeping record of supplier’s 33.3% 18.1% 26.8%
performance
6. Human resources management
i. Qualifications and experiences of sourcing personnel
Among the surveyed enterprises, sourcing staff with more than 3 years of experience in sourcing
accounted for 51.4% of the total sourcing staff, up by 10.2 percentage points from the previous
year.
0/"',#3&-./,+"'(#4*5*6789*'1#)*87-1#:;<2<=;C

Among different forms of enterprises, PEs had fewer professional sourcing personnel than FIEs
and SOEs. And so did the smaller enterprises. This is probably due to the fact that they had
fewer resources for manpower training and development (see exhibits 41 and 42).
Exhibit 41: Qualifications and experience of soucing personnel by form of ownership of
enterprises
Exhibit 42: Quali!cations and experience of sourcing personnel by size of enterprises
ii. Manpower training awareness
Professional training for sourcing staff was not popular among the surveyed enterprises. Still,
21.6% of them provided no training to their staff, similar to last year’s !gure. PEs and smaller
enterprises allocated relatively fewer resources to their sourcing staff (see exhibits 43 and 44).
Exhibit 43: Proportions of enterprises which provide no training to sourcing staff by form of
ownership of enterprises
!"#$#%&'(#)*+*,-./#0*'1-* ;D
China sourcing survey

Exhibit 44: Proportions of enterprises which provide no training to sourcing staff by size of
enterprises
Among the surveyed enterprises, less than half of them had their sourcing staff formally trained.
Again, PEs and smaller enterprises were equipped with the smallest number of formally trained
staff. Exhibits 45 and 46 show more details.
Exhibit 45: Proportions of staff attended formal training by form of ownership of enterprises
Exhibit 46: Proportions of staff attended formal training by size of enterprises
The average training hours per staff of all surveyed enterprises were 41.7 last year. Staff from
SOEs and large-sized enterprises received the most training. Exhibits 47 and 48 give more
information.
0/"',#3&-./,+"'(#4*5*6789*'1#)*87-1#:;<2<=><

Exhibit 47: Annual training hours per staff by form of ownership of enterprises
Exhibit 48: Annual training hours per staff by size of enterprises
When asked about the need for training, almost 60% of the respondents thought that there was
no need or no urgent need for their staff to get trained. Among different forms of ownership of
enterprises, SOEs showed the least awareness of the need to train for their sourcing staff (see
exhibits 49 and 50).
Exhibit 49: Perceived need for training
!"#$#%&'(#)*+*,-./#0*'1-* >2
China sourcing survey
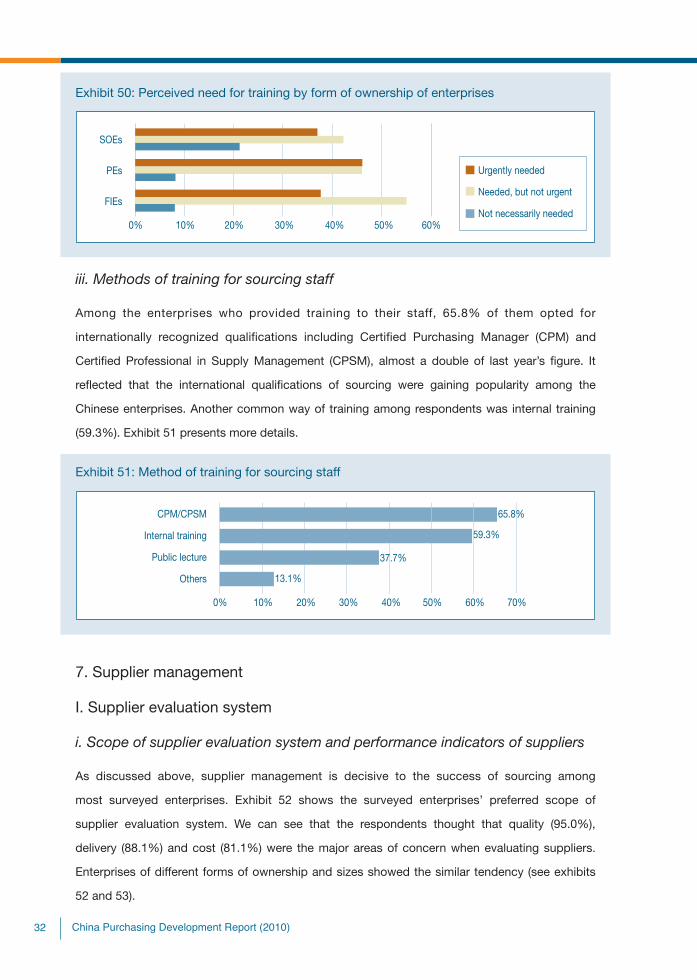
Exhibit 50: Perceived need for training by form of ownership of enterprises
iii. Methods of training for sourcing staff
Among the enterprises who provided training to their staff, 65.8% of them opted for
internationally recognized qualifications including Certified Purchasing Manager (CPM) and
Certi!ed Professional in Supply Management (CPSM), almost a double of last year’s !gure. It
re"ected that the international quali!cations of sourcing were gaining popularity among the
Chinese enterprises. Another common way of training among respondents was internal training
(59.3%). Exhibit 51 presents more details.
Exhibit 51: Method of training for sourcing staff
7. Supplier management
I. Supplier evaluation system
i. Scope of supplier evaluation system and performance indicators of suppliers
As discussed above, supplier management is decisive to the success of sourcing among
most surveyed enterprises. Exhibit 52 shows the surveyed enterprises’ preferred scope of
supplier evaluation system. We can see that the respondents thought that quality (95.0%),
delivery (88.1%) and cost (81.1%) were the major areas of concern when evaluating suppliers.
Enterprises of different forms of ownership and sizes showed the similar tendency (see exhibits
52 and 53).
0/"',#3&-./,+"'(#4*5*6789*'1#)*87-1#:;<2<=>;

Exhibit 52: Scope of supplier evaluation system by form of ownership of enterprises
Note: Multiple responses allowed
Exhibit 53: Scope of supplier evaluation system by size of enterprises
Note: Multiple responses allowed
When it comes to the performance indicators, more than 90% of the respondents regarded
on-time delivery as the key performance indicators when evaluating suppliers (see exhibit 54).
76.4% of the surveyed enterprises thought cost reduction was an important indicator. Enterprises
of various forms of ownership and sizes showed similar preferences (see exhibits 54 and 55).
!"#$#%&'(#)*+*,-./#0*'1-* >>
China sourcing survey

Exhibit 54: Performance indicators of suppliers by form of ownership of enterprises
Note: Multiple responses allowed
Exhibit 55: Performance indicators of suppliers by size of enterprises
Note: Multiple responses allowed
ii. Execution of supplier evaluation system
Selecting right suppliers and monitoring their ongoing performance greatly rely on the evaluation
system for suppliers. And execution of such system is the key to the effectiveness. According to
the survey, 51.3% of respondents thought that the execution of evaluation system was good or
very good (see exhibit 56). However, the level of execution in SOEs was noteworthy: Over 60% of
respondents from SOEs thought that the execution was poor or just fair. This suggests that more
efforts should be put in boosting their execution power.
0/"',#3&-./,+"'(#4*5*6789*'1#)*87-1#:;<2<=>?

Exhibit 56: Execution of supplier evaluation system by form of ownership of enterprises
iii. Departments or other parties involved in monitoring supplier performance
According to the survey, besides sourcing department, R&D/ engineering design and production/
manufacturing departments also participated in supplier evaluation in most surveyed enterprises.
Enterprises of various forms of ownership and sizes also showed similar pattern except for
SOEs. As for the case of SOEs, clients played a more signi!cant role in supplier monitoring.
Exhibits 57 and 58 give more information.
Exhibit 57: Departments or other parties involved in monitoring supplier performance by
form of ownership of enterprises
Note: Multiple responses allowed
!"#$#%&'(#)*+*,-./#0*'1-* >@
China sourcing survey

Exhibit 58: Departments or other parties involved in monitoring supplier performance by
size of enterprises
Note: Multiple responses allowed
II. Supplier performance
i. Relationship between enterprises and suppliers
A signi!cant proportion of supplier with stable relationship is one of the indicators re"ecting
whether the sourcing process is well-developed. Last year’s survey suggested that about 48.4%
of the surveyed enterprises had established stable relationships with more than half of their
suppliers. This year, the percentage rose 15.8 percentage points to 64.2%. Moreover, only 12.7%
of the respondents said that they had established stable relationships with less than 10% of their
suppliers, improving greatly from last year (44%). Overall, FIEs and large-sized enterprises did a
better job than their counterparts. Exhibits 59 and 60 give more details.
0/"',#3&-./,+"'(#4*5*6789*'1#)*87-1#:;<2<=>A

Exhibit 59: Proportion of suppliers with stable relationship by form of ownership of
enterprises
Exhibit 60: Proportion of suppliers with stable relationship by size of enterprises
Proportion of principal suppliers is another important indicator contributing to the success of
enterprises. According to the survey, 14.4% of the surveyed enterprises indicated the proportion
of their principal suppliers increased last year. Among different forms of enterprises, SOEs
performed slightly better than their counterparts. Please see exhibit 61 for more information.
!"#$#%&'(#)*+*,-./#0*'1-* >B
China sourcing survey

Exhibit 61: Proportion of principal suppliers increased last year
ii. Degree of participation by suppliers in R&D
The degree of cooperation with suppliers in R&D is also important for an enterprise. According
to the survey, over 60% of the respondents reported that the involvement of their suppliers in
the early stage of R&D was none or little, suggesting that most enterprises was yet to recognize
the importance of cooperating with suppliers in the area of R&D. Overall, FIEs and large-sized
enterprises involved suppliers in early stage of R&D in a more actively manner (see exhibits 62
and 63).
Exhibit 62: Degree of participation by suppliers in the early stage of research and
development by form of ownership of enterprises
0/"',#3&-./,+"'(#4*5*6789*'1#)*87-1#:;<2<=>C

Exhibit 63: Degree of participation by suppliers in the early stage of research and
development by size of enterprises
8. Informatization
i. Adoption of bar code system
Among the surveyed enterprises, 72% of them adopted bar code systems for their raw materials.
However, less than half of them admitted that the usage of bar code was fully incorporated into
all business and operational units. As shown in exhibit 64, in general, the larger the enterprises,
the more widely adoption of bar code system across the enterprises.
Exhibit 64: Adoption of bar code system across various business and operational units
within the enterprise
ii. Use of information technology
Exhibits 65 and 66 show the application of information system of the surveyed enterprises.
The mostly used information system among the surveyed enterprises was Enterprise Resource
Planning (ERP), with 76.4% of respondents had it already in place. Data Warehouse and Data
Mining came second, with 32.2% of application among the respondents.
!"#$#%&'(#)*+*,-./#0*'1-* >D
China sourcing survey
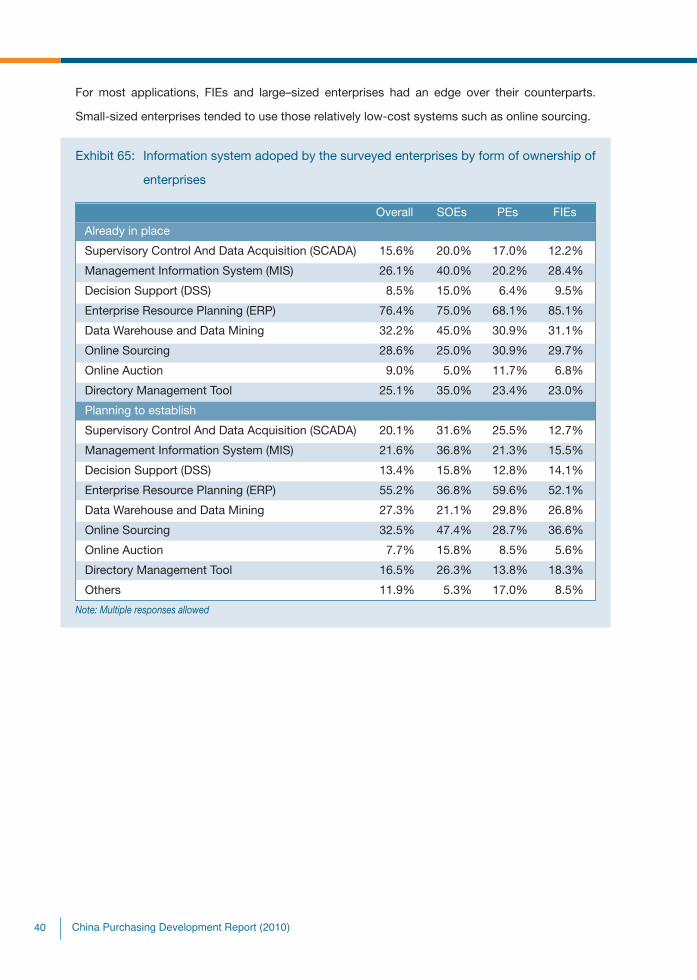
For most applications, FIEs and large–sized enterprises had an edge over their counterparts.
Small-sized enterprises tended to use those relatively low-cost systems such as online sourcing.
Exhibit 65: Information system adoped by the surveyed enterprises by form of ownership of
enterprises
Overall SOEs PEs FIEs
Already in place
Supervisory Control And Data Acquisition (SCADA) 15.6% 20.0% 17.0% 12.2%
Management Information System (MIS) 26.1% 40.0% 20.2% 28.4%
Decision Support (DSS) 8.5% 15.0% 6.4% 9.5%
Enterprise Resource Planning (ERP) 76.4% 75.0% 68.1% 85.1%
Data Warehouse and Data Mining 32.2% 45.0% 30.9% 31.1%
Online Sourcing 28.6% 25.0% 30.9% 29.7%
Online Auction 9.0% 5.0% 11.7% 6.8%
Directory Management Tool 25.1% 35.0% 23.4% 23.0%
Planning to establish
Supervisory Control And Data Acquisition (SCADA) 20.1% 31.6% 25.5% 12.7%
Management Information System (MIS) 21.6% 36.8% 21.3% 15.5%
Decision Support (DSS) 13.4% 15.8% 12.8% 14.1%
Enterprise Resource Planning (ERP) 55.2% 36.8% 59.6% 52.1%
Data Warehouse and Data Mining 27.3% 21.1% 29.8% 26.8%
Online Sourcing 32.5% 47.4% 28.7% 36.6%
Online Auction 7.7% 15.8% 8.5% 5.6%
Directory Management Tool 16.5% 26.3% 13.8% 18.3%
Others 11.9% 5.3% 17.0% 8.5%
Note: Multiple responses allowed
0/"',#3&-./,+"'(#4*5*6789*'1#)*87-1#:;<2<=?<

Exhibit 66: Information system adopted by the surveyed enterprises by size of enterprises
Large-sized Medium-sized Small-sized
enterprises enterprises enterprises
Already in place
Supervisory Control And Data Acquisition (SCADA) 14.4% 14.3% 20.5%
Management Information System (MIS) 25.6% 27.1% 25.6%
Decision Support (DSS) 5.6% 11.4% 10.3%
Enterprise Resource Planning (ERP) 87.8% 70.0% 61.5%
Data Warehouse and Data Mining 23.3% 38.6% 41.0%
Online Sourcing 25.6% 28.6% 35.9%
Online Auction 8.9% 7.1% 12.8%
Directory Management Tool 16.7% 25.7% 43.6%
Planning to establish
Supervisory Control And Data Acquisition (SCADA) 18.8% 18.8% 25.0%
Management Information System (MIS) 17.6% 17.4% 37.5%
Decision Support (DSS) 12.9% 10.1% 20.0%
Enterprise Resource Planning (ERP) 51.8% 58.0% 57.5%
Data Warehouse and Data Mining 17.6% 31.9% 40.0%
Online Sourcing 29.4% 36.2% 32.5%
Online Auction 8.2% 5.8% 10.0%
Directory Management Tool 9.4% 23.2% 20.0%
Others 7.1% 15.9% 15.0%
Note: Multiple responses allowed
In general, adoption of online sourcing and online auction were not common among the surveyed
enterprises. In terms of online sourcing and online auction costs, it accounted for 27.6%
and 9.5% of the total sourcing costs respectively for the enterprises. SOEs and small-sized
enterprises spent the most on online sourcing. As for online auction, FIEs and small-sized were
more receptive with this approach. Exhibits 67 and 68 present a more detailed picture.
!"#$#%&'(#)*+*,-./#0*'1-* ?2
China sourcing survey

Exhibit 67: Share of total sourcing costs by online sourcing and online auction by form of
ownership of enterprises
Exhibit 68: Share of total sourcing costs by online sourcing and online auction by size of
enterprises
Overall, 27.4% of the surveyed enterprises said their principal suppliers were capable of online
sourcing. In general, more principal suppliers of SOEs and small-sized enterprises were capable
of online sourcing (see exhibits 69 and 70).
Exhibit 69: Prinicpal suppliers with online sourcing capability by form of ownership of
enterprises
Exhibit 70: Prinicpal suppliers with online sourcing capability by size of enterprises
0/"',#3&-./,+"'(#4*5*6789*'1#)*87-1#:;<2<=?;

Many enterprises are aware of the important role of informatization in modernizing the sourcing
activities. However, many challenges have to be overcome before they apply these IT systems. The
survey revealed that the major obstacles barring enterprises were lack of talents who know both
business and IT business well (48.8%), dif!culty in identifying appropriate partners for informatization
(43.8%) and inaccurate data (40.4%). The problem of lack of talents was utmost serious among SOEs
and small-sized enterprises. Exhibits 71 and 72 show more details.
Exhibit 71: Major obstacles for infomatization by form of ownership of enterprises
Note: Multiple responses allowed
Exhibit 72: Major obstacles for infomatization by size of enterprises
Note: Multiple responses allowed
!"#$#%&'(#)*+*,-./#0*'1-* ?>
China sourcing survey

9. Green sourcing
i. Products meeting national green standards
Green sourcing is gaining attention among enterprises as consumers are becoming more and
more conscious of green issues. And the Chinese government has been actively promoting
environmental protection as well as sustainable development. According to the survey, more
than half of the respondents said their products met the national green standards. As shown in
exhibits 73 and 74, a larger proportion of SOEs and large-sized enterprises said their products
met the national green standards. 75.5% of the suppliers of the surveyed enterprises provided
products meeting national green standards. FIEs and large-sized enterprises took the lead in
having more suppliers providing products meeting national green standards. Exhibits 75 and 76
give more details.
Exhibit 73: Products meeting national green standards by form of ownership of enterprises
Exhibit 74: Products meeting national green standards by size of enterprises
Exhibit 75: Proportion of suppliers providing products meeting national green standards by
form of ownership of enterprises
0/"',#3&-./,+"'(#4*5*6789*'1#)*87-1#:;<2<=??

Exhibit 76: Proportion of suppliers providing products meeting national green standards by
size of enterprises
ii. Factors affecting practising green sourcing
The three major factors affecting green sourcing practice were cost (68.5%), new sources of raw
materials (65.0%) and technology and process innovation (61.0%) respectively. Cost was the
core factor of green sourcing adoption across all sizes and forms of ownership of enterprises.
Please see exhibits 77 and 78 for more details.
Exhibit 77: Factors affecting practising green sourcing by form of ownership of enterprises
!"#$#%&'(#)*+*,-./#0*'1-* ?@
China sourcing survey

Exhibit 78: Factors affecting practising green sourcing by size of enterprises
iii. Awareness on environmental protection of enterprises
73% of the surveyed enterprises said they had complied with laws and regulations in toxic
waste disposal. The compliance rate was higher for FIEs, SOEs and large-sized enterprises (see
exhibits 79 and 80).
Exhibit 79: Compliance with laws and regulations in toxic waste disposal by form of
ownership of enterprises
Exhibit 80: Compliance with laws and regulations in toxic waste disposal by size of
enterprises
0/"',#3&-./,+"'(#4*5*6789*'1#)*87-1#:;<2<=?A
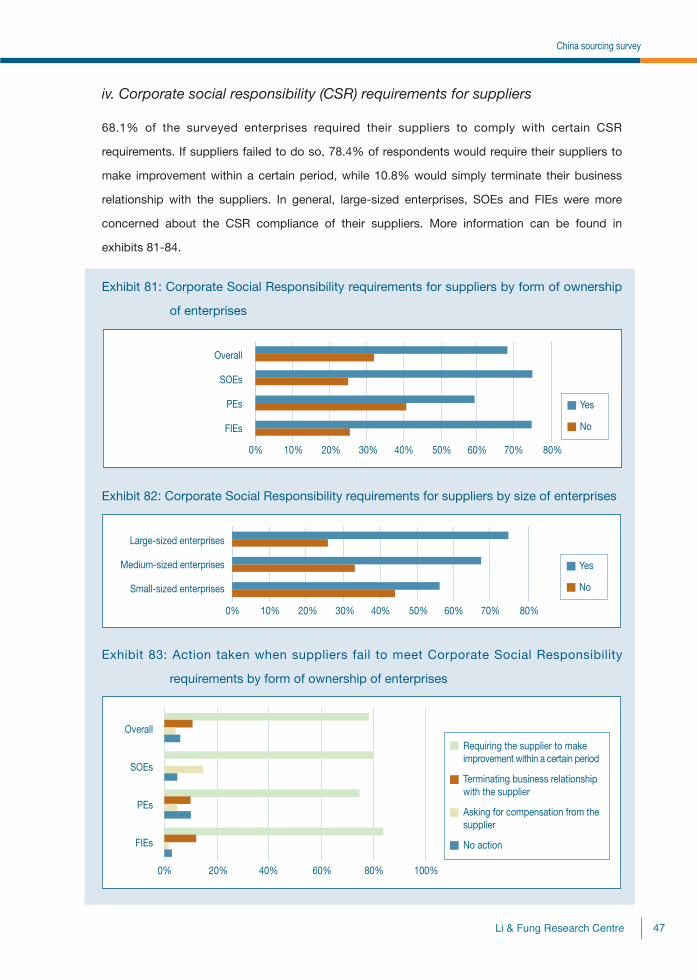
iv. Corporate social responsibility (CSR) requirements for suppliers
68.1% of the surveyed enterprises required their suppliers to comply with certain CSR
requirements. If suppliers failed to do so, 78.4% of respondents would require their suppliers to
make improvement within a certain period, while 10.8% would simply terminate their business
relationship with the suppliers. In general, large-sized enterprises, SOEs and FIEs were more
concerned about the CSR compliance of their suppliers. More information can be found in
exhibits 81-84.
Exhibit 81: Corporate Social Responsibility requirements for suppliers by form of ownership
of enterprises
Exhibit 82: Corporate Social Responsibility requirements for suppliers by size of enterprises
Exhibit 83: Action taken when suppliers fail to meet Corporate Social Responsibility
requirements by form of ownership of enterprises
!"#$#%&'(#)*+*,-./#0*'1-* ?B
China sourcing survey

Exhibit 84: Action taken when suppliers fail to meet Corporate Social Responsibility
requirements by size of enterprises
0/"',#3&-./,+"'(#4*5*6789*'1#)*87-1#:;<2<=?C

*F!GFGHIJKJ!LM!NOPQRGJKFS!GQTKUKTKVJ!GFW!JLOPQKFS!JKTOGTKLFJ!
XKTR!'<3!GFW!/<3
CY!#RV!ZGFOMGQTOPKFS!JVQTLP
The CFLP China Manufacturing Purchasing Managers’ Index (PMI) provides an early indicator
each month of economic activities in the Chinese manufacturing sector. It is compiled by the
China Federation of Logistics & Purchasing (CFLP) and the China Logistics Information Centre
(CLIC), based on data collected by the National Bureau of Statistics (NBS). The PMI was
launched in January 2005.
Every month questionnaires on their purchasing activities and supply situations are sent to over
800 manufacturing enterprises all over China. There are 11 indicators in the survey: Output, New
Orders, New Export Orders, Backlogs of Orders, Stocks of Finished Goods, Purchases of Inputs,
Imports, Input Prices, Stocks of Major Inputs, Employment and Suppliers’ Delivery Time. An
index reading above 50% indicates an overall positive change in that variable; below 50%, an
overall negative change.
The PMI is a composite index based on the seasonally adjusted diffusion indices for !ve of
the indicators with varying weights: New Orders – 30%; Output – 25%; Employment – 20%;
Suppliers’ Delivery Times – 15%; and Stocks of Major Inputs – 10%. A PMI reading above 50%
indicates an overall expansion in the manufacturing sector; below 50, an overall contraction.
The post-crisis recovery is well on track, yet recent PMI readings indicate
growth moderation in the manufacturing sector
The headline PMI has stayed above the “expansionary 50-mark” for 18 consecutive months,
showing that the post-crisis recovery is suf!ciently solid and self-sustaining (see exhibit 1).
However, the headline PMI has trended downward since April 2010, indicating growth
moderation in the manufacturing sector. Though the headline PMI rebounded from 51.2% in July
to 51.7% in August, the July reading and the August reading were still the lowest and the second
lowest since March 2009. The moderation in industrial activity was attributable to government
tightening on the property sector and local government borrowing, as well as mandatory
requirement to shut down energy-inef!cient factories.
!"#$#%&'(#)*+*,-./#0*'1-* ?D
*F!GFGHIJKJ!LM!NOPQRGJKFS!GQTKUKTKVJ!GFW!JLOPQKFS!JKTOGTKLFJ!XKTR!'<3!GFW!/<3

The modest rebound in the August PMI suggests that the Chinese economy will not slide into
recession. Looking forward, we expect the headline PMI to "uctuate between 52-54 in 4Q10.
Industrial activities will be boosted by Beijing’s accelerated efforts to build public housing. The
improving auto market may become another favourable factor, if the improvement continues in
the coming months. Downside risks, however, include the extent of the slowdown in property
investment by real estate developers, the uncertainties about the global economy and China’s
export growth, as well as the policy intensity to get rid of backward production capacities,
energy-intensive and highly-polluting industries.
We believe the government will keep its ‘neutral’ monetary policy stance unchanged for the rest
of the year. It will continue to regulate local government !nancing vehicles, but is unlikely to raise
interest rate or reserve requirement ratio (RRR). Neither do we think the government will ease its
crackdown measures on real estate speculation, as housing prices have barely gone down this
year. However, to avoid a sharp slowdown in growth, Beijing will increase investment spending
on public housing. We also believe the government will be persistent in pushing forward
structural reforms.
Exhibit 1: Monthly PMI, Jan 2009 – Aug 2010
Source: China Federation of Logistics & Purchasing
The output index re"ects overall production activities of the manufacturing sector. The index has
stayed above the critical level of 50% since February 2009, indicating continuous expansion of
output of the manufacturing sector (see exhibit 2).
0/"',#3&-./,+"'(#4*5*6789*'1#)*87-1#:;<2<=@<

Exhibit 2: Output index, Jan 2009 – Aug 2010
Source: China Federation of Logistics & Purchasing
Domestic demand recovered earlier and grew faster than foreign demand
The new orders index, which covers both domestic and foreign demand, has stayed above 50%
since February 2009 for 19 months.
The new export orders index has stayed above 50% since May 2009 for 16 months. The two
indices show that both domestic and foreign demand for Chinese manufactured products have
been on the rise (see exhibit 3).
The new orders index rose above the 50%-line earlier than the new export orders index,
implying that domestic demand recovered earlier than foreign demand, boosted by the Chinese
government’s stimulus package to support domestic demand in late 2008. One should also note
that the new orders index was higher than the new export orders index throughout February 2009
to August 2010, indicating that domestic demand grew faster than foreign demand.
!"#$#%&'(#)*+*,-./#0*'1-* @2
*F!GFGHIJKJ!LM!NOPQRGJKFS!GQTKUKTKVJ!GFW!JLOPQKFS!JKTOGTKLFJ!XKTR!'<3!GFW!/<3

Exhibit 3: New orders index and new export orders index, Jan 2009 – Aug 2010
Source: China Federation of Logistics & Purchasing
Chinese manufacturers have faced mounting cost pressure
The input prices index re"ects changes in manufacturers’ production cost. Chinese manufacturers
have faced increasing cost pressure since April 2009 (see exhibit 4). In particular, prices of major
inputs rose at an accelerated pace in December 2009 and January 2010, when the input price index
registered the highest readings since August 2008. Although the index eased a bit in February 2010,
it quickly rebounded in March and then jumped to reach another peak in April 2010. The index
moderated to 58.9% in May and further dropped to 50.4% in July 2010. However, it surged by 10.1
percentage points to 60.5% in August 2010. The latest index reading raises renewed concern about
the problems of production cost pressure and squeezed producers’ margins, as well as suggests
stronger in"ationary pressure on downstream prices in the near and medium term. !
Exhibit 4: Input prices index, Jan 2009 – Aug 2010
Source: China Federation of Logistics & Purchasing
0/"',#3&-./,+"'(#4*5*6789*'1#)*87-1#:;<2<=@;

2. The non-manufacturing sector
The CFLP China Non-Manufacturing Index (NMI) serves as an early indicator of economic activities
in China’s non-manufacturing sector. Every month, questionnaires are sent to non-manufacturing
enterprises in 20 industries, which are categorized into producer services, consumer services and
construction business. There are 10 indicators in the survey: Business Activity, New Orders, New
Export Orders, Backlogs of Orders, Stocks, Input Prices, Prices Charged, Employment, Suppliers’
Delivery Time and Business Activity Forecast. Survey responses re"ect the change of each indicator,
if any, in the current month compared to the previous month. Unlike the PMI, there is no composite
index for China’s NMI, and the business activity index of every month is quoted as the NMI of the
month. An NMI reading above 50% indicates an overall expansion in the non-manufacturing sector;
below 50%, an overall contraction. Data have been collected since January 2007 and the !rst NMI
was published in January 2008.
Recent NMI readings showed steady recovery of the non-manufacturing sector
Exhibit 5 demonstrates the NMI readings from January 2009 to August 2010. The NMI stayed
above 50% throughout the period (except in February 2009 and February 2010 - the Chinese
New Year - when many businesses were not operating during the holiday), indicating that the
non-manufacturing sector kept expanding.
The NMI has been, in general, higher than the PMI for the past 20 months, denoting a stronger
recovery in the non-manufacturing sector than in the manufacturing sector. !
Exhibit 5: Business activity index, Jan 2009 – Aug 2010
Source: China Federation of Logistics & Purchasing
!"#$#%&'(#)*+*,-./#0*'1-* @>
*F!GFGHIJKJ!LM!NOPQRGJKFS!GQTKUKTKVJ!GFW!JLOPQKFS!JKTOGTKLFJ!XKTR!'<3!GFW!/<3

Domestic demand showed stronger recovery than foreign demand
The new orders index re"ects the overall demand for services, including both domestic and
foreign demand, while the new export orders index covers demand from foreign clients only.
The new orders index averaged at 52.6% in year 2009, showing that demand was growing
steadily. The index peaked in April 2010 (58.7%). It moderated in the following two months, but
then rebounded to 55.8% in July 2010 and further to 56.2% in August 2010 (see exhibit 6).
The new export orders index averaged at 47.2% in 2009, indicating an overall contraction in
orders from foreign clients in the year. The situation has improved this year. The index has stayed
above 50% for six consecutive months since March 2010, con!rming the recovery of foreign
demand for services (see also exhibit 6).
Throughout January 2009 to August 2010, the new orders index has generally been higher than
the new export orders index, indicating that domestic demand has been growing faster than
foreign demand. This is largely a result of the government policy to boost domestic demand.
Exhibit 6: New orders and new export orders indices, Jan 2009 – Aug 2010
Source: China Federation of Logistics & Purchasing
Increasing cost pressure for enterprises in the non-manufacturing sector
The input prices index re"ects the changes in the cost of inputs incurred by the enterprises
surveyed, while the prices charged index re"ects the prices charged when enterprises sell their
services. As shown in exhibit 7, the input prices index was always higher than the prices charged
0/"',#3&-./,+"'(#4*5*6789*'1#)*87-1#:;<2<=@?
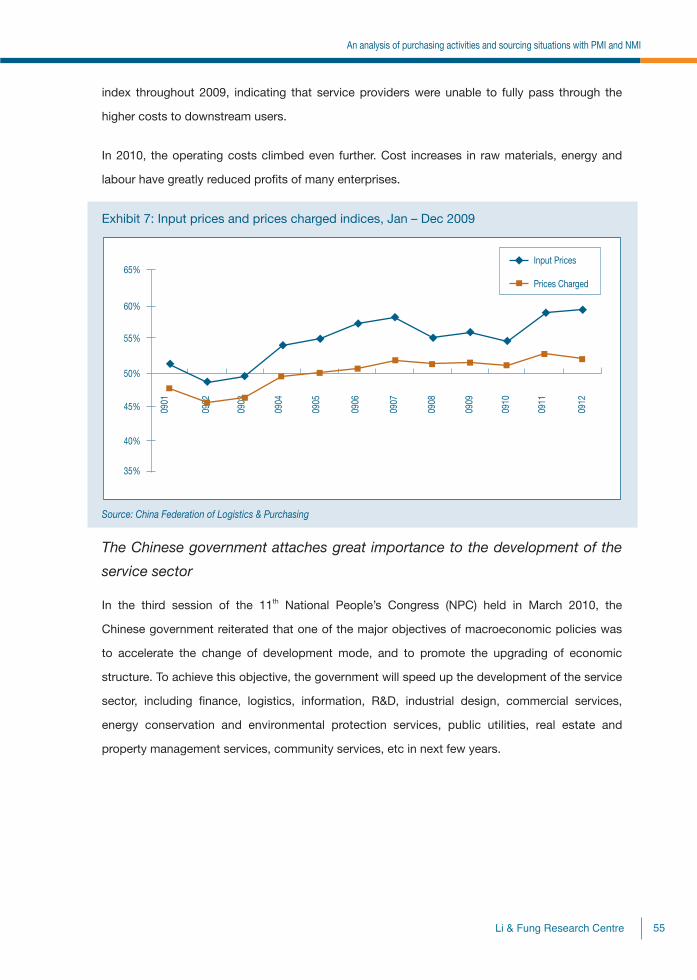
index throughout 2009, indicating that service providers were unable to fully pass through the
higher costs to downstream users.
In 2010, the operating costs climbed even further. Cost increases in raw materials, energy and
labour have greatly reduced pro!ts of many enterprises.
Exhibit 7: Input prices and prices charged indices, Jan – Dec 2009
Source: China Federation of Logistics & Purchasing
The Chinese government attaches great importance to the development of the
service sector
In the third session of the 11th National People’s Congress (NPC) held in March 2010, the
Chinese government reiterated that one of the major objectives of macroeconomic policies was
to accelerate the change of development mode, and to promote the upgrading of economic
structure. To achieve this objective, the government will speed up the development of the service
sector, including !nance, logistics, information, R&D, industrial design, commercial services,
energy conservation and environmental protection services, public utilities, real estate and
property management services, community services, etc in next few years.
!"#$#%&'(#)*+*,-./#0*'1-* @@
*F!GFGHIJKJ!LM!NOPQRGJKFS!GQTKUKTKVJ!GFW!JLOPQKFS!JKTOGTKLFJ!XKTR!'<3!GFW!/<3

Sourcing light-manufactured consumer products in China: cost trends and outlook
Part One: Major Price Indicators
1. China’s CPI growth reached 3.5% yoy in August, the highest in twenty-
two months
The yoy growth rate of China’s consumer price index (CPI)1 softened from 2.7% in February to
2.4% in March, and has been on an upward trend since then. The CPI growth rose to 3.3% yoy
in July and further reached 3.5% yoy in August, the highest in twenty-two months, due largely to
higher prices of vegetables and meat triggered by the recent rainstorms, "oods and hot weather
in China. The price index of food, which weighs 33.2% in the CPI accounting, rose by 7.5% yoy,
whilst that of non-food grew by 1.5% yoy in August. (See exhibit 1 & 2)
Particularly noteworthy is that the month-on-month (mom) growth of CPI has rebounded since
July. The price index registered positive mom growth of 0.4% and 0.6% in July and August
respectively, after dropping by 0.1% mom and 0.6% mom in May and June respectively.
Looking ahead, China’s CPI will be supported by factors such as rising labour costs, pass-
through of upstream price pressures, strengthening domestic demand, the buildup of in"ationary
expectations, tighter food supply due to natural disasters, as well as speculation in agricultural
commodities. It is likely that food prices will go down and the CPI growth will slow, if weather
conditions in China improve. We expect the CPI growth in FY10 to exceed the government target
of 3.0% and hit 4%.
1 The CPI, compiled by the National Bureau of Statistics of China, measures the price of a basket of 600-700 goods and services that a typical household purchases.
0/"',#3&-./,+"'(#4*5*6789*'1#)*87-1#:;<2<=@A

2 The PPI, compiled by the National Bureau of Statistics of China, measures the prices of industrial products when they are sold for the !rst time after production.
Exhibit 1: China’s CPI growth, Sep 2008 - Aug 2010
Source: National Bureau of Statistics, PRC
Exhibit 2: China’s CPI growth by selected commodity, Mar - Aug 2010
Mar Apr May Jun Jul Aug
yoy growth (%)
Clothing -1.1 -1.3 -1.2 -1.0 -0.8 -1.2
Household services, maintenance and -0.7 -0.5 -0.3 0.0 0.2 0.4
renovation
Recreational, educational products & 0.3 0.4 0.6 0.9 1.1 1.2
services
Source: National Bureau of Statistics, PRC
2. PPI growth peaked in May 2010, and has been on a downward trend
since then
The growth rate of China’s producer price index (PPI)2 rose from 5.9% yoy in March to 6.8% yoy
in April, and peaked at 7.1% yoy in May. Afterwards, it softened to 6.4% yoy in June, 4.8% yoy in
July and 4.3% yoy in August. (See exhibit 3)
Sep-09 -0.8%
Oct -0.5%
Nov 0.6%
Dec 1.9%
Jan-10 1.5%
Feb 2.7%
Mar 2.4%
Apr 2.8%
May 3.1%
Jun 2.9%
Jul 3.3%
Aug 3.5%
!"#$#%&'(#)*+*,-./#0*'1-* @B
Sourcing light-manufactured consumer products in China: cost trends and outlook

Despite the recent decline in PPI growth, we believe ex-factory prices will stay !rm in the near
future, bolstered by improving domestic and export demand, pass-through of upstream price
pressures, and mounting labour costs. It is noteworthy that, as of 10 September 2010, the
minimum wage levels in 28 provinces/municipalities in China have been revised upward. Besides,
there have been a number of strikes in coastal provinces recently, with workers asking for salary
increase. Many employers have offered considerable pay-rise to settle labour disputes. Detailed
discussion can be found in Part four.
Exhibit 3: China’s PPI growth, Sep 2008 - Aug 2010
Source: National Bureau of Statistics, PRC
Exhibit 4: China’s PPI growth by selected industry, Mar - Aug 2010
Mar Apr May Jun Jul Aug
yoy growth (%)
Textile industry 5.3 6.6 7.5 8.2 8.2 8.6
Textile, clothing and footwear production 1.7 1.6 1.8 1.6 1.9 1.3
Leather, furs, down and related products 0.8 1.1 1.6 1.6 2.2 1.9
Timber processing & wood, bamboo, cane, 0.6 1.2 1.7 1.8 1.9 1.9
palm !ber and straw products
Source: National Bureau of Statistics, PRC
Sep-09 -7.0%
Oct -5.8%
Nov 2.1%
Dec 1.7%
Jan-10 4.3%
Feb 5.4%
Mar 5.9%
Apr 6.8%
May 7.1%
Jun 6.4%
Jul 4.8%
Aug 4.3%
0/"',#3&-./,+"'(#4*5*6789*'1#)*87-1#:;<2<=@C

Part Two: Raw Material Prices
1. The growth rate of China’s purchasing price index of raw material, fuel
and power has declined since May
The yoy growth rate of China’s purchasing price index of raw material, fuel and power3 picked up
from 10.3% in February to 11.5% in March, and then reached 12.0% in April and 12.2% in May,
the highest in twenty months, before declining all the way to 7.5% in August. (See exhibit 5 & 6)
The positive growth of the price index re"ected the increase in prices of production inputs,
underlining the problems of production cost pressure and squeezed margins for Chinese
manufacturers. It also suggests stronger in"ationary pressure on downstream prices in the near
and medium term.
Looking ahead, we do not expect the yoy growth rate of this index to fall much in the near
future, despite the higher comparison base in 4Q09. Some price indicators show that prices
of production inputs have picked up again. For example, the input prices sub-index of China’s
manufacturing PMI rebounded strongly from the recent low of 50.4 in July to 60.5 in August.
Another index indicating input prices compiled by the Ministry of Commerce shows that input
prices have started an upward trend again since mid July and reached the recent peak in late
August, the highest level since late May.
3 The purchasing price index for raw material, fuel and power, compiled by the National Bureau of Statistics of China, measures the prices of production inputs such as raw materials, fuels and power purchased by industrial enterprises.
!"#$#%&'(#)*+*,-./#0*'1-* @D
Sourcing light-manufactured consumer products in China: cost trends and outlook

Exhibit 5: China’s purchasing price index of raw material, fuel and power, Sep 2008 - Aug
2010 (% yoy growth)
Source: National Bureau of Statistics, PRC
Exhibit 6: China’s purchasing price index of raw material, fuel and power by selected
commodity, Mar - Aug 2010
Mar Apr May Jun Jul Aug
yoy growth (%)
Fuel & power 25.6 24.0 23.4 19.5 12.0 10.2
Non-ferrous metals 32.8 29.1 26.0 21.1 19.5 16.6
Raw materials for chemical industry 6.9 7.4 7.8 7.2 6.7 5.9
Timber and paper pulp 1.4 2.7 4.0 3.4 2.7 4.1
Textile raw materials 4.5 5.5 5.7 5.9 6.3 6.1
Source: National Bureau of Statistics, PRC
(i) Purchasing price index of fuel & power
The growth rate of the purchasing price index of fuel & power has been on a downward trend,
declining all the way from 25.6% yoy in March to 10.2% yoy in August. (See exhibit 6)
(ii) Purchasing price index of non-ferrous metals
The growth rate of the purchasing price index of non-ferrous metals came in at 16.6% yoy in
August, having declined for !ve consecutive months. (See exhibit 6)
Sep-09 -10.1%
Oct -8.4%
Nov -3.6%
Dec 3.0%
Jan-10 8.0%
Feb 10.3%
Mar 11.5%
Apr 12.0%
May 12.2%
Jun 10.8%
Jul 8.5%
Aug 7.5%
0/"',#3&-./,+"'(#4*5*6789*'1#)*87-1#:;<2<=A<

(iii) Purchasing price index of raw materials for chemical industry
The growth rate of purchasing price index of raw materials for chemical industry was on an
upward trend, rising all the way from 5.4% yoy in February to 7.8% yoy in May. Afterwards, the
growth rate of the index fell all the way to 5.9% yoy in August.(See exhibit 6)
(iv) Purchasing price index of timber and paper pulp
The growth rate of the purchasing price index of timber and paper pulp turned positive in March,
and then "uctuated within the range of 2.7-4.1% yoy throughout April to August 2010. (See
exhibit 6)
(v) Purchasing price index of textile raw materials
The growth rate of the purchasing price index of textile raw materials increased all the way from
1.1% yoy in Dec 2009 to 6.3% yoy in July 2010, before edging down to 6.1% yoy in August. (See
exhibit 6)
2. China’s cotton price indices trended upward throughout mid February to
early July, and have softened since then
After plateauing in January and early February, China’s cotton price indices4 were on an
increasing trend throughout mid February to early July. Since then, the price indices have
moderated. The CC Index 328, for example, climbed from 14912 on 21 February to the recent
peak of 18419 on 9 July, and then moderated to 18005 on 31 August. Overall, the prices of this
type of cotton increased by about 21% in the !rst eight months of 2010. (See exhibit 7)
The sharp rise in domestic cotton prices was driven by strong downstream demand from both
China and foreign countries, falling supply of cotton, as well as increasing global cotton prices.
Due to poor weather and reduction in planting area, China’s cotton output declined by 14.6% yoy
in 2009. The decline is widely expected to continue in 2010.
Global cotton prices have also recorded strong rise so far this year, due largely to the reduction
in global output of cotton, as well as improving demand. The Cotlook A index, one of the major
global price indices of cotton, went up from 78.45 on 4 January 2010 to 94.20 on 31 August.
4 The indices, compiled by the China Cotton Association, track cotton prices quoted from two hundred textile enterprises.
http://www.china-cotton.org/
!"#$#%&'(#)*+*,-./#0*'1-* A2
Sourcing light-manufactured consumer products in China: cost trends and outlook

While China’s cotton output cannot meet the domestic demand, China has continued to import
large amounts of cotton from other countries in recent years. Besides, to increase supply in the
domestic cotton market, the Chinese government raised import quotas of cotton in May and has
released part of the state reserve since early August. It seems that such efforts have contributed
to the recent moderation of cotton prices.
Looking ahead, we do not expect cotton prices to fall much for the rest of the year, especially as
domestic cotton output is set to decrease due to the severe weather conditions.
Exhibit 7: China’s cotton price indices, Sep 2009 - Aug 2010
Source: China Cotton Association
3. Nanjing Wool Market Composite Index rebounded in June, and then
moderated a bit in July
The Nanjing Wool Market Composite Index5, one of the major wool price indices in China, stayed
at high level throughout late January to April 2010. Afterwards, the price index declined from
58.37 yuan per kg at end-April to 55.94 yuan per kg at end-May, but then rebounded to 57.59
yuan per kg at end-June. (See exhibit 8)
5 http://www.woolmarket.com.cn/
0/"',#3&-./,+"'(#4*5*6789*'1#)*87-1#:;<2<=A;

Note that the Nanjing Wool Market Composite Index would be signi!cantly affected by the
exchange rate movements of the currencies of Australia and New Zealand, the major wool
exporters. The drop in the wool price index in May was largely attributable to the depreciation
of the Australian dollar against the RMB in May. The decline in the Australian Wool Exchange
(AWEX) Eastern market indicator, one of the major wool price indices in Australia, was
comparatively slight in Australia dollar terms.
In July, the Australian dollar appreciated strongly by more than 6% against the RMB, thereby
putting upward pressure on wool prices in RMB terms. However, such impact was offset by the
weak demand from textile manufacturers in the month, traditionally the low season. The wool
price index softened by 0.3% from the previous month to 57.42 yuan per kg at end-July.
Supported by growing downstream demand from advanced economies and tight supply, wool
prices are expected to stay !rm in the short to medium term. Both Australia and New Zealand
have witnessed reduction in wool production in recent years. One major cause is that many wool
producers have switched to meat production in response to higher meat prices.
Exhibit 8: Nanjing Wool Market Composite Index, Aug 2009 - Jul 2010
Aug-09 Sep Oct Nov Dec Jan-10 Feb Mar Apr May Jun Jul
Month-end 48.73 51.20 54.34 54.64 55.36 58.14 57.65 58.14 58.37 55.94 57.59 57.42
index
(yuan/kg)
Source: The Nanjing Wool Market
4. Price indices of polyester moderated in the second half of August
After trending upward in Apr 2010, the price indices of polyester6 moderated in May, due to the
drop in puri!ed terephthalic acid (PTA)7 prices (which in turn was due to the decrease in crude
oil prices). The indices picked up again in the second half of June, as a result of the market
expectation of falling supply of polyester in China, as well as the rebound in crude prices. (See
exhibit 9)
6 The indices are complied by the China Chemical & Fiber Economic Information Network (CCFEI).7 Puri!ed terephthalic acid (PTA) is a commodity chemical used primarily in polyester production.
!"#$#%&'(#)*+*,-./#0*'1-* A>
Sourcing light-manufactured consumer products in China: cost trends and outlook
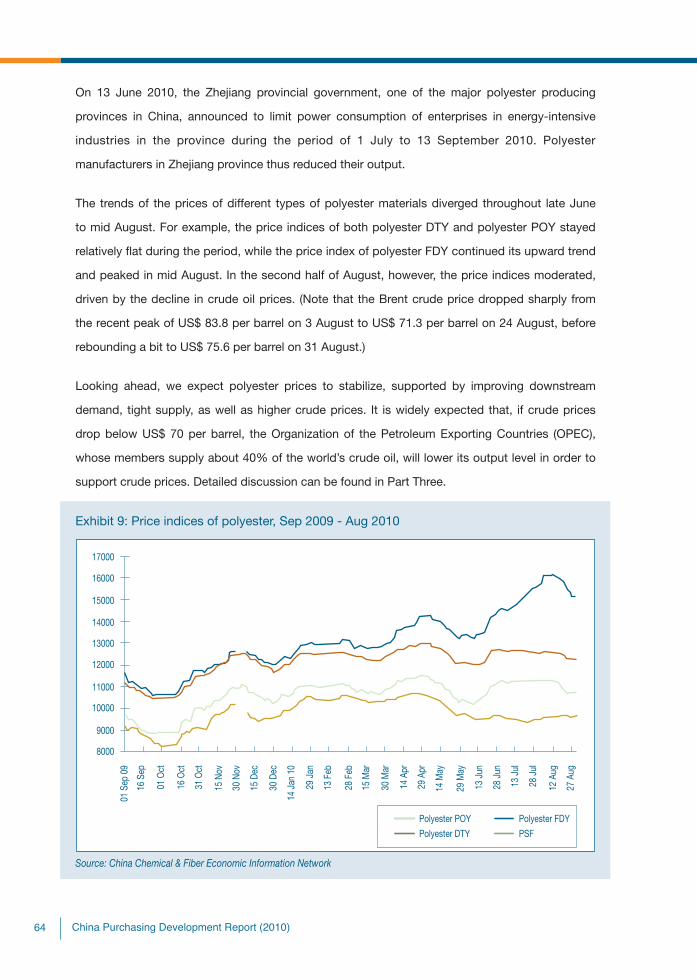
On 13 June 2010, the Zhejiang provincial government, one of the major polyester producing
provinces in China, announced to limit power consumption of enterprises in energy-intensive
industries in the province during the period of 1 July to 13 September 2010. Polyester
manufacturers in Zhejiang province thus reduced their output.
The trends of the prices of different types of polyester materials diverged throughout late June
to mid August. For example, the price indices of both polyester DTY and polyester POY stayed
relatively "at during the period, while the price index of polyester FDY continued its upward trend
and peaked in mid August. In the second half of August, however, the price indices moderated,
driven by the decline in crude oil prices. (Note that the Brent crude price dropped sharply from
the recent peak of US$ 83.8 per barrel on 3 August to US$ 71.3 per barrel on 24 August, before
rebounding a bit to US$ 75.6 per barrel on 31 August.)
Looking ahead, we expect polyester prices to stabilize, supported by improving downstream
demand, tight supply, as well as higher crude prices. It is widely expected that, if crude prices
drop below US$ 70 per barrel, the Organization of the Petroleum Exporting Countries (OPEC),
whose members supply about 40% of the world’s crude oil, will lower its output level in order to
support crude prices. Detailed discussion can be found in Part Three.
Exhibit 9: Price indices of polyester, Sep 2009 - Aug 2010
Source: China Chemical & Fiber Economic Information Network
0/"',#3&-./,+"'(#4*5*6789*'1#)*87-1#:;<2<=A?

5. Price index of acrylic staple !ber stayed stable throughout April to mid
June and has started a downward trend since early July
After rising rapidly in late February and early March, the price index of acrylic staple !ber8 stayed
stable at 22800 throughout April to mid June. Since early July, the price index has started a
downward trend, and moderated to 20700 on 27 August, due largely to the relatively weak
downstream demand, the market expectation of falling acrylic staple !ber prices, as well as
the decline in prices of acrylonitrile, a major raw material of acrylic staple !ber. The supply of
acrylonitrile has increased recently, as many acrylonitrile plants have resumed production after
being shut down for regular maintenance in early 2010. (See exhibit 10)
Note that the downstream demand has improved a bit in recent weeks, according to the local
media. It is expected that prices of acrylic staple !ber will not continue to go down in the near
term.
Exhibit 10: Price indices of acrylic, Sep 2009 - Aug 2010
Source: China Chemical & Fiber Economic Information Network
8 The index is complied by the China Chemical & Fiber Economic Information Network (CCFEI).
!"#$#%&'(#)*+*,-./#0*'1-* A@
Sourcing light-manufactured consumer products in China: cost trends and outlook

6. Price indices of nylon have trended upward again since late July
Driven by the increase in prices of caprolactam, one of the major materials of nylon, as well as
restocking activities, the price indices of nylon9 had trended upward since late February, until
they plateaued in the second half of May. The indices were on a downward trend throughout late
May to late July, along with the moderation of upstream prices. (See exhibit 11)
Besides, it is observed that, in view of high nylon prices, downstream producers tend to be
cautious about placing orders for nylon, and some producers have even switched to use other
!bres as substitutes for nylon.
Boosted by the rise in prices of caprolactam, nylon prices have trended upward again since late
July.
However, we do not expect the upward trend of the price indices of nylon to continue in the near
future, unless downstream demand recovers.
Exhibit 11: Price indices of nylon, Sep 2009 - Aug 2010
Source: China Chemical & Fiber Economic Information Network
9 The indices are complied by the China Chemical & Fiber Economic Information Network (CCFEI).
0/"',#3&-./,+"'(#4*5*6789*'1#)*87-1#:;<2<=AA

7. Price index of viscose staple !ber rebounded in early August
Boosted by the rise in prices of cotton pulp, the major raw material of viscose, the price index
of viscose staple !ber10 had trended upward since late January 2010, until it reached the recent
high of 20300 in late March to early April. Nevertheless, the price index declined throughout mid
April to early August to as low as 17200 on 3 August, due largely to weakening downstream
demand. According to the local media, downstream producers were cautious about placing
orders for viscose staple !ber. (See exhibit 12)
The mounting upstream cost pressure and the decreasing prices of viscose staple fiber
indicated that producers of viscose staple !ber were unable to pass through the higher cost
to downstream users then. To avoid making losses, viscose staple !ber producers reduced
production, thereby lowering the inventory level of viscose staple !ber.
Since early August, however, the price index of viscose staple !ber has started to rebound, as
manufacturers have collaborated to raise the ex-factory prices of viscose staple !ber.
Looking ahead, prices of viscose staple !ber are likely to go up further, bolstered by the low
inventory level, high prices of cotton pulp, as well as stronger downstream demand in the coming
months, traditionally the high season.
Exhibit 12: Price indices of viscose, Sep 2009 - Aug 2010
Source: China Chemical & Fiber Economic Information Network
10 The index is complied by the China Chemical & Fiber Economic Information Network (CCFEI).
!"#$#%&'(#)*+*,-./#0*'1-* AB
Sourcing light-manufactured consumer products in China: cost trends and outlook

8. Price index of ABS resin gained 3.6% mom in August, boosted by the
rise in prices of styrene
Although the high ABS resin prices have curbed demand from downstream manufacturers, the
price index of ABS resin11 registered positive mom growth of 6.4% and 4.0% in March and April
respectively, supported by the rise in prices of crude oil, a major raw material of ABS resin. The
price index further increased by 1.7% mom in May, despite the marked decline in global crude
prices in the month. One of the main reasons was that domestic petrochemical enterprises
opted not to reduce the ex-factory prices of ABS resin then. Afterwards, as downstream demand
remained weak, domestic petrochemical enterprises lowered ABS resin prices. The price index
moderated a bit by 2.2% mom and 0.9% mom in June and July respectively. In August, the price
index of ABS resin rose by 3.6% mom, boosted by the increase in prices of styrene, a major raw
material of ABS resin. (See exhibit 13)
We think the upward trend of ABS resin prices is unlikely to continue in the near future, against
the backdrop of weak downstream demand.
Exhibit 13: Price index of ABS resin, Sep 2009 - Aug 2010
Sep-09 Oct Nov Dec Jan-10 Feb Mar Apr May Jun Jul Aug
ABS resin -0.1 -0.1 2.6 3.2 3.4 1.7 6.4 4.0 1.7 -2.2 -0.9 3.6
(mom
growth %)
ABS resin -23.7 -19.6 0.8 22.1 41.9 39.6 38.3 32.4 38.9 30.2 26.8 25.6
(yoy growth
%)
Source: China Federation of Logistics & Purchasing
9. Price index of PP softened in May to July, after having risen for two
consecutive months
In response to the increase in global crude prices, domestic petrochemical enterprises raised
ex-factory prices of polypropylene (PP). The price index of PP12 gained by 1.3% mom and
11 The index is compiled by the China Federation of Logistics & Purchasing (CFLP), which is the first logistics and purchasing industry association approved by the State Council. One of the CFLP’s missions is to push forward the circulation of factors of production in China.
12 The index is compiled by the China Federation of Logistics & Purchasing (CFLP).
0/"',#3&-./,+"'(#4*5*6789*'1#)*87-1#:;<2<=AC
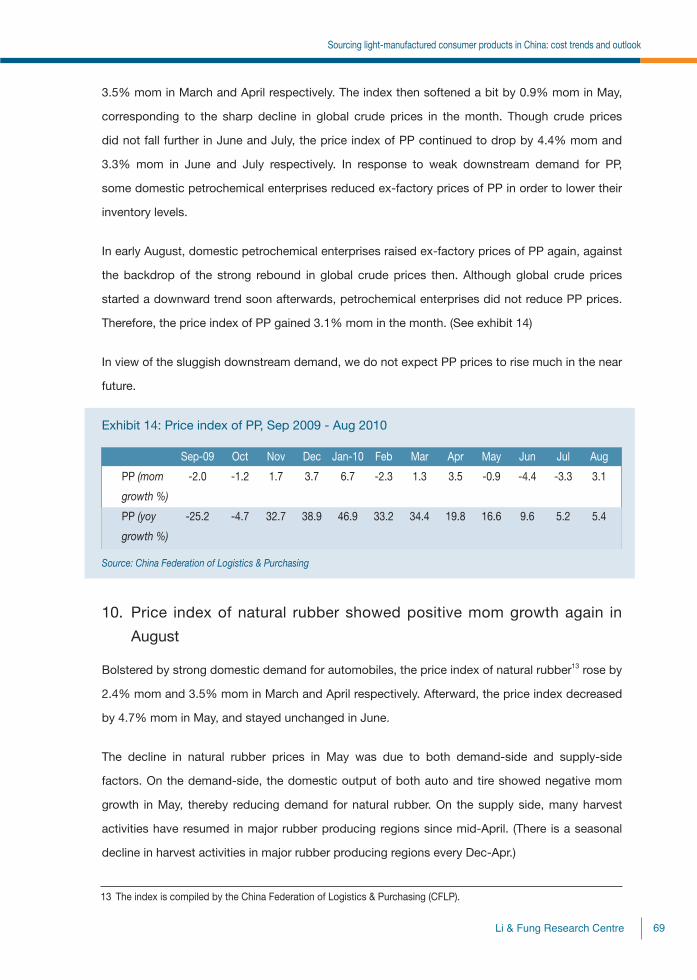
3.5% mom in March and April respectively. The index then softened a bit by 0.9% mom in May,
corresponding to the sharp decline in global crude prices in the month. Though crude prices
did not fall further in June and July, the price index of PP continued to drop by 4.4% mom and
3.3% mom in June and July respectively. In response to weak downstream demand for PP,
some domestic petrochemical enterprises reduced ex-factory prices of PP in order to lower their
inventory levels.
In early August, domestic petrochemical enterprises raised ex-factory prices of PP again, against
the backdrop of the strong rebound in global crude prices then. Although global crude prices
started a downward trend soon afterwards, petrochemical enterprises did not reduce PP prices.
Therefore, the price index of PP gained 3.1% mom in the month. (See exhibit 14)
In view of the sluggish downstream demand, we do not expect PP prices to rise much in the near
future.
Exhibit 14: Price index of PP, Sep 2009 - Aug 2010
Sep-09 Oct Nov Dec Jan-10 Feb Mar Apr May Jun Jul Aug
PP (mom -2.0 -1.2 1.7 3.7 6.7 -2.3 1.3 3.5 -0.9 -4.4 -3.3 3.1
growth %)
PP (yoy -25.2 -4.7 32.7 38.9 46.9 33.2 34.4 19.8 16.6 9.6 5.2 5.4
growth %)
Source: China Federation of Logistics & Purchasing
10. Price index of natural rubber showed positive mom growth again in
August
Bolstered by strong domestic demand for automobiles, the price index of natural rubber13 rose by
2.4% mom and 3.5% mom in March and April respectively. Afterward, the price index decreased
by 4.7% mom in May, and stayed unchanged in June.
The decline in natural rubber prices in May was due to both demand-side and supply-side
factors. On the demand-side, the domestic output of both auto and tire showed negative mom
growth in May, thereby reducing demand for natural rubber. On the supply side, many harvest
activities have resumed in major rubber producing regions since mid-April. (There is a seasonal
decline in harvest activities in major rubber producing regions every Dec-Apr.)
13 The index is compiled by the China Federation of Logistics & Purchasing (CFLP).
!"#$#%&'(#)*+*,-./#0*'1-* AD
Sourcing light-manufactured consumer products in China: cost trends and outlook

After staying "at in June, the price index of natural rubber moderated by 1.7% mom in July,
corresponding to softening auto sales in China, as well as rising rubber supply due to a seasonal
increase in harvest activities in the summer.
In August, the price index gained 3.1% mom, as auto sales in China rebounded and the severe
weather conditions had caused the reduction in natural rubber output in the major rubber
producing countries in Southeast Asia. (See exhibit 15)
Looking forward, with the expectation of increasing auto sales in China in the coming months,
the high season of car sales, natural rubber prices are set to trend upward again.
Exhibit 15: Price index of natural rubber, Sep 2009 - Aug 2010
Sep-09 Oct Nov Dec Jan-10 Feb Mar Apr May Jun Jul Aug
Natural rubber 1.4 1.9 6.9 11.0 14.4 -0.7 2.4 3.5 -4.7 0.0 -1.7 3.1
(mom growth %)
Natural rubber -33.4 -11.5 24.3 73.8 80.6 67.7 72.9 72.5 61.2 60.0 156.1 42.7
(yoy growth %)
Source: China Federation of Logistics & Purchasing
11. Price index of non-ferrous metals rebounded in July and August
After declining by 5.7% mom in February, the price index of non-ferrous metals recorded growth
of 2.5% mom and 1.3% mom in March and April respectively, backed by the ongoing recovery
of the global economy. The price index then dropped sharply by 7.3% mom in May and 5.2%
mom in June, due largely to the cool down of speculative demand for non-ferrous metals and the
deepening concern over the European debt crisis.
The price index of non-ferrous metals rebounded by 3.2% mom and 5.0% mom in July and
August respectively, as concern eased over the European debt crisis and a number of smelting
plants in China were shut down for regular maintenance. (See exhibit 16)
The price indices of several types of non-ferrous metals rose markedly in July and in August.
For example, the price index of copper gained 3.5% mom in July and 5.9% mom in August;
the aluminum price index increased by 2.6% mom and 2.5% mom; the lead price index was up
strongly by 4.8% mom and 8.1% mom; and the zinc price index surged by 5.8% mom and 9.0%
mom.14 (See exhibit 17 - 20)
14 The indices are compiled by the China Federation of Logistics & Purchasing (CFLP).
0/"',#3&-./,+"'(#4*5*6789*'1#)*87-1#:;<2<=B<

Exhibit 16: Price index of non-ferrous metals, Sep 2009 - Aug 2010
Sep-09 Oct Nov Dec Jan-10 Feb Mar Apr May Jun Jul Aug
Non-ferrous 0.4 1.3 2.8 5.7 7.7 -5.7 2.5 1.3 -7.3 -5.2 3.2 5.0
metals (mom
growth %)
Non-ferrous -9.5 20.3 41.2 68.5 63.8 57.6 53.6 35.5 29.2 17.2 16.9 10.9
metals (yoy
growth %)
Source: China Federation of Logistics & Purchasing
Exhibit 17: Price index of copper, Sep 2009 - Aug 2010
Sep-09 Oct Nov Dec Jan-10 Feb Mar Apr May Jun Jul Aug
Copper (mom 0.8 1.6 5.3 6.4 7.7 -6.4 5.3 2.2 -8.7 -4.6 3.5 5.9
growth %)
Copper (yoy -16.2 25.9 62.2 105.3 107.8 96.9 87.2 49.3 45.4 32.3 29.2 18.9
growth %)
Source: China Federation of Logistics & Purchasing
Exhibit 18: Price index of aluminum, Sep 2009 - Aug 2010
Sep-09 Oct Nov Dec Jan-10 Feb Mar Apr May Jun Jul Aug
Aluminum -0.5 -0.4 0.6 5.6 6.9 -4.8 0.2 -0.3 -6.1 -4.3 2.6 2.5
(mom growth %)
Aluminum -7.4 8.2 11.8 44.4 39.7 34.1 28.3 18.7 17.2 6.9 6.5 1.1
(yoy growth %)
Source: China Federation of Logistics & Purchasing
Exhibit 19: Price index of lead, Sep 2009 - Aug 2010
Sep-09 Oct Nov Dec Jan-10 Feb Mar Apr May Jun Jul Aug
Lead (mom 12.2 0.7 0.3 0.2 3.6 -4.1 0.0 0.4 -4.4 -3.7 4.8 8.1
growth %)
Lead (yoy -12.5 14.2 66.2 61.6 32.3 30.6 28.0 26.9 25.6 10.4 13.5 18.2
growth %)
Source: China Federation of Logistics & Purchasing
!"#$#%&'(#)*+*,-./#0*'1-* B2
Sourcing light-manufactured consumer products in China: cost trends and outlook
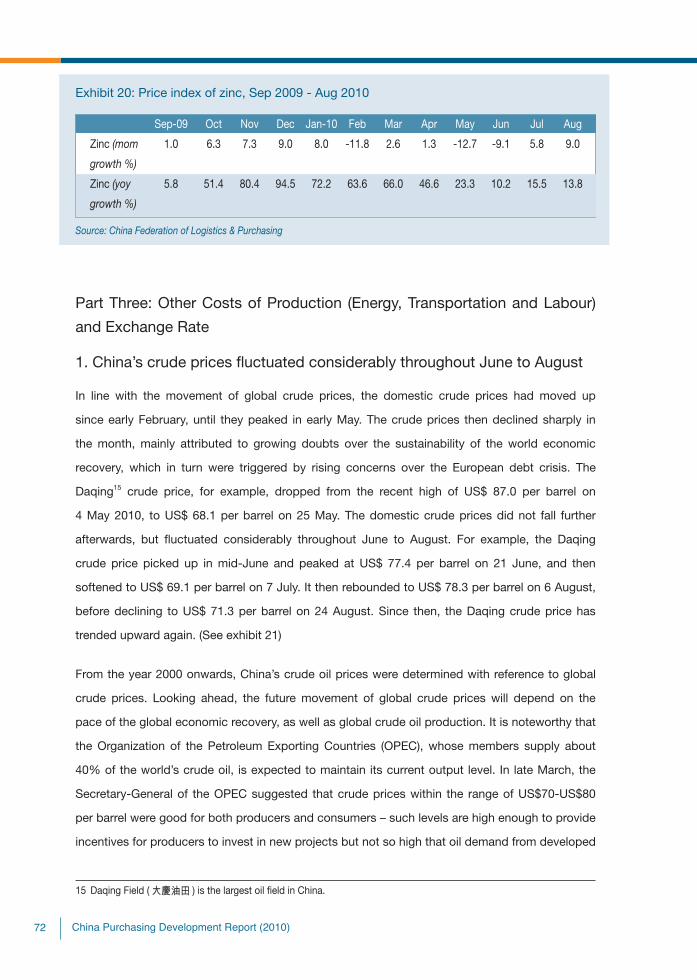
Exhibit 20: Price index of zinc, Sep 2009 - Aug 2010
Sep-09 Oct Nov Dec Jan-10 Feb Mar Apr May Jun Jul Aug
Zinc (mom 1.0 6.3 7.3 9.0 8.0 -11.8 2.6 1.3 -12.7 -9.1 5.8 9.0
growth %)
Zinc (yoy 5.8 51.4 80.4 94.5 72.2 63.6 66.0 46.6 23.3 10.2 15.5 13.8
growth %)
Source: China Federation of Logistics & Purchasing
Part Three: Other Costs of Production (Energy, Transportation and Labour)
and Exchange Rate
1. China’s crude prices "uctuated considerably throughout June to August
In line with the movement of global crude prices, the domestic crude prices had moved up
since early February, until they peaked in early May. The crude prices then declined sharply in
the month, mainly attributed to growing doubts over the sustainability of the world economic
recovery, which in turn were triggered by rising concerns over the European debt crisis. The
Daqing15 crude price, for example, dropped from the recent high of US$ 87.0 per barrel on
4 May 2010, to US$ 68.1 per barrel on 25 May. The domestic crude prices did not fall further
afterwards, but "uctuated considerably throughout June to August. For example, the Daqing
crude price picked up in mid-June and peaked at US$ 77.4 per barrel on 21 June, and then
softened to US$ 69.1 per barrel on 7 July. It then rebounded to US$ 78.3 per barrel on 6 August,
before declining to US$ 71.3 per barrel on 24 August. Since then, the Daqing crude price has
trended upward again. (See exhibit 21)
From the year 2000 onwards, China’s crude oil prices were determined with reference to global
crude prices. Looking ahead, the future movement of global crude prices will depend on the
pace of the global economic recovery, as well as global crude oil production. It is noteworthy that
the Organization of the Petroleum Exporting Countries (OPEC), whose members supply about
40% of the world’s crude oil, is expected to maintain its current output level. In late March, the
Secretary-General of the OPEC suggested that crude prices within the range of US$70-US$80
per barrel were good for both producers and consumers – such levels are high enough to provide
incentives for producers to invest in new projects but not so high that oil demand from developed
15 Daqing Field (!"#$ ) is the largest oil !eld in China.
0/"',#3&-./,+"'(#4*5*6789*'1#)*87-1#:;<2<=B;
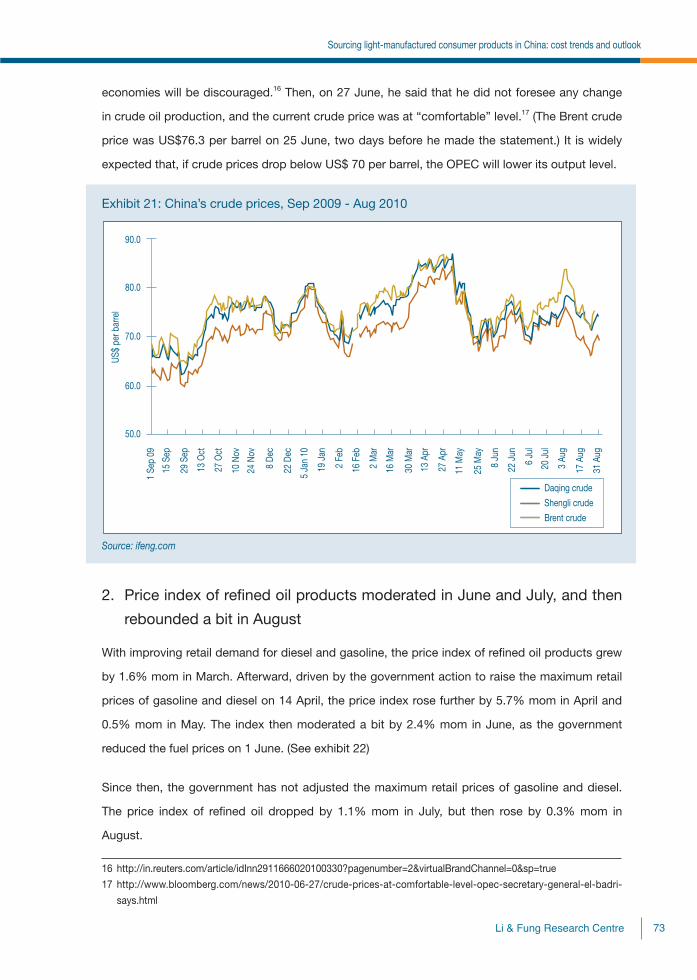
economies will be discouraged.16 Then, on 27 June, he said that he did not foresee any change
in crude oil production, and the current crude price was at “comfortable” level.17 (The Brent crude
price was US$76.3 per barrel on 25 June, two days before he made the statement.) It is widely
expected that, if crude prices drop below US$ 70 per barrel, the OPEC will lower its output level.
Exhibit 21: China’s crude prices, Sep 2009 - Aug 2010
Source: ifeng.com
2. Price index of re!ned oil products moderated in June and July, and then
rebounded a bit in August
With improving retail demand for diesel and gasoline, the price index of re!ned oil products grew
by 1.6% mom in March. Afterward, driven by the government action to raise the maximum retail
prices of gasoline and diesel on 14 April, the price index rose further by 5.7% mom in April and
0.5% mom in May. The index then moderated a bit by 2.4% mom in June, as the government
reduced the fuel prices on 1 June. (See exhibit 22)
Since then, the government has not adjusted the maximum retail prices of gasoline and diesel.
The price index of re!ned oil dropped by 1.1% mom in July, but then rose by 0.3% mom in
August.
16 http://in.reuters.com/article/idInn2911666020100330?pagenumber=2&virtualBrandChannel=0&sp=true17 http://www.bloomberg.com/news/2010-06-27/crude-prices-at-comfortable-level-opec-secretary-general-el-badri-
says.html
!"#$#%&'(#)*+*,-./#0*'1-* B>
Sourcing light-manufactured consumer products in China: cost trends and outlook

In China, the maximum retail prices of re!ned oil products, namely gasoline and diesel, are still
under government control. The government of!cial would consider adjusting the fuel prices when
the 22-day moving average of a basket of global crude prices has changed by more than 4%.
Exhibit 22: China’s price indices of re!ned oil products, Sep 2009 - Aug 2010
Source: China Federation of Logistics & Purchasing
Source: China Federation of Logistics & Purchasing
0/"',#3&-./,+"'(#4*5*6789*'1#)*87-1#:;<2<=B?

3. The benchmark Qinhuangdao coal prices have softened since late July
Due largely to the reduced heating demand, as well as the gradual expansion of coal output in
Shanxi province, the benchmark Qinhuangdao coal prices declined in February and early- and
mid- March. The coal prices then rebounded strongly in late April - mid May, before staying
relatively stable in late May to early July. For example, the price of coal with calori!c value of
5,800 kcal/kg dropped from the peak of 840 yuan per tonne in January to 720 yuan per tonne on
15 March. It then picked up to 785 yuan per tonne on 17 May. Afterwards, it stayed stable until
mid July. (See exhibit 23)
The sharp rise in coal prices in April and May was mainly due to the increasing demand from
domestic power producers, as well as the maintenance of the Daqin railway, the railway which
connects the major coal-producing region to the largest coal shipping port in the country. The
drought in southwestern China had reduced output of hydropower plants in China, thereby
boosting demand for output of coal-!red power plants. The increased demand, together with the
expectation of heavier demand for air conditioning in summer, drove power producers to raise
their inventory levels of coal in April and May.
Since late July, coal prices have started to soften, mainly caused by slowing coal demand from
power producers. One of the major reasons was that the energy saving campaign recently
launched by the Chinese government has reduced power consumption in the country. Besides,
on 25 June, the government ordered major coal companies to maintain the stability of market
prices of coal, and not to adjust the coal prices set in their annual supply contracts with power
producers.
Looking forward, coal prices are expected to stay largely stable or trend slightly downward, given
the increasing coal output, as well as the moderating growth of China’s industrial output.
!"#$#%&'(#)*+*,-./#0*'1-* B@
Sourcing light-manufactured consumer products in China: cost trends and outlook

Exhibit 23: Qinhuangdao coal prices, Aug 2009 - Aug 2010
Source: Cqcoal.com
4. The China Containerized Freight Index has trended slightly upward since
mid-May
The China Containerized Freight Index (CCFI)18 moderated a bit in March and early-April, and
then stayed relatively stable in mid April to mid May. Since then, it has started an upward trend.
(See exhibit 24)
Although major shipping companies have started expanding the active capacities of their carriers
since April, the container freight rates remained robust in recent months, due largely to the
stronger demand for container transport associated with improving exports.
We believe that the container freight rates will continue to rise in the near term, supported by
growing demand for container transport.
18 The index, compiled by the Shanghai Shipping Exchange, measures the freight rates of eleven freight routes. The destinations of these routes include Hong Kong, Korea, Japan, Southeast Asia, Australia and New Zealand, the Mediterranean, Europe, East and West Africa, America West, America East, South Africa, South America.
The freight rates data are collected from major shipping companies in the market, such as CMA-CGM, COSCO Container Lines, China Shipping Container Lines, Hanjin Shipping, Hapag-Lloyd, Kline, Maersk, MOL, NYK, OOCL, P&O Nedlloyd, PIL, Shanghai Hai Hua Shipping, Shanghai Jin Jiang Shipping, Sinotrans Container Lines, SITC Container Lines, etc.
0/"',#3&-./,+"'(#4*5*6789*'1#)*87-1#:;<2<=BA

Exhibit 24: China Containerized Freight Index, Aug 2009 - Aug 2010
Source: Shanghai Shipping Exchange
5. Labour costs
(i) Average annual wage of employees in urban private units increased by 6.6%
in FY09
The average annual wage of employees in urban private units19 increased by 6.6% yoy to 18,199
yuan in FY09.20 Among various regions, the average annual wage of employees in urban private
units in the eastern region reached 19,840 yuan in FY09, much higher than those in the central
region (15,402 yuan), the western region (16,234 yuan) and the northeastern region (16,414
yuan). Nevertheless, employees in urban private units in the eastern region witnessed the slowest
growth in average annual wage, up 4.5% yoy in FY09, compared with 11.3% yoy, 10.1% yoy and
9.9% yoy respectively in the central region, the western region and the northeastern region. (See
exhibit 25)
19 On 27 October 2009, the NBS released the result of its !rst survey on wages of employees in urban private units in FY08. The result shows that urban private units employ a large number of people in China. As of end-2008, there were about 66.76 million employees in urban private units, equivalent to 54.75% of the total number of employees in the “non-private units” category.
http://www.stats.gov.cn/tjdt/gjtjjdt/t20091028_402596828.htm20 http://www.stats.gov.cn/tjfx/jdfx/t20100716_402657779.htm
!"#$#%&'(#)*+*,-./#0*'1-* BB
Sourcing light-manufactured consumer products in China: cost trends and outlook

Exhibit 25: Average wages of employees in urban private units, 2008 - 2009
FY08 FY09
Average wage (RMB) Average wage (RMB) yoy growth (%)
China (overall) 17,071 18,199 6.6
Of which:
Manufacturing sector 16,443 17,260 5.0
Eastern region 18,980 19,840 4.5
Central region 13,843 15,402 11.3
Western region 14,751 16,234 10.1
Northeastern region 14,933 16,414 9.9
Source: National Bureau of Statistics, PRC
(ii) Average annual wage of employees in urban non-private units grew by 12.0%
in FY09
The average annual wage of employees in urban non-private units21 reached 32,736 yuan in
FY09.22 The growth rate was 12.0% yoy in FY09, much faster than that in urban private units.
Among provinces and municipalities in the country, Tibet registered the slowest growth in FY09,
rising by 3.1% yoy, whilst Hubei saw the fastest growth of 19.3% yoy. It is also noteworthy that
some other provinces in the central and western regions, such as Jiangxi and Shaanxi, recorded
growth above 15%, re"ecting the rapid economic development in these areas. (See exhibit 26)
21 The “non-private units” category covers state-owned units, urban collective-owned units, cooperative units, joint-ownership units, limited liability corporations, shareholding corporations Ltd. and foreign-funded units (including units funded by Hong Kong, Macau, and Taiwan), but does not cover private units.
22 http://www.stats.gov.cn/tjfx/jdfx/t20100716_402657787.htm
0/"',#3&-./,+"'(#4*5*6789*'1#)*87-1#:;<2<=BC

23 According to the National Development and Reform Commission’s (NDRC) delineation, there exists ten major city clusters in China: the Pearl River Delta (%&'() ), the Yangtze River Delta (*&'() ), Beijing-Tianjin-Hebei region (+,-./0 ), Central and Southern Liaoning (123./0 ), Shandong Peninsula (4567./0 ), Sichuan and Chongqing region (89./0 ), Middle reach of Yangtze (*&2:./0 ), Cross-Strait West Bank (;<=>./0 ), Central Plain region (2?./0 ), and Central Shaanxi (@2./0 ). An overview of the development of these ten city clusters can be found in our China Distribution and Trading, Issue 49: Overview of China’s Regional Development: Part 1, and Issue 50: Overview of China’s Regional Development: Part 2.
Exhibit 26: Average wages of employees in urban non-private units in China and in the
provinces where the ten major city clusters23 are situated, 2008 - 2009
FY08 FY09
Average wage yoy growth Average wage yoy growth
(RMB) (%) (RMB) (%)
China (overall) 29,229 17.2 32,736 12.0
Of which:
Manufacturing sector 24,192 15.8 26,599 9.9
Eastern region 34,316 – 38,002 10.7
Central region 24,390 – 27,478 12.7
Western region 25,602 – 29,120 13.7
Northeastern region 25,101 – 28,383 13.1
Ten major city clusters
Pearl River Delta
situated in:
Guangdong 33,110 12.5 36,355 9.8
Yangtze River Delta
situated in:
Shanghai 56,565 14.7 63,549 12.3
Jiangsu 31,667 15.7 35,890 13.3
Zhejiang 34,146 9.8 37,395 9.5
Beijing-Tianjin-Hebei region
situated in:
Beijing 56,328 21.1 58,140 3.2
Tianjin 41,748 19.5 44,992 7.8
Hebei 24,756 24.3 28,383 14.7
Central Shaanxi
situated in:
Shaanxi 25,942 21.8 30,185 16.4
Central and Southern Liaoning
situated in:
Liaoning 27,729 19.5 31,104 12.2
!"#$#%&'(#)*+*,-./#0*'1-* BD
Sourcing light-manufactured consumer products in China: cost trends and outlook

FY08 FY09
Average wage yoy growth Average wage yoy growth
(RMB) (%) (RMB) (%)
Cross-Strait West Bank
situated in:
Fujian 25,702 15.3 28,666 11.5
Shandong Peninsula
situated in:
Shandong 26,404 15.6 29,688 12.4
Central Plain region
situated in:
Henan 24,816 18.5 27,357 10.2
Middle reach of Yangtze
situated in:
Hubei 22,739 14.7 27,127 19.3
Hunan 24,870 15.5 27,284 9.7
Jiangxi 21,000 14.1 24,696 17.6
Sichuan and Chongqing region
situated in:
Chongqing 26,985 16.8 30,965 14.7
Sichuan 25,038 17.5 28,563 14.1
Source: National Bureau of Statistics, PRC
(iii) Average monthly wage of migrant workers in China showed positive yoy
growth in 2009
According to the NBS, the average monthly wage of migrant workers in China increased to
1,417 yuan in 2009, up from 1,340 yuan in 2008. Among various regions, migrant workers in the
western region witnessed the fastest growth in wages. Compared with the previous year, the
average monthly wage of migrant workers in the western region grew by 8.2% yoy in 2009, while
those in the eastern region and the central region were up by 5.2% and 5.9% respectively. (See
exhibit 27)
By industries, the average monthly wage of migrant workers in the manufacturing sector rose by
5.3% to 1,331 yuan in 2009, while those in the transportation, storage & post service sector; the
hotel & catering sector; and the construction sector reached 1,671 yuan, 1,264 yuan and 1,625
yuan respectively in 2009.
0/"',#3&-./,+"'(#4*5*6789*'1#)*87-1#:;<2<=C<
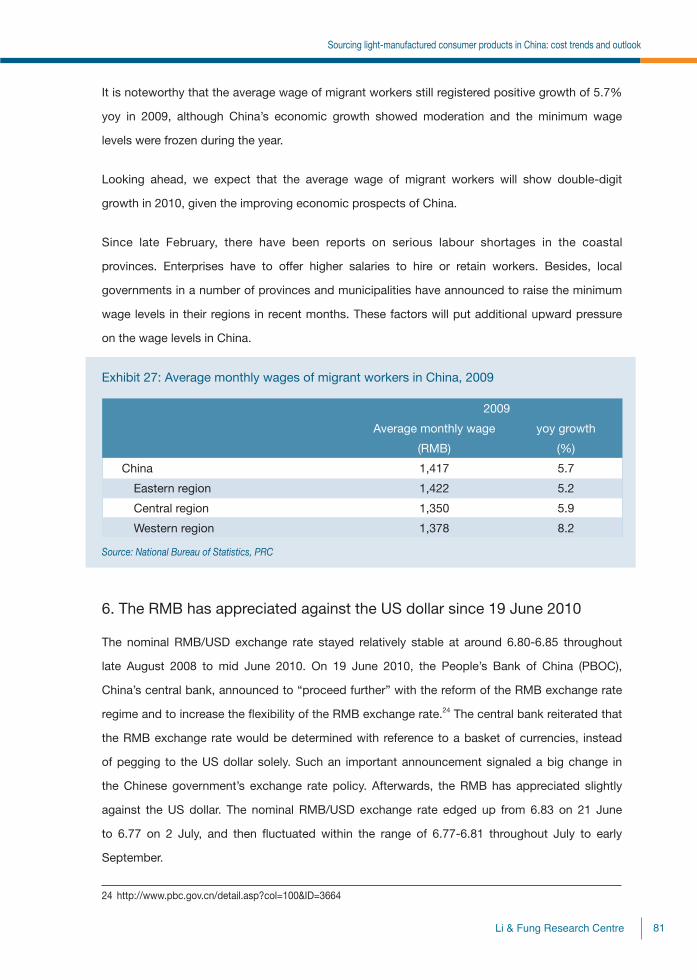
It is noteworthy that the average wage of migrant workers still registered positive growth of 5.7%
yoy in 2009, although China’s economic growth showed moderation and the minimum wage
levels were frozen during the year.
Looking ahead, we expect that the average wage of migrant workers will show double-digit
growth in 2010, given the improving economic prospects of China.
Since late February, there have been reports on serious labour shortages in the coastal
provinces. Enterprises have to offer higher salaries to hire or retain workers. Besides, local
governments in a number of provinces and municipalities have announced to raise the minimum
wage levels in their regions in recent months. These factors will put additional upward pressure
on the wage levels in China.
Exhibit 27: Average monthly wages of migrant workers in China, 2009
2009
Average monthly wage yoy growth
(RMB) (%)
China 1,417 5.7
Eastern region 1,422 5.2
Central region 1,350 5.9
Western region 1,378 8.2
Source: National Bureau of Statistics, PRC
6. The RMB has appreciated against the US dollar since 19 June 2010
The nominal RMB/USD exchange rate stayed relatively stable at around 6.80-6.85 throughout
late August 2008 to mid June 2010. On 19 June 2010, the People’s Bank of China (PBOC),
China’s central bank, announced to “proceed further” with the reform of the RMB exchange rate
regime and to increase the "exibility of the RMB exchange rate.24 The central bank reiterated that
the RMB exchange rate would be determined with reference to a basket of currencies, instead
of pegging to the US dollar solely. Such an important announcement signaled a big change in
the Chinese government’s exchange rate policy. Afterwards, the RMB has appreciated slightly
against the US dollar. The nominal RMB/USD exchange rate edged up from 6.83 on 21 June
to 6.77 on 2 July, and then "uctuated within the range of 6.77-6.81 throughout July to early
September.
24 http://www.pbc.gov.cn/detail.asp?col=100&ID=3664
!"#$#%&'(#)*+*,-./#0*'1-* C2
Sourcing light-manufactured consumer products in China: cost trends and outlook

Recently, with China’s trade surplus remaining high in July and August, international pressure
for RMB appreciation has increased again. On 8 September, the US Treasury Secretary Timothy
Geithner said that the Chinese government had not let the currency move very much and called
for faster RMB appreciation. The RMB appreciation against the US dollar has quickened since
9 September, few days before a hearing on China’s exchange-rate policy conducted by the US
congress. The nominal RMB/USD exchange rate rose from 6.78 on 9 September to 6.72 on 17
September, the highest level since 1994.
On the other hand, the RMB has appreciated strongly against the Euro since late November
2009: The nominal RMB/Euro exchange rate strengthened from the recent low of 10.32 on
26 Nov 2009 to 8.13 on 7 June 2010, and then depreciated a bit to 8.99 on 9 August, before
advancing to 8.78 on 17 September. (See exhibit 28)
Against its trading partners, the RMB depreciated by 1.7% in real terms in June to July 2010,
as indicated by the real effective exchange rate (REER) compiled by the Bank for International
Settlements.25 Overall, the RMB appreciated by 2.4% in real terms in the !rst seven months of
2010. (See exhibit 30)
Since the introduction of the reform of the RMB exchange rate regime in late July 2005, the
RMB has been depegged from the US dollar, and the RMB exchange rate has been determined
with reference to a basket of currencies. During July 2005 - late August 2008, the RMB gained
by more than 20% against the US dollar. The global !nancial crisis broke out afterward, leading
to sharp contraction in export and in turn, serious job losses and factory closures in China.
Therefore, the RMB appreciation against the US dollar stopped from late August 2008 to mid
June 2010. (See exhibit 29)
Looking ahead, we expect a gradual appreciation of the RMB against the US dollar to take place
in the near term, thereby easing international pressure, as well as bringing down the prices of
imported commodities in RMB terms. It is forecast that the nominal RMB/USD exchange rate
will appreciate to around 6.6 at end-2010. It is unlikely that there will be a substantial RMB
appreciation against the US dollar. Otherwise, the competitiveness of China’s exports will
25 The Bank for International Settlements (BIS) calculates effective exchange rate (EER) indices for a total of 58 economies (including individual euro area countries and, separately, the euro area as an entity). Nominal EERs are calculated as geometric weighted averages of bilateral exchange rates. Real EERs are the same weighted averages of bilateral exchange rates adjusted by relative consumer prices. The weighting pattern is time-varying, and the most recent weights are based on trade in 2005-07.
0/"',#3&-./,+"'(#4*5*6789*'1#)*87-1#:;<2<=C;

be weakened seriously, and it will cause a big loss in value (in RMB terms) of China’s foreign
exchange reserve.26
Exhibit 28: RMB/USD and RMB/Euro, Sep 2009 - Sep 2010
Source: State Administration of Foreign Exchange
26 According to the local media, more than 60% of China’s foreign exchange reserves are held in US dollar-denominated assets.
http://www.cs.com.cn/xwzx/03/201007/t20100706_2499504.htm
!"#$#%&'(#)*+*,-./#0*'1-* C>
Sourcing light-manufactured consumer products in China: cost trends and outlook
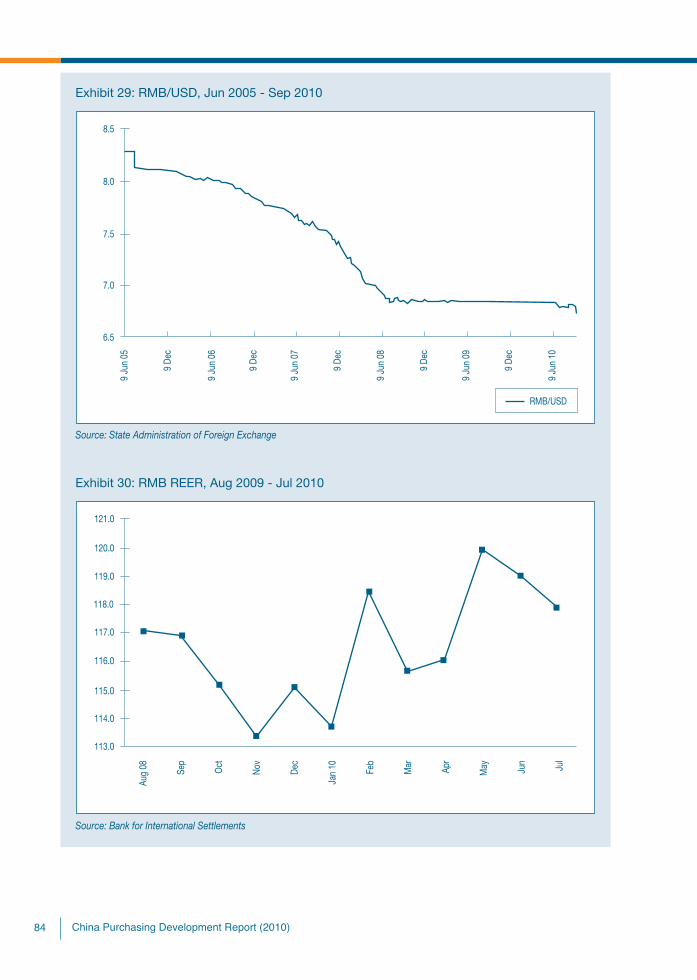
Exhibit 29: RMB/USD, Jun 2005 - Sep 2010
Source: State Administration of Foreign Exchange
Exhibit 30: RMB REER, Aug 2009 - Jul 2010
Source: Bank for International Settlements
0/"',#3&-./,+"'(#4*5*6789*'1#)*87-1#:;<2<=C?

Part Four: Highlights
1. Labour shortages and labour unrest have triggered signi!cant increases
in labour costs
Since late February 2010, there have been numerous reports on serious labour shortages in the
coastal provinces.27 According to a survey of enterprises in 26 large- and medium-sized cities
in 13 provinces conducted by the Ministry of Human Resources and social security (MHRSS),
the labour demand from enterprises rose by 15% soon after the Chinese New Year Holiday,
compared with the same period of the previous year.28
Among different regions in China, the Pearl River Delta and southeastern Fujian experienced the
most severe problem of labour shortages in early 2010, according to another survey done by
MHRSS.29 As of 10 March, 700,000 workers were needed in Guangdong province. More than
60% of the job vacancies were in Guangzhou, Shenzhen and Dongguan. And 200,000 workers
were required in Fujian province. Around 53% of the vacancies were in Quanzhou.
Moreover, the survey suggested that, among different size of enterprises, small- and medium-
sized enterprises (SMEs) suffered the most from the labour shortages. The supply of skilled
workers was also particularly tight.
The recent pick up in orders due to strong domestic demand and export recovery has boosted
the labour demand from mainland manufacturers. On the other hand, the rapid economic
growth in the interior provinces has limited the labour supply in the coastal provinces. In recent
years, the Chinese government has strengthened its efforts to promote the development in the
central and western regions through increasing investment and implementing favorable policies
to support the agricultural industry. In addition, many factories have moved inland, driven by
rising costs in the coastal provinces, improved infrastructure in the interior provinces, as well
as government policies to support relocation. Consequently, migrant workers can !nd more
job opportunities and earn higher wages in the interior provinces, compared to the past. Many
migrant workers from the inland, traditionally working in the coastal provinces, now choose to
work in provinces closer to their hometowns. In response to the situation, enterprises in the
coastal provinces have to offer higher salaries in a bid to hire or retain workers.
27 See, for example, http://www.china.org.cn/video/2010-02/23/content_19460894.htm28 http://www.gov.cn/gzdt/2010-02/26/content_1541943.htm29 http://www.mohrss.gov.cn/Desktop.aspx?path=mohrss/mohrss/InfoView&gid=a573179a-9d0e-4e08-8c8c-
5a636ac176e0&tid=Cms_Info
!"#$#%&'(#)*+*,-./#0*'1-* C@
Sourcing light-manufactured consumer products in China: cost trends and outlook
Besides, a strike at a Honda factory in Foshan caught worldwide attention in late May. As a result
of the strike and wage negotiation, Honda announced to offer a 24% pay rise to the workers at
this plant. In another scene, following a spate of suicides at Foxconn, the company announced to
raise the salary for its workers by 30% or above on 2 June 2010. Then on 6 June, it announced
to increase salary of most assembly line workers, line managers and supervisors to 2,000 yuan
per month, effective from 1 October 2010.
In fact, due to labour shortages and changing expectation of China’s migrant workers,
labour disputes in China have been on the rise and wages have been on an upward trend in
recent years. The Foxconn and Honda events are only triggers for the widespread collective
bargaining over wages to come in the future. With the news of sizable pay rise of Foxconn and
Honda spreading across China through media reports, workers in other regions/factories are
encouraged to ask for similar wage increases. Labour unrest is showing signs of spreading from
the Pearl River Delta (PRD) to other parts of the country. Strikes were reported at a Taiwan-
owned sporting goods supplier in Jiangxi province, and at the Japanese sewing machine maker
Brother Industries in Xian.
It is observed that many employers have offered sizable pay rises in order to settle labour
disputes. Wage increases will soon become prevalent among manufacturers, especially in
the coastal regions. The cost hike will put stress on the manufacturing supply chain. Many
enterprises are unable to pass through the higher cost to buyers, thereby leading to reduced
pro!t margins. In particular, low value-added producers, which compete on cost basis, are now
under threat of closure. To cope with the higher labour costs, some manufacturers opt to relocate
to lower cost production bases, while others are trying to move up the value chain. Foxconn, for
example, plans to move most of its production lines from Shenzhen to Hebei province by the end
of this year.
Many see this wave of strikes as the turning point in China’s economic restructuring – Chinese
companies can no longer run on the traditional OEM model dependent on abundant cheap
labour, but must move on to a model of higher value-added. The latest developments coincide
with China’s macro policy objective to adjust its economic structure and accelerate industrial
upgrading, as well as to change its growth model from export-oriented to consumption driven.
In this regard, improving household income is one of the major keys. The Chinese policymakers
have vowed to boost labour income lately. As of 10 September 2010, local governments
in twenty eight provinces/municipalities in China raised the minimum wage levels in their
jurisdictions by signi!cant amounts. (See the next highlight for more details.)
0/"',#3&-./,+"'(#4*5*6789*'1#)*87-1#:;<2<=CA

2. The minimum wage levels in twenty eight provinces/municipalities were
adjusted upward in the previous few months
As the minimum wage levels in China were frozen in 2009, many local governments have to
adjust the levels in 2010, in order to conform to the government provisions.30 As of 10 Sep 2010,
the minimum wage levels in 28 provinces/municipalities in China were increased. See below for
details:
Shanghai
On 1 Apr 2010, the minimum monthly wage in Shanghai was adjusted to 1,120 yuan, up by
16.7% from the previous level.31
Tianjin
On 1 Apr 2010, the minimum monthly wage in Tianjin was adjusted to 920 yuan, up from the
previous level of 820 yuan.32
Guangdong province
On 17 Mar, the Guangdong provincial government announced to raise the levels of minimum
monthly wage in the region by 21.1% on average, effective from 1 May 2010.33
Jiangsu province
On 27 Jan, the Jiangsu provincial government announced to raise the minimum wage levels in
various regions within the province by around 12.9-13.6%, effective from 1 Feb 2010.34
Zhejiang province
On 1 Apr 2010, the minimum wage levels in various regions in Zhejiang province were adjusted
upward to 1,100 yuan, 980 yuan, 900 yuan and 800 yuan respectively.35
30 According to the “Provisions on Minimum Wage”, the minimum wage level in each region must be revised at least once every two years.
31 http://rsj.sh.gov.cn/200912333/2009xxgk/ztxx/gzzd/01/201003/t20100329_1116178.shtml32 http://big5.gov.cn/gate/big5/www.gov.cn/fwxx/sh/2010-04/08/content_1575923.htm33 http://www.gd.lss.gov.cn/gdlss/sy/pnews/t20100318_116019.htm34 http://www.jiangsu.gov.cn/shouye/wjgz/bmwj/201001/t20100128_422866.html35 http://www.zjhrss.gov.cn/art/2010/3/1/art_1161_881.html
!"#$#%&'(#)*+*,-./#0*'1-* CB
Sourcing light-manufactured consumer products in China: cost trends and outlook

Fujian province
On 1 Mar 2010, the minimum wage levels in Fujian province were increased by 24.5% on
average.36
Shandong province
On 1 May 2010, the minimum wage levels in Shandong province were raised by 21.2% on
average.37
Shanxi province
On 1 Apr 2010, the minimum wage levels in Shanxi province were raised by 15.5% on average.38
Beijing
The minimum monthly wage in Beijing was raised from the previous level of 800 yuan to 960 yuan
on 1 Jul 2010.39
Shenzhen
On 1 Jul 2010, the Shenzhen municipal government raised the minimum monthly wage in the
city to 1,100 yuan.40 Before the adjustment, the level of minimum monthly wage in Luohu, Futian,
Nanshan and Yantian districts in Shenzhen was 1,000 yuan; whilst that in Baoan and Longgang
districts was 900 yuan.
Anhui province
On 13 Jun 2010, the Anhui provincial government announced to raise the levels of minimum
monthly wage in various districts within the province by 25.9-28.6%, effective from 1 Jul 2010.41
36 http://www.fjlss.gov.cn/showinfo.asp?infoid=1220537 http://www.shandong.gov.cn/art/2010/4/14/art_291_204658.html38 http://www.sxldbzt.gov.cn/news/snxw/2010/324/1032417164CF4A5A09H556BACCJI23.html39 http://210.75.193.158/gate/big5/zhengwu.beijing.gov.cn/gzdt/gggs/t1118046.htm40 http://www.sz.gov.cn/rsj/szsrzhsbj/tzgg/201006/t20100628_1549217.htm41 http://www.ah.hrss.gov.cn/Root/web/templet/siteColumnContent.jsp?siteColumnContentId=29246
0/"',#3&-./,+"'(#4*5*6789*'1#)*87-1#:;<2<=CC

Hunan province
On 8 Jun, the Hunan provincial government announced to raise the minimum wage levels in
various districts within the province by signi!cant amounts, effective from 1 Jul 2010.42 For
example, the minimum wage level in class I districts increased from 665 yuan to 850 yuan, up by
27.8%.
Shaanxi province
On 1 Jul 2010, the minimum wage levels in various districts in Shaanxi province were adjusted
upward to 760 yuan, 680 yuan, 630 yuan and 580 yuan respectively.43
Henan province
On 1 Jul 2010, the minimum wage levels in Henan province were increased by more than 20%.44
Yunnan province
On 1 Jul 2010, the minimum wage levels in various districts within Yunnan province were
increased by more than 20%.45 For example, the minimum wage level in class I districts was
raised to 830 yuan, up by 22% from the previous level.
Liaoning province
On 1 Jul 2010, the minimum wage levels in various districts within Liaoning province were
increased to 900 yuan, 750 yuan and 650 yuan, up by 28.6-30%.46
Hainan province
On 1 Jul 2010, the minimum wage levels in various districts within Hainan province were
adjusted upward.47 Particularly noteworthy is that the minimum wage level in class I districts was
increased substantially by 31.7% to 830 yuan.
42 http://www.hn12333.com/pub/hnjbw/sy_gzdt/gzdt_2010/hn2010/t20100608_54714.htm43 http://www.shaanxihrss.gov.cn/Html/2010-5-25/163111.Html44 http://www.haly.lss.gov.cn/news_view.asp?newsid=92845 http://www.lcldl.gov.cn/Article/Article.asp?newsid=106146 http://www.ln.lss.gov.cn/ln/6/10/2010/06/i9083.shtml47 http://hi.lss.gov.cn/web/default/article.jsp?articleId=1268
!"#$#%&'(#)*+*,-./#0*'1-* CD
Sourcing light-manufactured consumer products in China: cost trends and outlook
Jiangxi province
On 1 Jun 2010, the Jiangxi provincial government announced to raise the levels of minimum
monthly wage by 23.6% on average, effective from 1 Jul 2010.48
Hubei province
On 1 May 2010, the Hubei provincial government raised the levels of minimum monthly wage by
150 to 200 yuan.49
Jilin province
On 1 May 2010, the minimum wage levels in various districts within Jilin province were adjusted
upward by 22.9% on average.50
Ningxia Hui autonomous region
On 1 May 2010, the minimum wage levels in various districts within the region were increased by
23.5-26.8%.51
Sichuan province
On 1 Aug 2010, the Sichuan provincial government raised the minimum wage levels in various
districts within the province by 30.8-44.4%.52
Xinjiang Uygur autonomous region
On 1 Jun 2010, the levels of minimum monthly wage in the region were raised by 24.7% on
average.53
Hebei province
On 1 Jul 2010, the minimum wage levels in various districts in Hebei province were adjusted
upward to 900 yuan, 840 yuan, 760 yuan and 690 yuan respectively.54
48 http://www.jxrenshi.gov.cn/Content/show.php?id=1005049 http://www.hubei.gov.cn/zwgk/zfxxgk/zfwj/ezfwj/ezf2010/201004/t20100428_116428.shtml50 http://www.jl.gov.cn/zwxx/zfwj/szffw/201004/t20100430_712995.html51 http://www.nxhrss.gov.cn/news/gzdt/2010/428/1042812812EA4EE055IE39GCBI0E6J.html52 http://www.chinanews.com.cn/cj/2010/07-07/2386464.shtml 53 http://www.xjrs.gov.cn/show_!les.asp?ArticleID=378154 http://www.chinajob.gov.cn/LabourRelations/content/2010-09/08/content_557886.htm
0/"',#3&-./,+"'(#4*5*6789*'1#)*87-1#:;<2<=D<

Inner Mongolia autonomous region
On 1 Jul 2010, the minimum wage levels in various districts in Inner Mongolia autonomous region
were increased to 900 yuan, 820 yuan, 750 yuan and 680 yuan respectively.55
Heilongjiang province
On 1 Jul 2010, the minimum wage levels in various districts in Heilongjiang province were raised
to 880 yuan, 840 yuan, 720 yuan, 700 yuan, 670 yuan, 620 yuan and 600 yuan respectively.56
Tibet autonomous region
On 1 Jul 2010, local government in Tibet autonomous region increased the levels of minimum
monthly wage by 220 yuan.57
Qinghai province
On 1 Sep 2010, the levels of minimum monthly wage in the region were raised by 28.8% on
average.58
Guangxi Zhuang autonomous region
On 1 Sep 2010, the minimum wage levels in various districts within Guangxi Zhuang autonomous
region were adjusted upward by 22.4 % on average.59
On top of the above adjustments which have taken effect as of 10 Sep, on 5 Sep 2010, the
Gansu provincial government announced to raise the levels of minimum monthly wage by 130 to
140 yuan, effective from 1 Oct 2010. 60 We also expect that the local governments in Chongqing
and Guizhou will raise the minimum wage levels in their jurisdictions soon.
The minimum wage levels in many provinces were increased substantially in this round of
adjustments. In particular, the levels of minimum monthly wage in Shanghai, Shenzhen, and
class I districts in Guangdong and Zhejiang are now higher than 1,000 yuan. Labour-intensive
industries such as textiles, apparel, shoes, electronic components, etc. will be adversely affected.
55 http://www.chinajob.gov.cn/LabourRelations/content/2010-08/27/content_554951.htm56 http://www.hlj.gov.cn/wjfg/system/2010/08/04/010088649.shtml57 http://tibet.news.cn/gdbb/2010-08/04/content_20529639.htm58 http://www.qh.gov.cn/html/31/146084.html59 http://www.chinajob.gov.cn/LabourRelations/content/2010-09/09/content_558274.htm60 http://www.chinajob.gov.cn/LabourRelations/content/2010-09/07/content_557283.htm
!"#$#%&'(#)*+*,-./#0*'1-* D2
Sourcing light-manufactured consumer products in China: cost trends and outlook

Some manufacturers are reported to move their production lines from the above-mentioned
areas to lower cost provinces or even to other countries such as Vietnam and Indonesia.
Looking forward, bolstered by the government’s determination to raise workers’ income and the
strong Chinese economy, labour costs are expected to trend upward in the foreseeable future.
3. The government reduced the fuel prices by around 3% on 1 June, in
response to the recent drop in global crude prices
During January to August 2010, fuel prices were adjusted two times, and gained 1.1-1.6% in
total. On 14 April 2010, the Chinese government raised the maximum retail prices of gasoline and
diesel by 4-5%. The purpose of the price adjustments was to allow domestic fuel prices to re"ect
the movement in global crude prices since 10 November 2009, the previous time when fuel
prices were adjusted upward.
On 1 June 2010, the Chinese government reduced the maximum retail prices of gasoline
and diesel by around 3%, in order to re"ect the decline in global crude prices since 14 April
2010. The drop in the fuel prices has reduced transportation costs, as well as energy costs on
manufacturers who run their own electrical generators in China.
Indeed, since the introduction of the re!ned oil pricing mechanism in late December 2008, fuel
prices have been adjusted more frequently than before, as fuel prices would be determined by
the following factors: global crude prices, domestic re!ning costs, taxes and reasonable pro!ts
of re!ners. The government of!cial would consider adjusting fuel prices when the 22-day moving
average of a basket of global crude prices has changed by more than 4%. Therefore, the pass-
through of global oil prices to domestic fuel prices will now be bigger and faster than before.
4. The Chinese government announced to scrap export VAT rebates for 406
tariff items
On 22 June 2010, the Chinese government announced to scrap the export value-added-tax (VAT)
rebates for 406 tariff items, effective 15 July 2010.61 These 406 tariff items include various types
of products such as steel and nonferrous metal products, silver powder, ethanol, corn starch,
glass products, pesticides, pharmaceuticals, chemicals, plastics and rubber. The removal of the
export VAT rebates would increase the unit cost of these products for export.
61 http://szs.mof.gov.cn/zhengwuxinxi/zhengcefabu/201006/t20100622_323730.html
0/"',#3&-./,+"'(#4*5*6789*'1#)*87-1#:;<2<=D;
In fact, during 2006 - early 2008, the Chinese government eliminated or slashed export VAT
rebate on a large number of products, and expanded the prohibited and restricted lists for
processing trade, with an aim to discourage the export of products that were energy- and
resource-intensive, highly polluting, labour-intensive and low value-added, as well as to promote
industrial upgrading. However, the global !nancial crisis and economic slowdown dealt a hard
blow to the export sector in China. The government reversed its earlier policy and raised the
export VAT rebate rates for selected products for seven times during late 2008 - June 2009.
Currently, China’s exports in US dollar terms have already returned to the pre-crisis level and are
showing strong growth again. The latest policy to scrap export VAT rebates indicates that the
Chinese government is renewing its efforts to discourage undesirable industries.
5. The government raised the retail power tariffs for non-residential users
on 20 November 2009
On 20 November 2009, the Chinese government raised the retail power tariffs for non-residential
users by 0.028 yuan per kilowatt-hour on average, or about 5% from the previous levels.62 This
was the !rst adjustment of the retail tariffs for non-residential users since late June 2008, when
they were increased by around 5% on average.
In fact, earlier in August 2008, the midstream on-grid power tariffs were adjusted upward by
0.020 yuan per kilowatt-hour in response to the rise in upstream coal prices. Nevertheless, the
downstream retail tariffs were not adjusted, as the government avoided increasing cost burden
on enterprises and households. Soon afterwards, the global economic slowdown took a toll on
China’s industrial production and thus power consumption. As a consequence, power grids in
China have incurred huge loss since late 2008. Boosted by robust domestic demand and export
recovery, the manufacturing sector in China has improved since 2Q09. Growth of industrial
production rebounded to 19.2% yoy in November 2009. In view of the recovery, the government
opted to raise the retail power tariffs for non-residential users in November 2009, in a bid to
restore the pro!tability of power grids.
It is noteworthy that, on 25 June 2010, the Chinese government ordered major coal companies to
maintain the stability of market prices of coal, and not to adjust the coal prices set in their annual
supply contracts with power producers. As such efforts would help alleviate cost pressure on
power producers, we believe the government will not raise power tariffs in the near term.
62 In China, both retail power tariffs and on-grid power tariffs are still under the government control.
!"#$#%&'(#)*+*,-./#0*'1-* D>
Sourcing light-manufactured consumer products in China: cost trends and outlook

6. The ASEAN-China Free Trade Area has been established since 1 January
2010
The ASEAN-China Free Trade Area (ACFTA) has been established since 1 January 2010. The
purpose of setting up this free trade zone is to create a uni!ed market, through reducing the
barriers to intra-regional investment, trade in goods and services. With total population of around
1.9 billion, the ACFTA has become the free trade zone with the largest number of people in the
world.
On 1 January 2010, the Chinese government and the governments of six countries in ASEAN
(Association of South East Asian Nations), namely Thailand, Indonesia, Malaysia, Singapore,
Philippines and Brunei, removed tariffs on almost 90% of products traded within the region.63
The average rate of tariffs imposed by China on goods imported from these ASEAN members
has been reduced to 0.1%, compared to 9.8% in the past. On the other hand, the average rate
of tariffs levied by these ASEAN governments on imported Chinese goods has been lowered
from 12.8% to 0.6%. Beginning from 2015, tariffs on most products traded between China and
remaining four ASEAN members, namely Myanmar, Cambodia, Laos and Vietnam, will also be
abolished.
Currently, ASEAN is China’s fourth-largest trading partner. China’s trade with the ASEAN
countries amounted to US$213.0 billion in FY09. Boosted by the establishment of the ACFTA,
China’s trade with the ASEAN countries registered a stunning growth of 54.7% yoy in 1H10,
compared to -7.9% yoy in FY09.
7. The Economic Cooperation Framework Agreement (ECFA) between the
Chinese Mainland and Taiwan was signed on 29 June 2010
Taiwan signed the Economic Cooperation Framework Agreement (ECFA) with the Chinese
Mainland on 29 June 2010, which is a milestone in cross-strait ties. The ECFA aims to set out the
framework and targets; and is not a one-off agreement. The content will be expanded step-by-
step in future negotiations. More deregulations are in the pipelines.
To satisfy the demand for urgent actions in certain sectors, the ECFA includes an “early harvest”
plan, which will take effect on 1 January 2011. Good and services not included in the early
63 Governments in the ASEAN countries and China have been implementing a tariff reduction programme since July 2005, after signing the Agreement on Trade in Goods of the Framework Agreement on Comprehensive Economic Cooperation between ASEAN and China in November 2004.
0/"',#3&-./,+"'(#4*5*6789*'1#)*87-1#:;<2<=D?
harvest list will be dealt with in future ongoing negotiations. Apart from the trade pact, the two
sides have also signed an agreement on intellectual property rights protection.
The early harvest list includes tariff reduction/ removal and liberalization of trade in services, as
summarized below:
(1) Tariff concessions
Import duties on 539 tariff items of Taiwanese exports will be eliminated gradually. Taiwan will
follow a similar time frame to eliminate the tariffs it presently imposes on 267 goods from the
Chinese mainland.
Included in the agreement is a set of provisional rules governing certi!cate of product
origins. The provisional rules prescribe more stringent regulations in de!ning product origins.
According to the head of Taiwan’s Department of Customs Administration, the required
percentage of content provided at product origins should be between 40% and 50%.
(2) Open up service industries
The Chinese Mainland will open up 11 service industries to Taiwan: accounting and audit;
computer services (software & data processing); research & development (natural science &
engineering); convention; professional design; !lm import; hospital; civil aircraft maintenance;
banking; securities; insurance.
Taiwan will liberalize 9 service sectors to the Chinese Mainland: research and development;
convention; exhibition; product design; film import; agency services; sports and
entertainment; air ticketing; banking and !nancial services (excluding securities, futures and
insurance).
The ECFA is set to further advance cross-strait relations and give a major boost to two-way
trade. According to a prediction by the Taipei-based Chung-Hua Institution for Economic
Research, the signing of the ECFA will help to raise Taiwan’s GDP by 1.65-1.72%, and Taiwan’s
exports and imports by 4.87-4.99% and 6.95-7.07%. respectively. In addition to gradual tariff
reductions in goods and open-ups in services after signing the ECFA, one of the possible
supplements is to deepen development in the Strait-West Coast Economic Zone, particularly for
the !nancial sector.
!"#$#%&'(#)*+*,-./#0*'1-* D@
Sourcing light-manufactured consumer products in China: cost trends and outlook

Signing the ECFA will help Taiwan avoid being marginalized in the face of increasing trade blocs
in the region and opening the door for similar treaties between Taiwan and other countries. The
inking of the ECFA will hopefully reduce the obstruction to Taiwan’s effort to sign FTAs with other
trading partners with improved cross-strait ties.
The ECFA, coupled with the progress in Three Linkages and other measures offered by the
Taiwan government to attract foreign investment and to encourage the return of Taiwan
businesses to the domestic markets (such as the reduction of corporate income tax and offering
incentives for building R&D centers), will enhance the incentive for multinationals/ Taiwan
companies to invest in Taiwan.
Looking ahead, the two sides will continue discussing agreements for commodity trade, service
trade and investment six months after the ECFA takes effect. Further discussion will include
tariff reduction and removal; rules of origin; customs procedures; trade remedies. Discussions
on service trade agreement will focus on cutting and removing restrictive measures gradually,
enlarging the service sectors covered, and enhancing cross-strait cooperation. In addition, the
two sides agree to enhance cooperation in medical and health, intellectual property protection,
investment protection, !nance, trade facilitation, customs, and E-business at the new round of
talks.
0/"',#3&-./,+"'(#4*5*6789*'1#)*87-1#:;<2<=DA

The post-!nancial crisis strategies of China’s manufacturers and sourcing businesses
The post-crisis recovery is well on track in 2010. Major international organizations such as the
World Trade Organization are optimistic with the outlook of global trade. However, recent !gures
show that China’s economic growth has been slowing.
Although China’s manufacturing sector has received increasing orders from domestic and foreign
markets, growth moderation has been observed. On the other hand, Chinese manufacturers
currently face mounting cost pressure, which stem from the rising wages and the higher prices
of raw materials and energy. RMB appreciation poses another challenge to Chinese exporters.
Finally, though protectionism is decreasing on a global basis, more protectionist policies against
China have been observed.
The post-!nancial crisis strategies of China’s manufacturers
1. Cost reduction
Various cost cutting approaches have been adopted by the enterprises to cope with the
challenges. Examples include automation (substituting machines for workers), improving
operation efficiency, outsourcing non-core production processes such as transportation,
development of online sourcing and marketing, etc. As a case in point, Vtech, one of the largest
corded and cordless telephone suppliers of AT&T, has increased automation and rely less on
manpower.
2. Diversifying export markets
The !nancial crisis has made enterprises realize that solely relying on traditional export markets
could be risky; and that diversifying export markets is one of the way-outs. Traditional export
markets such as the US, Europe and Japan are still weak, yet the emerging markets maintained
strong growth momentum.
The ASEAN and the other BRIC countries are examples of markets with huge potentials. The
trade volume between China and ASEAN grew by 49.6% year-on-year (yoy) in 2Q10, while
trade between China and the US, Europe and Japan only rose by 34.1% yoy, 39.1% yoy and
36.1% yoy, respectively. The stunning growth of the Sino-ASEAN trade was largely due to the
!"#$#%&'(#)*+*,-./#0*'1-* DB
!"#$%&'()*+,+-.,/$-0.'.'$'(0,(#1.#'$&2$3".+,4'$5,+62,-(60#0'$,+7$'&60-.+1$86'.+#''#'
establishment of the China-ASEAN Free Trade Area on 1 January 2010. China and the other three
members of the BRICs, namely Russia, Brazil and India, also recorded remarkable growth in
trade volume in 2Q2010, with yoy growth of 41.8%, 51.3% and 57.3% respectively.
3. Developing the China market
More and more export-oriented manufacturers in China started developing the domestic
market, in a bid to reduce their reliance on the unstable export markets and explore new market
opportunities. This is in line with China’s policy of boosting domestic demand. The results of a
survey conducted by the Chinese Manufacturers’ Association of Hong Kong (CMA) in April 20101
demonstrate the escalating importance of the Chinese market to Hong Kong-owned enterprises.
About 70% of the respondents expect the export orders in 2010 to be stable or better than year
2009. In comparison, over 90% of the enterprises which sell to the China market expected to
see stable or more orders in 2010, and the average expected annual growth in orders reached as
high as 30%.
However, selling in China is not easy. According to the above-mentioned survey by the CMA,
the various forms of tax and administrative fees, complicated administrative procedures and
regulations, strict restrictions on processing trade enterprises selling in the domestic market,
serious infringement of intellectual property rights, and lack of distribution channels are the major
obstacles barring the export-oriented manufacturers from developing the domestic market.
Both central and local governments have introduced policies to help the manufacturers. For
example, the State Council issued a series of policies in May 2009, including simplifying the
approval procedures for processing trade enterprises without domestic selling rights to sell in the
domestic market and organizing trade fairs for domestic selling.
Local governments in export-oriented provinces have also been active in helping the
manufacturers to tap into the domestic market. Take Guangdong province as an example.
In order to facilitate the enterprises engaging in processing/ assembly operations and
compensatory trade (TFPs) to transform into foreign-invested enterprises (FIEs), which
are allowed to sell in the domestic market, the government announced in August 2008 the
instructions to help enterprises transform without the need to cease production. Tax subsidies
would also be provided to these enterprises during the process.
1 The Chinese Manufacturers’ Association (CMA), Survey on CMA Members’ Operation in the PRD, April 2010. The respondents are Hong Kong manufacturers operating in the Pearl River Delta. A total of 222 valid responses were collected.
0/"',#3&-./,+"'(#4*5*6789*'1#)*87-1#:;<2<=DC

4. Industrial upgrading and transformation
Facing numerous challenges including tightened processing trade policies (e.g. expanding of the
prohibited and restricted lists for processing trade), the reduction in export VAT rebates, RMB
appreciation and the rise of labour cost after a series of labour disputes, enterprises have to
accelerate their upgrading and transformation.
Homa Appliances Co.,Ltd (Homa) is a case in point. It is a Chinese refrigerator manufacturer
which exports its products mainly to the European Union (EU). It is the original equipment
manufacturer (OEM)2 for famous brands such as Whirlpool, Changhong and TCL. It started
building its own brand since 2007, and it hired pop stars as the brand’s spokespersons and
launched TV commercials to increase popularity of the brand. Homa also developed the Chinese
rural market with the help of the “rural subsidies scheme for home appliance purchases”
program.3 The sales of Homa’s refrigerators in the rural market turned out to be more than
satisfactory. On the other hand, Homa’s export business also outperformed the market. In 2009,
while big brands like Samsung, LG and Haier were suffering from decline in exports, Homa
achieved stunning export growth of 70% – with 2.5 million refrigerators exported overseas.
In the face of competition from top brands,# some enterprises focus on development of new
products. Beijing Tianyu Communication Equipment Co.Ltd, a handset manufacturer, launched
new handsets with its functions and design tailor-made for Chinese consumers. With its
competitive price, the new model contributed signi!cantly to the increasing market share for the
company. The company’s market share in 1Q07 was only 1.2%, but it climbed to 7.5% in 1Q10.
The company is now the third largest player in the handset market in China, only after Nokia and
Samsung.
BYD Company Limited (BYD) is another case for industrial upgrading. BYD produced
rechargeable batteries at the beginning and then stepped into the automobile business. The
company applied their leading technology in battery manufacturing when it was doing R&D on
environmental-friendly electric automobiles. The E6 electric car was introduced in Shenzhen
earlier this year, and the company expects to export E6 to the US later this year and to Europe
2 An original equipment manufacturer, or OEM, manufactures products or components according to the design and con!gurations speci!ed by the client, and the products or components are retailed under the client's brand name. An original design manufacturer (ODM) is a company which designs and manufactures a product which is speci!ed and eventually branded by another !rm for sale. An original brand manufacturer, or OBM, is a company selling products under its own brand.
3 The government launched the program in early 2009. Under this program, rural households across the country are offered subsidies of up to 13% of the prices for purchases of designated household appliances.
!"#$#%&'(#)*+*,-./#0*'1-* DD
!"#$%&'()*+,+-.,/$-0.'.'$'(0,(#1.#'$&2$3".+,4'$5,+62,-(60#0'$,+7$'&60-.+1$86'.+#''#'

in 2011. Besides automobile manufacturing and distribution, BYD will work with a subsidiary of
Société Générale to expand its business scope into car loans.
5. Industrial relocation
The central government had planned to encourage enterprises in the eastern coast to relocate
to the less developed central and western China since 2007, but the outbreak of the !nancial
tsunami called it a halt. Given the surge in raw materials, labour and energy costs, as well as
growing expectations of RMB appreciation recently, enterprises have to re-consider moving
locations. According to the abovementioned CMA survey, 33.1% of the surveyed enterprises with
production activities in the Pearl River Delta would consider relocating their production.4
For example, facing the recent series of suicides among its workers, Foxconn speeded up its
construction of the new plant in Chongqing. It also accelerates its plans to set up new production
capacities in other inland provinces such as Henan and even other countries like Vietnam and
India.
Some would consider expanding their existing production lines outside China. Coach, the
international luxury brand of women’s handbag, was planning to expand its production scale
in Vietnam and India. Takara Tomy, a Japanese toy company, also decided to shift 30% of its
existing production from China to Vietnam in the next few years.
More enterprises adopt a gradual approach towards relocation. They prefer to relocate labour
intensive or low value-added production processes to low-cost provinces !rst. For example,
Foxconn will relocate almost all parts of its production line from Shenzhen to the inland, leaving
only two high value-added processes in the Shenzhen production plants.
In the past, enterprises were reluctant to relocate to inland China since the production chains
were not yet formed there. However, it is likely that the recent waves of relocation of large
enterprises would bring their upstream and downstream enterprises, such as suppliers,
logistics and other commercial services providers to the inland regions. The emergence of
industrial clusters in the inland regions will be another favourable factor. It is expected that more
enterprises will opt for relocation in the near future.
4 The Chinese Manufacturers’ Association (CMA), Survey on CMA Members’ Operation in the PRD, April 2010.
0/"',#3&-./,+"'(#4*5*6789*'1#)*87-1#:;<2<=2<<

6. Taking full advantage of government policies to reinvigorate the economy
The central government has introduced a series of policies to help enterprises to get through the
dif!cult time. For example, to facilitate industrial upgrading, the Ministry of Finance announced
in June 2010 that subsidies or interest-free loans would be provided to small- and medium-sized
enterprises (SMEs) for upgrading technology, energy saving and emission reduction.
As for industrial relocation, an array of policies was introduced by the State Council in April 2010
to facilitate industrial relocation. Measures such as tax breaks will be implemented to encourage
foreign-invested enterprises in eastern China to relocate to central and western China.
The government also tries to encourage enterprises to develop the domestic market. A number
of policies have been introduced to help export-oriented manufacturers to deal with problems
on sourcing, production and testing when developing the domestic market. More details can be
found in the part “developing the China market” above.
Local governments are also actively providing policy supports to enterprises. For example,
Guangdong government has implemented new measures since April 2010 to help its enterprises
develop the overseas market, in a bid to promote the province’s competitiveness at the
international level.
Implications for sourcing businesses
1. China remains one of the most competitive sourcing bases in the world
According to the 2010 Global Manufacturing Competitiveness Index, a report by Deloitte’s Global
Manufacturing Industry group and the U.S. Council on Competitiveness, China ranks !rst in
terms of manufacturing competitiveness. The report also forecasts that China will remain the
most competitive location for manufacturing in the coming !ve years.5
To many multi-national corporations (MNCs), China is still their most important sourcing base.
Despite the challenging business environment, some of them have even expanded the scale of
sourcing in China. This is attributable to the relatively well-developed infrastructure, thousands of
vibrant industrial clusters with complete production chains, abundant supply of innovative talents
5 Deloitte, 2010 Global Manufacturing Competitiveness Index, June 2010. It is a report released by Deloitte’s Global Manufacturing Industry group and the U.S. Council on Competitiveness. The result is based on the responses of more than 400 chief executive of!cers and senior manufacturing executives worldwide to a survey on manufacturing competitiveness conducted in late 2009 and early 2010.
!"#$#%&'(#)*+*,-./#0*'1-* 2<2
!"#$%&'()*+,+-.,/$-0.'.'$'(0,(#1.#'$&2$3".+,4'$5,+62,-(60#0'$,+7$'&60-.+1$86'.+#''#'

and skilled labour, stable political environment and diversi!ed yet distinctive products available in
China.
As for Li & Fung Limited, one of the largest global supply chain management companies, China
remains its most important sourcing market. In 2009, 54% of its global sourcing was from China,
up from 52% in 2008. Other renowned MNCs which set up sourcing departments or even head
of!ces of sourcing in China include IBM, Of!ce Depot and Staples. China is also an increasingly
popular location for manufacturing bases and sourcing for Hong Kong enterprises. According to
a survey on offshore trade conducted by the Hong Kong Trade Development Council in 1Q20106,
93% of the surveyed enterprises conducted manufacturing or sourcing activities in the Chinese
Mainland in 2009. Besides, the percentage of enterprises which manufactured or sourced solely
in China rose signi!cantly from 56% in 2006 to 62% in 20097.
On the other hand, trade protectionism against China has been on the rise. Commonly-used
measures by foreign countries include raising technical and environmental barriers for Chinese
imports. To overcome these barriers, enterprises in China have turned their focus to enhancing
product quality. A survey by the Development Research Centre of the State Council revealed
that many foreign companies were planning to relocate their R&D centres to China, believing
that the technological talents in China can greatly contribute to the quality enhancement of
their products. China thus will remain a highly competitive sourcing base as more products with
outstanding quality will emerge in China.
2. The China-plus-one strategy – one should be cautious when extending
sourcing network to other countries
Due to the surging production costs, especially the labour cost, in China, more buyers tend
to adopt the “China-plus-one” strategy and adjust the proportion of sourcing among different
sourcing bases. As it continues to move upward the value chain, China and other manufacturing
bases in the emerging economies can complement each other to satisfy overseas demand for
labour intensive products.
However, one should not focus only on production costs when extending his sourcing network
to other low-cost countries. Factors such as manufacturing capabilities, political and economic
environments, availability of industrial clusters, quality of labour force, language and culture, and
6 Hong Kong Trade Development Council, Survey on Offshore Trade of Hong Kong, June 2010.7 Hong Kong Trade Development Council, Survey on Offshore Trade of Hong Kong, June 2010.
0/"',#3&-./,+"'(#4*5*6789*'1#)*87-1#:;<2<=2<;

transportation and logistics should also be taken into account. For example, Bangladesh offers
low-cost production, but it is always overbooked. As for Southeast Asian countries such as
Vietnam, Indonesia, Thailand and Cambodia, the smaller landmass and workforce, as well as the
less developed infrastructure and transportation are obstacles to large scale production in spite
of their lower cost of land and labour. One should also be aware of the political unrest in some of
these countries, such as Thailand and Indonesia.
3. Exploring sourcing opportunities in other regions in China
Apart from the coastal manufacturing bases, other provinces, especially those located in central
and western China, also deserve attention from buyers. According to the National Bureau of
Statistics (NBS), the value-added of industrial enterprises above designated size in the whole
country grew by 17.6% yoy in 1H2010. By region, the growth rates in eastern, central and
western regions were 16.7%, 20.7% and 17.6% respectively. China Customs also reveals that
Guangdong, Jiangsu and Shanghai together recorded a growth of 36.6% in processing trade in
1H2010, while the growth rate for central China and western China reached 62.5% and 61.8%
respectively. These !gures indicate stronger growth in central and western China than in the
coastal region.
According to the list of top 100 industrial clusters in China released by the Chinese Academy
of Social Sciences in December 20098, many of the competitive clusters in China were located
in the coastal areas. However, an increasing number of competitive industrial clusters were
emerging in central and western China. In the 2007 and 2008 exercises, only 5 or 6 industrial
clusters on the top 100 list were from inland provinces, but the number rose to 16 in 2009. The
change was mainly attributed to the industrial relocation and the robust development of the
inland market in recent years. Nowadays, products with outstanding quality and competitive
price are available not only in the coastal areas. Therefore, buyers should explore and nurture
relationship with suppliers from emerging manufacturing bases in the inland regions.
4. Supplier management is crucial
Buyers are advised to stick to quality suppliers with sound management and up-to-standard
production. The recent labour disputes at Foxconn and Honda have raised public awareness on
“sweatshops”. Consumers are increasingly concerned about the misbehavior of manufacturers
8 The Chinese Academy of Social Sciences (CASS) released the list of top 100 industrial clusters in China in December 2009. This is the third annual exercise since 2007. The CASS aims to encourage relevant government departments to attach more importance to the sustainable development of industrial clusters.
!"#$#%&'(#)*+*,-./#0*'1-* 2<>
!"#$%&'()*+,+-.,/$-0.'.'$'(0,(#1.#'$&2$3".+,4'$5,+62,-(60#0'$,+7$'&60-.+1$86'.+#''#'

and brand owners, such as providing inhumane working conditions for the workers.
To respond to the consumer concerns, buyers should monitor the suppliers on all issues related
to corporate social responsibility. In fact, maintaining good and interdependent relationship
is crucial for both buyers and suppliers. Buyers should have a good understanding of the
suppliers’ operation, and should keep in touch with all levels of the suppliers’ staff for effective
communication.
5. Green sourcing is gaining importance
Global warming tops the agenda of many countries nowadays, while consumers are becoming
more conscious of green issues. Carbon emissions, renewable energy, recycling, as well as
organic products are commonly discussed topics. As for enterprises, customers’ concerns
over green issues lead them to practise green sourcing. Green sourcing can be practised
through carrying out green policies based on customers’ requirements regarding environmental-
friendly raw materials, packaging and product management, as well as adopting energy savings
measures in daily operation.
Green sourcing brings bene!ts to enterprises in many ways. First, it can satisfy consumers
who are more environmentally conscious. Second, production costs and social costs can be
brought down and revenue can be boosted by energy savings and emission reduction during
the production process. Besides, the environmental-friendly products can more easily enter the
overseas markets with green trade barriers. Finally, it can contribute to a better public image and
reputation of the enterprises.
In fact, more and more enterprises integrate green sourcing into their sustainable development
strategy. For example, Walmart, the world’s largest retailer, promised to provide products with
carbon emission labels in 2010. Zhejiang Aokang Shoes Co., Ltd., one of the leading shoe
manufacturers in China, has introduced a set of green sourcing standards for its products.
The green standards cover the design, production and retailing processes. For instance, raw
materials for shoe production, including leather, soles and shoe ornaments have to meet the
green requirements set in the standards.
6. Outsourcing the sourcing function has become a trend
By outsourcing non-core functions to professionals providing quality services, enterprises can
focus on their core competences. Sourcing is one of the business processes to be outsourced; it
0/"',#3&-./,+"'(#4*5*6789*'1#)*87-1#:;<2<=2<?

can be partly or entirely outsourced to sourcing !rms. In fact, quite a number of the US retailers
have outsourced their sourcing functions to professional sourcing !rms so that they can focus
more on product design and development, retailing and marketing.
Amid the financial crisis, enterprises had to adopt stricter cost control measures. Many
enterprises chose to outsource their sourcing functions. It is expected that the trend will continue
even during the recovery. For example, Walmart Stores entered into a landmark sourcing
arrangement with Li & Fung Limited in January 2010. The sourcing volume is expected to reach
USD 2 billion in the !rst year of cooperation.
7. To source and sell in China makes China sourcing even more appealing
As mentioned above, many MNCs source in China and thus consumers all over the world are
enjoying the high quality yet price competitive Chinese-made products. However, China is not
only a globally competitive sourcing base, but also a consumer market of huge potential. In the
past 30 years, China has achieved tremendous economic success and the average income of
the Chinese people is on continual rise. The Chinese consumer market has been growing rapidly:
Double-digit growth in total retail sales of consumer goods was recorded almost every year for
the past 10 years. In view of this, many buyers who originally source in China and sell in overseas
markets now want to tap into China’s lucrative consumer market. According to the 2010 White
paper on the State of American Business in China, 58% of their member companies (US
companies in China) indicated that they were in China to produce or source goods and services
domestically for the Chinese market, rather than for export9.
However, numerous institutional obstacles still hinder domestic selling. For example, many
Chinese manufacturers do not have domestic selling rights. The Chinese consumers thus do
not have access to the high quality and price competitive Chinese-made products. Removing
these institutional barriers will bene!t not only the Chinese consumers, but will also be in line with
government’s policy to boost domestic demand. As for the enterprises, if they can source from
China and then sell to the China market, ‘China sourcing’ will become an even more appealing
strategy.
9 The American Chamber of Commerce in the People’s Republic of China (AmCham-China), 2010 White Paper on the State of American Business in China, April 2010. The survey was conducted between November and December 2009. 388 member enterprises, including MNCs and SMEs, took part in the survey.
!"#$#%&'(#)*+*,-./#0*'1-* 2<@
!"#$%&'()*+,+-.,/$-0.'.'$'(0,(#1.#'$&2$3".+,4'$5,+62,-(60#0'$,+7$'&60-.+1$86'.+#''#'

0/"',#3&-./,+"'(#4*5*6789*'1#)*87-1#:;<2<=2<A
Appendix: About the China Purchasing Development Report (Chinese version)
The Chinese full report (~400,000 words), consisting of a China sourcing survey and 35 essays,
covers all aspects about sourcing development in China. The table of content of the full report is
as follows:
Chapter 1 OverviewChina sourcing survey 2010
Sourcing and supply chain management in China: Outlook for the next !ve years
Chapter 2 Background and environmentGlobal economic and !nancial market outlook
An analysis of China’s economy in 2009/10 with PMI
An analysis of China’s economy in 2009/10 with NMI
The bulk commodities market in China: Analysis in 2009 and prospects in 2010
Sourcing light-manufactured consumer products in China: Cost trends and outlook
Highlights of the commodities market in China in 2010
Chapter 3 Sourcing activities of different industries Survey on the sourcing activities of !ve key manufacturing industries in China 2010
The post-!nancial crisis strategies of China’s manufacturers and sourcing businesses
The distribution centre model and the application of supply chain management in the
electronics and IT industry
Sourcing of auto parts: lessons from the experience of international automobile enterprises
Enhancement of supply chain management is the key to sustainable development of
manufacturing enterprises
Sourcing of agricultural products in China: strategies and the development of supply chain
management
Supply chain management in the retail industry
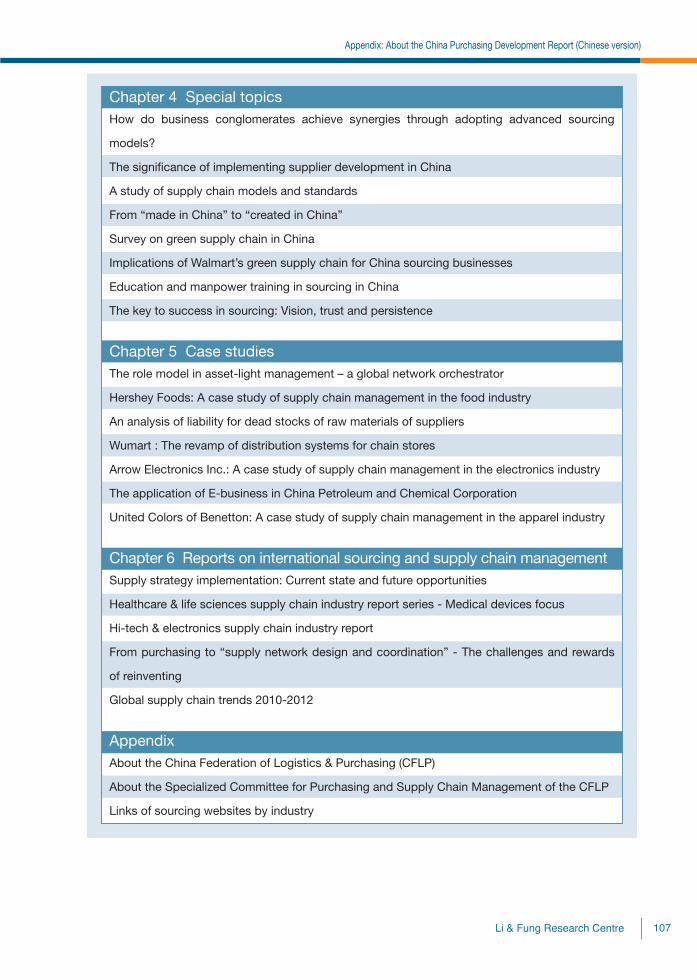
!"#$#%&'(#)*+*,-./#0*'1-* 2<B
9%%#+7.:;$98&6($("#$3".+,$<60-",'.+1$=#>#/&%5#+($?#%&0($@3".+#'#$>#0'.&+A
Chapter 4 Special topics How do business conglomerates achieve synergies through adopting advanced sourcing
models?
The signi!cance of implementing supplier development in China
A study of supply chain models and standards
From “made in China” to “created in China”
Survey on green supply chain in China
Implications of Walmart’s green supply chain for China sourcing businesses
Education and manpower training in sourcing in China
The key to success in sourcing: Vision, trust and persistence
Chapter 5 Case studies The role model in asset-light management – a global network orchestrator
Hershey Foods: A case study of supply chain management in the food industry
An analysis of liability for dead stocks of raw materials of suppliers
Wumart : The revamp of distribution systems for chain stores
Arrow Electronics Inc.: A case study of supply chain management in the electronics industry
The application of E-business in China Petroleum and Chemical Corporation
United Colors of Benetton: A case study of supply chain management in the apparel industry
Chapter 6 Reports on international sourcing and supply chain management Supply strategy implementation: Current state and future opportunities
Healthcare & life sciences supply chain industry report series - Medical devices focus
Hi-tech & electronics supply chain industry report
From purchasing to “supply network design and coordination” - The challenges and rewards
of reinventing
Global supply chain trends 2010-2012
Appendix About the China Federation of Logistics & Purchasing (CFLP)
About the Specialized Committee for Purchasing and Supply Chain Management of the CFLP
Links of sourcing websites by industry

English report productionLi & Fung Research Centre, Member of Li & Fung Group
Authors:
Chan So Ching
Tel: (852) 2300 2474
Helen Chin
Tel: (852) 2300 2471
Leung Hoi Shuen
Tel: (852) 2300 2467
0/"',#3&-./,+"'(#4*5*6789*'1#)*87-1#:;<2<=2<C


