101
2016 Q3 China’s banking sector: Performance of listed banks and hot topics December 2016

2016 Q3China’s banking sector: Performance of listed banks and hot topics
December 2016

2© 2016 KPMG Huazhen LLP — a People‘s Republic of China partnership, KPMG Advisory (China) Limited — a wholly foreign owned enterprise in China, are member firms of the KPMG network of independent member firms affiliated with KPMG International Cooperative (“KPMG International”), a Swiss entity. All rights reserved.
INTRODUCTION
China’s banking sector: Performance of listed banks and hot topics is a quarterly publication from KPMG China that provides its readers with analysis of important topics and key performance indicators in China’s banking industry. It aims to track the latest developments in the sector and provides commentary on issues affecting the future direction of the industry. This publication also gathers considerable data to assess the financial performance of China’s listed banks, and combined with KPMG China’s professional experience, helps readers better grasp the current environment in China’s banking sector.
This issue focuses on big data used to promote the transformation of banking outlets; how to build a data mart for banking credit risk from the basics; the interpretation of the implications of Circular No.42 on banking business; the discussion and analysis of the accounting treatment of the
business of investment-loan linkage of banks; and the implications of blockchain technology on commercial banks and proposed countermeasures. These topics are receiving more and more attention in the banking industry, and we hope that our discussion will help our readers gain a firmer understanding. Furthermore, this issue provides an overview of the financial position and performance of listed banks in the third quarter of 2016, which will allow readers to better understand the overall performance of the sector.
For more information, please contact any of the KPMG China professionals listed in the ‘Contact us’ section.

Content
1 2016 Q3 economy and finance 4
2 Analysis of 2016 Q3 financial data of listed banks 14
3 China’s banking sector: Hot topics 36
4 Appendix: 2016 Q3 financial data of listed banks 78

1 2016 Q3 economy and finance

5© 2016 KPMG Huazhen LLP — a People‘s Republic of China partnership, KPMG Advisory (China) Limited — a wholly foreign owned enterprise in China, are member firms of the KPMG network of independent member firms affiliated with KPMG International Cooperative (“KPMG International”), a Swiss entity. All rights reserved.
Q3 data analysis
Overview of keymacroeconomic indicators Unit 2014Q3 2014Q4 2015Q1 2015Q2 2015Q3 2015Q4 2016Q1 2016Q2 2016Q3
GDP YoY(%) 7.1 7.2 7.0 7.0 6.9 6.8 6.7 6.7 6.7
CPI YoY(%) 2.1 2.0 1.2 1.3 1.4 1.4 2.1 2.1 2.0
PPI YoY(%) (1.6) (1.9) (4.6) (4.6) (5.0) (5.2) (4.8) (3.9) (2.9)
Industrial added value YoY(%) 8.5 8.3 6.4 6.3 6.2 6.1 5.8 6.0 6.0 Total retail sales of consumer goods YoY(%) 12.0 12.0 10.6 10.4 10.5 10.7 10.3 10.3 10.4
Fixed asset investment YoY(%) 16.1 15.7 13.5 11.4 10.3 10.0 10.7 9.0 8.2
Exports YoY(%) 5.1 6.1 4.7 0.9 (1.9) (2.9) (9.6) (7.8) (7.5)
Imports YoY(%) 1.3 0.4 (17.6) (15.6) (15.3) (14.2) (13.5) (10.2) (8.2)
Trade surplus(USD) $100 million 1,280.8 1,495.0 1,237.3 1,401.6 1,636.1 1,747.8 1,257.4 1,434.5 1,442.5
M2 YoY(%) 12.9 12.2 11.6 11.8 13.1 13.3 13.4 11.8 11.5
RMB loan growth YoY(%) 13.2 13.6 14.0 13.4 15.4 14.3 14.7 14.3 13.0
Source: National Bureau of Statistics of the People’s Republic of China; Wind Info
• GDP growth slowdown in the third quarter: Based on preliminary calculations, China’s GDP in the first three quarters of 2016 was RMB 52.9971 trillion, a year-on-year (YoY) increase of 6.7% at comparable prices. In terms of quarters, China’s GDP grew by 6.7%, 6.7% and 6.7% YoY in the first, second and third quarters respectively. In terms of sectors, the value added by the primary, secondary and tertiary sectors was RMB 4.0666 trillion, RMB 20.9415 trillion and RMB 27.9890 trillion respectively, representing an increase of 3.5%, 6.1% and 7.6% YoY. China’s GDP in the third quarter of 2016 increased by 1.8% on a quarter-on-quarter basis.
• Drop in import and export trade: In the first three quarters of 2016, the total volume of import and export trade amounted to RMB 17.5318 trillion, a YoY decrease of 1.9%, which is 1.7% lower than that in the first half of 2016. Exports reached RMB 10.0585 trillion, down 1.6% which is 1.1% lower than the drop in the first half of 2016, while imports reached RMB 7.4733 trillion, down 2.3% which is 2.4% lower than the drop in the first half of 2016. The trade balance provided China with a surplus of RMB 2.5852 trillion.
• Steady growth of consumption: In the first three quarters of 2016, total retail sales of consumer goods reached RMB 23.8482 trillion, a nominal increase of 10.4% (9.8% in real terms without the price impact). This was 0.1% higher than the growth rate in the first half of the year.
In the third quarter of 2016, the Chinese Government, facing complicated circumstances both at home and abroad, actively adapted itself and took the lead under the ‘new normal’. Sticking to the general plan of advancing economic growth while maintaining stability, it has unwaveringly promoted supply-side structural reform, moderately expanded aggregate demand and ramped up efforts to cultivate new driving forces. The Chinese economy, while stable, has achieved quality growth and performed better than expected.
In terms of demand, fixed asset investment stabilised while continuing to slow down in the third quarter of 2016. The saleable area of commodity housing continued to drop. Sales in the market increased slightly and consumer goods for upgraded consumption grew rapidly. Import and export trade dropped, though at a slower rate. The price of consumer goods increased moderately. The industry structure continued to improve, and the services sector accounted for 52.8% of overall gross domestic product (GDP). In terms of supply, agricultural and industrial production remained stable. The government’s efforts to advance supply-side reform received encouraging results. The quality and benefits of economic growth improved steadily.

6© 2016 KPMG Huazhen LLP — a People‘s Republic of China partnership, KPMG Advisory (China) Limited — a wholly foreign owned enterprise in China, are member firms of the KPMG network of independent member firms affiliated with KPMG International Cooperative (“KPMG International”), a Swiss entity. All rights reserved.
Monetary expansion and national economic output
Money supply and inflation rate Velocity of money
• The consumer price index (CPI) grew 2.0% YoY in the first three quarters of 2016, which is 0.1% lower than the growth rate in the first half of the year. It increased by 2.0% in urban areas and 1.8% in rural areas.
• Specifically, food, tobacco and liquor prices increased by 4.1% YoY, clothing prices by 1.5%, housing prices by 1.5%, prices for household equipment and maintenance services by 0.5%, prices for educational and entertainment products and services by 1.4%, prices for medical and healthcare products by 3.6%, and prices for other products and services by 2.4%, while prices for transportation and communication fell by 1.8%.
• At the end of September 2016, the broad money (M2) balance was RMB 151.6 trillion, a YoY increase of 11.5%. The RMB loan balance was RMB 104.1 trillion, a YoY increase of 13.0% and the RMB deposit balance was RMB 148.5 trillion, a YoY increase of 11.1%. The RMB loan increment amounted to RMB 10.2 trillion, representing a YoY increase of RMB 255.8 billion, while the RMB deposit increment was RMB 12.8 trillion, representing a YoY decrease of RMB 188.9 billion.
• At the end of September 2016, the narrow money (M1) balance was RMB 45.4 trillion, a YoY increase of 24.7%. The amount of money in circulation (M0) was RMB 6.5 trillion, a YoY increase of 6.6%. The central bank released a net amount of RMB 185.2 billion into the banking system.
• In the first three quarters of 2016, the overall financing increment reached RMB 13.5 trillion, an increase of RMB 1.5 trillion compared with the same period in the previous year. At the end of September 2016, the financing balance amounted to RMB 151.5 trillion, a YoY increase of 12.5%, which is 0.1% higher than that at the end of June 2016.
• Structurally, the proportion of financing in the corporate bond and stock markets increased. Entrusted loans and trust loans also accounted for a larger share. RMB loans and loans in foreign currencies to the real economy dropped. The proportion of undiscounted bank acceptance bills fell noticeably.
Source: National Bureau of Statistics of the People’s Republic of China; People’s Bank of China
3.45 2.41
11.48
6.64
3.45 2.50
12.24
6.02 5.18
3.95
15.94
6.83
4.26
0.002.004.006.008.00
10.0012.0014.0016.0018.00
△M2/△GDP
100.0
100.5
101.0
101.5
102.0
102.5
103.0
0
200,000
400,000
600,000
800,000
1,000,000
1,200,000
1,400,000
1,600,000
CP
I index
RM
B 1
0 m
illio
n
M2 CPI index

7© 2016 KPMG Huazhen LLP — a People‘s Republic of China partnership, KPMG Advisory (China) Limited — a wholly foreign owned enterprise in China, are member firms of the KPMG network of independent member firms affiliated with KPMG International Cooperative (“KPMG International”), a Swiss entity. All rights reserved.
Operating performanceChina manufacturing PMI
• Overall, China’s economy operated steadily in the third quarter of 2016. A number of main indicators were encouraging. However, there was still considerable downward pressure on the economy. In Q3 2016, China’s manufacturing Purchasing Managers’ Index (PMI) was basically in line with previous quarters and showed signs of stabilising. In September 2016, manufacturing PMI was 50.4%, the same as that in August 2016.
• In terms of company scales, the PMI of large enterprises was 52.6%, up 0.8% compared to the previous month, and continued to be above the break-even mark. The PMI of medium-sized enterprises was 48.2%, down 0.7% compared to the previous month, and was still below the break-even mark. The PMI of small enterprises dropped 1.3% to 46.1% and was still below the break-even mark.
• In terms of sub-indexes, of the five sub-indexes that make up the manufacturing PMI, the production and fresh orders indexes were above the break-even mark, while the employment, raw materials inventory and lead time indexes were below this threshold.
• The production index was 52.8%, up 0.2% compared with the previous month, and continued to be above the break-even mark, indicating accelerated growth of manufacturing production.
• The fresh orders index was 50.9%, down 0.4% compared with the previous month, but was still above the break-even mark, indicating that demand for manufacturing products continued to expand, though at a slower rate.
• The employment index was 48.6%, up 0.2% compared with the previous month but still below the break-even mark, indicating that the number of workers employed by manufacturing enterprises continued to fall at a slower rate.
• The raw materials inventory index was 47.4%, down 0.2% compared with the previous month but still below the break-even mark, indicating that the raw materials inventory of manufacturing enterprises continued to drop.
• The lead time index was 49.9%, down 0.7% compared with the previous month and slightly lower than the break-even mark, indicating that the delivery of raw materials by suppliers slowed down slightly.
Source: National Bureau of Statistics of the People’s Republic of China
China manufacturing PMI sub-index
40
45
50
55Production
Fresh order
Raw material inventoryEmployee
Lead time
2016/9 2016/6 2016/3March 2016
47.50
48.00
48.50
49.00
49.50
50.00
50.50
51.00
51.50
September 2016
June2016

8© 2016 KPMG Huazhen LLP — a People‘s Republic of China partnership, KPMG Advisory (China) Limited — a wholly foreign owned enterprise in China, are member firms of the KPMG network of independent member firms affiliated with KPMG International Cooperative (“KPMG International”), a Swiss entity. All rights reserved.
Industrial production YoY growth of accumulative operating income from principal activities and total profits
Operating performance (continued)
• The value added by the above-scale industry in September 2016, net of price factors, increased by 6.1% YoY in real terms, down 0.2% compared with August 2016. On a month-on-month basis, it increased by 0.5%. In the first three quarters of 2016, the added value of above-scale industry increased by 6.0% YoY. In terms of the type of companies, state-owned enterprises, joint-stock enterprises, and foreign-invested and Hong Kong, Macau and Taiwan invested enterprises grew by 3.3%, 6.4% and 6.2% respectively. while collective enterprises fell by 3.8% in September 2016.
• With regard to specific industries, the value added by the mining, manufacturing and the electricity, heating power, gas and water production and supply industries grew by 0.1%, 6.5% and 7.3% respectively in September 2016. As for specific regions, the value added by the eastern, central and western regions increased by 6.5%, 7.6% and 7.9% respectively, while the north-east region decreased by 3.0%. In September 2016, the sales to output ratio of above-scale industrial enterprises reached 97.9%, down 0.1% compared with the same period in the previous year.
• In September 2016, power generation amounted to 491.3 billion kWh, a YoY increase of 6.8%.
• As at September 2016, operating income from the principal activities of above-scale industrial enterprises was RMB 81.85608 trillion, a YoY increase of 3.7%. Operating costs for these principal activities was RMB 70.28982 trillion, a YoY increase of 3.5%, indicating that operating income grew slightly faster than operating costs.
• Above-scale industrial enterprises realised a total profit of RMB 4.63806 trillion, a YoY increase of 8.4%, flat compared with January to August 2016.
• On the other hand, in terms of industries, the mining industry recorded a total profit of RMB 76.14 billion, down 62.1% YoY. The manufacturing industry realised a total profit of RMB 4.17438 trillion, a YoY increase of 13.5%, and the electricity, heating power, gas and water production and supply industry realised a total profit of RMB 387.54 billion, down 3.6%.
Source: National Bureau of Statistics of the People’s Republic of China; Wind Info
-6.00
-4.00
-2.00
0.00
2.00
4.00
6.00
8.00
10.00
Sep-14 Dec-14 May-15 Jun-15 Sep-15 Dec-15 May-16 Jun-16 Sep-16
Industrial value added: YoY Power generation: YoY
(4.00)
(2.00)
-
2.00
4.00
6.00
8.00
10.00
Sep-14 Dec-14 Mar-15 Jun-15 Nov-15 Dec-15 Mar-16 Jun-16 Sep-16
Growth on operating income from principle actvities (%)Growth on total profit (%)

9© 2016 KPMG Huazhen LLP — a People‘s Republic of China partnership, KPMG Advisory (China) Limited — a wholly foreign owned enterprise in China, are member firms of the KPMG network of independent member firms affiliated with KPMG International Cooperative (“KPMG International”), a Swiss entity. All rights reserved.
Money market rate Bond yields
Dynamics of money and bond market interest rates
Source: Wind Info; People’s Bank of China
0.00%
1.00%
2.00%
3.00%
4.00%
5.00%
6.00%
Yield to maturity of fixed-rate treasury bonds traded in an exchange: 1 yearYield to maturity of fixed-rate treasury bonds traded in an exchange: 5 yearsYield to maturity of corporate bonds traded in an exchange (AAA): 1 year
0.00%
1.00%
2.00%
3.00%
4.00%
5.00%
6.00%
7.00%
Sep
-14
Oct
-14
Nov
-14
Dec
-14
Jan-
15Fe
b-15
Mar
-15
Apr
-15
May
-15
Jun-
15Ju
l-15
Aug
-15
Sep
-15
Oct
-15
Nov
-15
Dec
-15
Jan-
16Fe
b-16
Mar
-16
Apr
-16
May
-16
Jun-
16Ju
l-16
Aug
-16
Sep
-16
Weighted repo rate: 7 daysShibor: 3 monthsYield to maturity of central bank bills: 1 year
• Overall, the financial markets were stable in the third quarter of 2016. Based on data published by the People’s Bank of China (PBOC), the total turnover of the currency markets in Q3 2016 amounted to RMB 202.8 trillion, a YoY increase of 41.7%. In September 2016, the total turnover of the currency markets totalled RMB 59.3 trillion, a YoY increase of 29.5% and a month-on-month decrease of 19.9%.
• At the end of Q3 2016, the yield to maturity of one-year central bank bills fell significantly compared with the same period in the previous year. At the end of September 2016, average yields were down 2.2%, 48 basis points lower than the end of September 2015 and down 15 basis points compared with the end of 2015.
• Compared with early 2016, the overnight Shanghai Interbank Offered Rate (Shibor) increased by 33.6 basis points and closed at 2.3270%, seven-day Shibor increased by 12.2 basis points and closed at 2.4770%, and one-month Shibor fell by 26.10 basis points and closed at 2.7410% at the end of September 2016.
• In Q3 2016, against the backdrop of the ‘new normal’, the Chinese Government continued to adopt a proactive fiscal policy and a sound and flexible monetary policy to ensure that the economy operated steadily. Due to the macroeconomic situation, the yield curve of all bonds fluctuated to some degree.
• In Q3 2016, the accumulated turnover of the interbank bond market was RMB 36.4 trillion, representing a YoY increase of 46.2%. In September 2016, the turnover of the interbank bond market was RMB 11.2 trillion, a YoY increase of 32.0% and a month-on-month (MoM) decrease of 10.8%. At the end of September 2016, the total interbank index was 177.01, up 0.74 basis points or 0.4% from the end of the previous month.

10© 2016 KPMG Huazhen LLP — a People‘s Republic of China partnership, KPMG Advisory (China) Limited — a wholly foreign owned enterprise in China, are member firms of the KPMG network of independent member firms affiliated with KPMG International Cooperative (“KPMG International”), a Swiss entity. All rights reserved.
China commodity price index (general index) China commodity price index (by type)
Analysis of the commodity price index
• Commodity prices by type: Compared to the same period in 2015, price indices of agricultural products fell by 4.5%, while price indices of the other eight major commodities increased in September 2016. Price indices of steel, energy, oil and grease, sugar, non-ferrous metal, mineral products, livestock, and rubber increased by 25.6%, 21.9%, 19.7%, 16.9%, 4.4%, 3.7%, 1.0% and 1.0% respectively.
• Compared to the beginning of the year, the price index of agricultural products decreased by 0.8% while price indices of the other eight commodities all increased in September 2016. Price indices of energy, steel, mineral products, oil and grease, non-ferrous metal, sugar, rubber, and livestock increased by 61.3%, 33.3%, 32.5%, 23.0%, 15.1%, 14.8%, 9.4% and 2.8% respectively.
• In Q3 2016, the China commodity price index (CCPI) recorded a noticeable increase and was higher compared to the same period in the previous year.
• In September 2016, the CCPI continued to rise. Statistics show that the CCPI average in September was 108.46 points, up 3.69 points or 3.5% from the previous month, and up 13.39 points or 14.1% compared to the same period in 2015. Compared to the beginning of the year, it increased by 26.98 points or 33.1%.
Sources: E-circulation.cn
70
80
90
100
110
120
130
140
Sep
-14
Oct
-14
Nov
-14
Dec
-14
Jan-
15Fe
b-15
Mar
-15
Apr
-15
May
-15
Jun-
15Ju
l-15
Aug
-15
Sep
-15
Oct
-15
Nov
-15
Dec
-15
Jan-
16Fe
b-16
Mar
-16
Apr
-16
May
-16
Jun-
16Ju
l-16
Aug
-16
Sep
-16
China commodity price index (general index)
78.73 78.495.22
65.7150.19
163.71
255.1
180.73
118.53
0.00
50.00
100.00
150.00
200.00
250.00
300.00
Sep-16 China commodity price index (by type)

11© 2016 KPMG Huazhen LLP — a People‘s Republic of China partnership, KPMG Advisory (China) Limited — a wholly foreign owned enterprise in China, are member firms of the KPMG network of independent member firms affiliated with KPMG International Cooperative (“KPMG International”), a Swiss entity. All rights reserved.
-30.00%
-20.00%
-10.00%
0.00%
10.00%
20.00%
30.00%
40.00%
Sep
-14
Oct
-14
Nov
-14
Dec
-14
Feb-
15M
ar-1
5A
pr-1
5M
ay-1
5Ju
n-15
Jul-1
5A
ug-1
5S
ep-1
5O
ct-1
5N
ov-1
5D
ec-1
5Fe
b-16
Mar
-16
Apr
-16
May
-16
Jun-
16Ju
l-16
Aug
-16
Sep
-16
New floor space under construction: Cumulative YoY growthNew floor space completed: Cumulative YoY growthNew house sales area: Cumulative YoY growth
Growth of saleable area, floor space completed and new floor space under construction Housing price indexes of 100 cities
Residential housing
Source: National Bureau of Statistics of the People’s Republic of China; Wind Info
• In the first three quarters of 2016, real estate investment amounted to RMB 7.4598 trillion, a nominal YoY increase of 5.8% (7.1% in real terms without the price impact). The growth rate was 0.3% lower than that in the first half of the year, but was 0.4% higher than that during the period from January to August 2016. Out of this total, residential housing investment increased by 5.1%. The new floor space under construction was 1.22655 billion m2, a YoY increase of 6.8%, while the new floor space under construction for residential housing increased by 6.7%.
• The saleable area of commodity housing amounted to 1.05185 billion m2, a YoY increase of 26.9%, while the saleable area of residential housing increased by 27.1%. Commodity housing totalled RMB 8.0208 trillion, a YoY increase of 41.3%, while sales of residential housing increased by 43.2%. The area of land acquired by real estate developers was 149.17 million m2, a YoY decrease of 6.1%.
• At the end of September 2016, the available-for-sale areas of commodity housing amounted to 696.12 million m2, down 18.04 million m2 compared with the end of June 2016. The capital of real estate development enterprises in the first three quarters was RMB 10.4711 trillion, a YoY increase of 15.5%.
• In September 2016, the difference between the house prices of the 70 large and medium-sized cities widened. First-tier cities, some popular second-tier cities and other cities had different price directions.
• Among first-tier cities and a handful of second-tier cities, there were 14 which saw the prices of new commodity residential housing increase by above 2% on a month-on-month basis. Among the rest, 6 cities experienced a month-on-month fall, 1 maintained the prices at the same level as the previous month and 40 experienced an increase of less than 2%.
• There were 14 cities which saw the prices of new commodity residential housing increase by above 10% YoY. Among the rest, 6 cities saw their house prices fall and 42 experienced an increase of less than 10%.
-10.00
-5.00
0.00
5.00
10.00
15.00
20.00
25.00
30.00
Sep
-14
Oct
-14
Nov
-14
Dec
-14
Jan-
15Fe
b-15
Mar
-15
Apr
-15
May
-15
Jun-
15Ju
l-15
Aug
-15
Sep
-15
Oct
-15
Nov
-15
Dec
-15
Jan-
16Fe
b-16
Mar
-16
Apr
-16
May
-16
Jun-
16Ju
l-16
Aug
-16
Sep
-16
First-tier cities: YoY Second-tier cities: YoY
Third-tier cities: YoY

12© 2016 KPMG Huazhen LLP — a People‘s Republic of China partnership, KPMG Advisory (China) Limited — a wholly foreign owned enterprise in China, are member firms of the KPMG network of independent member firms affiliated with KPMG International Cooperative (“KPMG International”), a Swiss entity. All rights reserved.
Monthly fiscal balances (RMB 10 million) Fiscal revenue and GDP (RMB 10 million)
Government finance
• In the first three quarters of 2016, public fiscal revenue amounted to RMB 12.14 trillion at the national level, a YoY increase of 5.9%. The general budgetary revenue of the central government reached RMB 5.4628 trillion, a YoY increase of 4.4% (1.5% with the same calibre as the previous year), and the general budgetary revenue of local governments reached RMB 6.6772 trillion, a YoYincrease of 7.2% (9.8% with the same calibre as the previous year). Taxes raised by the central government amounted to RMB 10.0881 trillion, a YoY increase of 6.6%. It is expected that due to downward pressure on the economy and the impact of the VAT reforms, the government faces a very difficult situation with regard to the collection of fiscal revenue.
• In the first three quarters of 2016, national public expenditure reached RMB 13.5956 trillion, representing a YoY increase of 12.5%. The central government spent RMB 1.9463 trillion, a YoY increase of 5.4%, while local governments spent RMB 11.6493 trillion, a YoY increase of 13.8%.
• GDP amounted to RMB 18.9334 trillion in the third quarter of 2016, representing a
YoY increase of 6.7% calculated by comparable prices. In terms of sectors, the
value added by the primary, secondary and tertiary sectors was RMB 1.8569
trillion, RMB 7.5165 trillion and RMB 9.56 trillion respectively, which represented a
YoY increase of 4.0%, 6.1% and 7.6%.
• The proportion of national fiscal revenue to GDP stabilised at around 19% in the
third quarter of 2016, which is similar to the corresponding period for 2015.
Source: National Bureau of Statistics of the People’s Republic of China; Wind Info
0
5,000
10,000
15,000
20,000
25,000
30,000
0
50,000
100,000
150,000
200,000
250,000
GDP Central government revenue
-20,000
-15,000
-10,000
-5,000
0
5,000
10,000
15,000
20,000
Sep
-14
Oct
-14
Nov
-14
Dec
-14
Jan-
15Fe
b-15
Mar
-15
Apr
-15
May
-15
Jun-
15Ju
l-15
Aug
-15
Sep
-15
Oct
-15
Nov
-15
Dec
-15
Jan-
16Fe
b-16
Mar
-16
Apr
-16
May
-16
Jun-
16Ju
l-16
Aug
-16
Sep
-16
Fiscal balance of payments:Value of the current month
Public fiscal revenue:Value of the current month
GDPFiscal revenue

13© 2016 KPMG Huazhen LLP — a People‘s Republic of China partnership, KPMG Advisory (China) Limited — a wholly foreign owned enterprise in China, are member firms of the KPMG network of independent member firms affiliated with KPMG International Cooperative (“KPMG International”), a Swiss entity. All rights reserved.
Import and export trade (USD 100 million) Bank valet exchange settlement(USD 100 million)and sale and exchange rate
Foreign trade and exchange rate
Source: National Bureau of Statistics; Wind Info; and State Administration of Foreign Exchange
• In the third quarter of 2016, the total volume of import and export trade was USD 2.6773 trillion, which represents a YoY decline of 7.81%.
• The volume of export trade reached USD 1.5369 trillion, a decline of 7.64% and the volume of import trade was USD 1.1404 trillion, a decline of 8.03%. The trade surplus was USD 396.4 billion.
• In September 2016, the total volume of import and export trade reached USD 327 billion, a YoY decrease of 6.6%. Exports accounted for USD 184.5 billion, down 10% and imports accounted for USD 142.5 billion, up 1.9%.
• In the third quarter of 2016, bank valet exchange settlements added up to USD 336.8 billion, a YoY decline of 5.8%. Bank valet exchange sales reached USD 386.7 billion, a YoY decline of 38.5%. Settlement and sales accounted for a deficit of USD 49.9 billion, down 2.5% compared with the fourth quarter of 2015.
• Compared with the second quarter of 2016, the RMB depreciated against the USD in the third quarter of 2016. The monthly average exchange rate of USD to RMB rose from 6.5317 to 6.6654.
6.0
6.1
6.2
6.3
6.4
6.5
6.6
6.7
6.8
6.9
7.0
-1,500
-1,000
-500
0
500
1,000
1,500
2,000
2,500
3,000
Sep
-14
Oct
-14
Nov
-14
Dec
-14
Jan-
15Fe
b-15
Mar
-15
Apr
-15
May
-15
Jun-
15Ju
l-15
Aug
-15
Sep
-15
Oct
-15
Nov
-15
Dec
-15
Jan-
16Fe
b-16
Mar
-16
Apr
-16
May
-16
Jun-
16Ju
l-16
Aug
-16
Sep
-16
Monthly surplus of bank valet settlement and sale of the payment exchangeMonthly bank valet settlement of payment in exchange of the monthMonthly bank valet sale of payment in exchange of the monthAverage exchange rate of USD to RMB
0
500
1,000
1,500
2,000
2,500
Sep
-14
Oct
-14
Nov
-14
Dec
-14
Jan-
15Fe
b-15
Mar
-15
Apr
-15
May
-15
Jun-
15Ju
l-15
Aug
-15
Sep
-15
Oct
-15
Nov
-15
Dec
-15
Jan-
16Fe
b-16
Mar
-16
Apr
-16
May
-16
Jun-
16Ju
l-16
Aug
-16
Sep
-16
Trade balance: value ofthe current month
Value of exports : value ofthe current month
Value of imports: value ofthe current month

Analysis of 2016 Q3
financial data of listed
banks
2

15© 2016 KPMG Huazhen LLP — a People‘s Republic of China partnership, KPMG Advisory (China) Limited — a wholly foreign owned enterprise in China, are member firms of the KPMG network of independent member firms affiliated with KPMG International Cooperative (“KPMG International”), a Swiss entity. All rights reserved.
Conditions of assets — Asset scale and quality
In the third quarter of 2016, the structure of assets and liabilities in the banking sector continued the same trend as the first half of the year. Banks placed more emphasis on balancing capital, risk and income, and further optimising their asset allocation structures. While striving to expand interest-bearing assets, they also intensified risk control efforts. As non-credit assets became increasingly important, banks started to take an active stance on their liability businesses and tried to diversify the risk though their bond, interbank deposits and asset securitisation businesses.
In Q3 2016, investment took up an increasing share of banks’ total assets. Affected by the exposure to bill risks in early 2016 and narrowed gains from interest arbitrage resulting from stronger regulations in the interbank market, interbank assets declined in the third quarter of 2016, while investment increased. Bank deposits grew at a slower rate. Both bank deposits and interbank liabilities saw a decline in their share in banks’ asset structures. The optimisation of liability structures continued to be an ongoing process for listed banks.
Overall, China’s economy has grown steadily since 2016. The performance of enterprises has improved. The government has continued to implement prudent monetary policies as part of its efforts to support and facilitate economic restructuring and transformation. The banking sector has continued to provide increased funding services for San Nong (agriculture, farming and rural areas), small and micro businesses, government-subsidised housing and other livelihood projects. Loans to San Nong and small and micro enterprises, and consumption loans have increased significantly. In respect of credit risk control, the overall non-performing loans (NPL) of listed banks have increased. The NPL ratio rose slightly, while asset quality declined slightly compared to the second quarter. The NPL ratio and allowance to NPL ratio have flattened since the second quarter. The number of banks with decreased NPL ratio and increased allowance to NPL ratio have increased, reflecting more steady asset quality in the banking sector.

16© 2016 KPMG Huazhen LLP — a People‘s Republic of China partnership, KPMG Advisory (China) Limited — a wholly foreign owned enterprise in China, are member firms of the KPMG network of independent member firms affiliated with KPMG International Cooperative (“KPMG International”), a Swiss entity. All rights reserved.
In the third quarter of 2016, the total asset size of all listed banks expanded, mainly due to increased investment, loans and advances to customers, and other assets.
Compared with the five major state-owned banks, some of the joint-stock commercial banks and city commercial banks were more aggressive in their pursuit of expansion. The total asset size of GYB increased by 37.42%, which represented the largest increase of the listed banks. This was mainly due to the growth in its investment and loans and advances to customers. The total asset sizes of BON and CMBC increased by 27.10% and 24.68% respectively.
The asset structures of the listed banks also changed compared to the end of last year. The ratio of investment increased by 2.20%. The ratio of loans and advances to customers increased by 0.25%. The ratio of other assets rose by 0.03%. The ratio of cash on hand and deposits with the central bank decreased by 0.31%, while the ratio of amounts due from banks and other institutions fell by 2.17%.
Following the slowdown in China’s economy, banks tried to lower their risk exposure by adjusting the direction of loans being approved towards different industries and optimising asset structures.
Conditions of assets — Asset scale and structure
Sources: The banks’ 2015 annual reports and 2016 Q3 reports; KPMG China research
RMB billion
12.14% 12.45% 15.27% 15.55%
49.68% 49.43% 50.57% 50.24%
28.17% 25.97% 21.93% 20.54%
6.37% 8.54% 9.00% 10.38%3.64% 3.61% 3.23% 3.29%
0%
10%
20%
30%
40%
50%
60%
70%
80%
90%
100%
30 September2016
31 December2015
31 December2014
31 December2013
Cash and balance with central bank Loans and advances to customersSecurities investment Due from banks and other institutionsOther assets
6%
12%
6%7%
13%
2%
8%
25%
10%10%
21%
13%11% 11%
27%
17%
3%
21%
16%
37%
1…
11%11%
0.00%
5.00%
10.00%
15.00%
20.00%
25.00%
30.00%
35.00%
40.00%
-
5,000
10,000
15,000
20,000
25,000
ICB
CC
CB
BO
CA
BC
BC
MC
MB
CN
CB
CM
BC
SP
DB
CIB
CE
BH
XB
PA
BB
OB
BO
NN
BC
BW
RC
BB
OJS
CR
CB
GY
BJR
CB
CQ
RC
BC
QC
B
30 September 2016 31 December 2015 Growth rate

17© 2016 KPMG Huazhen LLP — a People‘s Republic of China partnership, KPMG Advisory (China) Limited — a wholly foreign owned enterprise in China, are member firms of the KPMG network of independent member firms affiliated with KPMG International Cooperative (“KPMG International”), a Swiss entity. All rights reserved.
Compared with the end of 2015, the average ratio of loans and advances to customers among 11 listed banks increased in the third quarter of 2016, with CMB recording the highest growth rate of 5.00%. Of the four major state-owned banks, only CCB saw its ratio of loans and advances to customers fall. The ratio of investment among most listed banks increased, with the ratios of CMBC and JRCB growing 16.09% and 9.38% respectively.
Meanwhile, compared with the end of 2015, the average ratio of amounts due from banks and other institutions to 17 listed banks decreased, with the sharpest decline recorded by CMBC at 12.42%.
In Q3 2016, the banking sector remained supportive of China’s real economy, strengthened risk management and control functions, and adjusted loan structures accordingly.
Meanwhile, with tougher regulations, interbank assets increasingly served the purpose of liquidity management. Amid internal structural adjustments to interbank assets, changes in risk weighting reduced the gains that banks were able to make from interest arbitrage, resulting in a decline in the growth of the share of interbank assets in banks’ total assets.
Conditions of assets — Asset structure
Sources: The banks’ 2015 annual reports and 2016 Q3 reports; KPMG China research
13.78% 13.09% 13.50% 14.54% 12.86% 10.67% 9.98% 9.57% 9.54% 7.89% 10.31% 13.07% 11.64% 8.30% 9.78% 9.24% 13.01% 9.38% 11.26% 12.38% 14.82% 10.95% 11.95% 12.45%
52.47% 55.77% 53.14% 47.81% 50.80%50.04% 48.19%
44.19% 43.05%
32.55%
48%51.57%
47.34%
40.54%30.09% 34.67%
46.78%42.35%
51.43%
33.68%
53.08%
35.93% 38.09%
49.43%
22.56%23.28%
21.38%25.36% 23.21% 26.08% 33.03%
20.21%
37.34%
49.01%
28.54%17.67%
23.72%
22.72%
52.69%50.27%
26.42%35.80%
30.76%
47.30%
28.41%
29.77%
33.80%
25.97%
7.56% 5.31% 5.99% 9.41% 8.54% 10.84% 6.60%
19.94%
7.12% 6.12% 11.73% 16.12% 12.08%26.76%
5.04% 3.71%11.51% 10.53%
3.92% 4.34% 1.35%
21.39%14.34% 8.54%
3.63% 2.55%5.99% 2.88% 4.59% 2.37% 2.20% 6.09% 2.95% 4.43% 2.84% 1.57% 5.22%
1.68% 2.40% 2.11% 2.28% 1.94% 2.63% 2.30% 2.34% 1.96% 1.82% 3.61%
0%
10%
20%
30%
40%
50%
60%
70%
80%
90%
100%
Cash and balance with central bank Loans and advances to customersInvestment Due from banks and other institutionsOther assets
31 December 2015
13.97% 13.29% 13.04% 15.01% 11.83% 10.09% 10.63% 8.07% 8.35% 7.21% 9.31% 11.55% 10.89% 8.18% 9.23% 9.46% 13.10%8.41% 9.91% 11.19% 10.39% 10.95% 11.26% 12.14%
53.41% 55.16% 54.03% 48.12%48.58% 55.04%
50.05%
42.39% 44.60%
32.47%
44.61%
51.51% 49.94%
41.75%29.87%
33.82%
49.24%
39.59%
49.18%
29.11%
47.65%
36.19%40.34%
49.68%
23.13%22.80%
15% 27.29%24.15%
25.01%32.94%
36.30%37.99%
52.21%
33.14%
24.49%25.39%
26.36%51.57%
51.43%
30.38%
42.48%
32.93%
50.49%
37.79%
30.74%29.23%
28.17%
5.41% 3.66%6.50% 6.34%
8.70%7.15% 4.60%
7.52%5.99% 4.50%
9.56% 14.52%7.55%
25.21%
7.27%3.29% 4.90% 6.43% 5.41% 5.05%
1.91%
20.41% 17.22%6.37%
4.08% 3.26% 4.42% 2.99% 4.35% 2.71% 2.85% 5.72% 3.07% 3.61% 3.38% 1.65%6.23%
1.75% 2.06% 2.00% 2.38% 3.09% 2.57% 4.16% 2.26% 1.71% 1.95% 3.64%
0%
10%
20%
30%
40%
50%
60%
70%
80%
90%
100%
Cash and balance with central bank Loans and advances to customersInvestment Due from banks and other institutionsOther assets
30 September 2016

18© 2016 KPMG Huazhen LLP — a People‘s Republic of China partnership, KPMG Advisory (China) Limited — a wholly foreign owned enterprise in China, are member firms of the KPMG network of independent member firms affiliated with KPMG International Cooperative (“KPMG International”), a Swiss entity. All rights reserved.
Conditions of assets — Total loans
In Q3 2016, the total scale of credit assets of listed banks was RMB 68.18 trillion, which represents a YoY increase of 14.42%.
Since the beginning of 2016, China’s Government has begun to make progress with its economic reforms and the central bank has continued to pursue prudent monetary policies. Under these circumstances, demand for loans has risen, and while listed banks expanded their lending, they also engaged in asset restructuring and strengthened their risk control efforts.
In the third quarter of 2016, the growth rate of credit assets among listed banks began to slow even though the credit assets of 23 banks still increased compared with the end of last year.
Some of the smaller banks recorded higher than average growth rates such as BON, CMBC and GYB.
CMBC’s loans were more targeted towards supporting the growth of consumption. BON’s new loans were mostly granted to support the development of the real economy, small and micro businesses, and San Nong (agriculture, farming and rural areas) and livelihood projects. GYB’s loans were used for the benefit of small and micro businesses.
Sources: The banks’ 2015 annual reports and 2016 Q3 reports; KPMG China research
49,188 54,974
61,895 68,181
13.03%
11.76%12.59%
14.42%
0.0%
2.0%
4.0%
6.0%
8.0%
10.0%
12.0%
14.0%
16.0%
-
10,000
20,000
30,000
40,000
50,000
60,000
70,000
80,000
31 December2013
31 December2014
31 December2015
30 September2016
Credit assets Growth rate
RMB billion
8% 10%8%8% 8%
12%12%
20%
14%
10%
16%
13%
18%
14%
27%
15%
9%
13%11%
19%
3%
12%
18%
0%
5%
10%
15%
20%
25%
30%
-
2,000
4,000
6,000
8,000
10,000
12,000
14,000
30 September 2016 31 December 2015 Growth rate
RMB billion
19© 2016 KPMG Huazhen LLP — a People‘s Republic of China partnership, KPMG Advisory (China) Limited — a wholly foreign owned enterprise in China, are member firms of the KPMG network of independent member firms affiliated with KPMG International Cooperative (“KPMG International”), a Swiss entity. All rights reserved.
NPL ratio
Allowance to NPL ratio
Allowance to total loan ratio
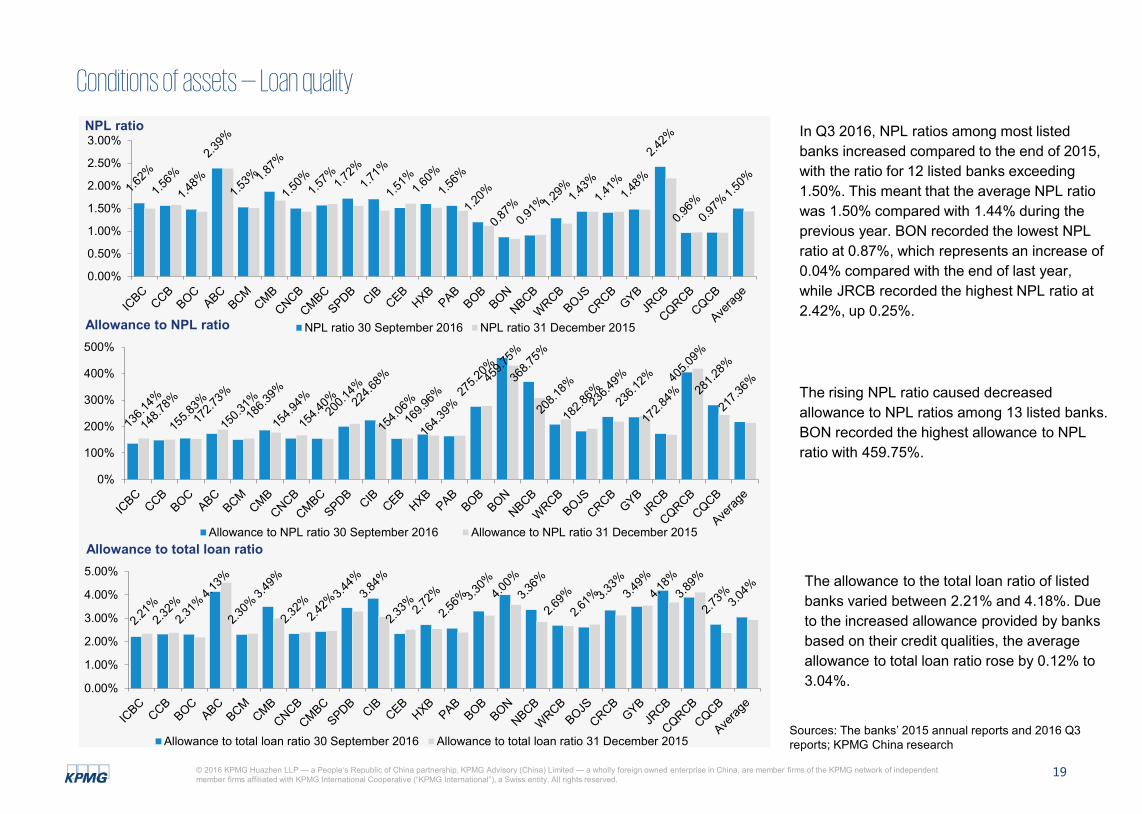
In Q3 2016, NPL ratios among most listed banks increased compared to the end of 2015, with the ratio for 12 listed banks exceeding 1.50%. This meant that the average NPL ratio was 1.50% compared with 1.44% during the previous year. BON recorded the lowest NPL ratio at 0.87%, which represents an increase of 0.04% compared with the end of last year, while JRCB recorded the highest NPL ratio at 2.42%, up 0.25%.
The rising NPL ratio caused decreased allowance to NPL ratios among 13 listed banks. BON recorded the highest allowance to NPL ratio with 459.75%.
The allowance to the total loan ratio of listed banks varied between 2.21% and 4.18%. Due to the increased allowance provided by banks based on their credit qualities, the average allowance to total loan ratio rose by 0.12% to 3.04%.
Sources: The banks’ 2015 annual reports and 2016 Q3 reports; KPMG China research
Conditions of assets — Loan quality
0.00%
0.50%
1.00%
1.50%
2.00%
2.50%
3.00%
NPL ratio 30 September 2016 NPL ratio 31 December 2015
0%
100%
200%
300%
400%
500%
Allowance to NPL ratio 30 September 2016 Allowance to NPL ratio 31 December 2015
0.00%
1.00%
2.00%
3.00%
4.00%
5.00%
Allowance to total loan ratio 30 September 2016 Allowance to total loan ratio 31 December 2015

20© 2016 KPMG Huazhen LLP — a People‘s Republic of China partnership, KPMG Advisory (China) Limited — a wholly foreign owned enterprise in China, are member firms of the KPMG network of independent member firms affiliated with KPMG International Cooperative (“KPMG International”), a Swiss entity. All rights reserved.
Conditions of assets — Investment
Sources: The banks’ 2015 annual reports and 2016 Q3 reports; KPMG China research
During the third quarter of 2016, listed banks increased the scale of their investment within their asset structures. Overall investment increased by an average rate of 18.96% compared with the end of 2015.
As for general investment structures:
• Held-for-trading financial assets took up 6.66%, representing an increase of 1.25%.
• Available-for-sale financial assets accounted for 26.68%, increasing 2.36%.
• Held-to-maturity investments accounted for 38.65%, decreasing 2.05%.
• Investments classified as receivables took up 28.01%, down 1.56%。
6.66% 5.41% 6.66% 7.01%
26.68% 24.32% 24.87% 24.94%
38.65% 40.70% 44.10% 48.37%
28.01% 29.57% 24.37% 19.68%
0%
10%
20%
30%
40%
50%
60%
70%
80%
90%
100%
30 September 2016 31 December 2015 31 December 2014 31 December 2013
Investments classified as receivablesHeld-to-maturity investmentsAvailable-for-sale financial assetsFinancial assets at fair value through profit and loss

21© 2016 KPMG Huazhen LLP — a People‘s Republic of China partnership, KPMG Advisory (China) Limited — a wholly foreign owned enterprise in China, are member firms of the KPMG network of independent member firms affiliated with KPMG International Cooperative (“KPMG International”), a Swiss entity. All rights reserved.
Conditions of assets — Investment (continued)
Sources: The banks’ 2015 annual reports and 2016 Q3 reports; KPMG China research
In Q3 2016, the investment structures of listed banks differed. The five major state-owned banks still held a high percentage of held-to-maturity investments, while other commercial banks increased the proportions of their investments classified as receivables and available-for-sale financial assets to varying degrees.
The share of held-for-trading financial assets in investments of CMBC, ICBC, ABC, BCM and SPDB were relatively higher, remaining at more than 8%.
30 September 2016
31 December 2015
9.02% 7.23% 3.40% 8.71% 8.63% 4.32% 3.48% 2.13% 8.05% 13.53%0.95% 0.94%
2.26% 4.14%6.82%
2.49%6.12% 0.86% 4.18% 1.44% 3.72% 1.91% 0.71%
31.30% 33.96% 39.44% 25.72%14.17% 24.75% 27.38%
13.09%13.51%
13.18% 32.44%
16.34%0.21%
27.74% 20.75%
68.19%52.58%
51.78% 42.17%40.31%
64.01%
18.09% 21.43%
53.70% 47.65% 46.16%53.94%
60.82%
33.50%
10.14%32.06% 15.53% 8.13%
14.87% 45.84%
39.92%
34.01%
21.32%
8.56%27.42%
18.76% 27.05%30.84%
28.94%
27.38%17.58%
5.98% 11.16% 11.00% 11.63% 16.38%
37.43%
59.00%52.72%
62.91% 65.16%51.74%
36.88%
57.61%
34.11%
51.11%
20.76%13.88%
28.60% 26.60% 27.41%
3.33%
52.62%60.28%
0%10%20%30%40%50%60%70%80%90%
100%
Financial assets at fair value through profit and loss Available-for-sale financial assets
Held-to-maturity investments Investments classified as receivables
6.85% 6.35% 3.31%9.74% 8.37% 4.14% 1.55% 2.95% 3.38% 4.96% 0.62% 3.33% 3.32% 3.94% 4.61% 1.95% 3.57% 0.15% 3.71% 0.95% 5.10% 1.95% 2.14%
28.83% 24.97% 30.00%26.92%
15.94% 20.98% 22.09% 17.19% 13.53% 16.43% 24.62% 20.50%
0.21%
30.53% 26.06%
69.20%
28.98%44.56% 40.67% 43.48%
49.71%
5.86%17.55%
57.29%60.03%
49.81%50.99%
56.21%
24.73%
10.63%
30.47%
12.73% 7.96%
16.85%
54.48%
44.75%
35.21%
20.18%
9.07%
55.58%25.14%
32.64% 32.93%
40.52%
29.83%12.78%
7.03% 8.65%16.88% 12.35%
19.48%
50.15%
65.73%
49.39%
70.36% 70.65%57.91%
21.69%
51.72%
30.32%
49.15%
19.78%11.87%
30.15%22.98% 22.64%
4.67%
62.36% 67.53%
0%10%20%30%40%50%60%70%80%90%
100%
Financial assets at fair value through profit and loss Available-for-sale financial assets
Held-to-maturity investments Investments classified as receivables

22© 2016 KPMG Huazhen LLP — a People‘s Republic of China partnership, KPMG Advisory (China) Limited — a wholly foreign owned enterprise in China, are member firms of the KPMG network of independent member firms affiliated with KPMG International Cooperative (“KPMG International”), a Swiss entity. All rights reserved.
Conditions of liabilities —Liability structure In the third quarter of 2016, the total liabilities of listed banks increased on average by 13.38% compared with the end of 2015, demonstrating a similar trend to total assets.
Joint-stock commercial banks’ liabilities grew much faster. GYB recorded the highest increase of 36.55%, followed by BON with 27.71% and CMBC with 25.88%. This increase was mainly due to the increase in deposits from customers and the increase in bonds payable.
In Q3 2016, total deposits reached RMB 91.12 trillion, an increase of 9% compared with the end of 2015. GYB recorded the highest increase in deposits of 41.26% followed by NBCB with 37.42%. CIB recorded the slowest growth of 1.21% in deposits, while CMB grew by 1.24% in deposits.
Sources: The banks’ 2015 annual reports and 2016 Q3 reports; KPMG China research
6.29%
11.98%
6.05% 7.07%
12.93%
1.04%
8.15%
25.88%
10.03%9.78%
21.88%
11.69%10.55% 9.94%
27.71%
17.27%
2.14%
21.00%
15.07%
36.55%
13.77%11.13%
10.93%
0%
5%
10%
15%
20%
25%
30%
35%
40%
-
5,000,000
10,000,000
15,000,000
20,000,000
25,000,000
Due to customers 30 September 2016 Due to banks and other institutions 30 September 2016Bonds payable 30 September 2016 Other liabilities 30 September 2016Total liabilities 30 September 2016 Total liabilities 31 December 2015Total liabilities growth rate
RMB billion
9.04%11.77%
10.62%10.78%
5.43%1.24%
6.59%9.76%
1.33%1.21%
6.92%
1.46%
10.32%11.44%
28.28%
37.42%
8.50%
17.77%
5.85%
41.26%
8.08%12.74%
13.09%
0%5%10%15%20%25%30%35%40%45%
- 2,000 4,000 6,000 8,000
10,000 12,000 14,000 16,000 18,000 20,000
Total deposits 30 September 2016 Total deposits 31 December 2015
RMB billion

23© 2016 KPMG Huazhen LLP — a People‘s Republic of China partnership, KPMG Advisory (China) Limited — a wholly foreign owned enterprise in China, are member firms of the KPMG network of independent member firms affiliated with KPMG International Cooperative (“KPMG International”), a Swiss entity. All rights reserved.
81.85%
80.71%
79.15%
84.49%
63.27%69.99%
65.31%
56.57%
57.57%45.97%
59.42%
64.54%73.78%
59.96%
67.29%62.08%
85.64%
61.70%
75.63%
83.56%
77.48%
71.36%
68.07%
69.36%
10.71% 10.90%10.80%
7.40%
22.47%18.88%
21.92%27.13%
25.69%
34.44%
24.15%19.03%
10.01%23.60%
12.87%
17.99%
5.60%
26.42%
15.62%2.71%
15.60% 17.77%18.61%
17.41%
1.56% 2.35% 2.15%2.28%
2.53%
5.94% 9.07%7.84%
12.81%15.38%
11.86%10.97%
12.55%13.30%
15.56%15.30%
4.81% 8.59% 5.78%12.05%
3.90%7.05%
11.79%8.50%
5.88%6.04%
7.90%
5.83%
11.73%5.20%
3.70%8.46%
3.93%4.21%
4.57%5.46%
3.66%3.14%
4.28%
4.63%
3.95%3.29%
2.97%1.68%
3.02%3.82%
1.53% 4.73%
0%
10%
20%
30%
40%
50%
60%
70%
80%
90%
100%
Due to customers Due to banks and other financial institutions Bonds payable Others
Conditions of liabilities — Liability structure (continued)
Sources: The banks’ 2015 annual reports and 2016 Q3 reports; KPMG China research
In the third quarter of 2016, customer deposits formed the largest component of listed banks' liabilities. The five major state-owned banks had higher deposit totals, with ICBC, CCB and ABC each recording a proportion of over 80%, reflecting the advantages they hold in attracting customers.
In comparison, non-state commercial banks held a higher proportion of interbank liabilities than the big five state-owned banks; for example, the proportion of interbank liabilities held by CIB was 34.44%. Since non-state banks often lack deposit resources, they need to regularly borrow in the interbank market. At the same time, they also have to take steps to develop a diversified range of products in order to optimise asset allocation. Liquidity gaps arising from the allocation of interbank assets often need to be filled by their interbank liability businesses.
Amid interest rate liberalisation and the emergence of various fintech start-ups, there exists intense competition for funding. In response to this, listed banks continue to improve the structure of their liability businesses, increase efforts to boost deposits and expand the channels for raising liabilities in order to develop their liability businesses.
79.78%
80.86%75.88%
81.66%
67.77%
69.85%
66.27%
64.89%
62.51%
49.86%
67.73%
71.06%73.92%
59.16%
66.99%
52.98%
80.62%
63.39%
82.23%
80.78%81.55%
70.34%
66.77%
70.30%
12.75% 12.00%
14.31%
9.81%
22.76%
21.04%
24.76%
24.70%
26.70%
38.49%
22.43%21.81%
14.25%
27.47%
17.55%
20.16%
11.09%
29.94%
11.33%4.78%
14.09%
21.65%
24.53%
19.50%
1.50% 2.46%1.83% 2.31% 2.57% 4.92% 6.02%
4.29% 8.46% 8.33% 7.14% 3.51%9.08% 10.11%
11.55%21.45%
3.96% 4.22% 2.99%12.52%
0.00% 5.21% 6.19% 6.11%
5.97%4.68%
7.98% 6.22% 6.90%4.19%
2.95% 6.12% 2.33%3.32%
2.70%3.62%
2.75%3.26%
3.91%5.41%
4.33%2.45%
3.45%
1.92% 4.36% 2.80% 2.51% 4.09%
0%
10%
20%
30%
40%
50%
60%
70%
80%
90%
100%
Due to customers Due to banks and other financial institutions Bond payables Others
30 September 2016
31 December 2015

24© 2016 KPMG Huazhen LLP — a People‘s Republic of China partnership, KPMG Advisory (China) Limited — a wholly foreign owned enterprise in China, are member firms of the KPMG network of independent member firms affiliated with KPMG International Cooperative (“KPMG International”), a Swiss entity. All rights reserved.
Risk management — Capital adequacy ratio and tier 1 capital adequacy ratio
Sources: The banks’ 2015 annual reports and 2016 Q3 reports; KPMG China research
As at 30 September 2016, the average capital adequacy ratio of listed banks was 13.05%, an increase of 0.33% compared with the end of 2015. Half of the listed banks saw their capital adequacy ratios increase, with the highest increase recorded by CMB with 1.59%. This is explained by the fact that the growth rate of average risk-weighted assets was lower than the growth rate of net capital.
As at 30 September 2016, the average tier 1 capital adequacy ratio of listed banks was 10.83%, an increase of 0.28% compared with the end of 2015. NBCB posted the sharpest decrease, with its ratio falling 0.45%, due to the growth rate of its average risk-weighted assets being higher than the growth rate of its tier 1 core capital.
.
0%2%4%6%8%
10%12%14%16%18%
Capital adequacy ratio 30 September 2016 Capital adequacy ratio 31 December 2015
NOTE: Relevant data not released by BOB.
0%2%4%6%8%
10%12%14%16%
Tier 1 capital adequacy ratio 30 September 2016 Tier 1 capital adequacy ratio 31 December 2015
NOTE: Relevant data not released by BOB.

25© 2016 KPMG Huazhen LLP — a People‘s Republic of China partnership, KPMG Advisory (China) Limited — a wholly foreign owned enterprise in China, are member firms of the KPMG network of independent member firms affiliated with KPMG International Cooperative (“KPMG International”), a Swiss entity. All rights reserved.
Risk management —liquidity coverage ratio and leverage ratio
Overall, the liquidity coverage ratio (LCR) of most listed banks reached 80% in the third quarter of 2016. CQRCB, ABC and HXB recorded the highest growth in LCR, increasing 51.21%, 10.30% and 6.72% respectively.
The leverage ratio of all listed banks (consolidated) exceeded 4% in the third quarter of 2016. JRCB, ICBC and CCB recorded the highest leverage ratio of 7.97%, 7.57% and 7.12% respectively.
Sources: The banks’ 2015 annual reports and 2016 Q3 reports; Wind Info; KPMG China research
0%
20%
40%
60%
80%
100%
120%
140%
160%
ICBC CCB BOC ABC BCM CMB CNCB SPDB HXB PAB BOB NBCB CQRCB
Liquidity coverage ratio 30 September 2016 Liquidity coverage ratio 31 December 2015
0%
1%
2%
3%
4%
5%
6%
7%
8%
9%
Leverage ratio 30 September 2016 Leverage ratio 31 December 2015

26© 2016 KPMG Huazhen LLP — a People‘s Republic of China partnership, KPMG Advisory (China) Limited — a wholly foreign owned enterprise in China, are member firms of the KPMG network of independent member firms affiliated with KPMG International Cooperative (“KPMG International”), a Swiss entity. All rights reserved.
Profitability — Analysis
During Q3 2016, net profits of listed banks increased YoY, albeit at a slower rate, as the central bank released a lower benchmark loan rate. This assisted listed banks in their asset repricing, resulting in narrower net interest margins.
The expansion of interest-bearing assets and non-interest income, along with cost reductions, have been the main drivers of listed banks’ net profits. In the third quarter of 2016, interest-bearing assets grew steadily. Thanks to banks’ intensified efforts to adjust income structures in 2016, non-interest income was growing at a fast rate. Banks also strengthened cost management initiatives, resulting in an improvement in their cost-to-income ratios.
At the same time, banks’ NPL ratios continued to rise, with credit costs hovering at a high level. Accrued allowances remained high and have become a major drag on net profits.

27© 2016 KPMG Huazhen LLP — a People‘s Republic of China partnership, KPMG Advisory (China) Limited — a wholly foreign owned enterprise in China, are member firms of the KPMG network of independent member firms affiliated with KPMG International Cooperative (“KPMG International”), a Swiss entity. All rights reserved.
Profitability — Operating income and income structure analysis
The total operating income of listed banks increased by 2.32% YoY in Q3 2016.
Components of operating income during Q3 2016 were as follows:
• Net interest income accounted for 68.57%, declining by 4.96% YoY.
• Net fee and commission income accounted for 22.19%, increasing by 1.29% YoY.
• Investment income accounted for 3.75%, increasing by 2.31% YoY.
• Other operating income accounted for 5.49%, increasing by 1.36% YoY.
Other operating income mainly consists of gains from changes in fair value, foreign exchange and other operating income.
Sources: The banks’ 2015 annual reports and 2016 Q3 reports; KPMG China research
68.57% 73.53% 74.73% 76.29%
22.19%20.90% 20.10% 20.26%
3.75% 1.44% 0.94% 0.97%5.49% 4.13% 4.23% 2.48%
0%
10%
20%
30%
40%
50%
60%
70%
80%
90%
100%
Jan-Sep 2016 Jan-Sep 2015 Jan-Sep 2014 Jan-Sep 2013
Net interest income Net fee and commission income Investment income Other operating income

28© 2016 KPMG Huazhen LLP — a People‘s Republic of China partnership, KPMG Advisory (China) Limited — a wholly foreign owned enterprise in China, are member firms of the KPMG network of independent member firms affiliated with KPMG International Cooperative (“KPMG International”), a Swiss entity. All rights reserved.
Sources: The banks’ 2015 annual reports and 2016 Q3 reports; KPMG China research
In the third quarter of 2016, net interest income among listed banks accounted for 74.61% of operating income on average, while net fee and commission income and investment income accounted for 20.00% and 3.33% respectively.
Compared to Q3 2015, the average ratio of net interest income among listed banks declined, mainly due to listed banks adjusting their income structures and reducing their reliance on interest income against the backdrop of tightening net interest spreads and net interest margins.
In the third quarter of 2016, the average ratio of net fee and commission income for listed banks increased by 2.21% YoY, mainly due to the increase in income sourced from consulting, wealth management, agency and commission, and bank card services.
In Q3 2016, the average ratio of investment income for listed banks increased by 1.64%, while other operating income increased by 0.26% YoY. CCB and BCM had the highest proportion of other operating income among the listed banks, with 10.70% and 10.32% respectively.
Profitability — Operating income and income structure analysis (continued)
67.86%66.83%
62.27%
77.20%68.41%
62.84%68.95%
60.91%
67.68%71.25%
69.02%
76.79%
66.57%76.21%
79.05%
71.93%
89.88%
79.86%
89.84%
84.04%
88.74%89.87%
80.14%
74.61%
21.97%
19.53%18.56%
18.94%
19.62%
30.72%
26.85%
34.32%
25.75%
22.00%
30.00%22.63%
29.49%
22.27%
14.98%
26.14%
7.09%19.53%
6.36%
11.17%2.39%
10.05%
19.64%
20.00%
1.27%2.94% 10.83%
1.09%
1.65%6.09%
3.29%5.81%
3.47% 8.65%0.19% 0.31%
3.01%1.24% 4.79%
2.34% 2.44% 0.21% 3.34% 4.79%8.03%
0.68%0.10%
3.33%8.90%
10.70%8.34% 2.77% 10.32%0.35%0.91%
-1.04%
3.10%
-1.90%
0.79% 0.27% 0.93%0.28%
1.18%
-0.41%
0.59% 0.40% 0.46%0.00%
0.84%
-0.60%
0.12%
2.06%
-10%
10%
30%
50%
70%
90%
110%
Net interest income Net fee and commission income Investment income Other operating income30 September 2016
69.15%74.51%
69.03%
80.72%73.75%
65.15%
71.42%60.68%
75.97%78.33%
70.89%81.21%
67.75%79.25%
82.59%82.38%
90.37%86.34%
93.70%
89.91%90.99%
92.38%
80.89%78.72%
21.19%
19.39%
20.04%
16.36%
18.73%28.52%
24.26%
32.67%
21.01%
20.90%28.92%
19.04%
28.42%
17.51%
15.82%
20.57%
22.11%
13.67%
2.08% 7.56% 2.25% 6.88% 17.54%
17.79%
2.02% 0.26%1.14% 0.03% 0.04%
3.37%2.05%
4.15% 0.46%1.87%
0.63%
-0.56%
2.24% 1.87% 3.78%
-1.03%
1.59% 0.35%3.26% 2.15% 5.21%0.03%
-0.16%
1.69%8.29%10.29%
12.10%2.89%
7.48% 0.02% 0.23% 2.50% 1.96%
-1.10%-0.46%
0.31%
-1.56%
1.37%
-2.19% -1.92%
2.14%
-0.36%
0.96% 0.38% 1.55% 0.71%1.73%
1.80%
-20%
0%
20%
40%
60%
80%
100%
Net interest income Net fee and commission incomeInvestment income Other operating income30 September 2015

29© 2016 KPMG Huazhen LLP — a People‘s Republic of China partnership, KPMG Advisory (China) Limited — a wholly foreign owned enterprise in China, are member firms of the KPMG network of independent member firms affiliated with KPMG International Cooperative (“KPMG International”), a Swiss entity. All rights reserved.
Profitability — Operating income and income structure analysis (continued)
Sources: The banks’ 2015 annual reports and 2016 Q3 reports; KPMG China research
-1.31%
3.32% 3.45%
-5.19%0.61%2.60%
7.34%
0.18%
11.32%5.61%
1.01%
10.25%15.20%
10.07%
26.84% 27.02%
6.55%13.04%
35.83%
26.03%
-0.97%0.17%
14.02%
-10%
0%
10%
20%
30%
40%
- 100,000 200,000 300,000 400,000 500,000 600,000
Operating income Jan-Sep 2016 Operating income Jan-Sep 2015 Operating income growth rate
2.31% 4.09%-4.19%
9.80%5.36%
10.51%18.82%5.25%
46.73%
11.18% 4.76%
31.02%
19.54%
39.95%20.10%
61.39%
4.65%
61.52%
314.00%
86.08%
4.76%
46.26%
27.63%
-50%0%50%100%150%200%250%300%350%
- 20,000 40,000 60,000 80,000
100,000 120,000
Net fee and commission income Jan-Sep 2016 Net fee and commission income Jan-Sep 2015Net fee and commission income growth rate
RMB million
In Q3 2016, many listed banks experienced an increase in
operating income compared with the same period in the
previous year. This was due to the increase in net interest
income and net commission income. CRCB and NBCB posted
an increase of 35.83% and 27.02% respectively. In addition,
the operating income of joint-stock banks grew significantly
faster than that of the four major state-owned banks. ICBC and
ABC saw a slight decline in operating income.
In Q3 2016, the big four banks experienced a slower growth in
net interest income YoY, mainly due to narrower interest
margins. Many joint-stock banks saw their net interest income
increase compared with the same period in the previous year.
In the context of accelerating interest rate liberalisation, the
increase in net interest income was mainly derived from the
continued growth of interest-bearing assets. The net interest
income of BON and CRCB increased by 21.40% and 30.25%
respectively compared with the same period for 2015.
In Q3 2016, all listed banks experienced an increase in net
commission income compared with the same period last year.
In spite of stricter monitoring of fee policies, new financial
shocks and intense market competition, China’s banks took
proactive steps to adjust their income structures, promote
financial innovation, diversify profit-making sources and reduce
their reliance on traditional businesses. At the same time, they
were responsible for a significant increase in investment
banking, bank card and custody business, gold leasing, and
other intermediary business. As a result, CRCB's net
commission income increased by 314.00%, and that of GYB
and BOJS increased by 86.08% and 61.52% respectively.
RMB million
RMB million
-7.52%-7.34% -6.69%-9.31%
-6.68%
-1.05%3.62%
0.57%-0.82%-3.93%
-1.66%4.26%
13.19%
5.85%
21.40%10.89%
6.01% 4.55%
30.25%
17.78%
-3.42% -2.54%
12.94%
-20%-10%0%10%20%30%40%
-
100,000
200,000
300,000
400,000
Net interest income Jan-Sep 2016 Net interest income Jan-Sep 2015 Net interest income growth rate

30© 2016 KPMG Huazhen LLP — a People‘s Republic of China partnership, KPMG Advisory (China) Limited — a wholly foreign owned enterprise in China, are member firms of the KPMG network of independent member firms affiliated with KPMG International Cooperative (“KPMG International”), a Swiss entity. All rights reserved.
Profitability — Net interest margin
In the third quarter of 2016, the average net interest margin was 2.39%, down from the same period in 2015. Affected by the ongoing process of interest rate liberalisation and the impact of a lowered benchmark interest rate in 2015 on repricing in 2016, net interest margins narrowed for the 15 listed banks. However, thanks to the improved deposit and loan portfolio, accelerated transformation of asset business, and decreased interest costs, some city commercial banks, such as CQCB, recorded a slight YoY increase in their net interest margins.
Sources: The banks’ 2015 annual reports and 2016 Q3 reports; KPMG China research
NOTE: WRCB, BOJS, CRCB, GYB and JRCB did not disclose the relevant data.
0.00%
0.50%
1.00%
1.50%
2.00%
2.50%
3.00%
3.50%
4.00%
ICBC CCB BOC ABC BCM CMB CNCB CMBC SPDB CIB CEB HXB PAB BOB BON NBCB CQRCB CQCB Average
Net interest margin Jan-Sep 2016 Net interest margin Jan-Sep 2015

31© 2016 KPMG Huazhen LLP — a People‘s Republic of China partnership, KPMG Advisory (China) Limited — a wholly foreign owned enterprise in China, are member firms of the KPMG network of independent member firms affiliated with KPMG International Cooperative (“KPMG International”), a Swiss entity. All rights reserved.
Profitability — Cost controls — Operating expenses and cost-to-income ratio The operating expenses of most listed banks increased in Q3 2016, due to the increased business scale and asset impairment.
CRCB, GYB and NBCB experienced the highest growth in operating expenses of 54.08%, 51.59% and 37.98% respectively. The main reason for this was the increase in asset impairment provision for loans and advances among the three banks.
Sources: The banks’ 2015 annual reports and 2016 Q3 reports; Wind Info; KPMG China research
In Q3 2016, the average cost-to-income ratio among listed banks was 26.97%, a decline of 0.58% compared with the same period in 2015. CQCB and PAB experienced the sharpest decline, falling 5.97% and 4.44% respectively. This was caused by optimisation in cost control.
Banks need to deal with the increasing rigour of external regulations, and must remain competitive through continual innovation of their products and services. Sustaining this low cost-to-income ratio will be a key challenge affecting listed banks’ profitability going forward.
NOTE: No relevant data disclosed by JRCB.
RMB million
-2.77%
6.14% 5.06%
-7.05%
1.47%1.23%
9.65%1.27%
11.85%8.89%
0.54%
14.28%
-7.54%
16.97%
27.69%
37.98%
9.49%14.54%
54.08%51.59%
3.31%-4.16%
-17.48%
2.53%
-30.00%
-20.00%
-10.00%
0.00%
10.00%
20.00%
30.00%
40.00%
50.00%
60.00%
-
50,000
100,000
150,000
200,000
250,000
Jan-Sep 2016 Jan-Sep 2015 Growth rate
0.00%5.00%
10.00%15.00%20.00%25.00%30.00%35.00%40.00%
Cost-to-income ratio 30 September 2016 Cost-to-income ratio 30 September 2015

32© 2016 KPMG Huazhen LLP — a People‘s Republic of China partnership, KPMG Advisory (China) Limited — a wholly foreign owned enterprise in China, are member firms of the KPMG network of independent member firms affiliated with KPMG International Cooperative (“KPMG International”), a Swiss entity. All rights reserved.
Profitability — Cost controls — General and administrative expenses and impairment losses
In Q3 2016, most listed banks saw an average increase of 8.90% in general and administrative expenses. CRCB and NBCB experienced the highest growth rates, reporting increases of 38.32% and 37.19% respectively. This was mainly due to increased investment in the establishment of new outlets and IT technologies, and the building of electronic channels (CRCB) and increase in employee expenses (NBCB).
In Q3 2016, due to the effects of the economic slowdown, accelerated industrial restructuring and other factors, the banking sector faced continued pressure inrelation to asset quality, with credit risk remaining at a high level. In order to remain prepared for risks, banks made more asset impairment provision, with an average growth rate of 18.08%. GYB and CQCB led the way, with a YoY increase of over 100%.
Sources: The banks’ 2015 annual reports and 2016 Q3 reports; Wind Info; KPMG China research
-2.97% -2.92%
3.17%
-3.56%
5.66%
3.10%
9.58%
-3.95%
16.93%
5.37%6.37%
8.16%
-0.69%
13.84%
14.15%
37.19%
6.95% 5.46%
38.32%
15.43%11.29%
0.46% 1.19%
2.48%
0.63%
1.03%
7.51%
4.91%2.05% 9.47%
6.70%
2.35% 5.07%
5.52%
5.79%
22.67%19.22%
9.22%12.64%
6.25% 10.08%
-6.51%
-10.00%-5.00%0.00%5.00%10.00%15.00%20.00%25.00%30.00%35.00%40.00%45.00%
-
20,000
40,000
60,000
80,000
100,000
120,000
140,000
ICBC CCB BOC ABC BCM CMB CNCB CMBC SPDB CIB CEB HXB PAB BOB BON NBCB WRCB BOJS CRCB GYB JRCB
Jan-Sep 2016 Jan-Sep 2015 Growth rate of general and administrative expenses Growth rate of net profit
RMB million
3.80% -0.65%
42.49%
5.53% 3.45% 8.39%24.35% 23.43% 21.11% 30.47%
10.74%
61.72% 58.59%46.67% 55.01% 63.95%
38.59% 45.24%
99.72%
185.18%
5.45%
-19.56%
160.89%
-50.00%
0.00%
50.00%
100.00%
150.00%
200.00%
-
10,000
20,000
30,000
40,000
50,000
60,000
70,000
Jan-Sep 2016 Jan-Sep 2015 Growth rate
RMB million
NOTE:CQRCB and CQCB did not disclose the relative data.

33© 2016 KPMG Huazhen LLP — a People‘s Republic of China partnership, KPMG Advisory (China) Limited — a wholly foreign owned enterprise in China, are member firms of the KPMG network of independent member firms affiliated with KPMG International Cooperative (“KPMG International”), a Swiss entity. All rights reserved.
Profitability — Net profit attributable to equity holders of the parent company
Overall, net profit attributable to parent company equity holders increased in the third quarter of 2016 and the growth rate was higher than it was in the same period in 2015, rising from 2.14% to 2.55%.
BON enjoyed the fastest growth rate with 22.67%, and NBCB posted a growth rate of 19.22%.
The increase in net profit recorded by BON, NBCB and other joint-stock commercial banks was mainly due to an increase in net interest income and net fee and commission income.
Sources: The banks’ 2015 annual reports and 2016 Q3 reports; KPMG China research
918,378
1,007,350
1,036,876 1,063,338
800,000
850,000
900,000
950,000
1,000,000
1,050,000
1,100,000
Jan-Sep 2013 Jan-Sep 2014 Jan-Sep 2015 Jan-Sep 2016
RMB million
Net profit attributable to equity holders of parent company
0.46%1.19%
2.48%0.63%1.03%
7.51%4.91%
2.05%
9.47%6.70%
2.35%
5.07%5.52%
5.79%
22.67%19.22%
9.22%
12.64%
6.25%
10.08%
-6.51%
8.96%
10.68%
2.64%
-10.00%
-5.00%
0.00%
5.00%
10.00%
15.00%
20.00%
25.00%
-
50,000
100,000
150,000
200,000
250,000
Jan-Sep 2016 Jan-Sep 2015 Growth rate
RMB million

34© 2016 KPMG Huazhen LLP — a People‘s Republic of China partnership, KPMG Advisory (China) Limited — a wholly foreign owned enterprise in China, are member firms of the KPMG network of independent member firms affiliated with KPMG International Cooperative (“KPMG International”), a Swiss entity. All rights reserved.
Profitability — Financial performance indicators
In Q3 2016, most listed banks experienced flat earnings per share (EPS). NBCB’s EPS was RMB 0.27 higher than that for the same period in 2015 due to significantly higher income in the current period compared with the same period in the previous year.
In Q3 2016, the return on weighted average equity (ROE) among listed banks decreased by 1.63% YoY, mainly due to the flat-lining of the increase in net profit as net assets increased in line with the expansion of the banking business. The ROE of GYB and CQCB fell by 3.60% and 3.43% respectively.
Sources: The banks’ 2015 annual reports and 2016 Q3 reports; Wind Info; KPMG China research
0.63 0.78
0.44 0.470.70
2.07
0.71
1.07
1.87
2.25
0.50
1.37
1.090.98 1.05
1.63
0.42
0.78
0.39
1.46
0.32
0.67
0.95
0.00
0.50
1.00
1.50
2.00
2.50
RMB
Earnings per share (EPS) Jan-Sep 2016 Earnings per share (EPS) Jan-Sep 2015
0%
5%
10%
15%
20%
25%
Return on weighted average equity (ROE) Jan-Sep 2016 Return on weighted average equity (ROE) Jan-Sep 2015

35© 2016 KPMG Huazhen LLP — a People‘s Republic of China partnership, KPMG Advisory (China) Limited — a wholly foreign owned enterprise in China, are member firms of the KPMG network of independent member firms affiliated with KPMG International Cooperative (“KPMG International”), a Swiss entity. All rights reserved.
Profitability — Financial performance indicators (continued)
Generally speaking, the net asset value per share of all listed banks continued its upward trend in Q3 2016. By the end of the third quarter, CIB and CMB enjoyed the highest net asset value per share with RMB 16.70 and RMB 15.72 respectively, representing an increase of 10.60% and 9.85% YoY respectively.
Due to pressure from the economic downturn, competition from the growth of internet finance, and interest rate liberalisation, the share price of most listed banks fell in Q3 2016. The share prices of BON, PAB and HXB recorded the sharpest declines of 42.03%, 24.35% and 17.22% respectively to RMB 10.26, RMB 9.07 and RMB 10.05 respectively.
NOTE: WRCB, BOJ, CRCB, GYB and JRCB did not disclose the relevant data.
Sources: The banks’ 2015 annual reports and 2016 Q3 reports; Wind Info; KPMG China research
5.216.21
4.38 3.79
7.49
15.72
6.99
8.95
15.2616.70
4.67
12.01
10.38
8.12 8.54
11.65
4.72
6.98
4.39
8.93
4.865.52
7.55
0.00
2.00
4.00
6.00
8.00
10.00
12.00
14.00
16.00
18.00
Net asset value per share 30 September 2016Net asset value per share 31 December 2015
RMB
4.43 5.18 3.37 3.13
5.54
18.00
5.98
9.26
16.49 15.97
3.79
10.05 9.07 9.10
10.26
15.65
4.78 6.36
- 2.00 4.00 6.00 8.00
10.00 12.00 14.00 16.00 18.00 20.00
Share price 30 September 2016
RMB

China’s banking
sector:
Hot topics
3

37© 2016 KPMG Huazhen LLP — a People‘s Republic of China partnership, KPMG Advisory (China) Limited — a wholly foreign owned enterprise in China, are member firms of the KPMG network of independent member firms affiliated with KPMG International Cooperative (“KPMG International”), a Swiss entity. All rights reserved.
38
43
49
59
70
China’s banking sector: Hot topics
Hot topics
Hot topic 2: How to build a data mart for banking credit risk from the basics
Hot topic 1: Big data used to promote the transformation of banking outlets
Academic insights: The implications of blockchain technology on commercial banks and proposed countermeasures
Hot topic 3: Interpretation of the implications of Circular No. 42 on banking business
Hot topic 4: Analysis of the accounting treatment of equity investment and lending bundling in the banking sector

38© 2016 KPMG Huazhen LLP — a People‘s Republic of China partnership, KPMG Advisory (China) Limited — a wholly foreign owned enterprise in China, are member firms of the KPMG network of independent member firms affiliated with KPMG International Cooperative (“KPMG International”), a Swiss entity. All rights reserved.
Background
How?
Hot topic 1: Big data used to promote the transformation of banking outlets
Go to the outlet downstairs to withdraw money
Withdraw money using the ATM downstairs
Borrow money from a colleague and repay them via WeChat or Alipay
As the internet grows rapidly and consumer attitudes change, consumer behaviour is also vastly different from what it was. Whether it is to pay water and electricity bills, withdraw or deposit money, or buy wealth management products, banking outlets can no longer monopolise such services. In addition, most people do not like the idea of waiting in line.
How important a role do bank outlets play in our lives? Some data on profits might give us a clue to the answer. According to The Asian Banker, 43% and 32% of bank outlets in emerging markets and developed markets respectively in the Asia Pacific region cannot make a profit. As for China, the growth rate of overall net profits of China’s banking sector has dropped to single digits. According to data released by the China Banking Regulatory Commission (CBRC), as at the end of Q4 2015, Chinese commercial banks realised a total net profit of RMB 1.59 trillion, representing an increase of only 2.43%.
Slower earnings growth has led to tremendous cost pressures, which have become the main driving force for the banking sector in the Asia Pacific region to promote the transformation of outlets. With a competitive external environment and high operating costs, many outlets are struggling to make a profit. If expenses on redundant staff do not bring in greater profit in return, they will become a burden on banks. The transformation of outlets is the concept most frequently mentioned by Chinese commercial banks as a response to the problem.
A relatively mature approach to transforming outlets is to combine ‘hard transformation’
and ‘soft transformation’. It argues that outlets should be transformed to focus on selling
services instead of settling transactions. Importance should be attached to improving the
services process and customer experience. However, such an approach is rather general,
and is not backed up with data. Are outlets to be maintained in their current state,
transformed or abolished? If transformation is the answer, which direction should they go?
More specific solutions have to be found to answer these questions.
How many times have you gone to the outlet downstairs to wait in the line since e-banking, mobile banking, Alipay and WeChat Wallet have become available? Let us suppose that you are in need of some cash. You usually have the following three choices:

39© 2016 KPMG Huazhen LLP — a People‘s Republic of China partnership, KPMG Advisory (China) Limited — a wholly foreign owned enterprise in China, are member firms of the KPMG network of independent member firms affiliated with KPMG International Cooperative (“KPMG International”), a Swiss entity. All rights reserved.
Big data-based outlet evaluation system
An effective method to evaluate physical
channels
Accurate and reliable data
Feedback on evaluation and improvement
mechanisms
Sales and services through physical
channels
The four principles above should be observed in designing evaluation indicators, and their coverage is very important. We believe that in practice, financials, customer growth, business volume, risk control and quality of services are the indicators that best reflect the performance of outlets.
Principle Details
Balance Importance should be attached to combining financial metrics and non-financial metrics
Orientation
Performance evaluation is conducted for the purpose of guiding assessed outlets in an appropriate and timely manner to comply with the business management strategies and practices of higher-level branches, so that they can continuously adjust their own strategies and practices.
Practicality Applicability, or operability, should be kept in mind when setting performance indicators.
RepresentationRepresentative core indicators should be adopted to comprehensively evaluate the business operations, management and development of outlets.
Hot topic 1: Big data used to promote the transformation of banking outlets (continued)
Speaking broadly, a comprehensive system for assessing the competitiveness of outlets is still absent in most banks. This could be used to evaluate the level of development of outlets and their relative level among bank outlets, and serve as a guide for the transformation of outlets, marketing positioning and target customers. Based on our analysis of the current status of the transformation of Chinese commercial bank outlets, KPMG China has designed the following closed-loop system to evaluate the physical channels in order to provide systematic and data-based support for the transformation of outlets:
As the chart on the left shows, we can evaluate bank outlets systematically by continuously improving the evaluation of physical channels based on accurate and reliable data. The following four principles have to be observed in evaluating outlets’ performance.

40© 2016 KPMG Huazhen LLP — a People‘s Republic of China partnership, KPMG Advisory (China) Limited — a wholly foreign owned enterprise in China, are member firms of the KPMG network of independent member firms affiliated with KPMG International Cooperative (“KPMG International”), a Swiss entity. All rights reserved.
Big data-based outlet evaluation system (continued)
•What are the surroundings of the outlet? How is the population mobility? How much is the per capita disposable income of the residents within 2km of the outlet? •How is the prospective individual customer base distributed? What corporate customers are included? Individual industrial households, enterprises and institutions? What is the size of the customers?•Does the outlet have a target customer base or specific business and products? Are outlets different from each other?
External environment
•What kinds of business and product transactions does the outlet support? What is the proportion of each kind of business?•How is everyday footfall distributed? And during peak hours?•Are there different kinds of business/service processes for different customers? How can we improve their experience?
Business type
•How are customers grouped? How are customers allocated?•What age groups are customers with different amounts of assets under management (AUM) classified into? How frequently do customers come to the outlet? Are customers loyal to the bank? Do they appreciate the products?
Customer analysis
Hot topic 1: Big data used to promote the transformation of banking outlets (continued)
Of course, not all outlets can be lumped together. We classify outlets into flagship outlets, integrated outlets and light outlets, using the outlet gap analysis method. Systems with different weights are established to calculate their competitiveness scores. Outlets of different kinds are diagnosed, provided with guidance and accurately supervised on a case-by-case basis. A multi-angle analysis is performed on the current status of outlets’ business operations based on their growth, the distribution of data and the performance evaluation system.
The data we collect focuses on the external environment, business type and customer analysis.
Based on the above data, we should set five targets for transforming outlets: enhance outlets’ marketing capabilities, improve customer experience, boost efficiency in processing business transactions, reduce operating costs and strengthen business management. Using the data analysis method mentioned above, we can provide a diagnosis of the outlet, taking into consideration the targets we have set for the transformation. The outlet will receive a reminder on the important business indicators that affect its competitiveness score, its level in terms of type of operation and its ranking in the province. It will be guided to play to its strengths, understand its weaknesses and know where it loses points so that it can come up with measures to improve its situation and have a clear idea about where to direct its efforts. The results of the transformation will be monitored on an ongoing basis.

41© 2016 KPMG Huazhen LLP — a People‘s Republic of China partnership, KPMG Advisory (China) Limited — a wholly foreign owned enterprise in China, are member firms of the KPMG network of independent member firms affiliated with KPMG International Cooperative (“KPMG International”), a Swiss entity. All rights reserved.
Outlet evaluation system: Example
Let’s take the following two outlets as examples to further illustrate our idea. They are not real and are not representative of actual circumstances.
Case A:According to our outlet performance evaluation system, outlet A’s total score in terms of performance is above average in the region, its score in terms of business volume is below average, but its score in terms of financials is outstanding. Based on our data analysis, we have the following findings:
Hot topic 1: Big data used to promote the transformation of banking outlets(continued)
Surroundings Business analysis Distribution of customers
• The outlet is located in a high-end residential area.
• The residents are well-educated.
• They have a high per capita disposable income.
• The outlet has almost no corporate banking business.
• The daily business of the outlet consists of providing information on and selling wealth management products.
• Its customers are evenly distributed during peak hours.
• Its customers are evenly distributed in terms of age groups.
• It is difficult to acquire new high-value customers.
• Compared with other outlets, the contribution made by its existing customers has increased significantly.
Based on the analysis above, outlet A is defined as a light outlet and the following recommendations for improvement are given:
Light outlet
Diagnosis
In designing the layout of an outlet, both privacy and openness have to be taken into account. High-value customers should have private spaces to transact their business, while in open spaces they are provided with consulting services in an easy and enjoyable manner.
As much additional information as possible about each customer should be collected, such as the size of the family, the nature of their employment, and their parents and children. With such information, marketing can be more targeted.
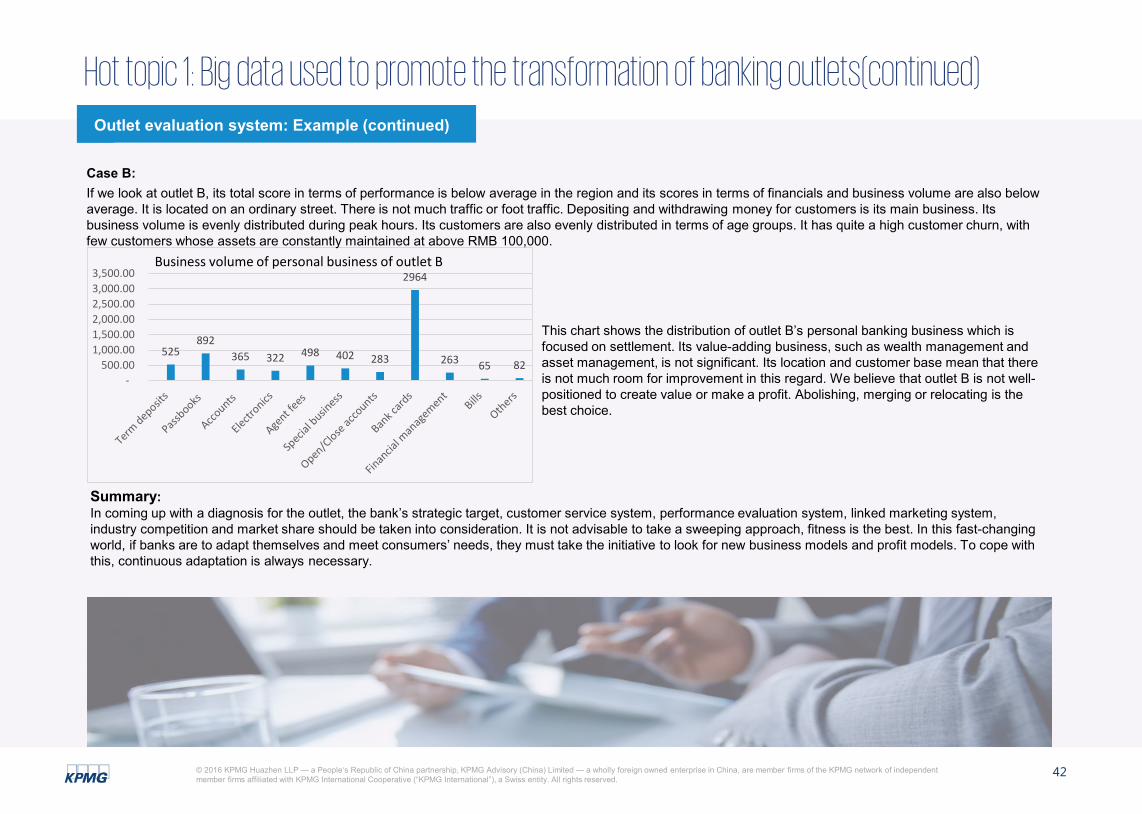
42© 2016 KPMG Huazhen LLP — a People‘s Republic of China partnership, KPMG Advisory (China) Limited — a wholly foreign owned enterprise in China, are member firms of the KPMG network of independent member firms affiliated with KPMG International Cooperative (“KPMG International”), a Swiss entity. All rights reserved.
Outlet evaluation system: Example (continued)
525892
365 322 498 402 283
2964
263 65 82 -
500.00 1,000.00 1,500.00 2,000.00 2,500.00 3,000.00 3,500.00
Business volume of personal business of outlet B
Hot topic 1: Big data used to promote the transformation of banking outlets(continued)
Case B:If we look at outlet B, its total score in terms of performance is below average in the region and its scores in terms of financials and business volume are also below average. It is located on an ordinary street. There is not much traffic or foot traffic. Depositing and withdrawing money for customers is its main business. Its business volume is evenly distributed during peak hours. Its customers are also evenly distributed in terms of age groups. It has quite a high customer churn, with few customers whose assets are constantly maintained at above RMB 100,000.
This chart shows the distribution of outlet B’s personal banking business which is focused on settlement. Its value-adding business, such as wealth management and asset management, is not significant. Its location and customer base mean that there is not much room for improvement in this regard. We believe that outlet B is not well-positioned to create value or make a profit. Abolishing, merging or relocating is the best choice.
Summary:In coming up with a diagnosis for the outlet, the bank’s strategic target, customer service system, performance evaluation system, linked marketing system, industry competition and market share should be taken into consideration. It is not advisable to take a sweeping approach, fitness is the best. In this fast-changing world, if banks are to adapt themselves and meet consumers’ needs, they must take the initiative to look for new business models and profit models. To cope with this, continuous adaptation is always necessary.

43© 2016 KPMG Huazhen LLP — a People‘s Republic of China partnership, KPMG Advisory (China) Limited — a wholly foreign owned enterprise in China, are member firms of the KPMG network of independent member firms affiliated with KPMG International Cooperative (“KPMG International”), a Swiss entity. All rights reserved.
Introduction to risk management
Risk management is vital to the operation and management of commercial banks and, at the same time, is easily compromised. In the course of deepening market-oriented reform, the presence of a premature risk management system across China’s banking sector has become the biggest threat to the stability and prosperity of the sector, and even China’s financial system as a whole. The ability of banks to scientifically and effectively manage and prevent various risks is directly tied to their security and development. The management of credit risk, which tops the three major risks of the banking sector, is evidently of vital importance to banks.
In order to effectively execute credit risk management, banks need to put in place sound credit risk management policies and effective supervision, and raise the awareness of risk management to the point that it takes root in banks’ corporate culture. However, this is not enough. Banks also need to follow the sweeping trend to build and improve their information system and empower their data governance and application capabilities so as to integrate all business activities under the information system and provide the indicator data needed for credit risk management.
Under such circumstances, it is imperative that commercial banks build a data mart for credit risk to facilitate their credit risk management. As shown below, such a data mart performs various functions by providing:
A platform for sharing and exchanging data for risk indicators Sharing and exchanging data from various risk systems,
eliminating information-isolated islands and reducing wasted use of system resources
A platform for collecting, integrating and storing risk data Adopting a unified approach to collecting internal and
external credit risk data, managing data based on data types and feeding reliable data to risk systems
A platform for fully supporting various risk management applications Fully supporting risk management applications and
meeting the needs of all risk systems with different data granularity and access frequency, and handling and processing indicators shared by various credit risk applications in a unified manner to improve data quality
Hot topic 2: How to build a data mart for banking credit risk from the basics
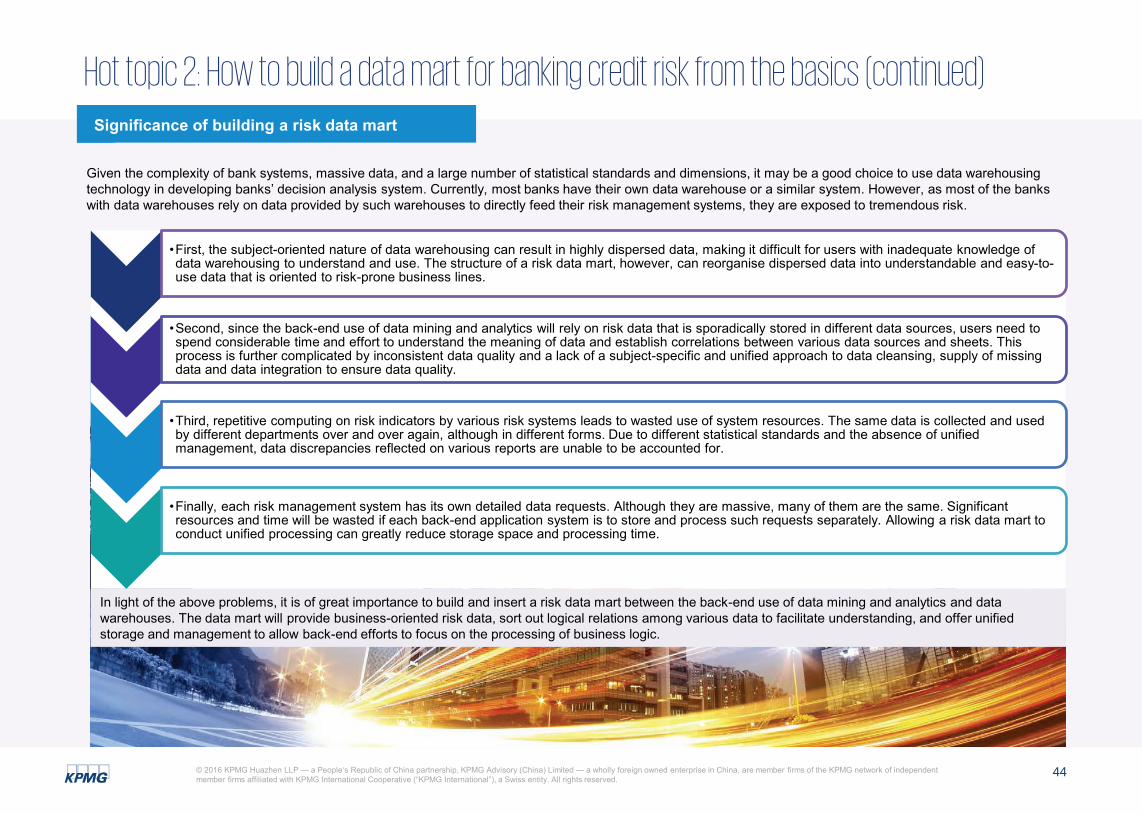
44© 2016 KPMG Huazhen LLP — a People‘s Republic of China partnership, KPMG Advisory (China) Limited — a wholly foreign owned enterprise in China, are member firms of the KPMG network of independent member firms affiliated with KPMG International Cooperative (“KPMG International”), a Swiss entity. All rights reserved.
Significance of building a risk data mart
Given the complexity of bank systems, massive data, and a large number of statistical standards and dimensions, it may be a good choice to use data warehousing technology in developing banks’ decision analysis system. Currently, most banks have their own data warehouse or a similar system. However, as most of the banks with data warehouses rely on data provided by such warehouses to directly feed their risk management systems, they are exposed to tremendous risk.
In light of the above problems, it is of great importance to build and insert a risk data mart between the back-end use of data mining and analytics and data warehouses. The data mart will provide business-oriented risk data, sort out logical relations among various data to facilitate understanding, and offer unified storage and management to allow back-end efforts to focus on the processing of business logic.
•First, the subject-oriented nature of data warehousing can result in highly dispersed data, making it difficult for users with inadequate knowledge of data warehousing to understand and use. The structure of a risk data mart, however, can reorganise dispersed data into understandable and easy-to-use data that is oriented to risk-prone business lines.
•Second, since the back-end use of data mining and analytics will rely on risk data that is sporadically stored in different data sources, users need to spend considerable time and effort to understand the meaning of data and establish correlations between various data sources and sheets. This process is further complicated by inconsistent data quality and a lack of a subject-specific and unified approach to data cleansing, supply of missing data and data integration to ensure data quality.
•Third, repetitive computing on risk indicators by various risk systems leads to wasted use of system resources. The same data is collected and used by different departments over and over again, although in different forms. Due to different statistical standards and the absence of unified management, data discrepancies reflected on various reports are unable to be accounted for.
•Finally, each risk management system has its own detailed data requests. Although they are massive, many of them are the same. Significant resources and time will be wasted if each back-end application system is to store and process such requests separately. Allowing a risk data mart to conduct unified processing can greatly reduce storage space and processing time.
Hot topic 2: How to build a data mart for banking credit risk from the basics (continued)

45© 2016 KPMG Huazhen LLP — a People‘s Republic of China partnership, KPMG Advisory (China) Limited — a wholly foreign owned enterprise in China, are member firms of the KPMG network of independent member firms affiliated with KPMG International Cooperative (“KPMG International”), a Swiss entity. All rights reserved.
Significance of building a risk data mart (continued)
Data flows between systems following the establishment of a risk data mart
Unified view of risk Risk Weighted Assets(RWA) system Risk warning system
Related party transaction system Risk reporting system Economic capital system
Risk systems
Business systems
Credit system Collateral management system Core system International
settlement system Accounting system
Risk systems
Related party transaction system RWA system Economic capital
system Unified view of risk Risk warning
systemRisk reporting
system
Risk data mart
Business systems
Credit system Collateral management system Core system International
settlement systemAccounting
system
Hot topic 2: How to build a data mart for banking credit risk from the basics (continued)

46© 2016 KPMG Huazhen LLP — a People‘s Republic of China partnership, KPMG Advisory (China) Limited — a wholly foreign owned enterprise in China, are member firms of the KPMG network of independent member firms affiliated with KPMG International Cooperative (“KPMG International”), a Swiss entity. All rights reserved.
Design of a basic data model for a credit risk data mart
A credit risk data mart is built within a data warehouse at the corporate level. As a subordinate data mart, it draws data from a corporate data warehouse (it can also be built without an existing data warehouse and will extract data from various source systems). It is designed to leverage data used for risk measurement to specifically serve banks’ various risk management needs with powerful access capabilities.
A credit risk data mart needs to be built on a rational model with sufficient historical data stored to meet the needs of risk management programmes for searching and extracting credit risk data. The model for a credit risk data mart can be further divided into two models: one for basic data and one for application data. Due to space limitations, only the design of a basic data model will be discussed here.
The basic data model for a credit risk data mart adopts a subject-specific and model-based approach to storing various business data. There are seven subjects that give rise to seven subject models:
Hot topic 2: How to build a data mart for banking credit risk from the basics (continued)
Product Rating
Product-event relations
EventInterested partyAgreement
Finance Mitigation
Product-agreement relations
Agreement-mitigation relations
Agreement-finance relations
Interested party-finance relations
Interested party-agreement relations Agreement-event
relations
Agreement-rating relations
Interested party-rating relations
Interested party-event relations
Interested party-mitigation relations

47© 2016 KPMG Huazhen LLP — a People‘s Republic of China partnership, KPMG Advisory (China) Limited — a wholly foreign owned enterprise in China, are member firms of the KPMG network of independent member firms affiliated with KPMG International Cooperative (“KPMG International”), a Swiss entity. All rights reserved.
Design of a basic data model for a credit risk data mart (continued)
Interested party
• ‘Interested party’ refers to any individuals or organisations in which banks are interested. They purchase and accept banks’ products and services through various means to meet their financial needs. They may also be individuals or organisations with which banks have other business, or in which banks are interested due to banks’ marketing, management and other needs.
• The interested party model for a credit risk data mart mainly covers: basic information of interested parties (the main sheet of related parties), information of corporate interested parties (including corporate customers, factoring agents and third-party appraisers), information of retail interested parties (including individual customers, business owners and micro-loan applicants), information of internal institutions (internal institutions within banks under a flat organisational structure, internal institutions under various systems, superior and subordinate reporting institutions, etc.), financial information of corporate interested parties (data on financial indicators, definitions of financial indicators, financial statements, etc.), relationships among interested parties (relationship history, history of agreement-interested party relations, etc.), system users (teller information, information of credit system users), etc.
Agreement Rating Mitigation
• ‘Mitigation’ refers to the process in which banks transfer or reduce risk loss frequency and impacts through qualified pledges and collaterals, net settlement, guarantees, credit derivatives and other means.
• The mitigation model for a credit risk data mart mainly covers: information of risk mitigation products, history of settlement asset relations, information of security deposits for corporate loans, insurance information of collaterals, history of asset valuation, lists of deposit slips, information of security deposits for retail loans, etc.
• ‘Agreement’ refers to a covenant entered into between interested parties for certain products or services. Under the agreement model, the contractual relationship between banks and their customers is reflected in the history of interested party-agreement relations, and changes in various agreements are recorded historically.
• The agreement model for a credit risk data mart mainly covers: corporate agreements (corporate lending contracts and agreements on discounts, interbank discounts, the opening and acceptance of acceptance bills, L/C opening and acceptance, bank acceptance, factoring, entrusted loans, supply chain guarantees, buy-back, interbank borrowing and lending, marketable securities, corporate credit lending, etc.), retail agreements (retail credit contracts, retail credit lending agreements, the master sheet of credit lines, information of retail lending guarantors), credit card agreements (a summary of credit card accounts and credit cards), examination and approval of corporate credit (applications for corporate credit, credit line information, opinions on credit examination and approval, information of previous procedures, bulk credit relations, etc.), examination and approval of retail credit (retail lending programmes, the master sheet of application, applications, etc.), examination and approval of microloans (applications for microloans, discounted microloans, bank acceptance credit, etc.), and more.
• In a general sense, ‘rating’ refers to an overall appraisal of an entity’s ability and willingness to perform contractual obligations and economic commitments.
• The rating model for a credit risk data mart mainly covers: public rating (history of interested parties’ scores and rating), national rating (national rating information), rating of corporate customers (the sheet that includes customer rating results, rating models, rating tasks, default probability based on customer credit rating, etc.), corporate customer debt rating (rating results of a single debt, rating results of bulk debt), retail pools (Lose Given Default(LGD) pool results, asset pool results), bond rating (the bond rating sheet), etc.
Hot topic 2: How to build a data mart for banking credit risk from the basics (continued)

48© 2016 KPMG Huazhen LLP — a People‘s Republic of China partnership, KPMG Advisory (China) Limited — a wholly foreign owned enterprise in China, are member firms of the KPMG network of independent member firms affiliated with KPMG International Cooperative (“KPMG International”), a Swiss entity. All rights reserved.
Design of a basic data model for a credit risk data mart (continued)
• ‘Product’ refers to financial services that can create value for banks and can be sold on a standalone basis, including financial services that banks provide for their customers and financial services under capital market transactions that banks enter into.
• The product model for a credit risk data mart mainly covers: information of loan products, product categories, product types, correlations between products and product types, etc.
Product
• ‘Event’ refers to business interactions between participants and banks, as well as banks’ internal interactions. It includes detailed data on behaviours and transactions, including deposits, withdrawals, payments, annual fees for credit/debit cards, interest and expenses, complaints, searches, online transactions, etc.
• The event model for a credit risk data mart mainly covers: accounting events, transaction events on general ledgers, schedules of repayments from corporate borrowers, history of repayment plans, schedules of repayments from retail borrowers, schedules of credit card repayments, etc.
Event
• ‘Finance’ is used to record information pertaining to banks’ internal financial management and risk management, and analyse and evaluate financial information to facilitate the understanding of an enterprise’s past and current operating performance and financial position, as well as any changes to them.
• The finance model for a credit risk data mart mainly covers: general ledger accounting calibres, the chart of accounts in general ledgers, product-related accounts and their relations with corporate entities, a summary of general ledgers, a summary of general ledgers following carry-forward treatment, relations between provisions and debt-related items, etc.
Finance
ConclusionsThe seven subjects provided above as the foundation for constructing the basic data model for a credit risk data mart may need to be specified in further detail in accordance with a bank’s specific needs and business model. It takes long-term and systematic efforts to build a risk data mart. Changes in the regulatory environment and requirements, as well as industry users’ deepening understanding of the systems and their applications can set a higher standard for such systems, requiring constant adjustments and improvements. Only by designing and developing a model that has practical value for banks and performing data mining based on such a model can the advantage of a data mart be fully harnessed and ultimately bring tangible benefits to banks.
Hot topic 2: How to build a data mart for banking credit risk from the basics (continued)

49© 2016 KPMG Huazhen LLP — a People‘s Republic of China partnership, KPMG Advisory (China) Limited — a wholly foreign owned enterprise in China, are member firms of the KPMG network of independent member firms affiliated with KPMG International Cooperative (“KPMG International”), a Swiss entity. All rights reserved.
In light of the current economic downturn, rapidly rising credit risk and higher NPLs in the banking sector, new requirements on credit risk management and control should be established. In mid-September 2016, the CBRC issued the Notice on Further Strengthening Credit Risk Management (Yin Jian Fa [2016] No. 42, hereinafter referred to as ‘Circular No. 42’), which requires the banks to enhance credit risk management from eight aspects, including improving unified credit management and strengthening risk assessment of credit customers, and conducting system review and risk inspections. Looking back upon the reform on regulation policies, Circular No. 42 is consistent with Circulars No. 127 and No. 27 in terms of the provisions on unified credit management, ‘penetrating’ management and comprehensive risk management. It is an extension and elaboration of the regulation thinking under the current economic situation, and attempts to prevent credit risk from transferring to ‘off-balance sheet’ and non-credit activities. In addition, Circular No. 42 fully reflects the requirements set out in Circular No. 44, which defines the compatibility principle and full coverage principle of comprehensive risk management, and pushes comprehensive risk management to cover non-traditional businesses. This requires that timely adjustments be made based on changes in the operating environment of banks, risk alerts, and further management and control.
Circular No. 127 has clarified the types and scope of interbank business, and stipulated that special purpose vehicles (SPVs) include, but are not limited to, commercial bank financial products, trust investment plans, securities investment funds, asset management plans of the securities companies, asset management plans of the fund management companies and their subsidiaries, as well as asset management products of insurance asset management institutions.
It has also clarified the regulation framework of interbank business and required that unified credit management policies for interbank business within the institution should be established and improved, and interbank business should be incorporated into the unified credit system of the whole institution. In addition, in accordance with the principle of ‘substances outweighing forms’, financial institutions should measure risks and accrue the corresponding capital and provisions based on the nature of the underlying assets invested.
In September 2016, the CBRC issued the Notice on Further Strengthening Credit Risk Management (Yin Jian Fa [2016] No. 42, hereinafter referred to as ‘Circular No. 42’)
In September 2016, the CBRC issued the Notice on Further Strengthening Credit Risk Management (Yin Jian Fa [2016] No. 42, hereinafter referred to as ‘Circular No. 42’)
In February 2016, Opinions of the General Office of the China Banking Regulatory Commission on Prevention and Resolution of Financial Risks and Upholding of the Bottom Line of Risk Control was released (Yin Jian Ban Fa [2016] No. 27, hereinafter referred to as ‘Circular No. 27’)
Regulation policy Interpretation
In May 2014, the PBOC, CBRC, CSRC, CIRC and SAFE jointly issued the Notice on Regulating the Interbank Business of Financial Institutions (Yin Fa [2014] No. 127, hereinafter referred to as ‘Circular No. 127’)
Banking financial institutions should improve their comprehensive risk management framework and incorporate non-credit business and off-balance sheet business into the comprehensive risk management system so that they are under unified credit management along with the on-balance sheet business, and establish an asset quality monitoring system which includes all types of assets.
Banking financial institutions should continue to strengthen credit risk prevention and control from the aspects of key customers, industries and regions, and implement the five-tier classification of credit assets, and enhance capabilities of risk warning and elimination.
They should also strengthen the risk regulation of non-traditional business, including: Cross-industry, cross-border and cross-market businesses to prevent ‘cross infection’ risk Equity investments held on behalf of customers, bonds and foreign currencies to reinforce market risk management Wealth management business should be compliant with the ‘penetrating principle’ and its risk management should be included in the
comprehensive risk management system. They should continue to strengthen capital regulation and constantly enhance their risk offsetting capabilities. They should make sufficient
provision for non-traditional business with credit nature and emerging business in accordance with the ‘penetrating principle’ and strengthen provision management of country risks.
The comprehensive risk management should adhere to four principles, namely compatibility, full coverage, independence and effectiveness principles. Compatibility principle: The comprehensive risk management system should be compatible with the relevant risk profile and systemic
significance, and should be adjusted in accordance with environmental changes. Full coverage principle: Comprehensive risk management should cover each and every business line, including renminbi and foreign
currencies, on-balance sheet and off-balance sheet, and domestic and overseas businesses; it should cover all branches, subsidiaries, departments, job positions and staff, as well as all types of risks and the mutual impact between different risks; and it should run through all management phases of decision-making, implementation and supervision.
Circular No. 42 puts forward eight requirements in respect of strengthening credit risk management.
Background
Hot topic 3: Interpretation of the implications of Circular No. 42 on banking business

50© 2016 KPMG Huazhen LLP — a People‘s Republic of China partnership, KPMG Advisory (China) Limited — a wholly foreign owned enterprise in China, are member firms of the KPMG network of independent member firms affiliated with KPMG International Cooperative (“KPMG International”), a Swiss entity. All rights reserved.
Main content
Circular No. 42 requires all banks to strengthen credit risk management, and conduct system review and risk inspection from eight aspects, including improving the unified credit management and strengthening risk assessment of credit customers. Its core content includes five aspects: 1) extension of unified credit management to cover three aspects, 2) prospective identification of customer risks, 3) comprehensive management of credit risk limits, 4) classification of non-credit assets and provision for impairment or estimated liabilities, and 5) enhancement of risk mitigation effectiveness.
Circ
ular
No.
42
Improve unified credit management
Strengthen risk assessment of credit customers
Regulate credit approval procedures
Improve the management framework of concentration
risk
Strengthen country risk management
Improve accuracy of loan classification
Conduct non-credit assets classification
Enhance risk mitigation effectiveness
Core content:Firstly, Circular No. 42 has extended the coverage of unified credit management to the extent that:1. Credit business has been fully covered, which includes traditional credit assets, investment assets, interbank business and off-balance sheet business whose credit risk is actually borne by banking financial institutions.2. The consolidated institutions of the banking group have been fully covered, including the total credit of banking financial institutions and their consolidated institutions.3. Affiliates of customers have ben fully covered and under ‘penetrating management’; that is to manage customers with economic correlation with reference to the treatment of group customers during the course of credit granting and concentration management, and match the SPV investment with the ultimate debtor according to the ‘penetrating principle’.
Secondly, Circular No. 42 calls for the implementation of information mining from various dimensions based on the integration and sharing of internal and external customer information to realise prospective identification, prevention and control of customer risks.
Thirdly, Circular No. 42 has clarified the indicator system, measurement method, threshold, and management and control process of the comprehensive credit limit.1. The indicator system, which includes customers, industries, areas, currencies, collateral, markets, and countries/regions based on the source of risk; and includes credit, investment, derivative trading, acceptance and guarantee based on the source of business2. The measurement method, which measures the total credit at the level of the group’s consolidated statements (namely the banking financial institutions and their consolidated institutions), and matches the SPV investment with the ultimate debtor according to the ‘penetrating principle’, rather than implementing credit management based on the issuer of the SPV or the SPV itself3. The threshold of limit indicator, which has clarified larger risk exposure with reference to the relevant regulation requirements. In addition, financial institutions also have to comply with the requirements on interbank debt concentration and country risk provision ratio 4. The process of management and control, which has clarified the management framework for concentration risk and country risk to better connect to Circular No. 44.
Fourthly, Circular No. 42 has strictly regulated the quantitative criteria and approval levels regarding the transfer of NPLs into non-NPLs. At the same time, it requires that on-balance sheet and off-balance sheet business with credit risk should go through asset classification and provision for impairment or estimated liabilities should be made. Though the coverage of provision for impairment or estimated liabilities has been extended, the expanded scope of measurement has a limited impact on the profits and capital level of financial institutions, given that there are few (almost no) defaults or loss events in respect of non-credit assets.
Fifthly, Circular No. 42 strives to enhance risk mitigation effectiveness through the establishment, valuation and subsequent management of collateral to counter major issues that appear in the course of collateral management, including loose access control, overvaluation, lack of independence during valuation, and collateral being misappropriated or damaged.
Hot topic 3: Interpretation of the implications of Circular No. 42 on banking business (continued)

51© 2016 KPMG Huazhen LLP — a People‘s Republic of China partnership, KPMG Advisory (China) Limited — a wholly foreign owned enterprise in China, are member firms of the KPMG network of independent member firms affiliated with KPMG International Cooperative (“KPMG International”), a Swiss entity. All rights reserved.
Improve unified credit management
Original text:Banking financial institutions should incorporate loans (including trade finance), bill acceptance and discounting, overdrafts, bond investments, SPV investments, opening of letters of credit, factoring, guarantees, loan commitments, and other businesses whose credit risks are actually borne by banking financial intuitions into unified credit management where SPV investments should be matched with the ultimate debtor based on the ‘penetrating principle’. Banking financial institutions should also determine the comprehensive credit line for a single corporate customer, group customer, as well as different regions and industries based on the fully covered credit businesses. The comprehensive credit limit should include the total credit of banking financial institutions and their consolidated institutions. In addition, banking financial institutions should incorporate interbank customers into the scope of unified credit granting, set a reasonable risk limit for interbank customers and monitor their overall risk exposure. They should also consider the impact of changes in exchange rate on risk exposure when determining the credit limit of customers, with larger credit granted in foreign currencies.
Interpretation:Circular No. 42 puts forward the key points of unified credit management from five aspects.
Comprehensive credit limit
Credit products
Quota system
Quotameasurement
Interbankcustomers
Foreign currency
risk
Firstly, it has broadened the types of credit products and included investment assets, interbank business and off-balance sheet business whose credit risk is actually borne by banking financial institutions into unified credit management. According to the statistics on asset structure of listed banks, as at the end of September 2016, the share of traditional credit assets, securities investments and interbank assets in the banks’ balance sheet assets was 49.68%, 28.17% and 6.34% respectively. Therefore, the unified credit management required by Circular No. 42 will cover over 80% of the on-balance sheet assets.
Secondly, it has clarified the system of comprehensive credit limit, which includes single corporate customers, group customers, and different regions and industries.
Thirdly, it has clarified the measurement method of comprehensive credit limit indicators, which measure the total credit at the level of the group’s consolidated statements (namely the banking financial institutions and their consolidated institutions), and matches the SPV investment with the ultimate debtor according to the ‘penetrating principle’, rather than implementing credit management based on the issuer of the SPV or the SPV itself.
Fourthly, it has incorporated interbank customers into the scope of unified credit granting, which is an extension of Circular No. 127. However, Circular No. 42 contains no additional concentration requirements.
Lastly, it has warned of the foreign currency risk of credit granted in a foreign currency. Given the recent fluctuation of the RMB exchange rate, market risks will affect credit management. In the case of credit limits set in RMB, RMB depreciation will result in the foreign currency transactions of certain customers exceeding the credit limit, which in turn will require additional collateral or affect business handling; in the case of credit limits set in a foreign currency, if the debtors have currency mismatch (e.g. operating cash flows are mainly denominated in RMB while loans are denominated in USD), though exchange rate fluctuation does not affect quota occupation, attention should be paid to the debtors’ currency mismatch risk and increased pressure of debt repayment.
Hot topic 3: Interpretation of the implications of Circular No. 42 on banking business
(continued)Interpretation of Circular No. 42 (continued)

52© 2016 KPMG Huazhen LLP — a People‘s Republic of China partnership, KPMG Advisory (China) Limited — a wholly foreign owned enterprise in China, are member firms of the KPMG network of independent member firms affiliated with KPMG International Cooperative (“KPMG International”), a Swiss entity. All rights reserved.
Strengthen risk assessment of credit customers
Original text:Banking financial institutions should strengthen the internal sharing of customer risk information, explore the implementation of unified management of customer risk information and conduct integrated analysis regarding customers’ various credit risk information. They should accelerate the establishment of an information sharing mechanism across the sector, collect customers’ non-traditional financing information from various channels, and enhance their capability to monitor and assess the total liability of credit customers. Before granting credit to new customers or increasing credit to existing customers, banking financial institutions should check internal and external sharing information to understand the total liability of the customers to determine whether the customers have been granted excessive credit or involved in a guarantee circle, financial fraud or cross-bank defaults to effectively warn of,prevent and control risks.
Interpretation:Circular No. 42 offers suggestions for risk prevention and control from aspects such as external and internal information integration channels, monitoring methods and key risk areas.
First, financial institutions should strengthen the internal information integration mechanism. They should break down barriers from within and integrate all customer information form the customer department, product department and support department to create multi-dimensional customer information.
Second, financial institutions should realise external information sharing. Available information sources include information sent back from regulators and external information inquiries.
Third, financial institutions should establish effective prospective risk monitoring. They should make use of customer information from various channels for information processing and risk modelling, and conduct prospective risk warning and prevention based on big data.
Fourth, financial institutions should identify key credit risk areas, which include risk factors such as guarantee circles, financial fraud and cross-bank defaults.
Product department
CreditInvestment
Wealth management
Interbank……
Customer department
Supporting department
OperationRisk
FinanceTechnology
……
PBOCCBRCSAICSAT
CourtsIndustry
associationOther financial
institutions
Customer risk
assessment
Guarantee circles
Financial fraudCross-bank
defaults……
Data miningInternal information integration
mechanismExternal information sharing
mechanism
Hot topic 3: Interpretation of the implications of Circular No. 42 on banking business (continued)Interpretation of Circular No. 42 (continued)

53© 2016 KPMG Huazhen LLP — a People‘s Republic of China partnership, KPMG Advisory (China) Limited — a wholly foreign owned enterprise in China, are member firms of the KPMG network of independent member firms affiliated with KPMG International Cooperative (“KPMG International”), a Swiss entity. All rights reserved.
Regulate credit approval procedures
Original text:Banking financial institutions should clarify the approval criteria, policies and procedures regarding the increase of credit lines, extension of existing credit and roll financing, and should clarify approval authority at different levels based on the scale and complexity of risk exposure. Where the total credit granted to a group customer exceeds 10% of the financial institution’s net capital or the total credit granted to a single customer exceeds 5% of the financial institution’s net capital, the credit should be considered as large risk exposure and should be determined and approved by the board of directors or senior management. Banking financial institutions can develop their own management policy regarding large risk exposure based on their own risk management needs, which, however, should meet the above minimum requirements. When calculating large risk exposure, customers with economic correlation should be under concentration management and their credit should be determined with reference to the treatment of group customers. ‘Economic correlation’ refers to a situation where the bankruptcy of one party may have a significant adverse impact on the other party’s solvency, including but not limited to the situations where one party provides the other party with a large amount of guarantee; where one party acts as the purchaser of a vast majority of products from the other party and cannot easily be replaced; and where the cash flows of one party primarily originated from transactions with the other party.
Interpretation:In addition to the clarification of unified credit products, limit indicator systems and indicator measurement, Circular No. 42 further clarifies the regulation on large risk exposure.
First, it sets out the minimum requirement of large risk exposure, where the
total credit granted to a group customer exceeds 10% of the financial institution’s
net capital or the total credit to a single customer exceeds 5% of the financial
institution’s net capital.
Second, it puts forward the concept of ‘economic correlation’ and requires
that customers with economic correlation should be under concentration
management and their credit should be granted with reference to the treatment of
group customers. According to the concept of economic correlation and the
requirements on credit granting and concentration management, financial
institutions should increase their efforts in identifying enterprises with economic
correlation, and enhance the collection of consolidated data and model
optimisation in areas such as credit limit setting, customer assessment and early
warning.
Where the total credit granted to a single customer exceeds 5% of the financial institution’s net capital, the credit should be considered as larger risk exposure.
Where the total credit granted to a group customer exceeds 10% of the financial institution’s net capital, the credit should be considered as larger risk exposure.
Customers with economic correlation should be under concentration management and their credit should be granted with reference to the treatment of group customers.
Singlecustomer
Group customer
Enterprises with economic correlation
Hot topic 3: Interpretation of the implications of Circular No. 42 on banking business (continued)Interpretation of Circular No. 42 (continued)

54© 2016 KPMG Huazhen LLP — a People‘s Republic of China partnership, KPMG Advisory (China) Limited — a wholly foreign owned enterprise in China, are member firms of the KPMG network of independent member firms affiliated with KPMG International Cooperative (“KPMG International”), a Swiss entity. All rights reserved.
Improve the management framework of concentration risk
Original text:Banking financial institutions should establish concentration risk management frameworks which cover various sources of risk, such as customers, industries, areas, currencies, collateral, markets and countries/regions; which include all on-balance sheet and off-balance sheet exposures such as credit, investment, derivatives trading, acceptance and guarantee; and which can fully reflect the ‘penetrating principle’. In addition, banking financial institutions should establish information systems for concentration risk management that can meet the needs of ‘penetrating’ management, and identify, monitor, analyse and manage concentration risk from multi-dimensions and set corresponding limits.
Interpretation:Circular No. 42 clarifies the concentration risk management framework from the aspects of management procedure, business scope and sources of risk.
First, it clarifies the concentration risk management procedure, namely identification, monitoring, analysis and management of concentration risk.
Second, it clarifies the sources of concentration risk, namely customers, industries, areas, currencies, collateral, markets, and countries/regions. Financial institutions should set corresponding limits regarding different sources of risk.
Third, it determines the scope of business with concentration risk, namely all on-balance sheet and off-balance sheet risk exposures such as credit, investment, derivatives trading, acceptance, and guarantee. Financial institutions should allocate the concentration limits of the above items to different lines of business, consolidate, monitor relevant data and make dynamic adjustment. Given the above provision and the requirement of matching relevant business with the ultimate borrower, Circular No. 42 presents a greater challenge to the current management level and system support of financial institutions.
Concentration risk management framework and management procedure
Source of business
CreditInvestmentDerivatives
tradingAcceptanceGuarantee
……
Sources ofrisk Client
IndustryArea
CurrencyCollateralMarket,
country/region……
Measurement principle
Penetrating management
Information system support
Identification Monitoring Analysis Management
Hot topic 3: Interpretation of the implications of Circular No. 42 on banking business (continued)Interpretation of Circular No. 42 (continued)

55© 2016 KPMG Huazhen LLP — a People‘s Republic of China partnership, KPMG Advisory (China) Limited — a wholly foreign owned enterprise in China, are member firms of the KPMG network of independent member firms affiliated with KPMG International Cooperative (“KPMG International”), a Swiss entity. All rights reserved.
Strengthen country risk management
Original text:Banking financial institutions should establish and improve their policies and processes which should be consistent with their systemic importance, risk profile and risk preference. They should also efficiently identify, measure, assess, monitor and report, and control and mitigate the country risk and transfer risk that involves the banking groups. In addition, banking financial institutions should strictly monitor country risk exposure in a timely, accurate and comprehensive manner, and strictly implement country risk limit management. They should develop written policies of country risk provision, make sufficient provision for country risks and submit relevant reports to the CBRC. For banks without enough provision for country risk, they should take actions to increase provision or reduce country risk exposure.
Interpretation:Circular No. 42 clarifies the country risk management framework from aspects of management procedure, country risk exposure monitoring, limit management and provision.
First, it clarifies the country risk management procedure, namely
identification, measurement, assessment, monitoring and reporting,
control and mitigation.
Second, it requires financial institutions to monitor country risk
exposure, manage risk limits and make provisions for country
risks. The ratio of provisions for country risks should be determined
based on the level of country risks, ranging from 0.5% to 50%.
(Guidelines for Banking Financial Institutions on the Management of
Country-related Risks (Yin Jian Fa [2014] No. 45)).
Country risk management framework and management procedure
Country risk exposure
monitoring
Country risk limit management
Low country risks above 0.5% Relatively low country risks above 1% Moderate country risks above 15%
• Relatively high country risks above 25%
• High country risks above 50%• (Yin Jian Fa [2010] No.45)
Provisionfor country risk
Identification Measurement Assessment Monitoring and reporting
Control and mitigation
Hot topic 3: Interpretation of the implications of Circular No. 42 on banking business (continued)Interpretation of Circular No. 42 (continued)

56© 2016 KPMG Huazhen LLP — a People‘s Republic of China partnership, KPMG Advisory (China) Limited — a wholly foreign owned enterprise in China, are member firms of the KPMG network of independent member firms affiliated with KPMG International Cooperative (“KPMG International”), a Swiss entity. All rights reserved.
Improve accuracy of loan classification
Original text:Banking financial institutions should strengthen loan classification management, carry out loan classification policies on a regular basis and conduct an internal audit on the implementation of procedures. Institutions which falsify loan classifications to conceal the actual loan quality should be held accountable and punished more strictly. The institutions should work out clear criteria and procedures for raising loan classification and should be prudent in raising NPLs to performing loans. Only when all the overdue principal, interest and other outstanding balance have been repaid and the remaining principal and interest are at least repaid regularly in the subsequent two repayment periods or within six months (determined by the longer period) and are expected to be continuously repaid based on contract terms in the future, can the NPLs be classified as performing loans. Raising loan classification should be approved by headquarters or tier 1 branches authorised by the headquarters. The financial institutions can make specific criteria and procedures for raising the NPLs to performing loans based on their actual situations, but should at least meet the requirements mentioned above. Regulatory institutions at all levels should strengthen supervision on asset transfer practices by the financial institutions. Assets which are transferred out through channels but whose credit risk still remains in the original institution should be classified based on their original risk exposure.
Interpretation:Circular No. 42 provides strict management and control processes for transferring NPLs into performing loans, and strengthens supervision on ‘transferring assets out of balance sheet’. Stipulates clear quantification standards. Only when all the overdue
principal, interest and other outstanding balance have been repaid and the remaining principal and interest are repaid regularly in the subsequent two repayment periods or within six months (determined by the longer period) and are expected to be continuously repaid based on contract terms in the future, can the NPLs be classified as performing loans.
Identifies authorities responsible for approval of raising NPL classification. Raising loan classification should be approved by headquarters or tier 1 branches authorised by the headquarters.
Strengthens supervision of ‘transferring assets out of balance sheet’. Assets which are transferred out through channels but whose credit risk still remains in the original institution should be classified based on their original risk exposure.
Normal/concernedTransferred out
Reversed
Non-performing
Risk disposal
Hot topic 3: Interpretation of the implications of Circular No. 42 on banking business (continued)Interpretation of Circular No. 42 (continued)

57© 2016 KPMG Huazhen LLP — a People‘s Republic of China partnership, KPMG Advisory (China) Limited — a wholly foreign owned enterprise in China, are member firms of the KPMG network of independent member firms affiliated with KPMG International Cooperative (“KPMG International”), a Swiss entity. All rights reserved.
Conduct non-credit assets classification
Original text:Banking financial institutions should further improve rules and measures based on related regulations on loan classification to clarify criteria and processes for the classification of various on-balance sheet and off-balance sheet non-credit assets, so as to reflect risk exposures of the non-credit assets on a true, accurate and dynamic basis. On-balance sheet and off-balance sheet business of which the financial institutions undertake the actual credit risks should in principle be classified. Adhering to the principle of focusing on substance rather than formality in classifying non-credit assets, the institutions should conduct ‘penetrating’ management and determine risk categories reasonably based on the risk exposure of underlying assets. The institutions should also enhance their risk offsetting capabilities through impairment provisions or estimated liabilities based on risk categories and the nature of non-credit assets.
Interpretation:Circular No. 42 stipulates that financial institutions should conduct asset classification for on-balance sheet and off-balance sheet businesses which undertake credit risks and accrue impairment provisions or estimated liabilities to enhance risk offsetting capabilities.
First, the coverage of impairment provisions or estimated liabilities is expanded. Currently, impairment provisions accrued for credit risks mainly cover traditional loans and bond investment facing
credit risks. Circular No. 42 requires financial institutions to classify non-credit assets and accrue impairment provisions.
Second, the ‘incurred loss model’ will continuously be adopted to calculate impairment provisions. Considering that the historic loss ratio of non-credit assets is small as few of them involve defaults
or loss events, the expansion of the coverage of impairment provisions may not significantly impact the profits and capital levels of the financial institutions.
At this stage, banks should make the following preparations in respect of the impairment provisions for non-credit assets. First, data preparation: Banks should put forward specific data requirements based
on the proposed and adopted model building method, and complete data collection and cleaning after evaluating the existing data. Second, model building and verification: Banks should consider different
model building methods based on their data status, and in the meantime conduct scenario analyses and sensitivity analyses to provide references for determining the final model. Third, building of
impairment calculation information system: This may involve significant changes in the existing system, governance structure and data process.
Considering that the ‘expected loss model’ required by International Financial Reporting Standard No. 9 – Financial Instruments (IFRS 9) will be effective on 1 January 2018 and that the Ministry of Finance
issued the Notice on Soliciting Public Opinions on Accounting Standards for Business Enterprises No. 22 – Recognition and Measurement of Financial Instruments (Revised) (Draft for Comments) and
Other Two Accounting Standards (Cai Ban Kuai [2016] No. 33) on 8 January 2016, many financial institutions are adopting or will adopt the ‘expected loss model’. Asset classification can be one of the
input parameters of the ‘expected loss model’ and non-credit asset classification is of significance to the banks to implement IFRS 9. Therefore, it is recommended that the banks should balance the non-
credit asset classification and preparations for the implementation of the ‘expected loss model’.
Hot topic 3: Interpretation of the implications of Circular No. 42 on banking business (continued)Interpretation of Circular No. 42 (continued)

58© 2016 KPMG Huazhen LLP — a People‘s Republic of China partnership, KPMG Advisory (China) Limited — a wholly foreign owned enterprise in China, are member firms of the KPMG network of independent member firms affiliated with KPMG International Cooperative (“KPMG International”), a Swiss entity. All rights reserved.
Enhance risk mitigation effectiveness
Original text:Banking financial institutions should establish credit risk mitigation systems, policies and procedures based on their business characteristics to assess the effectiveness of risk mitigation measures on a regular basis. The institutions should focus on assessing whether the collateral is real, legitimate and realisable; whether the evaluation of collateral is prudent and deliberate; and whether the relevant pledge documents are complete and the contract terms strict. The institutions should also determine the frequency of collateral re-evaluation based on the classification and nature of the collateral, and re-evaluate the collateral on a regular basis. The institutions should take effective actions in a timely manner when the changes in the value of the collateral significantly affect risk mitigation effectiveness. In assessing the effectiveness of the risk mitigation measures, the institutions should fully consider the impacts of fluctuations in the micro economy, financial market and related industries.
Interpretation:Circular No.42 strengthens risk mitigation management in respect of the access and evaluation of collateral and its subsequent supervisions.
First, enhance management and control regarding the establishment
of collateral and prevent risks from happening in the first place,
including management and control of the truthfulness, legitimacy and
feasibility of the pledges.
Second, enhance collateral evaluation management and ensure
prudent collateral evaluation. For better practices, a prudent evaluation
system should fully consider the reasonability of evaluation models,
availability of market parameters, independence of evaluation practices and
activity of disposal markets.
Third, enhance subsequent collateral management. For better practices,
integrated management of pledge documents, regular check and
‘unannounced inspection’ can effectively mitigate the risk of
misappropriation and substitution of collateral.
Collateral management framework and process
Key risks
Loose access control
Overvaluation,evaluation lacks independence
Collateral is misappropriated
or damaged
Access Evaluation Approval EstablishmentCustody/change
Supervision Relief or disposal
Hot topic 3: Interpretation of the implications of Circular No. 42 on banking business (continued)Interpretation of Circular No. 42 (continued)

59© 2016 KPMG Huazhen LLP — a People‘s Republic of China partnership, KPMG Advisory (China) Limited — a wholly foreign owned enterprise in China, are member firms of the KPMG network of independent member firms affiliated with KPMG International Cooperative (“KPMG International”), a Swiss entity. All rights reserved.
Background
In order to tackle the difficulties of financing scientific and technological innovation and implementing the innovation-driven development strategy, the banking sector has been exploring how to bundle equity with debt in financing. Equity investment and lending bundling, as an important mechanism of fintech, has drawn much attention.
In the Guidance on Providing More Credit Support to Small and Medium Technological Enterprises (Circular No. 37) issued in 2009, the CBRC states that “Banks are encouraged to cooperate with venture capital firms to expand financing channels for small and medium technological enterprises.”
Comments of the Central Committee of the Party and the State Council on Intensifying the Reform of Institutional Mechanisms to Expedite the Implementation of Innovation-driven Development Strategy released in March 2015 states that “Banks are encouraged to carry out a pilot project providing equity and debt financing services for innovation activities, and cooperate with venture capital and equity investment institutions to bundle equity investment and lending.”
The Opinion of the State Council on Implementing Mass Entrepreneurship and Innovation Policies and Measures released in June 2015 states that “Banks are encouraged to work with other financial institutions to provide equity and debt financing for entrepreneurial and innovation activities.”
The CBRC, the Ministry of Science and Technology and the PBOC jointly issued Guidance on Encouraging Financial Institutions in the Banking Sector to Carry out a Pilot of Equity Investment and Lending Bundling for Scientific and Technological Start-ups (hereinafter referred to as “the Guidance”). According to the Guidance, five pilot zones and ten banks, as the first batch of selected entities, have been approved to carry out investment and lending bundling. The Guidance also stipulates the general and guiding rules on the banking sector engaging in equity investment and lending bundling.
These fintech policies have enabled financial institutions to fund technological start-ups at earlier stages, i.e. the seed stage, the start-up stage and the development stage. As a result, financial support to technological start-ups will be enhanced, and the financial support structure will be optimised.
Hot topic 4: Analysis of the accounting treatment of equity investment and lending bundling in the banking sector

60© 2016 KPMG Huazhen LLP — a People‘s Republic of China partnership, KPMG Advisory (China) Limited — a wholly foreign owned enterprise in China, are member firms of the KPMG network of independent member firms affiliated with KPMG International Cooperative (“KPMG International”), a Swiss entity. All rights reserved.
I. Brief introduction of the Guidance
The Guidance clearly defines equity investment and lending bundling. Equity investment and lending bundling refers to the financing model where a financial institution in the banking sector cooperates with a subsidiary of the group designed for making investments in an arrangement by offering credit and conducting equity investment respectively, to fund scientific and technological start-ups on an ongoing basis. Under equity investment and lending bundling, investment income offsets credit risk to balance risk and returns for scientific and technological start-ups. The subsidiary as the investor can choose to make an equity investment into a non-listed scientific and technological start-up at the seed stage, the start-up stage or the growth stage, by sharing investment income and bearing investment risk. It will also participate in the management of the start-up, and withdraw in terms of management and investment in good time.
The Guidance requires that risks with equity investment and lending bundling must be prevented and controlled from different aspects, since it is a new business model.
Firewall
•A subsidiary designed for making investments must invest with its own funds, and the proportion of investment into a single scientific and technological start-up should not exceed 10% of its own funds. Investments into scientific and technological start-ups must be separated from those into other enterprises. Subsidiaries designed for making investments should be independent of their parent banks, and their funds should also be isolated from their parent banks’. •Banks must use their on-balance sheet funds to offer loans to scientific and technological start-ups.
Risk tolerance and taking mechanism
Revenue sharing mechanism Exit mechanism
Subsidiaries designed for making investments should strictly examine investment projects related to scientific and technological start-ups. Loans to scientific and technological start-ups should be managed separately through pre-loan investigations, loan reviews, post-loan inspections, a loan pricing mechanism, a credit management system and an incentive and control mechanism.1
Selected entities should set a reasonable risk tolerance for scientific and technological start-ups. They should determine an NPL principal sharing and compensation mechanism and relevant proportions among banks, subsidiaries designed for making investments, government loan risk compensation funds, guarantee companies and insurance companies, to ensure NPL ratios within the risk tolerance.
Selected entities should develop a reasonable revenue sharing mechanism for equity investment and lending.
Selected entities should dynamically monitor business risks associated with equity investment and lending bundling, and develop exit procedures based on risk appetite.
Hot topic 4: Analysis of the accounting treatment of equity investment and lending bundling in the banking sector (continued)

61© 2016 KPMG Huazhen LLP — a People‘s Republic of China partnership, KPMG Advisory (China) Limited — a wholly foreign owned enterprise in China, are member firms of the KPMG network of independent member firms affiliated with KPMG International Cooperative (“KPMG International”), a Swiss entity. All rights reserved.
II. Features of equity investment and lending bundling
The Guidance indicates that equity investment and lending bundling is designed to upgrade lending services of the banking sector and provide financial support to scientific and technological start-ups by balancing investment income with credit risk. Equity investment and lending bundling has matured overseas, and banks have used it to obtain higher returns, while scientific and technological start-ups have prospered. The substance of a transaction determines its accounting. According to international and domestic policy interpretations and practical experience, we conclude that equity investment and lending bundling mainly has the following features:
Banks offer loans, while subsidiaries designed for making investments make investments
Silicon Valley Bank has bundled equity investment and lending since the 1990s, and has now transformed into a technology bank by reasonably balancing high yield from equity investment and risks with bond investment. To alleviate the high risk of investments in scientific and technological start-ups, Silicon Valley Bank has controlled the proportion of share options obtained within 1% of the share capital of an investee, and ensured that bad debt losses should be lower than 1%2 through risk control measures. Liao Min, director-general of the CBRC Shanghai, determines that the equity ratio of banks in Shanghai should temporarily range from 3% to 5%.3
The principal activities of a bank include absorbing deposits, granting loans, and discounting bill and intermediary services, so it is a depository institution rather than an investment institution. For banks, equity investment and lending bundling is in essence venture debt; that is, banks provide credit funds while acquiring a small amount of share options or other interests. Equity investors are subsidiaries designed for making investments, venture capital firms or private equity firms. Shareholding proportions of banks should be rigorously controlled to avoid diverting them from principal activities.
Offset risks while still making interest income a principal activity
The investment income from equity investment and lending bundling is used to cover the high risk of loan offerings, which can address the mismatch of loan risk and investment income. The acquisition of share options or other interests is at the expense of lower interest on loans, so investment income is employed to cover losses resulting from loan offering risks.
Invest at an the early stage, and bundle during the whole life cycle
The Guidance encourages selected entities to invest in scientific and technological start-ups at the seed and start-up stage, and grant credit in the early stage of development, so as to fund scientific and technological start-ups at the high-risk phases of the life cycle. The banking sector may make good use of the ecosystem of venture capital as a bridge and medium, to connect entrepreneurs, venture capitalists, incubators, intermediaries, government and other entities, to set up a ‘financial service chain’ 4 covering the whole life cycle of a scientific and technological start-up.
As share options or other equity instruments held by subsidiaries designed for making investments are to offset potential losses arising from high risks with loans, parent banks and subsidiaries designed for making investment should account separately according to actual circumstances, and consider adjustments in consolidated financial statements. The accounting treatment of share options when they are held and disposed of should align with the nature of equity instruments and the substance of transactions.
Hot topic 4: Analysis of the accounting treatment of equity investment and lending bundling in the banking sector (continued)

62© 2016 KPMG Huazhen LLP — a People‘s Republic of China partnership, KPMG Advisory (China) Limited — a wholly foreign owned enterprise in China, are member firms of the KPMG network of independent member firms affiliated with KPMG International Cooperative (“KPMG International”), a Swiss entity. All rights reserved.
III. Status quo of the pilot project of equity investment and lending bundling, and relevant accounting treatment
Equity investment and lending bundling started in the 1950s and developed fast in the 1980s. It has now matured in the overseas banking sector. The business model of Silicon Valley Bank is typical. In the 1990s, the rise of high-tech industries and the surge in demand for entrepreneurial enterprises for financing stimulated Silicon Valley Bank to explore how to bundle equity investment with lending:
Hot topic 4: Analysis of the accounting treatment of equity investment and lending bundling in the banking sector (continued)
Investees Opportunity to enter Investment model
Silicon Valley Bank mainly invests in high-tech, life science, venture capital and high-end wine industries.
Approach scientific and technological start-ups when venture capital firms start to make investments in the first or second round; offer credit in the early stages of development; and serve small and micro technology enterprises by combining equity and debt financing.
For indirect financial services, Silicon Valley Bank usually issues loans at an interest rate 2-3% higher than the interest rate of loans to average mature enterprises, but generally lower than the interest rate of loans to the same type of small and micro technology enterprises where Silicon Valley Bank does not hold any equity investment. Silicon Valley Bank provides direct equity financing mainly through its subsidiary, Silicon Valley Capital. The investment models are shown as follows:• Provide financing to target
investees by directly holding shares (share options) with the ceiling of shareholding equal to that of the venture capital firm
• Invest in target investees indirectly through a venture capital fund.

63© 2016 KPMG Huazhen LLP — a People‘s Republic of China partnership, KPMG Advisory (China) Limited — a wholly foreign owned enterprise in China, are member firms of the KPMG network of independent member firms affiliated with KPMG International Cooperative (“KPMG International”), a Swiss entity. All rights reserved.
III. Status quo of the pilot project of equity investment and lending bundling, and relevant accounting treatment (continued)
According to the available public information, the status quo of the pilot project is as follows:
Selected entities have proactively engaged in equity investment and lending bundling since 21 April 2016 when the Guidance was released. As the selected entities are still looking for solutions, the specific pilot programme is yet to be disclosed.
One pilot zone and three banks are on the list of the first batch of pilot zones and financial institutions respectively. The three selected banks are Bank of Shanghai, Shanghai Huarui Bank and SPD Silicon Valley Bank. Bank of Shanghai and Shanghai Huarui Bank both established subsidiaries designed for making investments into scientific and technological start-ups, while SPD Silicon Valley Bank has not set up any such subsidiary, restrained by shareholders. In the pilot schemes, the three banks all use share options to mitigate risks and compensate for possible losses arising from high loan risks.5
Other selected banks also believe that the share option model would become the main trend,6 owing to the advantages of capital sparing, low shareholding and short vesting period. Under the share option model, banks do not get very involved in management. Share options are only regarded as a tool offsetting loan offering risks, which is in line with the actual situations of a scientific and technological start-up in its early stages. The Guidance defines a subsidiary designed for making investments as a ‘financial investor’ instead of a ‘strategic investor’, so banks should make financial services as the goal without exerting too much control over investees.
In summary, the share option model connecting subsidiaries designed for making investments and financial institutions specialising in serving technology start-ups is used by selected entities to bundle equity investment and lending. Referring to the accounting treatment adopted by Silicon Valley Bank, and considering the nature and characteristics of the pilot model, we will briefly analyse the accounting treatment of equity investment and lending bundling in the Chinese banking sector in accordance with applicable Chinese accounting standards.
1. Status quo of the pilot project of equity investment and lending bundling
2. Accounting treatment of equity investment and lending bundling
The substance of equity investment and lending bundling is that banks offer loans, while subsidiaries make investments. Bundling banks with subsidiaries designed for making investments enables investment income to make up for possible losses arising from high credit risks, so as to meet the financing demand of scientific and technological start-ups. From the status quo of the pilot project, investment firms mostly cushion losses arising from credit risks by holding share option instruments of scientific and technological start-ups. Loan offering and investment making, the two elements of equity investment and lending bundling, are directly related.
Banks offer loans, while subsidiaries designed for making investments hold share options
Banks offer loans, while subsidiaries designed for making investments directly make equity investments
Banks cooperate with venture capital firms to indirectly invest in scientific and technological start-ups
I
II
III
Hot topic 4: Analysis of the accounting treatment of equity investment and lending bundling in the banking sector (continued)

64© 2016 KPMG Huazhen LLP — a People‘s Republic of China partnership, KPMG Advisory (China) Limited — a wholly foreign owned enterprise in China, are member firms of the KPMG network of independent member firms affiliated with KPMG International Cooperative (“KPMG International”), a Swiss entity. All rights reserved.
III. Status quo of the pilot project of equity investment and lending bundling, and relevant accounting treatment (continued)
Accounting treatment of equity investment and lending bundling – “Banks offer loans, while subsidiaries designed for making investments hold share options”
This model is used by selected entities to test the water. Under such a model, banks grant loans to scientific and technological start-ups and determine the interest rate taking into consideration both risk premium and expected benefits brought about by future value addition for investees. Meanwhile, subsidiaries designed for making investments hold share options of scientific and technological start-ups, but the face value of the share options occupy a small proportion of the total capital of the borrower (the dilution of the borrower’s equity is insignificant), and the future proceeds of the share options can make up for potential losses arising from high credit risks. The accounting treatment is analysed as follows:
Business model
Banks offer loans, while subsidiaries designed for making investments hold share options
Initial measurement Recognition of interest income when a loan is held
Changes in fair value when a loan is held
Accounting treatment
• The borrower expects to obtain a loan at an interest rate lower than the market interest rate by attaching share options. Funds offered by a bank are shared between the loan and share options. On the grant date of the loan, the cost of the loan and share options should both initially be measured at fair value at the group level.
• The bank should use appropriate valuation techniques to determine the effective interest rate and fair value of a loan under equity investment and lending bundling, taking into account the market conditions at the time when the loan is issued, and the terms and conditions of peers and other comparable loans received by the borrower.
• Share options held by a subsidiary designed for making investments should be recognised as a financial asset measured at fair value through profit or loss. Loans and equity investments should both be included in consolidated financial statements.
Interest income when a loan is held should be calculated at the effective interest rate in accordance with the Accounting Standard for Business Enterprises No. 22 – Recognition and Measurement of Financial Instruments. The loan is generally measured at amortised cost.
• In accordance with Article 38 of the Accounting Standard for Business Enterprises No. 22 – Recognition and Measurement of Financial Instruments, gains or losses arising from changes in the fair value of financial assets or financial liabilities at fair value through profit or loss are recognised in profit or loss.
• Under the exit mechanism, banks can exercise options to acquire shares or cash. The shares acquired can be recognised as a new financial asset.
Hot topic 4: Analysis of the accounting treatment of equity investment and lending bundling in the banking sector (continued)

65© 2016 KPMG Huazhen LLP — a People‘s Republic of China partnership, KPMG Advisory (China) Limited — a wholly foreign owned enterprise in China, are member firms of the KPMG network of independent member firms affiliated with KPMG International Cooperative (“KPMG International”), a Swiss entity. All rights reserved.
III. Status quo of the pilot project of equity investment and lending bundling, and relevant accounting treatment (continued)
Accounting treatment of equity investment and lending bundling – “Banks offer loans, while subsidiaries designed for making investments directly make equity investments”
Under this model, banks provide lending services for selected scientific and technological start-ups with promising prospects of growth, and make direct equity investments through banks’ investment subsidiaries. By directly holding the equity that provides them with dividends and a claim on residual assets, banks are able to offset possible losses arising from high credit risk.
Pursuant to the Accounting Standard for Business Enterprises No. 22 – Recognition and Measurement of Financial Instruments and the Accounting Standard for Business Enterprises No. 2 – Long-term Equity Investments, investment subsidiaries should classify their direct equity investments as financial assets held for trading, available-for-sale financial assets or long-term equity investments according to their intent and purpose of holding such investments and their rights and obligations in their investees, and make initial recognition and subsequent measurement accordingly.
Accounting treatment of equity investment and lending bundling – “Banks cooperate with venture capital firms to indirectly invest in scientific and technological start-ups”
Under this model, banks partner with venture capital funds that specialise in investing in scientific and technological start-ups, and by directly investing in venture capital funds, indirectly hold the equity of such enterprises. In the meantime, banks provide loans for venture capital funds or scientific and technological start-ups. Leveraging the advantages of venture capital funds, banks are able to provide lending and financing support for promising scientific and technological start-ups to meet their capital demand, and realise a win-win outcome for all.
With regard to the above indirect investment model, banks should take into account the substance of the transactions and arrangements with venture capital funds that act as an intermediary and scientific and technological start-ups, and account for their loans and investments in accordance with the Accounting Standard for Business Enterprises No. 2 – Long-term Equity Investments.
Hot topic 4: Analysis of the accounting treatment of equity investment and lending bundling in the banking sector (continued)

66© 2016 KPMG Huazhen LLP — a People‘s Republic of China partnership, KPMG Advisory (China) Limited — a wholly foreign owned enterprise in China, are member firms of the KPMG network of independent member firms affiliated with KPMG International Cooperative (“KPMG International”), a Swiss entity. All rights reserved.
IV. The equity investment and lending bundling model of Silicon Valley Bank, and accounting treatment
Founded in 1983, Silicon Valley Bank took advantage of the rise of the high-tech industry in the Silicon Valley in the 1990s to explore the fusion of equity investment and lending aimed at reaching a balance between high returns on equity investment and credit risk, and successfully transformed itself into a technology-focused bank. It focuses its investment on four industries: high-tech, life science, venture capital and high-end wine.
As at the end of 2015, Silicon Valley Bank’s balance of total loans was USD 16.7 billion or around RMB 110 billion. Although this is not a considerable amount, Silicon Valley Bank plays a key role in the venture lending market of the US. With a mature model that integrates equity investment and lending, Silicon Valley Bank offers valuable insights into the business and accounting treatment.
It is worth noting that accounting treatment of Silicon Valley Bank is based on US GAAP, which differs from IAS and CAS. Therefore, while the accounting treatment of Silicon Valley Bank is a valuable reference, Chinese banks should tailor accounting treatment according to their applicable accounting standards and approach accounting issues on a case-by-case basis.
Silicon Valley Bank Financial Group
Silicon Valley Bank Silicon Valley Bank Capital
Provide loansMake equity investment
Investees
Business model
I. Silicon Valley Bank provides loans for enterprises while Silicon Valley Bank Capital makes direct equity investments in the enterprises
II. Silicon Valley Bank provides loans for enterprises while Silicon Valley Bank Financial Group holds equity warrants
III. Partnering with venture capital funds, Silicon Valley Bank indirectly invests in high-tech start-ups
Silicon Valley Bank and Silicon Valley Bank Capital, both of which are subsidiaries of Silicon Valley Bank Financial Group, assume separate roles of providing loans and making equity investments. They are linked with venture capital funds and investees through a variety of financial services to reduce credit risk and acquire investment returns. Silicon Valley Bank mainly adopts the three business models on the following pages to achieve an investment-lending integration.7
Hot topic 4: Analysis of the accounting treatment of equity investment and lending bundling in the banking sector (continued)

67© 2016 KPMG Huazhen LLP — a People‘s Republic of China partnership, KPMG Advisory (China) Limited — a wholly foreign owned enterprise in China, are member firms of the KPMG network of independent member firms affiliated with KPMG International Cooperative (“KPMG International”), a Swiss entity. All rights reserved.
IV. The equity investment and lending bundling model of Silicon Valley Bank, and accounting treatment (continued)
I I. Silicon Valley Bank provides loans for enterprises while Silicon Valley Bank Capital makes direct equity investments in the enterprises
Under this model, Silicon Valley Bank encourages enterprises to pledge their intellectual property rights for loans, and charges interest at a rate 2% to 3% higher than that for general established businesses to compensate credit risk. In the case of promising start-ups, Silicon Valley Bank Capital and venture capital funds will jointly make equity investments to access high yields arising from high growth or IPO-induced capital appreciation.
Accounting treatment for this model:
Silicon Valley Bank Capital’s direct equity investments in enterprises are included in the following items under ‘equity investment’:
1. Available-for-sale financial assets at fair value for publicly quoted equity
2. Non-marketable and other securities at amortised cost for non-publicly quoted equity.
II. Silicon Valley Bank provides loans for enterprises while Silicon Valley Bank Financial Group holds equity warrants8II
This model applies to tech companies at the seed stage in terms of technology and intellectual property rights. While providing them with loans at a high interest rate, Silicon Valley Bank enters into an agreement with them allowing Silicon Valley Bank Financial Group to hold a certain amount of equity warrants. Silicon Valley Bank Financial Group can exercise the warrants or exit by liquidating them in the event of an IPO or acquisition, and is thus entitled to yields from equity appreciation to compensate for possible losses from credit risk.
Accounting treatment for this model (i.e. accounting treatment for equity warrant assets):
1. Grant date
Equity warrant assets are recognised as credit expenses at fair value at the grant date and deferred as unrealised income.
2. Balance sheet date during the term of a loan
At the balance sheet date of a subsequent period, changes in the fair value of equity warrant assets are reflected in the carrying value of derivative financial instruments in the balance sheet, and recognised as gains/losses from changes in the fair value of derivative financial instruments in the income statement.
Equity warrant assets are recognised as credit expenses at fair value and included in deferred income at the grant date, and adjusted as loan interest income using the effective interest rate method or the straight-line method.
Hot topic 4: Analysis of the accounting treatment of equity investment and lending bundling in the banking sector (continued)

68© 2016 KPMG Huazhen LLP — a People‘s Republic of China partnership, KPMG Advisory (China) Limited — a wholly foreign owned enterprise in China, are member firms of the KPMG network of independent member firms affiliated with KPMG International Cooperative (“KPMG International”), a Swiss entity. All rights reserved.
IV. The equity investment and lending bundling model of Silicon Valley Bank, and accounting treatment (continued)
II II. Silicon Valley Bank provides loans for enterprises while Silicon Valley Bank Financial Group holds equity warrants (continued)
3. Vesting date and exercise date
When an investee completes its IPO or is acquired in the open market, Silicon Valley Bank Financial Group can obtain shares or cash by exercising equity warrants.
In the event of a warrant exercise, Silicon Valley Bank Financial Group derecognises derivative financial assets and recognises equity investment at the later of the vesting date and the exercise date. The shares of a listed company are classified as available-for-sale securities in the absence of selling restrictions. The shares of a private company are classified as non-marketable and other securities.
The shares of a listed company are subsequently measured as available-for-sale financial assets, whose fair value changes are recognised as other comprehensive income separately presented under owners’ equity. Non-marketable and other securities are generally measured at cost, and their fair value changes are recognised as net profit or loss from securities investment under non-interest income at the time of exit or liquidation.
III. Partnering with venture capital funds, Silicon Valley Bank indirectly invests in high-tech start-ups9III
Under this model, Silicon Valley Bank makes equity or debt investments in venture capital funds, or partners with venture capital funds to jointly build an investment fund, which is drawn by venture capital funds to make direct equity investments in start-ups. Silicon Valley Bank and venture capital funds become close business partners through the provision of loans, share high-quality client resources and promote mutual benefits.
Accounting treatment for this model:
Silicon Valley Bank Capital directly invests in venture capital funds, and thus indirectly invests in start-ups. Its investment in venture capital funds is classified as non-marketable and other securities subsequently measured using the equity method. It recognises its share of an investee’s financial performance based on its shareholding ratio and performs an impairment test at least on a quarterly basis. The loans provided by Silicon Valley Bank for venture capital funds are accounted for as ordinary loans.
Hot topic 4: Analysis of the accounting treatment of equity investment and lending bundling in the banking sector (continued)

69© 2016 KPMG Huazhen LLP — a People‘s Republic of China partnership, KPMG Advisory (China) Limited — a wholly foreign owned enterprise in China, are member firms of the KPMG network of independent member firms affiliated with KPMG International Cooperative (“KPMG International”), a Swiss entity. All rights reserved.
Summary and outlook
Loans and equity investment under the aforementioned three models should be included in the consolidated financial statements of a bank at the group level. The financial statements should fairly reflect the equity investment and lending bundling business to the extent that the relationship and interaction between loans and equity warrants are clearly demonstrated. Although a general framework for accounting treatment is provided in this publication based on China’s accounting standards, the nature of the business in question and the current situation of China’s pilot programmes, discretion is advised in practice, as treatment may vary according to transaction details and specific business characteristics that may necessitate proper adjustments.
With the expanded scope of the business and banks’ continuous explorations, new practical issues and new business models are set to surface, presenting new accounting challenges. Governed by the principle that accounting should reflect business substance, accounting treatment will change accordingly. In light of this, the development of the business will push for the progress of accounting theories.
1 ‘Guidance on Encouraging Financial Institutions in the Banking Sector to Carry out a Pilot of Equity Investment and Lending Bundling for Scientific and Technological Start-ups’ ([2016] No.14)
2 ‘Understanding the Equity Investment and Lending Bundling Model in the United States and Britain [J]’, Feng Yanming & Li Oumei, The Chinese Banker, 2016, 85-87
3 ‘Innovation and Regulation of the Equity Investment and Lending Bundling Model in the Banking Sector [J]’, Liao Min, Finance Series, 2015, 6: 125-135
4 ‘Innovation and Regulation of the Equity Investment and Lending Bundling Model in the Banking Sector [J]’, Liao Min, Finance Series, 2015, 6: 125-135
5 ‘The Equity Investment and Lending Bundling Pilot Programme: Three Banks in Shanghai Released Plans and all Adopted Equity Warrants to Mitigate Risk [J]’, Cheng Ziyan, China Economic Weekly, 2016, 58-59
References
6 ‘Pilot Banks for Equity Investment and Lending Bundling: How To Invest and Lend [J],’ Shi Lei, China Banking, 2016,16-19
7 See the section about liquidity and market risk of equity warrants, venture capital, private equity and direct equity investment on p. 22 of Silicon Valley Bank’s 2015 Annual Report
8 See the sections about Silicon Valley Bank Financial on p. 28 of Silicon Valley Bank’s 2015 Annual Report, non-marketable and other securities; the cost method on p. 99; loans on p. 100; and equity warrant assets on p. 107
9 See the section about non-marketable and other securities: the equity method on pp. 98-99 of Silicon Valley Bank’s 2015 Annual Report
Hot topic 4: Analysis of the accounting treatment of equity investment and lending bundling in the banking sector (continued)

70© 2016 KPMG Huazhen LLP — a People‘s Republic of China partnership, KPMG Advisory (China) Limited — a wholly foreign owned enterprise in China, are member firms of the KPMG network of independent member firms affiliated with KPMG International Cooperative (“KPMG International”), a Swiss entity. All rights reserved.
Academic insights: The implications of blockchain technology on commercial banks and proposed countermeasures
With the rapid development of blockchain
technology in recent years, the prospect of
its applications is drawing increasing
attention from various industries and
academia, especially with respect to its
use in innovating the business of the
financial industry, and commercial banks in
particular. Characterised by its
decentralised structure, openness and
transparency, and its rule not to allow data
to be altered retrospectively, blockchain
technology has enormous potential in the
financial industry, despite its impact on
traditional financial services businesses. In
light of this, other than providing an
introduction to its principles, current
applications and impact on and challenges
to commercial banks, this publication offers
some countermeasures for commercial
banks to adapt to an age of blockchain
technology.
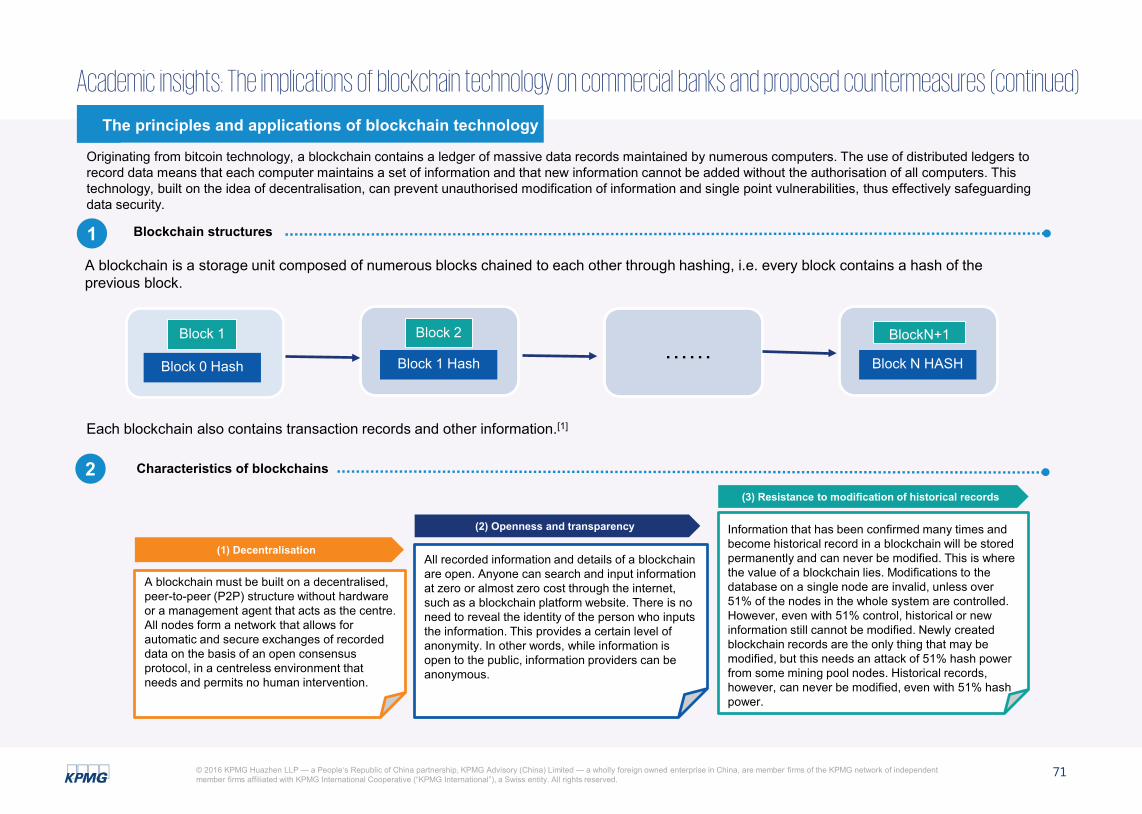
71© 2016 KPMG Huazhen LLP — a People‘s Republic of China partnership, KPMG Advisory (China) Limited — a wholly foreign owned enterprise in China, are member firms of the KPMG network of independent member firms affiliated with KPMG International Cooperative (“KPMG International”), a Swiss entity. All rights reserved.
The principles and applications of blockchain technology
Academic insights: The implications of blockchain technology on commercial banks and proposed countermeasures (continued)
Originating from bitcoin technology, a blockchain contains a ledger of massive data records maintained by numerous computers. The use of distributed ledgers to record data means that each computer maintains a set of information and that new information cannot be added without the authorisation of all computers. This technology, built on the idea of decentralisation, can prevent unauthorised modification of information and single point vulnerabilities, thus effectively safeguarding data security.
1 Blockchain structures
A blockchain is a storage unit composed of numerous blocks chained to each other through hashing, i.e. every block contains a hash of the previous block.
A blockchain must be built on a decentralised, peer-to-peer (P2P) structure without hardware or a management agent that acts as the centre. All nodes form a network that allows for automatic and secure exchanges of recorded data on the basis of an open consensus protocol, in a centreless environment that needs and permits no human intervention.
2 Characteristics of blockchains
All recorded information and details of a blockchain are open. Anyone can search and input information at zero or almost zero cost through the internet, such as a blockchain platform website. There is no need to reveal the identity of the person who inputs the information. This provides a certain level of anonymity. In other words, while information is open to the public, information providers can be anonymous.
I
Information that has been confirmed many times and become historical record in a blockchain will be stored permanently and can never be modified. This is where the value of a blockchain lies. Modifications to the database on a single node are invalid, unless over 51% of the nodes in the whole system are controlled. However, even with 51% control, historical or new information still cannot be modified. Newly created blockchain records are the only thing that may be modified, but this needs an attack of 51% hash power from some mining pool nodes. Historical records, however, can never be modified, even with 51% hash power.
(1) Decentralisation
(2) Openness and transparency
(3) Resistance to modification of historical records
Each blockchain also contains transaction records and other information.[1]
Block 0 Hash
Block 1 Block 2
Block 1 Hash……
BlockN+1
Block N HASH

72© 2016 KPMG Huazhen LLP — a People‘s Republic of China partnership, KPMG Advisory (China) Limited — a wholly foreign owned enterprise in China, are member firms of the KPMG network of independent member firms affiliated with KPMG International Cooperative (“KPMG International”), a Swiss entity. All rights reserved.
The principles and applications of blockchain technology (continued)
Academic insights: The implications of blockchain technology on commercial banks and proposed countermeasures (continued)
3 Blockchain applications
New digital currencies
Coin amounts used for certification of registered shares
Blockchain applications in real-world voting
Blockchain technology used for certification of recorded information
At present, Bitcoin, Dogecoin, Ripple and other encrypted digital currencies are the biggest applications of blockchains. However, blockchain technology is only one of the technologies to construct bitcoin and other systems. A blockchain is a recording system used to record content, which may include a financial ledger. The data in such a ledger is bitcoin.
The blockchain format can be used for the circulation of crowdfunding-based shares. Simply put, one unit of coin equals one share. Records on a centralised server are moved to blockchains for open and transparent recording.
Blockchains are open, transparent and modification-resistant. Such advantages have a role to play in voting. Blockchains can be considered for selecting the person of the year in certain fields, voting contestants to the next round in variety shows, and even for national elections. Blockchain-based voting can greatly reduce the risk of fraud, as voting processes are transparent, and all votes are accessible to everyone. This ensures that the results are just, fair and open, and allows for a certain level of privacy at the same time.
In addition to recording transactions, blockchains can also record other information, such as a note accompanying an account transfer. If such information is collected, it looks like Twitter. The blockchain-based notes can never be modified or blocked, nor can they accept timestamps. If too much information or certification is needed, hash compression, coin signatures and other technologies can provide effective certification for recorded information.

73© 2016 KPMG Huazhen LLP — a People‘s Republic of China partnership, KPMG Advisory (China) Limited — a wholly foreign owned enterprise in China, are member firms of the KPMG network of independent member firms affiliated with KPMG International Cooperative (“KPMG International”), a Swiss entity. All rights reserved.
Commercial banks’ current blockchain applications and their implications
Academic insights: The implications of blockchain technology on commercial banks and proposed countermeasures (continued)
(1) Blockchain solutions to banks’ existing business problems
Real-time fund transfer is one of the important applications of blockchains. To gain a better understanding of the benefits of blockchains, we will take traditional cross-border fund transfers as an example to illustrate how commercial banks’ business is carried out at each stage.
The following problems are present in a traditional cross-border fund transfer:
Complex, high cost, time-consuming and error-prone remittance procedures Difficulty in conducting thorough and accurate identity checks Banks need to reserve funds in their current accounts, which may reduce
liquidity and incur opportunity costs Varied data sources and collection methods make it difficult for banks to
submit reports to regulators.
Blockchain technology can effectively solve the above problems:
Transfers are not made through bank remittance; real-time transfers are enabled with lower cost
Leveraging digitalised personal information on distributed ledgers to verify the identity of a remitter
No need to reserve funds in banks’ current accounts; regulators can monitor transactions on a real-time basis and receive anti-money laundering warnings.
Theoretically, blockchain technology can allow the two parties involved in a transaction to carry out economic activities in the absence of a trusted third-party intermediary. This can simplify banks’ business, but on the other hand, it will put an end to many lucrative businesses of commercial banks, such as the Letter of Credit (L/C) business.
Banks conduct identity and anti-money laundering checks upon request of a remittance.
Banks retain the funds and charge applicable fees after confirmation of a remittance request.
Banks remit funds through the SWIFT network.
The payee goes to the bank after receiving a notice.
The payee collects the remittance after identity verification.
Banks submit transaction reports to regulators in due time

74© 2016 KPMG Huazhen LLP — a People‘s Republic of China partnership, KPMG Advisory (China) Limited — a wholly foreign owned enterprise in China, are member firms of the KPMG network of independent member firms affiliated with KPMG International Cooperative (“KPMG International”), a Swiss entity. All rights reserved.
Commercial banks’ current blockchain applications and their implications (continued)
Academic insights: The implications of blockchain technology on commercial banks and proposed countermeasures (continued)
(2) Implications for regulation of the banking sector
Blockchains can be used to monitor asset conditions in the financial industry and
potential financial risk to prevent, among others, front-running in stock transactions and
cross-border money-laundering crimes. As China’s financial system may lack effective
and mature regulation, offenders can take advantage of legal and institutional loopholes
to carry out illegal acts that harm China’s national interest. By leveraging blockchain
technology to access more financial information, the Chinese Government can combat
criminal activities more effectively to maintain fairness and stability in the financial
market.
As the blockchain format allows no modification to each transaction and consequently
guarantees data authenticity, blockchain technology can greatly facilitate the regulation
of commercial banks. In addition, the convenience brought by blockchain technology can
push up the utilisation rate of financial assets, accelerate capital flows and increase
money multipliers, ultimately promoting economic growth. The resultant higher
measurability of capital flows can help central banks analyse monetary structures to
develop appropriate monetary policies.
However, strong decentralisation that lies at the core of a blockchain poses a great
challenge to centralised regulators’ efforts to execute administrative interventions.
Overcoming such a challenge requires regulators to be more adaptive to the
development of new technology and change their regulatory methodology accordingly.
(3) Newest development of blockchain technology in the banking sector and its significance
December 2015: David Rutter founded R3 Alliance, a blockchain-based transaction platform sponsored by 42 global financial institutions. This marks the beginning of cooperation among financial institutions of various countries in jointly using a blockchain platform, and is a sign that more participating countries and a wider service scope are to be expected.
June 2016: The Canadian central bank launched CAD-Coin, the digital form of Canadian dollars. Leveraging blockchain technology, participants put pledged cash into a special pool to be converted into CAD-Coin by the central bank.
August 2016: UBS, Deutsche Bank, Santander and BNY Mellon jointly developed a new digital currency, hoping to use blockchain technology for transaction settlements and set a universal standard across the global banking sector. New technology can help central banks issue, transfer or dispose of assets. Tempted by the prospect of blockchain technology, banks assume the role of technology companies in developing new technologies on their own. The idea of blockchains is the result of cooperation among various countries and institutions, running counter to the traditional mindset of competition to bring about a win-win outcome for all.
September 2016: Barclays completed the world’s first trade transaction settled by blockchain technology.Traditional trade settlements are prone to the risk of trade documentation loss and fraud, and may need one month to process. Blockchain technology, however, can eliminate such risk and reduce processing time.
September 2016: Visa invited banks to perform payment tests on a blockchain-based system that aimed to reduce transfer cost, speed up settlement and reduce credit risk involved in transfers.

75© 2016 KPMG Huazhen LLP — a People‘s Republic of China partnership, KPMG Advisory (China) Limited — a wholly foreign owned enterprise in China, are member firms of the KPMG network of independent member firms affiliated with KPMG International Cooperative (“KPMG International”), a Swiss entity. All rights reserved.
Challenges posed by blockchain technology to commercial banks
Academic insights: The implications of blockchain technology on commercial banks and proposed countermeasures (continued)
The benefits of blockchains have been recognised by Western countries and large financial institutions. But how practical are they in China? Will the Chinese Government allow this new technology to flourish in an immature financial system? We strive to investigate the challenges facing China’s commercial banks from various perspectives.
The digital currency of RMB Cross-border transactions Cyber attacks and system stability
(1) Security
CAD-Coin, the digital form of Canadian dollars, was issued directly to the public by the Canadian central bank. However, in China, banknotes issued by China’s central bank are first transferred to the reserve of a commercial bank, through which the bank provides the public with deposit and withdrawal services.
If China were to follow Canada’s practice of directly issuing the digital currency to the public, the central bank may engage in head-on competition with commercial banks, undermining the stability of the banking system.
Therefore, China’s central bank may adopt the current banknote issuance model to issue the digital currency. This can prevent the impact on commercial banks and, more importantly, motivate commercial banks to facilitate the circulation of the statutory digital currency.
In recent years, China’s central bank has been committed to increasing transparency pertaining to the RMB exchange rate against a basket of currencies, making it more responsive to market supply and demand. The long-term goal of the central bank is to make the RMB an international currency and have a greater say in the global financial system.
Thanks to the Chinese Government’s concern over capital outflows, free circulation of RMB may not be achieved on a short-term basis. However, if China leads Western countries in adopting blockchaintechnology in, for instance, RMB transactions, it will increase RMB circulation, propelling the RMB to take the place of the USD as an international safe-haven currency.
In June 2016, due to significant flaws in smart contracts, assets worth over 3 million ether were stolen, worth more than $50 million, following an attack on the DAO, the largest blockchain-based crowdfunding project. The incident sent shock waves across the tech world, as it was living proof of technical loopholes under immature blockchain technology, undermining blockchain technology’s widely advocated merit of security. Even mature blockchain technology cannot escape the fate of being controlled in the event of powerful group acts.
Currently, blockchain-based systems can only process several transactions per second. This capacity is dwarfed by thousands of transactions per second for a traditional financial institution. If blockchain technology were to be adopted in stock trade and fund transfers, current systems may easily become overloaded. This demonstrates tremendous room for improvement in terms of technology and supporting facilities.
In addition, the threat from a 51% hash power attack still exists.
Illegal fund transfers Spread of risk
(2) Regulation
Ever since April 2015 when public security authorities launched a special campaign to combat illegal private banks, nearly RMB 1.2 trillion was found to be involved in illegal transactions. Illegal private banks were used to transfer illicit money and for money laundering, which dealt a blow to foreign exchange management and the capital market.
Blockchain technology, when mature, can help track fund sources and fight against money laundering activities. However, before such maturity is reached, the technology may be used illegally to transfer funds to overseas countries. China contributed over 90% of the global turnover of blockchain-based bitcoin. Such a large share is possibly powered by the need for outbound transfers of domestic funds, as it is difficult to trace capital flows given that bitcoin technology is not yet fully fledged.
The convenience brought by digital currencies to convert deposits to cash may deteriorate the liquidity of financial institutions in the event of a crisis, posing a threat to the stability of the financial system.
On the other hand, blockchaintechnology accelerates algorithmic trading, but erroneous algorithmic trade may have ripple effects, leading to a small financial crisis that saw Dow Jones Indices fall 1,000 points in 2010.

76© 2016 KPMG Huazhen LLP — a People‘s Republic of China partnership, KPMG Advisory (China) Limited — a wholly foreign owned enterprise in China, are member firms of the KPMG network of independent member firms affiliated with KPMG International Cooperative (“KPMG International”), a Swiss entity. All rights reserved.
Challenges posed by blockchain technology to commercial banks (continued)
Academic insights: The implications of blockchain technology on commercial banks and proposed countermeasures (continued)
Profit erosion
As the payment business is a major source of income for commercial banks, they exercise great care when it comes to blockchains and distributed ledgers. Continuous interest rate cuts by China’s central bank have narrowed banks’ interest rate spread, resulting in operating difficulties. Therefore, the idea of decentralisation, with the potential of replacing banks, may not be easily accepted by banks.
Lowered industry thresholds
Although still a new technology, blockchain technology may bring disruptive changes to the traditional approach to the creation of credit. Records on its distributed ledgers cannot be modified, which can provide financial institutions with reliable and detailed information.
Traditional commercial banks that live and thrive on information asymmetry may lose their hard-earned competitive advantage under the rise of blockchain technology. The technology may also bring the added benefits of significantly reducing the operating costs of financial institutions and providing more precise financial services when combined with internet finance and big data analytics. When technologically advanced internet companies make their formidable forays into the financial industry, traditional banks may have no choice but to painstakingly seek transformation under fierce competition.
(3) Competitive pressure
Countermeasures for commercial banks under the rise of blockchain technology
As an emerging technology, blockchain technology is believed to have promising applications in the financial industry. However, it is still too early to tell how it will be received in the financial market. Under the sweeping effects of continued technological innovation, commercial banks should prepare themselves to adapt to and even thrive on an upcoming age of blockchain-based finance.
Ever since its founding, R3 Alliance has been committed to developing blockchain technology and applying it in the financial industry, as well as formulating industry standards and protocols. Commercial banks in China, however, fall behind such international efforts in terms of technological innovation of and research on blockchain technology and digital currencies. Currently, China’s commercial banks cannot engage in digital currency transactions, thanks to cautious measures to prevent risk associated with digital currencies. This situation appears to be at odds with the enthusiasm of the public for blockchain development and research.
At present, as large global financial institutions join hands in their innovation endeavours, blockchain technology, P2P and other emerging decentralised models are being transformed from simple ideas to practical application. Banks in China should stay informed about the newest innovation activities of their international counterparts, make early efforts to study and develop blockchain products and adjust their development strategies in a timely manner to adapt to the business model of internet finance in a new age.
To achieve this goal, they can set up R&D laboratories or work with fintechcompanies. In addition to developing a variety of blockchain application scenarios, they can innovate the fusion of blockchain technology and inclusive finance to serve China’s specific needs. For instance, efforts can be made on studying how to leverage blockchain technology to achieve low-cost transfers and payments in China’s underdeveloped regions to provide them with more accessible and better financial services.
In addition, they should actively participate in the formulation of international standards and protocols to seek more say in the matter and avoid simply becoming a passive follower. China’s Ping An Bank reportedly joined the R3 Alliance in 2015.[2]
(1) Commercial banks should be technically prepared for globally accepted technical standards for blockchain technology to be developed in the future

77© 2016 KPMG Huazhen LLP — a People‘s Republic of China partnership, KPMG Advisory (China) Limited — a wholly foreign owned enterprise in China, are member firms of the KPMG network of independent member firms affiliated with KPMG International Cooperative (“KPMG International”), a Swiss entity. All rights reserved.
Countermeasures for commercial banks under the rise of blockchain technology (continued)
Academic insights: The implications of blockchain technology on commercial banks and proposed countermeasures (continued)
ZCash, a digital currency that promises total anonymity, was officially launched on 4 November 2016. Originating from the Zerocoin project, it was initially designed to provide encryption for bitcoin but then evolved to become an independent cryptocurrency.
ZCash bears great resemblance to bitcoin as both of them are digital currencies. Like bitcoin, it is traded based on distributed ledgers (blockchains). However, what distinguishes it from bitcoin is that it is totally anonymous.
ZCash relies on zero-knowledge proofs from a technology called zero-knowledge Succinct Non-interactive Argument of Knowledge (zk-SNARK) to verify the authenticity of a transaction. It uses a public blockchain to display transactions, but hides the amounts of transactions. The owner holding an access key, i.e. the owner of ZCash, can grant access to others to view information locked by the key.
Simply put, the algorithm allows users to provide proof that they have in their possession digital currencies without disclosing any unnecessary information. It works in the same way that zero-knowledge proof verifies a password typed into a website through a server without having to truly transmit it and disclose it.
Although bitcoin and other digital currencies are known for their ability to conceal transactions, it is quite common to access information about the sender and transaction location of bitcoin by tracking transactions recorded on the blockchains of bitcoin. Unlike bitcoin, which makes transaction data available to the public, ZCashapplies encryption to the source data of a transaction. Therefore, with its advantage of total anonymity that places unremitting insistence on the protection of privacy, ZCashis poised to have enormous value in the financial industry.
Theoretically, encrypted blockchains based on zero-knowledge proofs can improve blockchain technology flawed by complete and uncontrollable exposure of transaction records, and help commercial banks ensure the security and authenticity of transactions while protecting their business secrets and allowing privacy management. [3]
References1. ‘Bitcoin: A Peer-to-peer Electronic Cash System [OL]’, Satoshi Nakamoto, www.bitcoin.org, 2008
2. ‘The Prospect of Applying Blockchain Technology in Commercial Banks [N]’, Song Xiangyan, Financial Times, 2015-12-21(12)
3. ‘Zcash, a Digital Currency with Total Anonymity and its Benefits’, [OL], Wen Xiaohua, www.leiphone.com, 2016
Author: Zhou Guangyou, School of Economics, Fudan University
(2) ZCash, an emerging new technology, can encrypt transaction source data in a blockchain

4 Appendix: 2016 Q3 financial data of listed banks

79© 2016 KPMG Huazhen LLP — a People‘s Republic of China partnership, KPMG Advisory (China) Limited — a wholly foreign owned enterprise in China, are member firms of the KPMG network of independent member firms affiliated with KPMG International Cooperative (“KPMG International”), a Swiss entity. All rights reserved.
RMB million Jan-Sep 2016 Jan-Sep 2015 Growth rate Jan-Jun 2016 Jan-Jun 2015 Growth rate
ICBC 222,792 221,761 0.46% 150,217 149,021 0.80%
CCB 193,835 191,557 1.19% 133,410 131,895 1.15%
BOC 134,813 131,545 2.48% 93,037 90,746 2.52%
ABC 154,170 153,210 0.63% 105,148 104,315 0.80%
BCM 52,578 52,040 1.03% 37,661 37,324 0.90%
CMB 52,142 48,500 7.51% 35,231 32,976 6.84%
CNCB 34,543 32,926 4.91% 23,600 22,586 4.49%
CMBC 39,163 38,377 2.05% 27,223 26,778 1.66%
SPDB 40,682 37,162 9.47% 26,770 23,903 11.99%
CIB 43,982 41,221 6.70% 29,441 27,744 6.12%
CEB 24,437 23,875 2.35% 16,439 16,241 1.22%
HXB 14,617 13,912 5.07% 9,826 9,263 6.08%
PAB 18,719 17,740 5.52% 12,292 11,585 6.10%
BOB 14,955 14,136 5.79% 10,621 10,036 5.83%
BON 6,352 5,178 22.67% 4,362 3,568 22.25%
NBCB 6,343 5,321 19.22% 4,139 3,552 16.53%
WRCB 698 639 9.22% N/A N/A N/A
BOJS 8,280 7,351 12.64% 5,610 4,918 14.07%
CRCB 775 729 6.25% N/A N/A N/A
GYB 2,698 2,451 10.08% N/A N/A N/A
JRCB 510 546 -6.51% N/A N/A N/A
CQRCB 6,255 5,740 8.96% N/A N/A N/A
CQCB 2,960 2,675 10.68% N/A N/A N/A
Total 1,076,299 1,048,592 2.64% 725,027 706,451 2.63%
Appendix – Net profit attributable to equity holders of the parent company
Source: The banks’ 2015 Q3 & 2016 Q3 reports; KPMG China research

80© 2016 KPMG Huazhen LLP — a People‘s Republic of China partnership, KPMG Advisory (China) Limited — a wholly foreign owned enterprise in China, are member firms of the KPMG network of independent member firms affiliated with KPMG International Cooperative (“KPMG International”), a Swiss entity. All rights reserved.
Return on weighted average equity(ROE)
Basic earnings per share (EPS) Net asset value per share (in RMB)
Jan-Sep 2016 Jan-Sep 2015 Jan-Sep 2016 Jan-Sep 2015 30 September 2016 31 December 2015
ICBC 16.53% 18.60% 0.63 0.62 5.21 4.80
CCB 17.16% 19.45% 0.78 0.77 6.21 5.78
BOC 13.66% 15.02% 0.44 0.43 4.38 4.09
ABC 17.10% 19.41% 0.47 0.47 3.79 3.48
BCM 12.84% 14.15% 0.70 0.70 7.49 7.00
CMB 18.36% 19.50% 2.07 1.92 15.72 14.31
CNCB 13.91% 15.89% 0.71 0.70 6.99 6.49
CMBC 16.58% 19.29% 1.07 1.10 8.95 8.26
SPDB 12.86% 14.37% 1.87 1.81 15.26 13.90
CIB 14.11% 15.75% 2.25 2.16 16.70 15.10
CEB 14.67% 16.83% 0.50 0.51 4.67 4.36
HXB 11.82% 12.90% 1.37 1.30 12.01 11.01
PAB 14.45% 16.06% 1.09 1.27 10.38 9.41
BOB 12.70% 13.88% 0.98 0.93 8.12 7.34
BON 12.83% 14.77% 1.05 0.85 8.54 7.78
NBCB 14.79% 14.65% 1.63 1.36 11.65 10.30
WRCB 9.23% 9.66% 0.42 0.38 4.72 4.33
BOJS 15.57% 16.52% 0.78 0.71 6.98 6.27
CRCB 9.16% 9.83% 0.39 0.36 4.39 4.04
GYB 17.24% 20.84% 1.46 1.36 8.93 7.76
JRCB 6.75% 8.36% 0.32 0.35 4.86 4.64
CQRCB 16.29% 16.99% 0.67 0.62 5.52 5.03
CQCB 17.61% 21.04% 0.95 0.99 7.55 6.81
Average 14.18% 15.82% 0.98 0.94 8.22 7.49
Source: The banks’ 2015 Q3 & 2016 Q3 reports; KPMG China research
Appendix – Financial performance indicator

81© 2016 KPMG Huazhen LLP — a People‘s Republic of China partnership, KPMG Advisory (China) Limited — a wholly foreign owned enterprise in China, are member firms of the KPMG network of independent member firms affiliated with KPMG International Cooperative (“KPMG International”), a Swiss entity. All rights reserved.
Jan-Sep 2016 Jan-Sep 2015 Jan-Jun 2016 Jan-Jun 2015
ICBC 1.64% 2.50% 2.21% 2.53%
CCB 2.26% 2.64% 2.32% 2.67%
BOC 1.85% 2.14% 1.90% 2.18%
ABC 2.30% 2.78% 2.31% 2.78%
BCM 1.91% 2.24% 1.97% 2.27%
CMB 2.56% 2.75% 2.58% 2.78%
CNCB 2.01% 2.33% 2.12% 2.32%
CMBC 2.36% 2.29% 2.01% 2.35%
SPDB 2.86% 3.26% 2.14% 2.42%
CIB 3.29% 3.43% 2.18% 2.44%
CEB 2.33% 2.72% 1.88% 2.27%
HXB 2.47% 2.75% 2.48% 2.63%
PAB 2.73% 2.73% N/A N/A
BOB 2.10% 2.31% N/A N/A
BON 2.29% 2.61% 2.44% 2.65%
NBCB 2.00% 2.39% 2.04% 2.39%
WRCB 2.06% N/A N/A N/A
BOJS 2.07% N/A N/A N/A
CRCB 3.72% N/A N/A N/A
GYB 3.33% N/A N/A N/A
JRCB 2.43% N/A N/A N/A
CQRCB 3.18% 3.20% N/A N/A
CQCB 2.97% 2.56% N/A N/A
Average 2.47% 2.65% 2.22% 2.49%
Source: The banks’ 2015 Q3 & 2016 Q3 reports; KPMG China research
Appendix – Net interest margin

82© 2016 KPMG Huazhen LLP — a People‘s Republic of China partnership, KPMG Advisory (China) Limited — a wholly foreign owned enterprise in China, are member firms of the KPMG network of independent member firms affiliated with KPMG International Cooperative (“KPMG International”), a Swiss entity. All rights reserved.
Net interest income Net fee and commission income Investment income Other operating income Operating income
RMB million
Jan-Sep 2016
Jan-Sep 2015
Growth rate
Jan-Sep 2016
Jan-Sep 2015
Growth rate
Jan-Sep 2016
Jan-Sep 2015
Growth rate
Jan-Sep 2016
Jan-Sep 2015
Growth rate
Jan-Sep 2016
Jan-Sep 2015
Growth rate
ICBC 351,358 379,945 -8% 113,748 111,183 2% 6,565 7,570 -13% 46,103 25,930 78% 517,774 524,628 -1%CCB 315,802 340,808 -7% 92,314 88,686 4% 13,912 4,712 195% 50,544 23,185 118% 472,572 457,391 3%BOC 229,805 246,280 -7% 68,486 71,484 -4% 39,974 6,212 543% 30,805 32,797 -6% 369,070 356,773 3%ABC 298,121 328,740 -9% 73,141 66,612 10% 4,193 118 3,453% 10,699 11,806 -9% 386,154 407,276 -5%BCM 100,764 107,975 -7% 28,898 27,428 5% 2,428 61 3,880% 15,211 10,949 39% 147,301 146,413 1%CMB 100,722 101,787 -1% 49,236 44,552 11% 9,755 6,744 45% 578 3,141 -82% 160,291 156,224 3%
CNCB 79,524 76,746 4% 30,973 26,068 19% 3,799 2,885 32% 1,040 1,754 -41% 115,336 107,453 7%CMBC 70,889 70,489 1% 39,943 37,952 5% 6,764 4,818 40% -1,215 2,911 -142% 116,381 116,170 0%SPDB 81,850 82,529 -1% 31,140 21,222 47% 4,202 498 744% 3,736 4,383 -15% 120,928 108,632 11%CIB 84,547 88,008 -4% 26,104 23,479 11% 10,259 2,103 388% -2,252 -1,236 82% 118,658 112,354 6%CEB 48,832 49,658 -2% 21,225 20,261 5% 136 177 -23% 561 -49 -1245% 70,754 70,047 1%HXB 36,550 35,058 4% 10,770 8,220 31% 147 -241 -161% 128 135 -5% 47,595 43,172 10%PAB 54,563 48,206 13% 24,174 20,223 20% 2,466 3,081 -20% 765 -358 -314% 81,968 71,152 15%BOB 27,662 26,132 6% 8,082 5,775 40% 451 617 -27% 101 450 -78% 36,296 32,974 10%BON 16,649 13,714 21% 3,155 2,627 20% 1,008 628 61% 249 -364 -168% 21,061 16,605 27%
NBCB 12,903 11,636 11% 4,690 2,906 61% 420 -145 -390% -73 -273 -73% 17,940 14,124 27%WRCB 1,711 1,614 6% 135 129 5% 47 28 68% 10 15 -33% 1,903 1,786 7%BOJS 18,995 18,168 5% 4,647 2,877 62% 50 74 -32% 95 -76 -225% 23,787 21,043 13%CRCB 2,919 2,241 30% 207 50 314% 108 78 38% 15 23 -35% 3,249 2,392 36%GYB 5,936 5,040 18% 789 424 86% 339 120 183% - 21 -100% 7,064 5,605 26%JRCB 1,639 1,697 -3% 44 42 5% 148 97 53% 16 29 -45% 1,847 1,865 -1%
CQRCB 14,540 14,919 -3% 1,625 1,111 46% 111 4 2,675% -97 117 -183% 16,179 16,151 0%CQCB 5,846 5,176 13% 1,432 1,122 28% 7 -10 -170% 10 110 -91% 7,295 6,398 14%Total 1,962,127 2,056,566 -5% 634,958 584,433 9% 107,289 40,229 167% 157,029 115,400 36% 2,861,403 2,796,628 2%
RMB million Net interest income Net fee and commission income Investment income Other operating income Total operating income
Jan-Sep 2016 1,962,127 634,958 107,289 157,029 2,861,403
Jan-Sep 2015 2,056,566 584,433 40,229 115,400 2,796,628
Source: The banks’ 2015 Q3 & 2016 Q3 reports; KPMG China research
Appendix – Operating income

83© 2016 KPMG Huazhen LLP — a People‘s Republic of China partnership, KPMG Advisory (China) Limited — a wholly foreign owned enterprise in China, are member firms of the KPMG network of independent member firms affiliated with KPMG International Cooperative (“KPMG International”), a Swiss entity. All rights reserved.
Net interest income % Net fee and commission income % Investment income % Other operating income %2016 2015 2016 2015 2016 2015 2016 2015
Jan-Sep Jan-Sep Jan-Sep Jan-Sep Jan-Sep Jan-Sep Jan-Sep Jan-Sep
ICBC 67.86% 72.42% 21.97% 21.19% 1.27% 1.44% 8.90% 4.95%
CCB 66.83% 74.51% 19.53% 19.39% 2.94% 1.03% 10.70% 5.07%
BOC 62.27% 69.03% 18.56% 20.04% 10.83% 1.74% 8.34% 9.19%
ABC 77.20% 80.72% 18.94% 16.36% 1.09% 0.03% 2.77% 2.89%
BCM 68.41% 73.75% 19.62% 18.73% 1.65% 0.04% 10.32% 7.48%
CMB 62.84% 65.15% 30.72% 28.52% 6.09% 4.32% 0.35% 2.01%
CNCB 68.95% 71.42% 26.85% 24.26% 3.29% 2.68% 0.91% 1.64%
CMBC 60.91% 60.68% 34.32% 32.67% 5.81% 4.15% -1.04% 2.50%
SPDB 67.68% 75.97% 25.75% 19.54% 3.47% 0.46% 3.10% 4.03%
CIB 71.25% 78.33% 22.00% 20.90% 8.65% 1.87% -1.90% -1.10%
CEB 69.02% 70.89% 30.00% 28.92% 0.19% 0.25% 0.79% -0.06%
HXB 76.79% 81.21% 22.63% 19.04% 0.31% -0.56% 0.27% 0.31%
PAB 66.57% 67.75% 29.49% 28.42% 3.01% 4.33% 0.93% -0.50%
BOB 76.21% 79.25% 22.27% 17.51% 1.24% 1.87% 0.28% 1.37%
BON 79.05% 82.59% 14.98% 15.82% 4.79% 3.78% 1.18% -2.19%
NBCB 71.93% 82.38% 26.14% 20.57% 2.34% -1.03% -0.41% -1.92%
WRCB 89.88% 90.37% 7.09% 7.22% 2.44% 1.59% 0.59% 0.82%
BOJS 79.86% 86.34% 19.53% 13.67% 0.21% 0.35% 0.40% -0.36%
CRCB 89.84% 93.70% 6.36% 2.08% 3.34% 3.26% 0.46% 0.96%
GYB 84.04% 89.91% 11.17% 7.56% 4.79% 2.15% 0.00% 0.38%
JRCB 88.74% 90.99% 2.39% 2.25% 8.03% 5.21% 0.84% 1.55%
CQRCB 89.87% 92.38% 10.05% 6.88% 0.68% 0.03% -0.60% 0.71%
CQCB 80.14% 80.89% 19.64% 17.54% 0.10% -0.16% 0.12% 1.73%Average 74.61% 78.72% 20.00% 17.79% 3.33% 1.69% 2.06% 1.80%
Source: The banks’ 2015 Q3 & 2016 Q3 reports; KPMG China research
Appendix – Operating income structure

84© 2016 KPMG Huazhen LLP — a People‘s Republic of China partnership, KPMG Advisory (China) Limited — a wholly foreign owned enterprise in China, are member firms of the KPMG network of independent member firms affiliated with KPMG International Cooperative (“KPMG International”), a Swiss entity. All rights reserved.
RMB million Jan-Sep 2016 Jan-Sep 2015 Growth rate
ICBC 229,224 235,754 -2.77%
CCB 227,699 214,519 6.14%
BOC 187,801 178,761 5.06%
ABC 196,547 211,461 -7.05%
BCM 80,447 79,281 1.47%
CMB 93,774 92,637 1.23%
CNCB 69,872 63,722 9.65%
CMBC 66,395 65,565 1.27%
SPDB 67,416 60,271 11.85%
CIB 65,586 60,230 8.89%
CEB 38,642 38,436 0.54%
HXB 28,096 24,585 14.28%
PAB 25,808 27,912 -7.54%
BOB 17,694 15,127 16.97%
BON 12,720 9,962 27.69%
NBCB 10,342 7,496 37.98%
WRCB 1,014 926 9.49%
BOJS 13,320 11,630 14.54%
CRCB 2,223 1,442 54.08%
GYB 3,959 2,612 51.59%
JRCB 1,291 1,250 3.31%
CQRCB 6,154 6,421 -4.16%
CQCB 1,743 2,112 -17.48%
Total 1,447,767 1,412,112 2.52%
Source: The banks’ 2015 Q3 & 2016 Q3 reports; KPMG China research
Appendix – Operating expenses

85© 2016 KPMG Huazhen LLP — a People‘s Republic of China partnership, KPMG Advisory (China) Limited — a wholly foreign owned enterprise in China, are member firms of the KPMG network of independent member firms affiliated with KPMG International Cooperative (“KPMG International”), a Swiss entity. All rights reserved.
Jan-Sep 2016 Jan-Sep 2015 Growth rate
ICBC 22.64% 23.03% -1.69%
CCB 24.12% 24.04% 0.33%
BOC 26.49% 26.57% -0.30%
ABC 30.92% 30.40% 1.71%
BCM 29.89% 28.57% 4.62%
CMB 25.22% 25.09% 0.52%
CNCB 26.40% 25.86% 2.09%
CMBC 26.70% 27.85% -4.13%
SPDB 21.38% 20.35% 5.06%
CIB 20.49% 20.67% -0.87%
CEB 27.84% 26.44% 5.30%
HXB 34.80% 35.47% -1.89%
PAB 27.70% 32.14% -13.81%
BOB 23.84% 23.05% 3.43%
BON 21.45% 23.83% -9.99%
NBCB 32.82% 30.39% 8.00%
WRCB 30.95% 32.31% -4.21%
BOJS 26.29% 29.37% -10.49%
CRCB 34.40% 34.97% -1.63%
GYB 23.86% 26.05% -8.41%
JRCB 33.37% N/A N/A
CQRCB 34.41% 32.95% 4.43%
CQCB 20.62% 26.59% -22.45%
Average 27.24% 27.55% -2.11%
Source: The banks’ 2015 Q3 & 2016 Q3 reports; KPMG China research
Appendix – Cost-to-income ratios

86© 2016 KPMG Huazhen LLP — a People‘s Republic of China partnership, KPMG Advisory (China) Limited — a wholly foreign owned enterprise in China, are member firms of the KPMG network of independent member firms affiliated with KPMG International Cooperative (“KPMG International”), a Swiss entity. All rights reserved.
RMB million Jan-Sep 2016 Jan-Sep 2015 Growth rate
ICBC 117,223 120,815 -2.97%
CCB 102,694 105,784 -2.92%
BOC 97,778 94,777 3.17%
ABC 119,392 123,794 -3.56%
BCM 43,541 41,209 5.66%
CMB 40,419 39,204 3.10%
CNCB 30,450 27,787 9.58%
CMBC 31,074 32,352 -3.95%
SPDB 25,851 22,109 16.93%
CIB 24,072 22,846 5.37%
CEB 19,699 18,519 6.37%
HXB 16,562 15,313 8.16%
PAB 22,708 22,866 -0.69%
BOB 8,654 7,602 13.84%
BON 4,517 3,957 14.15%
NBCB 5,888 4,292 37.19%
WRCB 588 550 6.91%
BOJS 6,255 5,931 5.46%
CRCB 1,118 808 38.37%
GYB 1,685 1,460 15.41%
JRCB 616 554 11.19%
Total 720,784 712,529 1.16%
The data of CQRCB and CQCB had not been disclosed.
Source: The banks’ 2015 Q3 & 2016 Q3 reports; KPMG China research
Appendix – General and administrative expenses

87© 2016 KPMG Huazhen LLP — a People‘s Republic of China partnership, KPMG Advisory (China) Limited — a wholly foreign owned enterprise in China, are member firms of the KPMG network of independent member firms affiliated with KPMG International Cooperative (“KPMG International”), a Swiss entity. All rights reserved.
RMB million Jan-Sep 2016 Jan-Sep 2015 Growth rate
ICBC 63,906 61,569 3.80%
CCB 63,704 64,123 -0.65%
BOC 63,966 44,893 42.49%
ABC 60,535 57,365 5.53%
BCM 21,598 20,878 3.45%
CMB 47,640 43,952 8.39%
CNCB 35,396 28,465 24.35%
CMBC 30,665 24,844 23.43%
SPDB 37,485 30,950 21.11%
CIB 35,979 27,576 30.47%
CEB 16,113 14,550 10.74%
HXB 9,802 6,061 61.72%
PAB 31,615 19,935 58.59%
BOB 7,879 5,372 46.67%
BON 7,253 4,679 55.01%
NBCB 3,958 2,414 63.96%
WRCB 371 267 38.95%
BOJS 6,140 4,228 45.22%
CRCB 1,032 517 99.61%
GYB 2,039 715 185.17%
JRCB 630 597 5.53%
CQRCB 1,652 2,054 -19.57%
CQCB 1,621 621 161.03%
Total 550,979 466,626 18.08%
Source: The banks’ 2015 Q3 & 2016 Q3 reports; KPMG China research
Appendix – Impairment losses

88© 2016 KPMG Huazhen LLP — a People‘s Republic of China partnership, KPMG Advisory (China) Limited — a wholly foreign owned enterprise in China, are member firms of the KPMG network of independent member firms affiliated with KPMG International Cooperative (“KPMG International”), a Swiss entity. All rights reserved.
RMB million
Cash and balances with central bank
Loans and advances to customers Investments Interbank assets Other assets Total assets
2016 2015 2016 2015 2016 2015 2016 2015 2016 2015 2016 201530 Sep 31 Dec 30 Sep 31 Dec 30 Sep 31 Dec 30 Sep 31 Dec 30 Sep 31 Dec 30 Sep 31 Dec
ICBC 3,302,564 3,059,633 12,629,838 11,652,812 5,469,130 5,009,963 1,278,745 1,680,126 966,195 807,246 23,646,472 22,209,780
CCB 2,725,492 2,401,544 11,248,007 10,234,523 5,109,136 4,271,406 750,071 974,472 667,977 467,544 20,500,683 18,349,489
BOC 2,329,505 2,269,434 9,648,243 8,935,195 3,930,760 3,595,095 1,160,148 1,007,855 788,847 1,008,018 17,857,503 16,815,597
ABC 2,862,087 2,587,057 9,220,381 8,506,675 5,202,322 4,512,047 1,208,129 1,673,984 571,182 511,630 19,064,101 17,791,393
BCM 957,192 920,228 3,931,176 3,634,568 2,147,297 1,661,100 704,370 611,191 351,775 328,275 8,091,810 7,155,362
CMB 561,201 584,342 3,062,607 2,739,444 1,391,315 1,427,841 397,852 593,396 151,015 129,955 5,563,990 5,474,978
CNCB 529,776 511,189 2,772,772 2,468,283 1,825,617 1,692,127 255,179 338,140 158,191 112,553 5,541,535 5,122,292
CMBC 455,086 432,831 2,389,447 1,997,625 2,046,069 913,562 423,679 901,302 322,296 275,368 5,636,577 4,520,688
SPDB 464,525 481,157 2,481,542 2,171,413 2,113,603 1,883,327 333,502 359,412 171,110 149,043 5,564,282 5,044,352
CIB 419,173 417,911 1,888,745 1,724,822 3,037,338 2,597,027 261,587 324,607 210,061 234,513 5,816,904 5,298,880
CEB 357,017 326,735 1,711,472 1,475,424 1,271,443 903,871 366,579 371,717 129,856 89,963 3,836,367 3,167,710
HXB 262,536 264,094 1,171,201 1,041,937 556,820 357,075 245,536 325,763 37,630 31,735 2,273,723 2,020,604
PAB 303,936 291,715 1,393,854 1,186,872 708,621 594,803 210,905 302,973 173,922 130,786 2,791,238 2,507,149
BOB 167,076 153,182 852,875 747,917 538,422 419,104 448,590 493,628 35,880 31,078 2,042,843 1,844,909
BON 94,445 78,780 305,595 242,227 527,720 424,149 74,351 40,559 21,106 19,305 1,023,217 805,020
NBCB 79,253 66,189 283,309 248,399 430,841 360,200 27,518 26,562 16,769 15,114 837,690 716,464
WRCB 15,632 15,026 58,748 54,024 36,247 30,510 5,850 13,295 2,835 2,636 119,312 115,491
BOJS 131,468 121,097 618,715 546,389 664,003 461,939 100,425 135,929 48,357 24,978 1,562,968 1,290,332
CRCB 12,442 12,219 61,726 55,803 41,324 33,371 6,795 4,259 3,228 2,852 125,515 108,504
GYB 36,628 29,491 95,259 80,214 165,280 112,672 16,539 10,339 13,613 5,481 327,319 238,197
JRCB 10,730 13,410 49,199 48,020 39,018 25,708 1,970 1,221 2,336 2,120 103,253 90,479
CQRCB 87,134 78,500 288,048 257,541 244,628 213,384 162,394 153,314 13,637 14,066 795,841 716,805
CQCB 39,942 38,201 143,118 121,816 103,684 108,108 61,088 45,857 6,920 5,825 354,752 319,807
Total 16,204,840 15,153,965 66,305,877 60,171,943 37,600,638 31,608,389 8,501,802 10,389,901 4,864,738 4,400,084 133,477,895 121,724,282
Source: The banks’ 2015 Q3 & 2016 Q3 reports; KPMG China research
Appendix – Total assets

89© 2016 KPMG Huazhen LLP — a People‘s Republic of China partnership, KPMG Advisory (China) Limited — a wholly foreign owned enterprise in China, are member firms of the KPMG network of independent member firms affiliated with KPMG International Cooperative (“KPMG International”), a Swiss entity. All rights reserved.
Cash and balances with central bank %
Loans and advances to customers % Investment % Interbank assets % Other assets %
2016 2015 2016 2015 2016 2015 2016 2015 2016 201530 Sep 31 Dec 30 Sep 31 Dec 30 Sep 31 Dec 30 Sep 31 Dec 30 Sep 31 Dec
ICBC 13.97% 13.78% 53.41% 52.47% 23.13% 22.56% 5.41% 7.56% 4.08% 3.63%
CCB 13.29% 13.09% 54.87% 55.77% 24.92% 23.28% 3.66% 5.31% 3.26% 2.55%
BOC 13.04% 13.50% 54.03% 53.14% 22.01% 21.38% 6.50% 5.99% 4.42% 5.99%
ABC 15.01% 14.54% 48.37% 47.81% 27.29% 25.36% 6.34% 9.41% 2.99% 2.88%
BCM 11.83% 12.86% 48.58% 50.80% 26.54% 23.21% 8.70% 8.54% 4.35% 4.59%
CMB 10.09% 10.67% 55.04% 50.04% 25.01% 26.08% 7.15% 10.84% 2.71% 2.37%
CNCB 9.56% 9.98% 50.05% 48.19% 32.94% 33.03% 4.60% 6.60% 2.85% 2.20%
CMBC 8.07% 9.57% 42.39% 44.19% 36.30% 20.21% 7.52% 19.94% 5.72% 6.09%
SPDB 8.35% 9.54% 44.60% 43.05% 37.99% 37.34% 5.99% 7.12% 3.07% 2.95%
CIB 7.21% 7.89% 32.47% 32.55% 52.21% 49.01% 4.50% 6.12% 3.61% 4.43%
CEB 9.31% 10.31% 44.61% 46.58% 33.14% 28.54% 9.56% 11.73% 3.38% 2.84%
HXB 11.55% 13.07% 51.51% 51.57% 24.49% 17.67% 10.80% 16.12% 1.65% 1.57%
PAB 10.89% 11.64% 49.94% 47.34% 25.39% 23.72% 7.55% 12.08% 6.23% 5.22%
BOB 8.18% 8.30% 41.75% 40.54% 26.36% 22.72% 21.96% 26.76% 1.75% 1.68%
BON 9.23% 9.78% 29.87% 30.09% 51.57% 52.69% 7.27% 5.04% 2.06% 2.40%
NBCB 9.46% 9.24% 33.82% 34.67% 51.43% 50.27% 3.29% 3.71% 2.00% 2.11%
WRCB 13.10% 13.01% 49.24% 46.78% 30.38% 26.42% 4.90% 11.51% 2.38% 2.28%
BOJS 8.41% 9.38% 39.59% 42.35% 42.48% 35.80% 6.43% 10.53% 3.09% 1.94%
CRCB 9.91% 11.26% 49.18% 51.43% 32.93% 30.76% 5.41% 3.92% 2.57% 2.63%
GYB 11.19% 12.38% 29.11% 33.68% 50.49% 47.30% 5.05% 4.34% 4.16% 2.30%
JRCB 10.39% 14.82% 47.65% 53.08% 37.79% 28.41% 1.91% 1.35% 2.26% 2.34%
CQRCB 10.95% 10.95% 36.19% 35.93% 30.74% 29.77% 20.41% 21.39% 1.71% 1.96%
CQCB 11.26% 11.95% 40.34% 38.09% 29.23% 33.80% 17.22% 14.34% 1.95% 1.82%Average 10.62% 11.37% 44.64% 44.79% 33.69% 30.84% 7.92% 10.01% 3.14% 2.99%
Source: The banks’ 2015 Q3 & 2016 Q3 reports; KPMG China research
Appendix – Total asset structure

90© 2016 KPMG Huazhen LLP — a People‘s Republic of China partnership, KPMG Advisory (China) Limited — a wholly foreign owned enterprise in China, are member firms of the KPMG network of independent member firms affiliated with KPMG International Cooperative (“KPMG International”), a Swiss entity. All rights reserved.
RMB million 30 September 2016 31 December 2015 Growth rate
ICBC 12,914,203 11,933,466 8.22%
CCB 11,515,397 10,485,140 9.83%
BOC 9,875,808 9,135,860 8.10%
ABC 9,617,343 8,909,918 7.94%
BCM 4,023,430 3,722,006 8.10%
CMB 3,173,088 2,824,286 12.35%
CNCB 2,838,800 2,528,780 12.26%
CMBC 2,448,871 2,048,048 19.57%
SPDB 2,570,186 2,245,518 14.46%
CIB 1,964,223 1,779,408 10.39%
CEB 1,752,246 1,513,543 15.77%
HXB 1,203,982 1,069,172 12.61%
PAB 1,430,514 1,216,138 17.63%
BOB 884,900 775,390 14.12%
BON 318,375 251,198 26.74%
NBCB 293,134 255,689 14.64%
WRCB 60,369 55,505 8.76%
BOJS 635,334 561,783 13.09%
CRCB 63,855 57,611 10.84%
GYB 98,705 83,174 18.67%
JRCB 51,348 49,857 2.99%
CQRCB 299,677 268,586 11.58%
CQCB 147,119 124,769 17.91%
Total 68,180,907 61,894,845 10.16%
Source: The banks’ 2015 Q3 & 2016 Q3 reports; KPMG China research
Appendix – Scale of loan

91© 2016 KPMG Huazhen LLP — a People‘s Republic of China partnership, KPMG Advisory (China) Limited — a wholly foreign owned enterprise in China, are member firms of the KPMG network of independent member firms affiliated with KPMG International Cooperative (“KPMG International”), a Swiss entity. All rights reserved.
NPL ratio Allowance to NPL Allowance to total loans ratio
30 September 2016 31 December 2015 30 September 2016 31 December 2015 30 September 2016 31 December 2015
ICBC 1.62% 1.50% 136.14% 156.34% 2.21% 2.35%
CCB 1.56% 1.58% 148.78% 150.99% 2.32% 2.39%
BOC 1.48% 1.43% 155.83% 153.30% 2.31% 2.19%
ABC 2.39% 2.39% 172.73% 189.43% 4.13% 4.53%
BCM 1.53% 1.51% 150.31% 155.57% 2.30% 2.35%
CMB 1.87% 1.68% 186.39% 178.95% 3.49% 3.01%
CNCB 1.50% 1.43% 154.94% 167.81% 2.32% 2.40%
CMBC 1.57% 1.60% 154.40% 153.63% 2.42% 2.46%
SPDB 1.72% 1.56% 200.14% 211.40% 3.44% 3.30%
CIB 1.71% 1.46% 224.68% 210.08% 3.84% 3.07%
CEB 1.51% 1.61% 154.06% 156.39% 2.33% 2.52%
HXB 1.60% 1.52% 169.96% 167.12% 2.72% 2.54%
PAB 1.56% 1.45% 164.39% 165.86% 2.56% 2.40%
BOB 1.20% 1.12% 275.20% 278.39% 3.30% 3.12%
BON 0.87% 0.83% 459.75% 430.95% 4.00% 3.58%
NBCB 0.91% 0.92% 368.75% 308.67% 3.36% 2.84%
WRCB 1.29% 1.17% 208.18% 227.92% 2.69% 2.67%
BOJS 1.43% 1.43% 182.86% 192.06% 2.61% 2.75%
CRCB 1.41% 1.43% 236.49% 219.18% 3.33% 3.13%
GYB 1.48% 1.48% 236.12% 239.98% 3.49% 3.55%
JRCB 2.42% 2.17% 172.84% 169.72% 4.18% 3.68%
CQRCB 0.96% 0.98% 405.09% 420.03% 3.89% 4.12%
CQCB 0.97% 0.97% 281.28% 243.98% 2.73% 2.37%
Average 1.50% 1.44% 217.36% 215.12% 3.04% 2.93%
Source: The banks’ 2015 Q3 & 2016 Q3 reports; KPMG China research
Appendix – Loan quality

92© 2016 KPMG Huazhen LLP — a People‘s Republic of China partnership, KPMG Advisory (China) Limited — a wholly foreign owned enterprise in China, are member firms of the KPMG network of independent member firms affiliated with KPMG International Cooperative (“KPMG International”), a Swiss entity. All rights reserved.
RMBmillion
Deposits from customers Liabilities from banks and other financial institutions
Debt certificates issued Other liabilities Total
2016 2015 2016 2015 2016 2015 2016 2015 2016 201530 Sep 31 Dec 30 Sep 31 Dec 30 Sep 31 Dec 30 Sep 31 Dec 30 Sep 31 Dec
ICBC 17,754,418 16,281,939 2,324,083 2,603,051 338,651 306,622 1,275,325 1,217,649 21,692,477 20,409,261
CCB 15,277,178 13,668,533 2,062,816 2,029,119 445,601 415,544 1,143,640 791,210 18,929,235 16,904,406
BOC 12,974,479 11,729,171 1,770,712 2,212,264 352,440 282,929 1,294,971 1,233,628 16,392,602 15,457,992
ABC 14,997,769 13,538,360 1,313,738 1,626,464 404,067 382,742 1,035,502 1,031,942 17,751,076 16,579,508
BCM 4,728,274 4,484,814 1,679,280 1,505,919 188,713 170,106 876,665 456,431 7,472,932 6,617,270
CMB 3,615,989 3,571,698 975,333 1,075,984 306,636 251,507 268,598 214,031 5,166,556 5,113,220
CNCB 3,392,444 3,182,775 1,138,313 1,188,960 470,981 289,135 192,369 141,736 5,194,107 4,802,606
CMBC 2,998,848 2,732,262 1,438,088 1,039,904 415,607 181,233 448,329 257,506 5,300,872 4,210,905
SPDB 2,993,443 2,954,149 1,335,555 1,261,742 666,311 399,906 204,367 109,955 5,199,676 4,725,752
CIB 2,514,084 2,483,923 1,883,564 1,917,401 840,980 414,834 230,265 165,345 5,468,893 4,981,503
CEB 2,131,891 1,993,843 866,266 660,244 425,563 210,061 164,006 79,515 3,587,726 2,943,663
HXB 1,371,454 1,351,663 404,224 414,832 232,970 66,893 115,993 68,828 2,124,641 1,902,216
PAB 1,912,878 1,733,921 259,682 334,249 325,419 212,963 95,031 64,516 2,593,010 2,345,649
BOB 1,139,250 1,022,300 448,381 474,786 252,718 174,639 59,572 56,370 1,899,921 1,728,095
BON 646,785 504,197 123,747 132,077 149,451 86,887 41,179 29,445 961,161 752,606
NBCB 488,773 355,686 141,626 135,331 120,487 144,057 36,439 36,294 787,324 671,367
WRCB 94,628 87,213 6,185 11,993 5,309 4,287 4,365 4,679 110,487 108,173
BOJS 914,419 776,428 391,546 366,659 127,300 51,649 48,719 30,062 1,481,984 1,224,799
CRCB 87,103 82,291 17,984 11,343 6,653 2,988 3,417 3,454 115,156 100,077
GYB 255,667 180,987 8,291 10,702 36,857 28,079 5,133 4,295 305,948 224,063
JRCB 73,122 67,653 14,727 11,691 3,682 - 2,853 3,620 94,384 82,964
CQRCB 530,158 470,228 132,003 144,757 52,340 34,847 28,401 18,686 742,901 668,517
CQCB 225,390 199,299 61,629 73,236 39,036 18,491 5,078 7,490 331,133 298,515
Total 91,118,444 83,453,333 18,797,773 19,242,708 6,207,772 4,130,399 7,580,217 6,026,687 123,704,202
112,853,127
Source: The banks’ 2015 Q3 & 2016 Q3 reports; KPMG China research
Appendix – Liability

93© 2016 KPMG Huazhen LLP — a People‘s Republic of China partnership, KPMG Advisory (China) Limited — a wholly foreign owned enterprise in China, are member firms of the KPMG network of independent member firms affiliated with KPMG International Cooperative (“KPMG International”), a Swiss entity. All rights reserved.
Deposits from customers % Liabilities from banks and other financial institutions %
Debt certificates issued % Other liabilities %
2016 2015 2016 2015 2016 2015 2016 201530 Sep 31 Dec 30 Sep 31 Dec 30 Sep 31 Dec 30 Sep 31 Dec
ICBC 81.85% 79.78% 10.71% 12.75% 1.56% 1.50% 5.88% 5.97%
CCB 80.71% 80.86% 10.90% 12.00% 2.35% 2.46% 6.04% 4.68%
BOC 79.15% 75.88% 10.80% 14.31% 2.15% 1.83% 7.90% 7.98%
ABC 84.49% 81.66% 7.40% 9.81% 2.28% 2.31% 5.83% 6.22%
BCM 63.27% 67.77% 22.47% 22.76% 2.53% 2.57% 11.73% 6.90%
CMB 69.99% 69.85% 18.88% 21.04% 5.94% 4.92% 5.20% 4.19%
CNCB 65.31% 66.27% 21.92% 24.76% 9.07% 6.02% 3.70% 2.95%
CMBC 56.57% 64.89% 27.13% 24.70% 7.84% 4.29% 8.46% 6.12%
SPDB 57.57% 62.51% 25.69% 26.70% 12.81% 8.46% 3.93% 2.33%
CIB 45.97% 49.86% 34.44% 38.49% 15.38% 8.33% 4.21% 3.32%
CEB 59.42% 67.73% 24.15% 22.43% 11.86% 7.14% 4.57% 2.70%
HXB 64.54% 71.06% 19.03% 21.81% 10.97% 3.51% 5.46% 3.62%
PAB 73.78% 73.92% 10.01% 14.25% 12.55% 9.08% 3.66% 2.75%
BOB 59.96% 59.16% 23.60% 27.47% 13.30% 10.11% 3.14% 3.26%
BON 67.29% 66.99% 12.87% 17.55% 15.56% 11.55% 4.28% 3.91%
NBCB 62.08% 52.98% 17.99% 20.16% 15.30% 21.45% 4.63% 5.41%
WRCB 85.64% 80.62% 5.60% 11.09% 4.81% 3.96% 3.95% 4.33%
BOJS 61.70% 63.39% 26.42% 29.94% 8.59% 4.22% 3.29% 2.45%
CRCB 75.63% 82.23% 15.62% 11.33% 5.78% 2.99% 2.97% 3.45%
GYB 83.56% 80.78% 2.71% 4.78% 12.05% 12.52% 1.68% 1.92%
JRCB 77.48% 81.55% 15.60% 14.09% 3.90% 0.00% 3.02% 4.36%
CQRCB 71.36% 70.34% 17.77% 21.65% 7.05% 5.21% 3.82% 2.80%
CQCB 68.07% 66.77% 18.61% 24.53% 11.79% 6.19% 1.53% 2.51%Average 69.36% 70.30% 17.41% 19.50% 8.50% 6.11% 4.73% 4.09%
Source: The banks’ 2015 Q3 & 2016 Q3 reports; KPMG China research
Appendix – Total liability structure

94© 2016 KPMG Huazhen LLP — a People‘s Republic of China partnership, KPMG Advisory (China) Limited — a wholly foreign owned enterprise in China, are member firms of the KPMG network of independent member firms affiliated with KPMG International Cooperative (“KPMG International”), a Swiss entity. All rights reserved.
RMBmillion
Financial assets at fair
value through profit or
loss
Available-for-sale financial
assets
Held-to-maturity
investment
Investment classified as
receivables Total
2016 2015 2016 2015 2016 2015 2016 2015 2016 201530 Sep 31 Dec 30 Sep 31 Dec 30 Sep 31 Dec 30 Sep 31 Dec 30 Sep 31 Dec
ICBC 492,992 343,272 1,712,001 1,444,195 2,937,066 2,870,353 327,071 352,143 5,469,130 5,009,963
CCB 369,906 271,173 1,734,867 1,066,752 2,434,381 2,563,980 569,982 369,501 5,109,136 4,271,406
BOC 133,588 119,062 1,550,270 1,078,533 1,814,401 1,790,790 432,501 606,710 3,930,760 3,595,095
ABC 453,036 439,261 1,338,168 1,214,542 2,806,081 2,300,824 605,037 557,420 5,202,322 4,512,047
BCM 185,227 138,999 304,323 264,739 1,305,974 933,683 351,773 323,679 2,147,297 1,661,100
CMB 60,141 59,081 344,407 299,559 466,028 353,137 520,739 716,064 1,391,315 1,427,841
CNCB 63,563 26,220 499,814 373,770 185,051 179,930 1,077,189 1,112,207 1,825,617 1,692,127
CMBC 43,504 26,959 267,756 157,000 655,932 278,364 1,078,877 451,239 2,046,069 913,562
SPDB 170,053 63,746 285,622 254,846 328,269 239,703 1,329,659 1,325,032 2,113,603 1,883,327
CIB 410,895 128,685 400,336 426,634 246,991 206,802 1,979,116 1,834,906 3,037,338 2,597,027
CEB 12,132 5,637 412,430 222,495 188,985 152,312 657,896 523,427 1,271,443 903,871
HXB 5,258 11,872 90,975 73,200 255,257 194,543 205,330 77,460 556,820 357,075
PAB 15,984 19,757 1,502 1,245 282,862 266,166 408,273 307,635 708,621 594,803
BOB 22,290 16,522 149,346 127,941 183,112 147,562 183,674 127,079 538,422 419,104
BON 36,008 19,552 109,519 110,546 112,488 85,577 269,705 208,474 527,720 424,149
NBCB 10,726 7,040 293,769 249,258 36,883 32,672 89,463 71,231 430,841 360,201
WRCB 2,220 1,088 19,057 8,843 9,939 16,957 5,031 3,622 36,247 30,510
BOJS 5,689 715 343,837 205,824 124,584 116,134 189,893 139,267 664,003 461,939
CRCB 1,728 1,239 17,429 13,570 11,176 10,893 10,991 7,669 41,324 33,371
GYB 2,373 1,073 66,638 48,976 50,969 37,108 45,300 25,514 165,280 112,672
JRCB 1,451 1,311 24,975 12,780 11,292 10,417 1,300 1,200 39,018 25,708
CQRCB 4,670 4,156 44,258 12,502 66,971 63,650 128,729 133,076 244,628 213,384
CQCB 738 2,313 22,223 18,971 18,228 13,817 62,496 73,008 103,684 108,108 Total 2,504,172 1,708,733 10,033,522 7,686,721 14,532,920 12,865,374 10,530,025 9,347,563 37,600,638 31,608,390
Source: The banks’ 2015 Q3 & 2016 Q3 reports; KPMG China research
Appendix – Investment structure

95© 2016 KPMG Huazhen LLP — a People‘s Republic of China partnership, KPMG Advisory (China) Limited — a wholly foreign owned enterprise in China, are member firms of the KPMG network of independent member firms affiliated with KPMG International Cooperative (“KPMG International”), a Swiss entity. All rights reserved.
30 September 2016 31 December 2015
ICBC 72.74% 71.40%
CCB 75.38% 69.80%
BOC 76.12% 77.89%
ABC 64.13% 65.81%
BCM 85.09% 74.08%
CMB 87.75% 73.93%
CNCB 83.68% 79.45%
CMBC 81.66% 71.00%
SPDB 85.86% 76.01%
CIB 78.13% 67.62%
CEB 82.19% 73.59%
HXB 80.50% 75.29%
PAB 74.78% 69.01%
BOB 77.67% 75.85%
BON 49.22% 49.82%
NBCB 54.04% 63.73%
WRCB 63.80% 63.64%
BOJS 69.48% 72.35%
CRCB 73.31% 70.01%
GYB 38.61% 45.96%
JRCB 70.06% 73.51%
CQRCB 56.53% 57.12%
CQCB 65.27% 62.60%
Average 71.57% 68.67%
Source: The banks’ 2015 Q3 & 2016 Q3 reports; KPMG China research
Appendix – Loan-to-deposit ratio

96© 2016 KPMG Huazhen LLP — a People‘s Republic of China partnership, KPMG Advisory (China) Limited — a wholly foreign owned enterprise in China, are member firms of the KPMG network of independent member firms affiliated with KPMG International Cooperative (“KPMG International”), a Swiss entity. All rights reserved.
Capital adequacy ratio Tier 1 capital adequacy ratio
30 September 2016 31 December 2015 30 September 2016 31 December 2015
ICBC 14.18% 15.22% 13.13% 13.48%
CCB 15.36% 15.39% 13.54% 13.32%
BOC 14.12% 14.06% 12.21% 12.07%
ABC 13.21% 13.40% 11.03% 10.96%
BCM 14.17% 13.49% 12.30% 11.46%
CMB 14.16% 12.57% 12.44% 10.83%
CNCB 11.47% 11.87% 9.15% 9.17%
CMBC 11.72% 11.49% 9.09% 9.19%
SPDB 12.24% 12.29% 9.63% 9.45%
CIB 12.54% 11.19% 9.59% 9.19%
CEB 11.24% 11.87% 9.73% 10.15%
HXB 11.76% 10.85% 9.92% 8.89%
PAB 11.97% 10.94% 9.67% 9.03%
BON 14.21% 13.11% 10.14% 10.35%
NBCB 12.51% 13.29% 9.67% 10.12%
WRCB 13.31% 13.59% 10.79% 10.69%
BOJS 11.57% 11.54% 9.05% 8.60%
CRCB 13.69% 12.51% 11.36% 11.33%
GYB 14.52% 13.54% 12.12% 10.68%
JRCB 14.18% 13.99% 13.01% 12.87%
CQRCB 12.04% 11.99% 9.92% 9.89%
CQCB 12.85% 11.63% 10.79% 10.49%
Average 13.05% 12.72% 10.83% 10.56%
The data of BOB is not disclosed.Source: The banks’ 2015 Q3 & 2016 Q3 reports; KPMG China research
Appendix – Capital adequacy ratio and tier 1 capital adequacy ratio

97© 2016 KPMG Huazhen LLP — a People‘s Republic of China partnership, KPMG Advisory (China) Limited — a wholly foreign owned enterprise in China, are member firms of the KPMG network of independent member firms affiliated with KPMG International Cooperative (“KPMG International”), a Swiss entity. All rights reserved.
Liquidity coverage ratio Leverage ratio
30 September 2016 31 December 2015 30 September 2016 31 December 2015
ICBC 133.14% 149.51% 7.57% 7.48%
CCB 117.08% 132.91% 7.12% 7.28%
BOC 117.54% 119.33% 7.08% 7.03%
ABC 137.80% 127.50% 6.43% 6.33%
BCM 116.43% 115.60% 6.95% 6.70%
CMB 96.51% 113.61% 5.99% 5.54%
CNCB 89.64% 87.78% 4.86% 5.00%
CMBC N/A 88.21% 5.14% 5.60%
SPDB 77.14% 78.31% 5.56% 5.31%
CIB N/A 90.35% N/A 5.23%
CEB N/A 84.78% 5.65% 5.95%
HXB 82.26% 75.54% 5.59% 4.86%
PAB 96.36% 140.82% 5.63% 4.94%
BOB 82.72% 90.11% 5.89% 5.33%
BON N/A 118.88% N/A 5.59%
NBCB 112.78% 100.34% 5.27% 5.40%
WRCB N/A N/A N/A N/A
BOJS 110.06% N/A N/A N/A
CRCB N/A N/A N/A N/A
GYB N/A N/A N/A N/A
JRCB N/A N/A 7.97% 7.73%
CQRCB 141.25% 90.04% 6.32% 6.40%
CQCB N/A N/A N/A N/A
Source: The banks’ 2015 Q3 & 2016 Q3 reports; KPMG China research
Appendix – Liquidity coverage ratio and leverage ratio

98© 2016 KPMG Huazhen LLP — a People‘s Republic of China partnership, KPMG Advisory (China) Limited — a wholly foreign owned enterprise in China, are member firms of the KPMG network of independent member firms affiliated with KPMG International Cooperative (“KPMG International”), a Swiss entity. All rights reserved.
HXB – Hua Xia Bank Co.,Ltd
PAB – PingAn Bank Co., Ltd
BOB – Bank of Beijing Co., Ltd
BON – Bank of Nanjing Co., Ltd
NBCB – Bank of Ningbo Co., Ltd
WRCB-Wuxi Rural Commercial Bank
BOJS-Bank of Jiangsu
CRCB-Changshu Rural Commercial Bank
GYB-Bank of Guiyang Co., Ltd
JRCB-Jiangyin Rural Commercial Bank
CQRCB-Chongqing Rural Commercial Bank
CQCB-Bank of Chongqing Co., Ltd
NOTE: As at 30 September 2016, there were 21 A-share listed banks. They are ICBC, CCB, COC, ABC, BCM, CMB, CNCB, CMBC, SPDB, CIB, CEB, HXB, PAB, BOB, BON, NBCB, WRCB, BOJ, JCRCB, BOG and JJRCB. Among them, ICBC, CCB, COC, ABC, BCM, CMBC, CNCB, CEB and CMB are listed on both the SSE and SEHK. PAB, NBCB and JJRCB are listed on the Shenzhen Stock Exchange. The rest are listed on the SSE.
As at 30 September 2016, there were 11 H-share listed banks. They are Postal Savings Bank of China, China Zheshang Bank, Bank of Jinzhou, Huishang Bank, ShengjingBank, CRCB, Bank of Tianjin, BOCQ, Bank of Qingdao, Bank of Zhengzhou and Harbin Bank. So far, only BOCQ and CRCB have disclosed Q3 reports.
General terms MOF – Ministry of Finance
CBRC – China Banking Regulatory
Commission
CSRC – China Securities Regulatory
Commission
SAFE – State Administration of Foreign
Exchange
SSE – Shanghai Stock Exchange
SEHK – The Stock Exchange of Hong Kong
SHIBOR – Shanghai Interbank Offered Rate
NIM – Net interest margin
Bank names PBOC – People’s Bank of China
ICBC – Industrial and Commercial Bank of China
CCB – China Construction Bank
BOC – Bank of China
ABC – Agricultural Bank of China
BCM – Bank of Communications
CMB – China Merchants Bank
CNCB – China CITIC Bank
CMBC – China Minsheng Bank
SPDB – Shanghai Pudong Development Bank
CIB – Industrial Bank
CEB – China Everbright Bank
Glossary of abbreviated terms

KPMG China operates in 16 cities across China, with around 10,000 partners and staff in Beijing, Beijing Zhongguancun, Chengdu, Chongqing,Foshan, Fuzhou, Guangzhou, Hangzhou, Nanjing, Qingdao, Shanghai, Shenyang, Shenzhen, Tianjin, Xiamen, Hong Kong SAR and MacauSAR.
Our dedicated Financial Services team brings together partners from the Audit, Tax and Advisory practices, and is closely linked to othermember firms in the KPMG network.
For more information, contact one of the Financial Services partners listed below.
Simon GleavePartner, Regional Head,Financial Services :+86 (10) 8508 7007 : [email protected]
Thomas ChanPartner, Financial Services :+86 (10) 8508 7014 : [email protected]
Christine SongPartner, Financial Services :+86 (10) 8508 7015 : [email protected]
Raymond LiPartner, Financial Services :+86 (10) 8508 7114 : [email protected]
Edwina LiPartner, Head of Financial Services Assurance :+ 86 (21) 2212 3806 : [email protected]
Kenny ShiPartner, Financial Services :+86 (21) 2212 2261 : [email protected]
Larry ChoiPartner, Financial Services :+86 (20) 3813 8883 : [email protected]
Arthur WangPartner, China Head of Banking :+86 (10) 8508 7104 : [email protected]
Christopher AbbissPartner, Tax :+852 2826 7226 : [email protected]
Tracy ZhangPartner, Tax :+86 (10) 8508 7509 : [email protected]
Ivan LiPartner, Financial Services :+86 (755) 2547 1218 : [email protected]
Egidio ZarrellaPartner, Head of Clients &Innovation :+852 2847 5197 : [email protected]
Terence Fong Partner, Financial Services :+852 2978 8953 : [email protected]
Walkman LeePartner, Financial Services :+86 (10) 8508 7043 : [email protected]
James ChenPartner, Financial Services :+86 (21) 2212 2424 : [email protected]
Derrick DayPartner, DPP Accounting :+86 (10) 8508 5008 : [email protected]
Kevin LiuPartner, IT Advisory :+86 (10) 8508 7094 : [email protected]
Louis NgPartner, Transaction Services :+86 (10) 8508 7090 : [email protected]
Simon ToppingPartner, Regulatory Advisory :+852 2826 7283 : [email protected]
Wilson PangPartner, Head of China, PortfolioSolutions Group :+86 (21) 2212 3280 : [email protected]
Thomas LiPartner, Tax :+86 (10) 8508 7574 : [email protected]
Tony CheungPartner, Head of Advisory,KPMG China Eastern & Western Region :+86 (21) 2212 2705 : [email protected]
Contact us

Mainland China
kpmg.com/cn
Chengdu17th Floor, Office Tower 1, IFSNo. 1, Section 3 Hongxing RoadChengdu, 610021, ChinaTel : +86 (28) 8673 3888Fax : +86 (28) 8673 3838
Beijing8th Floor, KPMG Tower, Oriental Plaza1 East Chang An AvenueBeijing 100738, ChinaTel : +86 (10) 8508 5000Fax : +86 (10) 8518 5111
ChongqingUnit 1507, 15th Floor Metropolitan Tower68 Zourong Road,Chongqing 400010, ChinaTel : +86 (23) 6383 6318Fax : +86 (23) 6383 6313
Foshan8th Floor, One AIA Financial Center1 East Denghu RoadFoshan 528200, ChinaTel : +86 (757) 8163 0163Fax : +86 (757) 8163 0168
Fuzhou25th Floor, Fujian BOC Building136 Wu Si RoadFuzhou 350003, ChinaTel : +86 (591) 8833 1000Fax : +86 (591) 8833 1188
Guangzhou38th Floor, Teem Tower208 Tianhe RoadGuangzhou 510620, ChinaTel : +86 (20) 3813 8000Fax : +86 (20) 3813 7000
Hangzhou8th Floor, West Tower, Julong Building9 Hangda RoadHangzhou 310007, ChinaTel : +86 (571) 2803 8000Fax : +86 (571) 2803 8111
Nanjing46th Floor, Zhujiang No. 1 Plaza1 Zhujiang RoadNanjing 210008, ChinaTel : +86 (25) 8691 2888Fax : +86 (25) 8691 2828
Qingdao4th Floor, Inter Royal Building15 Donghai West RoadQingdao 266071, ChinaTel : +86 (532) 8907 1688Fax : +86 (532) 8907 1689
Shanghai50th Floor, Plaza 661266 Nanjing West RoadShanghai 200040, ChinaTel : +86 (21) 2212 2888Fax : +86 (21) 6288 1889
Shenyang27th Floor, Tower E, Fortune Plaza59 Beizhan RoadShenyang 110013, ChinaTel : +86 (24) 3128 3888Fax : +86 (24) 3128 3899
Shenzhen9th Floor, China Resources Building5001 Shennan East Road Shenzhen 518001, ChinaTel : +86 (755) 2547 1000Fax : +86 (755) 8266 8930
TianjinUnit 15, 47th Floor, Office TowerTianjin World Financial Center2 Dagu North RoadTianjin 300020, ChinaTel : +86 (22) 2329 6238Fax : +86 (22) 2329 6233
Xiamen12th Floor, International Plaza8 Lujiang RoadXiamen 361001, ChinaTel : +86 (592) 2150 888Fax : +86 (592) 2150 999
Beijing ZhongguancunRoom 603, Flat B, China Electronic Plaza No.3 Danling Street, Haidian DistrictBeijing 100080, ChinaTel : +86 (10) 5875 2555Fax : +86 (10) 5875 2558
Hong Kong SAR and Macau SAR
Hong Kong8th Floor, Prince's Building 10 Chater RoadCentral, Hong KongTel : +852 2522 6022Fax : +852 2845 2588
23rd Floor, Hysan Place500 Hennessy RoadCauseway Bay, Hong Kong
Macau24th Floor, B&C, Bank of China Building Avenida DoutorMario SoaresMacauTel : +853 2878 1092Fax : +853 2878 1096

101© 2016 KPMG Huazhen LLP — a People‘s Republic of China partnership, KPMG Advisory (China) Limited — a wholly foreign owned enterprise in China, are member firms of the KPMG network of independent member firms affiliated with KPMG International Cooperative (“KPMG International”), a Swiss entity. All rights reserved.
The information contained herein is of a general nature and is not intended to address the circumstances of any particular individual or entity. Although we endeavor to provide accurate and timely information, there can be no guarantee that such information is accurate as of the date it is received or that it will continue to be accurate in the future. No one should act upon such information without appropriate professional advice after a thorough examination of the particular situation.
© 2016 KPMG Huazhen LLP — a People‘s Republic of China partnership, KPMG Advisory (China) Limited — a wholly foreign owned enterprise in China, are member firms of the KPMG network of independent member firms affiliated with KPMG International Cooperative (“KPMG International”), a Swiss entity. All rights reserved. Printed in China.
The KPMG name and logo are registered trademarks or trademarks of KPMG International.


![WELCOME FROM MIKE LABONTE, IBIS OPEN FORUM183 [Model Data] Matrix Subparameter Terminology Correction 184.2 Model_name and Signal_name Restriction for POWER and GND Pins 185.2 Section](https://static.documents.pub/doc/80x56/5e8e3d08513c427c5a629dec/welcome-from-mike-labonte-ibis-open-forum-183-model-data-matrix-subparameter.jpg)


