Brussels Institute of Contemporary China Studies - Vrije Universiteit Brussel 1 Brussels Institute of Contemporary China Studies China’s Policy in the Renewable Sector Duncan Freeman December 2014
Transcript
Brussels Institute of Contemporary China Studies - Vrije Universiteit Brussel 1
Brussels Institute of Contemporary China Studies
China’s Policy in the Renewable Sector
Duncan Freeman
December 2014
Brussels Institute of Contemporary China Studies - Vrije Universiteit Brussel 2
China and Global Industry
0%
10%
20%
30%
40%
50%
60%
70%
80%
90%
100% 2000
2001
2002
2003
2004
2005
2006
2007
2008
2009
2010
2011
2012
Share of Annual Installed Solar PV Capacity
Others
India
Australia
France
Japan
United States
Italy
China
Germany
Chinese companies leading producers in both solar PV and wind power equipment. But solar PV market in China has been insignificant until recently (2013 China became largest solar PV market – 30% of net installations, Japan 18%, US 13%, Germany 9%).
Source: Earth Policy Institute
0%
10%
20%
30%
40%
50%
60%
70%
80%
90%
100%
2000 2002 2004 2006 2008 2010 2012
Annual Solar Photovoltaics Produc9on by Country (Megawa?s)
Others
United States
South Korea
Germany
Malaysia
Japan
Taiwan
China
Brussels Institute of Contemporary China Studies - Vrije Universiteit Brussel 3
China and Global Industry
0%
10%
20%
30%
40%
50%
60%
70%
80%
90%
100%
2006 2007 2008 2009 2010 2011 2012
Share of Annual Installed Wind Capacity
Rest of world
Canada
Portugal
UK
France
Italy
Spain
Germany
India
China
US
China market for wind power has been the largest in world for a number of years. In 2013 China accounted for 45.6% of new installations, followed by Germany 9.2%.
Source: GWR Annual Market Update
Brussels Institute of Contemporary China Studies - Vrije Universiteit Brussel 4
Government Renewable Policy Government regulaPon and policy key to internaPonalizaPon, both in China and other countries (EU, US). Both on supply and demand side. Also in China key issue of central-‐local government support.
• 1980s early 1990s China focus on R&D/experimental demonstraPon projects. 863 and 963 programmes and 10th Five Year Plan. • Late 1990s and early 2000s, policy began to shia to focus on industrializaPon and deployment of renewables. • 2006 The Renewable Energy Law set out the broad principles for development of the sector in China and at least in theory gave them legal force. Required that uPliPes purchase all electricity generated from renewable sources, pay the full price for energy from renewable sources, and offer a discount to consumers. • 2007 China Renewable Energy Medium-‐ and Long-‐Term Development Plan (Renewable Energy Plan) set out targets for renewable energy, and also outlined how they were to be achieved. • Renewable Energy Plan set a target of 5GW of installed grid-‐connected wind capacity by 2010 and 30GW by 2020. The target for solar PV was 300MW by 2010 and 1.8GW by 2010. The Renewable Energy Plan also required that power generaPng companies with over 5GW of capacity must have 3% of their generaPng capacity from non-‐hydro renewables by 2010, and 8% by 2020. • In subsequent years the installaPon targets have been exceeded by actual installed capacity and have been revised upwards on several occasions. New targets for 12th Five Year Plan and subsequently. • Although central government policy in theory supported all renewables, in reality this was not the case.
Brussels Institute of Contemporary China Studies - Vrije Universiteit Brussel 5
Central Government Policy – Wind
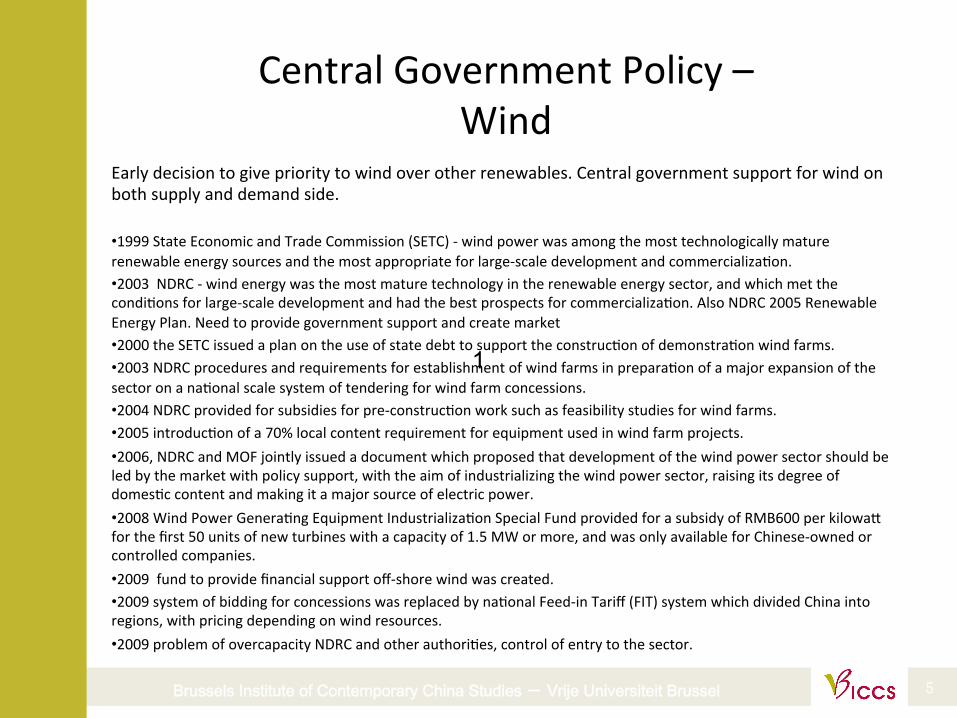
Early decision to give priority to wind over other renewables. Central government support for wind on both supply and demand side.
• 1999 State Economic and Trade Commission (SETC) -‐ wind power was among the most technologically mature renewable energy sources and the most appropriate for large-‐scale development and commercializaPon. • 2003 NDRC -‐ wind energy was the most mature technology in the renewable energy sector, and which met the condiPons for large-‐scale development and had the best prospects for commercializaPon. Also NDRC 2005 Renewable Energy Plan. Need to provide government support and create market • 2000 the SETC issued a plan on the use of state debt to support the construcPon of demonstraPon wind farms. • 2003 NDRC procedures and requirements for establishment of wind farms in preparaPon of a major expansion of the sector on a naPonal scale system of tendering for wind farm concessions. • 2004 NDRC provided for subsidies for pre-‐construcPon work such as feasibility studies for wind farms. • 2005 introducPon of a 70% local content requirement for equipment used in wind farm projects. • 2006, NDRC and MOF jointly issued a document which proposed that development of the wind power sector should be led by the market with policy support, with the aim of industrializing the wind power sector, raising its degree of domesPc content and making it a major source of electric power. • 2008 Wind Power GeneraPng Equipment IndustrializaPon Special Fund provided for a subsidy of RMB600 per kilowah for the first 50 units of new turbines with a capacity of 1.5 MW or more, and was only available for Chinese-‐owned or controlled companies. • 2009 fund to provide financial support off-‐shore wind was created. • 2009 system of bidding for concessions was replaced by naPonal Feed-‐in Tariff (FIT) system which divided China into regions, with pricing depending on wind resources. • 2009 problem of overcapacity NDRC and other authoriPes, control of entry to the sector.
1
Brussels Institute of Contemporary China Studies - Vrije Universiteit Brussel 6
Central Government Policy – Solar PV
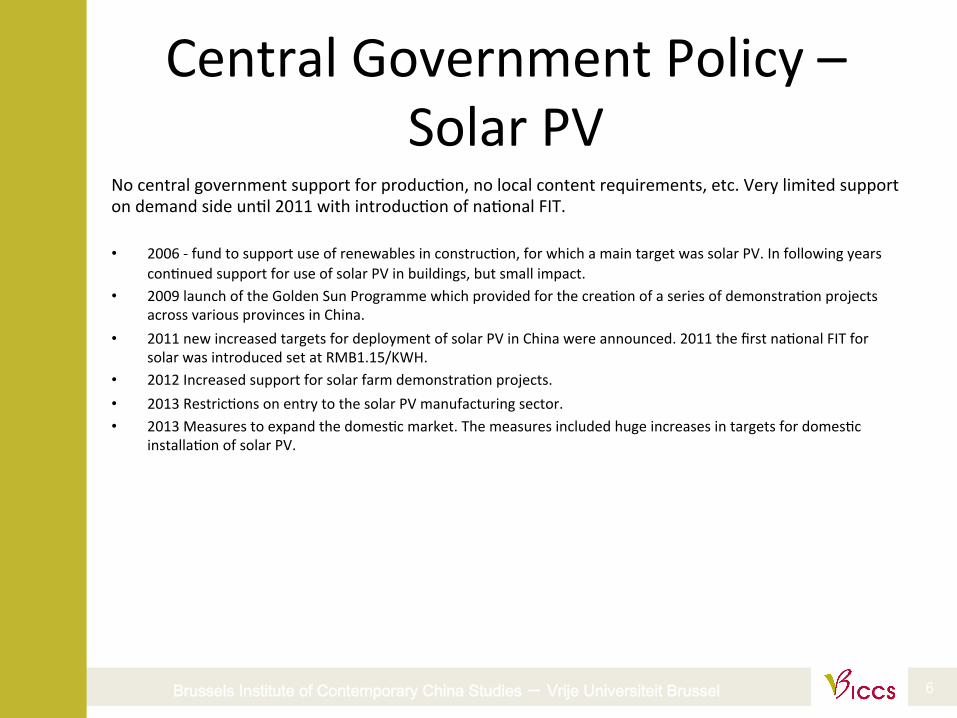
No central government support for producPon, no local content requirements, etc. Very limited support on demand side unPl 2011 with introducPon of naPonal FIT.
• 2006 -‐ fund to support use of renewables in construcPon, for which a main target was solar PV. In following years conPnued support for use of solar PV in buildings, but small impact.
• 2009 launch of the Golden Sun Programme which provided for the creaPon of a series of demonstraPon projects across various provinces in China.
• 2011 new increased targets for deployment of solar PV in China were announced. 2011 the first naPonal FIT for solar was introduced set at RMB1.15/KWH.
• 2012 Increased support for solar farm demonstraPon projects. • 2013 RestricPons on entry to the solar PV manufacturing sector. • 2013 Measures to expand the domesPc market. The measures included huge increases in targets for domesPc
installaPon of solar PV.
Brussels Institute of Contemporary China Studies - Vrije Universiteit Brussel 7
Creating a Market in China?
0
1000
2000
3000
4000
5000
6000
7000
8000
9000
10000
Subsidies for Grid-‐Connected Electricity Genera9on from Renewable Sources (RMB
million)
Wind Biomass Solar PV
0
5000
10000
15000
20000
25000
30000
35000
40000
45000
50000
Subsidies for Grid Connec9on for Grid-‐Connected Electricity from Renewable Sources (RMB million)
Wind Biomass Solar PV
As in other countries government support was central to creation of market. Most support has been given to wind and very little to solar PV. More recently new Renewable Energy Fund from 2011 shift to support for solar PV, share rose to 8% in 2012 and 16% in 2013.
Source: NDRC, SERC Source: NDRC, SERC
Brussels Institute of Contemporary China Studies - Vrije Universiteit Brussel 8
Creating a Market in China?
0
1000
2000
3000
4000
5000
6000
7000
8000
9000
10000
2006 2007 2008 2009 2010 2011 2012
Annual New Installa9on of Grid-‐Connected Genera9ng Capacity (MW)
Hydro Thermal Nuclear Wind Solar
0
5
10
15
20
25
2007 2008 2009 2010 2011 2012
Annual Investment in Grid-‐Connected Electricity Supply (RMB billion)
Hydro Thermal Nuclear Wind Solar
Result was creation of market in China for wind power equipment, but not for solar PV.
Source: China Electricity Council Source: China Electricity Council
Brussels Institute of Contemporary China Studies - Vrije Universiteit Brussel 9
Local Government Solar PV ProducPon Support
• Why did China develop solar PV industry that dominated global markets? In absence of central government many local governments stepped in to support solar PV manufacturing industry.
• Chinese Communist Party Xinyu Municipality Commihee, Xinyu Municipal Government, 2006. • Guangdong Province Economic and Trade Commission, Science and Technology Bureau, ConstrucPon Bureau, Agriculture Bureau, 2007. • Fujian Province InformaPon Industry Bureau, Development and Reform Commission (DRC), Economic and Trade Commission, Science and
Technology Bureau, ConstrucPon Bureau, 2007. • Baoding Municipal Government, 2007 • Xinyu Municipal Government,, 2007. • Yangzhou Municipality, 2007. • Chengdu Municipal Government, 2008. • Luoyang Municipal Government, 2008. • Anyang Municipal Government, 2009. • Shunde District People’s Government, 2009. • Hangzhou Municipal Government, 2009. • Shaanxi Province Finance Bureau, Shaanxi Province Industry and InformaPon Industry Bureau, 2009. • Shangrao Municipal Government, 2009. • Taizhou Municipal Government, 2009. • Hangzhou Municipal Government. 2009/. • Hebei Province Government, 2010. • Foshan Municipal Government. 2010. • Wuxi Municipal Economic and InformaPon Industry Commission, 2010. • Huhehaote Municipal Government,2010.. • Guangdong Province Economic and InformaPon Industry Commission, 2011. • Nanchang Municipal Government, 2011. • Hefei Municipal Government. 2011
Brussels Institute of Contemporary China Studies - Vrije Universiteit Brussel 10
Local Government Solar PV Electricity GeneraPon Support
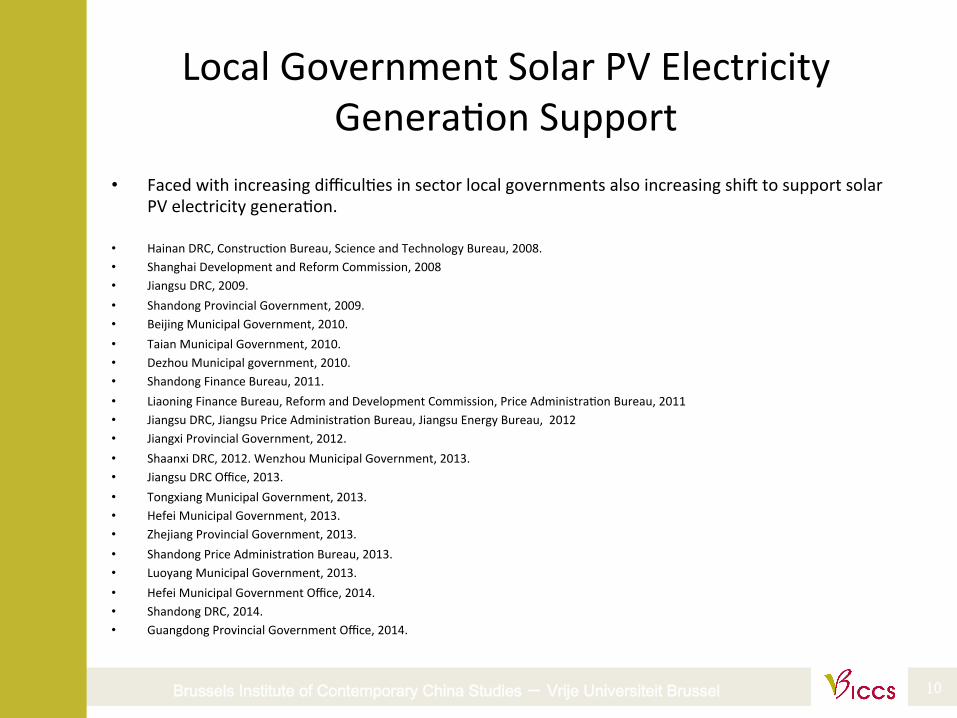
• Faced with increasing difficulPes in sector local governments also increasing shia to support solar PV electricity generaPon.
• Hainan DRC, ConstrucPon Bureau, Science and Technology Bureau, 2008. • Shanghai Development and Reform Commission, 2008 • Jiangsu DRC, 2009. • Shandong Provincial Government, 2009. • Beijing Municipal Government, 2010. • Taian Municipal Government, 2010. • Dezhou Municipal government, 2010. • Shandong Finance Bureau, 2011. • Liaoning Finance Bureau, Reform and Development Commission, Price AdministraPon Bureau, 2011 • Jiangsu DRC, Jiangsu Price AdministraPon Bureau, Jiangsu Energy Bureau, 2012 • Jiangxi Provincial Government, 2012. • Shaanxi DRC, 2012. Wenzhou Municipal Government, 2013. • Jiangsu DRC Office, 2013. • Tongxiang Municipal Government, 2013. • Hefei Municipal Government, 2013. • Zhejiang Provincial Government, 2013. • Shandong Price AdministraPon Bureau, 2013. • Luoyang Municipal Government, 2013. • Hefei Municipal Government Office, 2014. • Shandong DRC, 2014. • Guangdong Provincial Government Office, 2014.
Brussels Institute of Contemporary China Studies - Vrije Universiteit Brussel 11
Internationalization of Chinese solar PV companies - trade
0
10
20
30
40
50
60
70
80
90
100
2003 2004 2005 2006 2007 2008 2009 2010 2011 2012
Share of Mainland China in Net Revenues of Leading Chinese Solar PV Companies (%)
Suntech Power Yingli Green Energy Trina Solar JinkoSolar
JA Solar Hanwha SolarOne LDK Solar Canadian Solar
Chinese companies – reliance on local government policy – but no domestic market created. Dependent on foreign markets/supports, ie EU. In solar PV sector internationalization through trade. Chinese companies, large scale, vertical integration. Leading non-Chinese companies (US, Europe) produce in SE Asia. Minimal ODI by Chinese companies.
Source: Company filings
“Without a feed-in tariff, the size and attractiveness of China’s solar market may be limited and we may be unable to sell into China at an attractive price, limiting one of our anticipated growth markets.” Suntech 2009
Brussels Institute of Contemporary China Studies - Vrije Universiteit Brussel 12
InternaPonalizaPon of wind power equipment companies -‐ trade
82
84
86
88
90
92
94
96
98
100
2009 2010 2011 2012
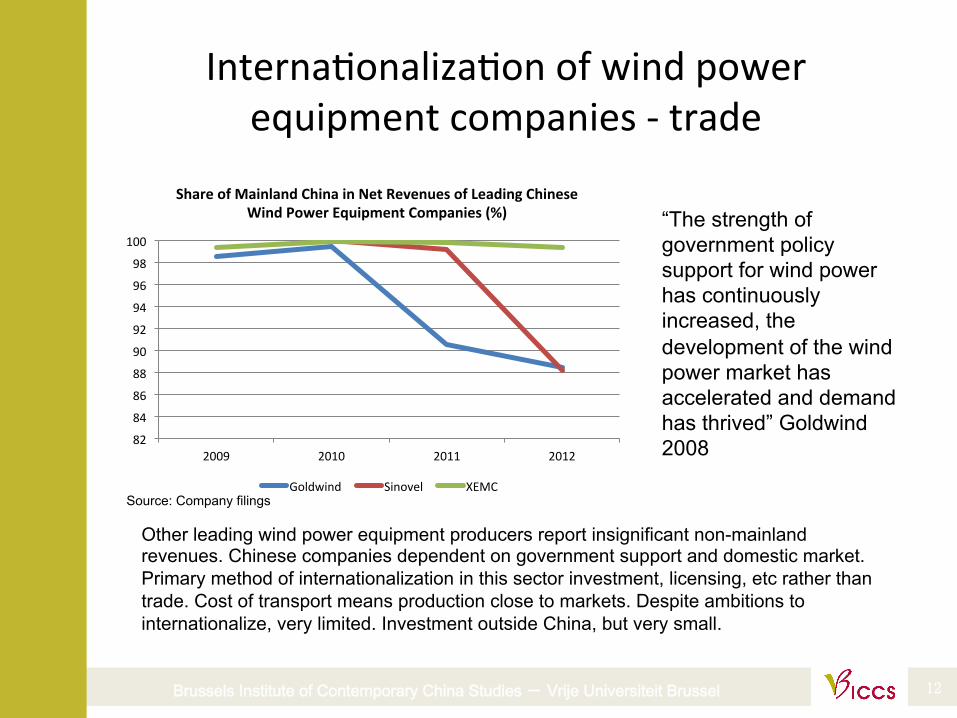
Share of Mainland China in Net Revenues of Leading Chinese Wind Power Equipment Companies (%)
Goldwind Sinovel XEMC
Other leading wind power equipment producers report insignificant non-mainland revenues. Chinese companies dependent on government support and domestic market. Primary method of internationalization in this sector investment, licensing, etc rather than trade. Cost of transport means production close to markets. Despite ambitions to internationalize, very limited. Investment outside China, but very small.
Source: Company filings
“The strength of government policy support for wind power has continuously increased, the development of the wind power market has accelerated and demand has thrived” Goldwind 2008
Brussels Institute of Contemporary China Studies - Vrije Universiteit Brussel 13
Prospects • XI-‐Obama APEC Announcement – China, “intends to achieve the peaking of CO2 emissions around
2030 and to make best efforts to peak early and intends to increase the share of non-‐fossil fuels in primary energy consumpPon to around 20% by 2030”.
• target would require China to install 800 to 1000 GW of zero-‐emissions energy generaPng capacity by 2030, which is greater than the current coal-‐fired generaPng capacity in China.
• The State Council Strategic AcPon Plan for Energy Development (2014-‐2020) June 2014. Non-‐fossil fuels are targeted to reach 15% of energy consumpPon by 2020, natural gas more than 10% and coal less than 62%. Although it is not specified, this leaves about 13% for oil.
• The plan also calls for an installed capacity of over 200 GW of wind power in 2020, over 100 GW of solar photovoltaic (PV), 350 GW of normal hydro power and 58 GW of nuclear, with a further 30 GW of nuclear to be under construcPon. At the end of 2013 China had 91.4 GW of grid-‐connected wind capacity and 19.4 GW of grid-‐connected solar PV capacity. In 2013 added 12.9 GW of solar PV and 16.1 GW of wind capacity, both the largest in the world. It also added 29.9 GW of hydro capacity.
• One recent arPcle -‐ official from the planning department of the NaPonal Energy Agency (NEA) discussing the 13th FYP -‐ the target for 2020 would be for coal to account for less than 60% of primary energy consumpPon, and that the target for 2030 would be less than 50%.