44
IFPRI Discussion Paper 00793 September 2008 China: Shadow WTO Agricultural Domestic Support Notifications Fuzhi Cheng Markets, Trade and Institutions Division
IFPRI Discussion Paper 00793
September 2008
China: Shadow WTO Agricultural Domestic Support Notifications
Fuzhi Cheng
Markets, Trade and Institutions Division
INTERNATIONAL FOOD POLICY RESEARCH INSTITUTE
The International Food Policy Research Institute (IFPRI) was established in 1975. IFPRI is one of 15 agricultural research centers that receive principal funding from governments, private foundations, and international and regional organizations, most of which are members of the Consultative Group on International Agricultural Research (CGIAR).
FINANCIAL CONTRIBUTORS AND PARTNERS IFPRI’s research, capacity strengthening, and communications work is made possible by its financial contributors and partners. IFPRI receives its principal funding from governments, private foundations, and international and regional organizations, most of which are members of the Consultative Group on International Agricultural Research (CGIAR). IFPRI gratefully acknowledges the generous unrestricted funding from Australia, Canada, China, Finland, France, Germany, India, Ireland, Italy, Japan, Netherlands, Norway, South Africa, Sweden, Switzerland, United Kingdom, United States, and World Bank.
AUTHOR Fuzhi Cheng, Virginia Polytechnic Institute and State University Research Fellow, Global Issues Initiative (GII), Institute for Society, Culture, and Environment [email protected]
Notices 1 Effective January 2007, the Discussion Paper series within each division and the Director General’s Office of IFPRI were merged into one IFPRI–wide Discussion Paper series. The new series begins with number 00689, reflecting the prior publication of 688 discussion papers within the dispersed series. The earlier series are available on IFPRI’s website at www.ifpri.org/pubs/otherpubs.htm#dp. 2 IFPRI Discussion Papers contain preliminary material and research results. They have not been subject to formal external reviews managed by IFPRI’s Publications Review Committee but have been reviewed by at least one internal and/or external reviewer. They are circulated in order to stimulate discussion and critical comment.
Copyright 2008 International Food Policy Research Institute. All rights reserved. Sections of this material may be reproduced for personal and not-for-profit use without the express written permission of but with acknowledgment to IFPRI. To reproduce the material contained herein for profit or commercial use requires express written permission. To obtain permission, contact the Communications Division at [email protected]
iii
CONTENTS
Acknowledgements v
Conference Program vi
Abstract vii
1. Introduction 1
2. A Brief Overview of China’s Agricultural Sector 3
3. Recent Agricultural Policy 6
4. Past and Shadow WTO Notifications 12
5. Domestic Support Projection and WTO Commitments 24
6. Conclusion 28
Appendix A. Supporting DS Tables 29
Appendix B. Projection of China’s Notifications 32
References 33
iv
List of Tables
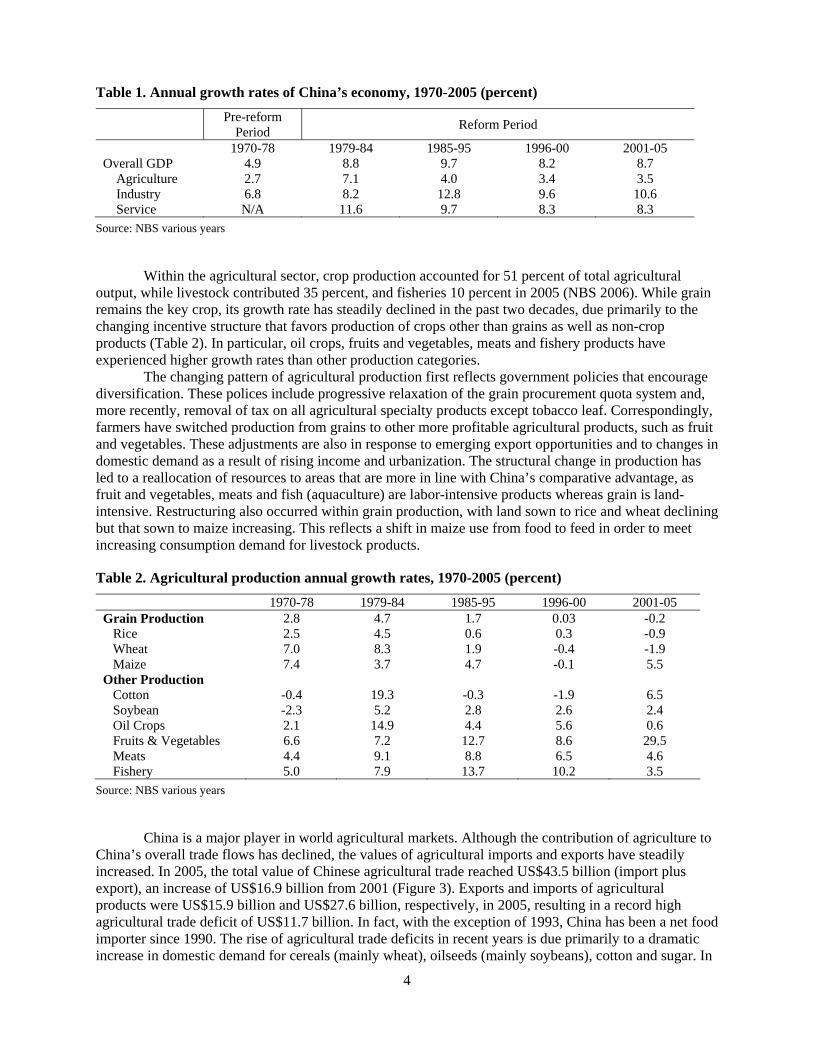
1. Annual growth rates of China’s economy, 1970-2005 (percent) 4
2. Agricultural production annual growth rates, 1970-2005 (percent) 4
3. China’s applied most favored nation tariff, 2001-2005 (percent) 8
4. China’s TRQs for agricultural products, 2002-2005 9
5. China’s domestic support, 1996-2005 (million RMB) 13
6. MPS under different assumptions (million RMB) 16
7. Non-exempt direct payments to farmers and product specific support 18
8. Agricultural taxes in China, 1990-2005 (million RMB) 21
9. Estimated subsidies for irrigation in China 1996-2005 22
10. Electricity subsidies 1996-2005 23
11. Projection of China’s notification under current WTO commitments, 2006-2013 (million RMB) 25
12. Main provisions of draft modalities and China’s commitments 27
A.1. DS1: Measures exempt from the reduction commitment – “Green Box” (million RMB) 29
A.2. DS 4, 5, 6, 7: Product specific support and total product specific AMS 30
A.3. DS 9: Non-product-specific AMS (million RMB) 31
B.1. Product-specific support 32
List of Figures
1. China’s producer support estimate, 1993-2005 1
2. Per capita income of Chinese urban and rural residents, 1978–2005 (RMB). 3
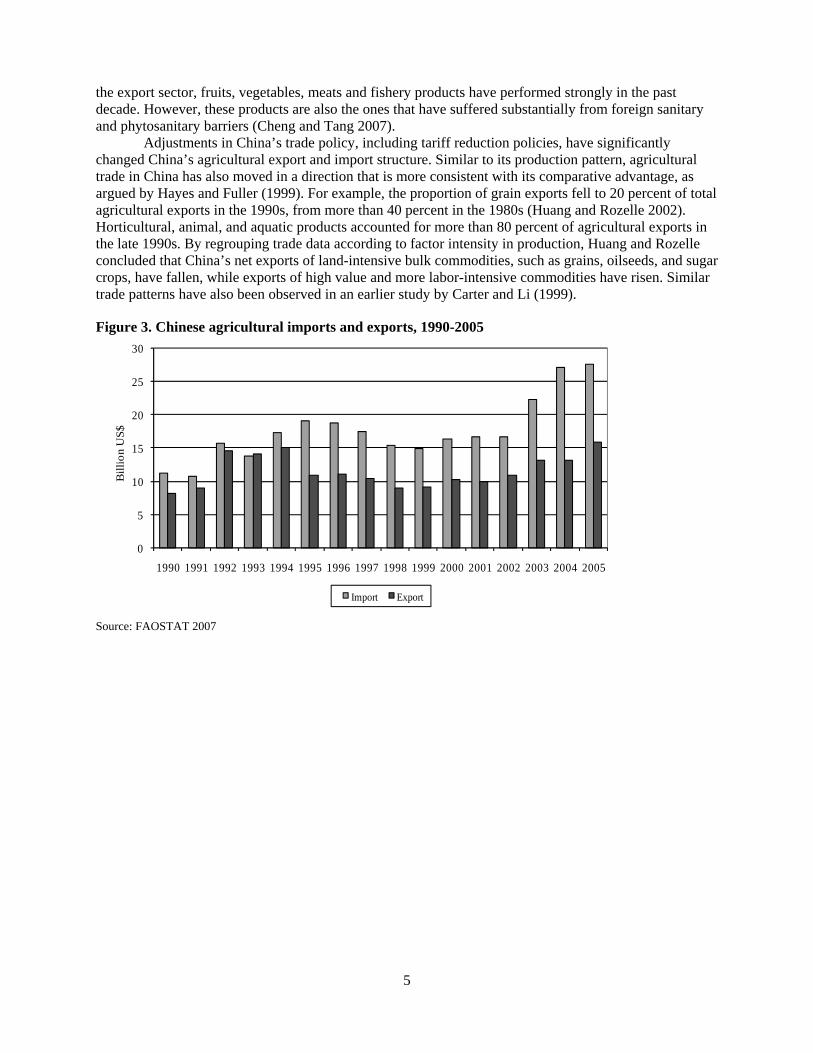
3. Chinese agricultural imports and exports, 1990-2005 5
4. Direct payments and grain production 19

v
ACKNOWLEDGEMENTS
This Discussion Paper provides a revised version of a paper presented at the conference Improving WTO Transparency: Shadow Domestic Support Notifications held at IFPRI, Washington, D.C., on March 14-15, 2008. Helpful comments were received at the meeting and incorporated into this version. The author also gratefully acknowledges the very helpful comments from Lars Brink, Will Martin, Dongsheng Sun and Shunli Yao.
The author acknowledges the support of IFPRI through the project Foundation Analysis for Agricultural Trade Reform. Financial support to IFPRI for this project from The William and Flora Hewlett Foundation (Grant 2007-9399) is gratefully acknowledged. The project and conference are activities of IFPRI's Markets, Trade and Institutions Division. Antoine Bouet and David Orden are the IFPRI project leaders and Ann Tutwiler is project liaison for the Hewlett Foundation. Support of the Division Director, Maximo Torero, is appreciated. Shirley Raymundo provided administrative and technical support for the conference and preparation of the papers.

vi
CONFERENCE PROGRAM
Improving WTO Transparency: Shadow Domestic Support Notifications
Measurement Issues and Analysis for Eight Countries—
European Union, United States, Japan, Norway, Brazil, China, India and the Philippines http://www.ifpri.org/events/conferences/2008/20080314.asp
Friday, March 14 9:00-10:00 An Overview of WTO Domestic Support Notifications
David Orden Discussion Opener: Lars Brink
10:00-11:10 European Union Tim Josling and Alan Swinbank Discussion Opener: Erling Vårdal
Coffee Break 11:30-12:40 United States
David Blandford and David Orden Discussion Opener: Munisamy Gopinath
Lunch 1:30-3:30 Brazil
André Nassar and Diego Ures China Fuzhi Cheng Discussion Opener (both papers): Caesar Cororaton
Afternoon Break 3:45-5:45 India Munisamy Gopinath Philippines Caesar Cororaton Discussion Opener (both papers): Yoshihisa Godo Saturday, March 15 9:00-11:00 Japan Yoshihisa Godo Norway Erling Vårdal Discussion Opener (both papers): André Nassar 11:15-12:30 Wrap Up
vii
ABSTRACT
This paper reviews recent agricultural policy changes in China and presents estimates of domestic support for the period 1996-2005. A set of relevant alternative subsidy-definition scenarios and their effects on the calculated levels of support are analyzed, and a projection of domestic support through 2013 is presented. The paper concludes with a discussion of new WTO rules that may be negotiated in the Doha Round and their implications for China.
Based on standard WTO subsidy calculation methods, our results indicated that China’s domestic support for the period 1996-2005 has been well below the limits agreed at its WTO accession. The market price support (MPS) component of the aggregate measure of support (AMS) in China has been below zero, and this has dwarfed the relatively small but positive non-product specific AMS and led to a zero current total AMS after de minimis. China has no AMS commitments but can provide trade-distorting domestic support to agricultural producers up to 8.5 percent of the value of production (or RMB561 billion). Thus there appears to be substantial room for China to extend its amber box subsidy measures through heavy use of the de minimis provision.
We project domestic support notifications through 2013 based on specified assumptions about domestic policies, including changes in administered prices and commodity program coverage. New rules potentially negotiated in the Doha Round are expected to provide more constraints on subsidies. Due to China’s developing country status, with no AMS commitments under the Uruguay Round Agreement on Agriculture the impacts of these new constraints are shown to be limited, although our projections indicate that China may exceed its WTO commitment levels under certain price and commodity coverage scenarios.
Keywords: China agricultural support policies; WTO Doha Round; notification of domestic support; WTO compliance

1
1. INTRODUCTION
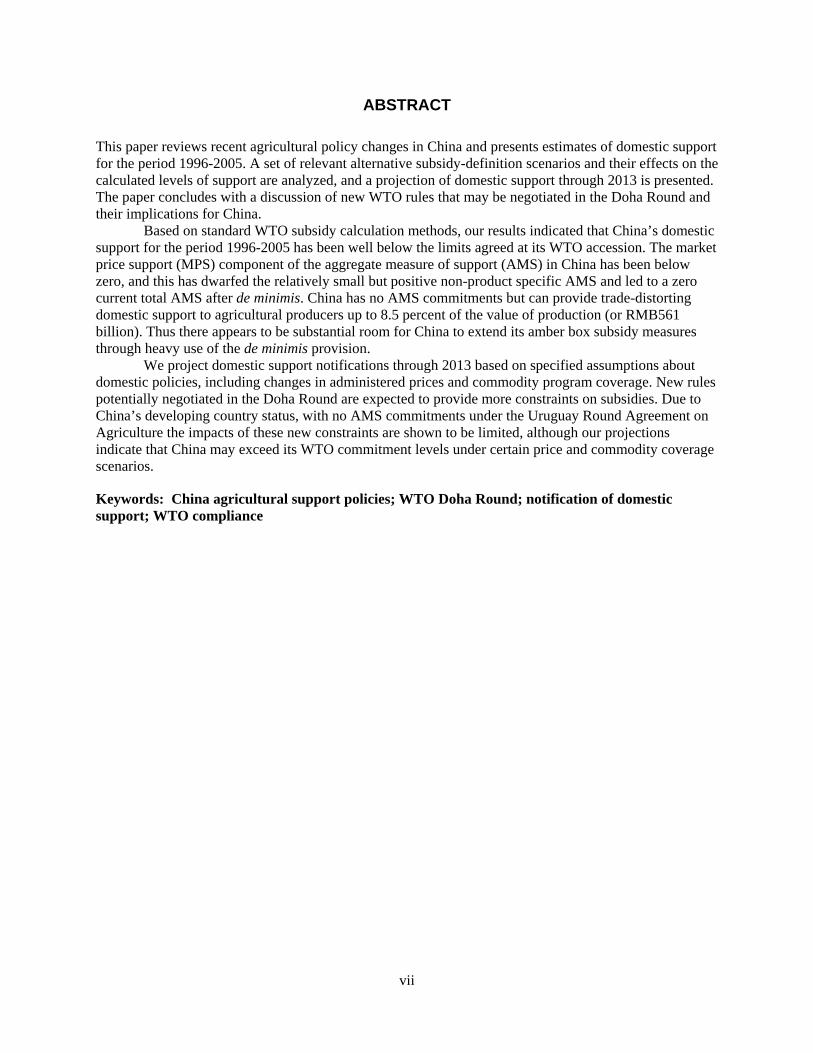
Chinese agricultural policy has undergone some fundamental changes in the past decade, with major policy shifts in pricing, marketing, trade, investment and technology. Most notably, China has implemented a series of new policies that directly favor the agricultural sector (Kwiecinski and van Tongeren 2007). These policies include direct payments to farmers, agricultural input subsidies, agricultural tax elimination, minimum and protective prices, dismantlement of barriers to private entry into agricultural marketing channels, and increased spending on rural infrastructure, research and development. The policy changes have resulted in higher support for the agricultural sector, which has been documented in various studies. For instance, the Producer Support Estimates (PSE) compiled by the OECD (2007) show a clear rising trend in subsidies in China since 1993 (Figure 1). Considering this finding in combination with empirical evidence disclosing disprotection in agriculture in earlier periods (e.g., Huang et al. 2007), one could conclude that there has been a transition of government policy stance from taxing agriculture to supporting the sector.
Figure 1. China’s producer support estimate, 1993-2005
-15-10-505101520253035
-150-100
-500
50100150200250300350
1993 1994 1995 1996 1997 1998 1999 2000 2001 2002 2003 2004 2005
Billion RMB (left axis) Percent (right axis)
Source: OECD 2007
Recent agricultural policy changes reflect the Chinese leadership’s renewed attention to agricultural problems, concisely described in official documents as the “San Nong” issue (agriculture, rural areas, and peasants). The policy changes also arrived amidst a sharply widening rural-urban income gap as well as rising social unrest and political tension. In a series of “No.1 Documents” issued by the Central Committee of the Chinese Communist Party, it is reiterated that increasing farm incomes is at the top of the leadership’s agenda. The authorities believe that the provision of various subsidies to farmers will effectively raise their incomes, which would, in turn, pacify the widespread resentment against the present social economic system that has disproportionately benefited people in urban areas. The objective of self-sufficiency in food supply (grains in particular) is also embedded in the subsidy strategy because farmers are expected to produce more when provided with better economic incentives. Recent economic growth has made these subsidy policy changes fiscally feasible.
The impacts of China’s new subsidy policies are far-reaching both within the country and internationally. The elimination of agricultural taxes and the provision of direct payments to farmers, for example, have been lauded domestically as major achievements in China’s agricultural policy reforms—Chinese farmers are for the first time in the country’s history being subsidized rather than taxed by the government, a transition that is intended to add significantly to the country’s progress in poverty reduction. In the trade arena, however, there is a potential concern that some of the policies may prove
2
contentious during the Doha Round negotiations, just as agricultural subsidies in developed countries have been under intense scrutiny from the Uruguay Round onward. As China’s influence on the world economy continues to increase, the global implications of its domestic policies will receive more attention. Specifically, one would question whether China’s subsidy policy measures meet the disciplines of the current WTO Agreement on Agriculture (AoA) and whether they will fit within tighter rules that may be negotiated in the future, especially if China continues its current trend of increasing agricultural subsidies.
Compliance with WTO rules (or lack thereof) can be monitored by referring to each country’s official subsidy notifications, which may be challenged by others through informal or formal procedures (e.g., review or dispute settlement). Each WTO member country is expected to routinely update notifications on the implementation of its domestic support commitments for monitoring by the WTO Committee on Agriculture. These notifications serve as the primary source of information on each country’s domestic agricultural subsidy outlays, and on how such subsidies have been classified—as exempt from or subject to reduction commitments.
Unfortunately, however, few WTO members have regularly reported their domestic support notifications.1 China has provided estimates of domestic support in its accession documents for the period 1996-1998 (WT/ACC/CHN/38/Rev.3) and updated them for 1999-2001 (G/AG/CHN/8). However, due to the lack of disciplines for notifications in the WTO and the intrinsic difficulty of obtaining subsidy data in a timely fashion (e.g., actual budgetary expenditures are often not known until well after a particular crop-production year), no official filing of notifications has been made for China beyond 2001, the year it became a member of the WTO. Apart from annual monitoring by the OECD, little is known in the outside world about how much support (in WTO terms) China has provided its agriculture in recent years, or whether China has complied with the relevant WTO rules. Recent agricultural policy reforms and the delay in official reporting suggest the need for an investigation into the consequences of policy changes in terms of China’s WTO commitments in regard to domestic support as well as a projection of future notifications examining possible ramifications of continued policy development within China and at the WTO.
This paper attempts to provide a quantitative assessment for China of “shadow notifications” in which recent subsidy information is presented and changes in domestic policies and market conditions are discussed. In addition to providing basic notification calculations, several important controversies about different subsidy definitions and interpretation of the WTO rules are assessed. Future subsidies and their WTO compliance are projected and evaluated through 2013.
The rest of the paper is organized as follows: Section 2 provides a brief overview of China’s agricultural sector. Section 3 reviews recent agricultural policy changes. Section 4 presents estimates of China’s domestic support for the period 1996-2005 and discusses a set of relevant alternative subsidy-definition scenarios and their effects on the calculated levels of support. Section 5 describes the projection of domestic support through 2013 and discusses new constraints/latitude that may potentially be negotiated in the Doha Round with implications for China. Section 6 provides a summary.
1 According to most recent WTO data, 1995 was the only year for which all members with domestic support reduction
commitments for that year had submitted a notification. For 2000, out of 30 countries with commitments, 25 (or 83 percent) had submitted a notification. For 2003, of the 35 countries with commitments, 8 (or 23 percent) had submitted a notification and 27 were overdue.
3
2. A BRIEF OVERVIEW OF CHINA’S AGRICULTURAL SECTOR
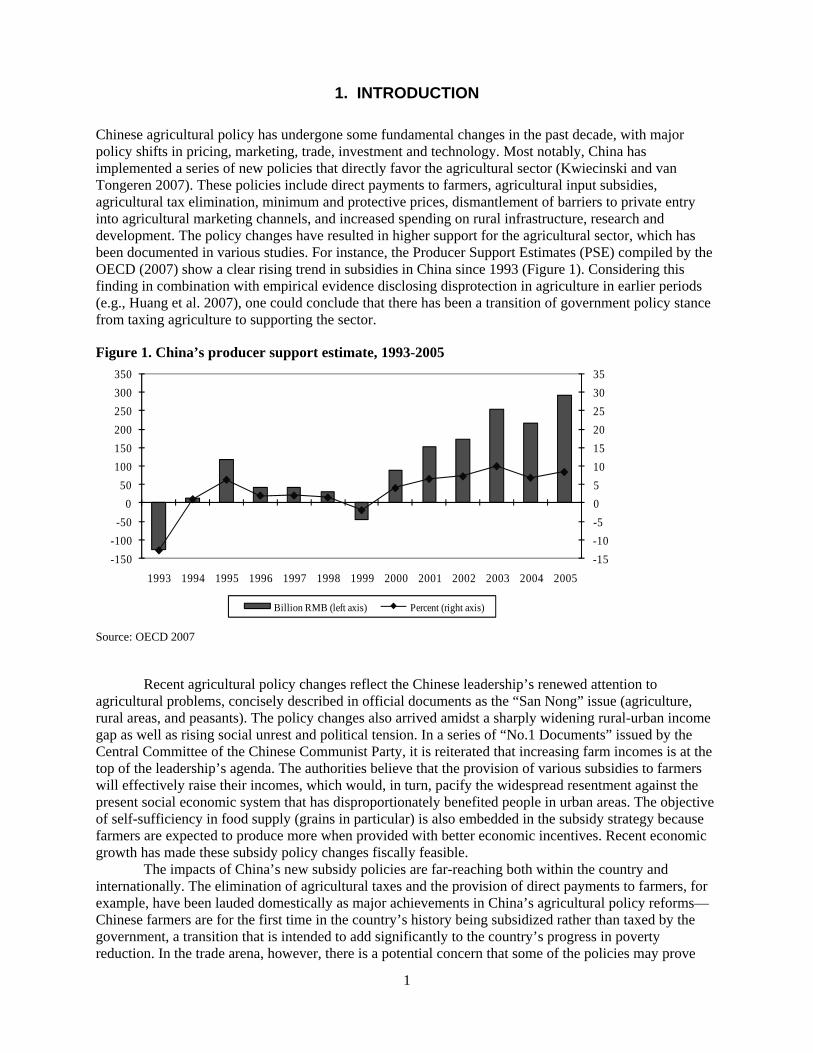
China has a vast agricultural sector encompassing more than half of the population. The sector has witnessed considerable achievements since economic reforms were initiated in 1978. However, despite long-term growth, the agricultural sector has lagged significantly behind its urban counterpart. Incomes in rural areas, after a few years of strong growth in the early years of the reform, have stayed well below those in urban areas (Figure 2). The rising urban-rural income gap has become the most significant source of China’s whole income disparity problem (Chang 2002). The rapidly expanding urban sector and the development of rural off-farm employment in township and village enterprises (TVEs) have alleviated the problem of surplus rural labor to some extent, but restrictions from the household registration (“hukou”) system and other preferential employment treatments favoring only urban residents continue to constrain rural labor mobility. Today, a large share of China’s idle population remains in rural areas, contributing to a high overall unemployment rate that has reached 14 percent in recent years (Giles, Park and Zhang 2005). This massive labor surplus in rural areas has also resulted in a high ratio of labor per unit of land and thus low labor productivity and agricultural returns.
Figure 2. Per capita income of Chinese urban and rural residents, 1978–2005 (RMB).
0
2,000
4,000
6,000
8,000
10,000
12,000
1978 1980 1985 1989 1990 1991 1992 1993 1994 1995 1996 1997 1998 1999 2000 2001 2002 2003 2004 2005
Rural Urban
Source: NBS various years
Agricultural production in China is characterized by a combination of scarce land, abundant labor, limited mechanization and small-scale operations. The sector employs approximately 350 million people, or 45 percent of the total labor force, and the average farm size is less than 0.5 hectares (Fan and Chan-Kang 2005). Income from agriculture is an important component of the Chinese economy, although its contribution to overall GDP has steadily declined. In 2005, agriculture accounted for less than 13 percent of GDP, compared to nearly 30 percent in 1980 (NBS 2006). The decline of agriculture in the domestic economy is due primarily to the weak performance of the sector as well as stronger growth elsewhere in the economy (i.e., the industrial and service sectors). The annual growth rate of agricultural GDP since 1996 was only 3.5 percent, slightly higher than the 2.7 percent growth seen in the pre-reform era. In contrast, the industrial and service sectors have each registered higher growth rates of about 8-10 percent during the same period (Table 1).
4
Table 1. Annual growth rates of China’s economy, 1970-2005 (percent)
Pre-reform Period Reform Period
1970-78 1979-84 1985-95 1996-00 2001-05 Overall GDP 4.9 8.8 9.7 8.2 8.7 Agriculture 2.7 7.1 4.0 3.4 3.5 Industry 6.8 8.2 12.8 9.6 10.6 Service N/A 11.6 9.7 8.3 8.3
Source: NBS various years
Within the agricultural sector, crop production accounted for 51 percent of total agricultural output, while livestock contributed 35 percent, and fisheries 10 percent in 2005 (NBS 2006). While grain remains the key crop, its growth rate has steadily declined in the past two decades, due primarily to the changing incentive structure that favors production of crops other than grains as well as non-crop products (Table 2). In particular, oil crops, fruits and vegetables, meats and fishery products have experienced higher growth rates than other production categories.
The changing pattern of agricultural production first reflects government policies that encourage diversification. These polices include progressive relaxation of the grain procurement quota system and, more recently, removal of tax on all agricultural specialty products except tobacco leaf. Correspondingly, farmers have switched production from grains to other more profitable agricultural products, such as fruit and vegetables. These adjustments are also in response to emerging export opportunities and to changes in domestic demand as a result of rising income and urbanization. The structural change in production has led to a reallocation of resources to areas that are more in line with China’s comparative advantage, as fruit and vegetables, meats and fish (aquaculture) are labor-intensive products whereas grain is land-intensive. Restructuring also occurred within grain production, with land sown to rice and wheat declining but that sown to maize increasing. This reflects a shift in maize use from food to feed in order to meet increasing consumption demand for livestock products.
Table 2. Agricultural production annual growth rates, 1970-2005 (percent)
1970-78 1979-84 1985-95 1996-00 2001-05 Grain Production 2.8 4.7 1.7 0.03 -0.2 Rice 2.5 4.5 0.6 0.3 -0.9 Wheat 7.0 8.3 1.9 -0.4 -1.9 Maize 7.4 3.7 4.7 -0.1 5.5 Other Production Cotton -0.4 19.3 -0.3 -1.9 6.5 Soybean -2.3 5.2 2.8 2.6 2.4 Oil Crops 2.1 14.9 4.4 5.6 0.6 Fruits & Vegetables 6.6 7.2 12.7 8.6 29.5 Meats 4.4 9.1 8.8 6.5 4.6 Fishery 5.0 7.9 13.7 10.2 3.5
Source: NBS various years
China is a major player in world agricultural markets. Although the contribution of agriculture to China’s overall trade flows has declined, the values of agricultural imports and exports have steadily increased. In 2005, the total value of Chinese agricultural trade reached US$43.5 billion (import plus export), an increase of US$16.9 billion from 2001 (Figure 3). Exports and imports of agricultural products were US$15.9 billion and US$27.6 billion, respectively, in 2005, resulting in a record high agricultural trade deficit of US$11.7 billion. In fact, with the exception of 1993, China has been a net food importer since 1990. The rise of agricultural trade deficits in recent years is due primarily to a dramatic increase in domestic demand for cereals (mainly wheat), oilseeds (mainly soybeans), cotton and sugar. In
5
the export sector, fruits, vegetables, meats and fishery products have performed strongly in the past decade. However, these products are also the ones that have suffered substantially from foreign sanitary and phytosanitary barriers (Cheng and Tang 2007).
Adjustments in China’s trade policy, including tariff reduction policies, have significantly changed China’s agricultural export and import structure. Similar to its production pattern, agricultural trade in China has also moved in a direction that is more consistent with its comparative advantage, as argued by Hayes and Fuller (1999). For example, the proportion of grain exports fell to 20 percent of total agricultural exports in the 1990s, from more than 40 percent in the 1980s (Huang and Rozelle 2002). Horticultural, animal, and aquatic products accounted for more than 80 percent of agricultural exports in the late 1990s. By regrouping trade data according to factor intensity in production, Huang and Rozelle concluded that China’s net exports of land-intensive bulk commodities, such as grains, oilseeds, and sugar crops, have fallen, while exports of high value and more labor-intensive commodities have risen. Similar trade patterns have also been observed in an earlier study by Carter and Li (1999).
Figure 3. Chinese agricultural imports and exports, 1990-2005
0
5
10
15
20
25
30
1990 1991 1992 1993 1994 1995 1996 1997 1998 1999 2000 2001 2002 2003 2004 2005
Bill
ion
US$
Import Export
Source: FAOSTAT 2007
6
3. RECENT AGRICULTURAL POLICY
3.1. Need for Continued Agricultural Policy Reform The Chinese economy has long been characterized by discrimination against agriculture arising from government policies, many of which can be dated back to pre-socialist times (Huang et al. 2007). The government either taxed agriculture explicitly or set commodity prices below market levels, creating disincentives to agricultural production. Monopoly parastatal marketing firms (e.g., state owned grain enterprises) fully controlled the distribution of agricultural commodities and, through pan-territorial and pan-seasonal agricultural pricing, served mainly the interests of a select group composed of the urban elite, the industrial sector, and government bureaucrats. By the 1970s, evidence had mounted that government interventions in agriculture had done more harm than good to the economy. Poor economic performance, a stagnating agricultural sector and intensifying political pressure forced the country to accept much-needed agricultural policy reforms within the broader context of economic reforms that started in 1978.
Because of the importance of agriculture in the domestic economy in terms of income generation and employment, agricultural reforms occupied a central place in the initial reform efforts. The agricultural reform measures were generally designed to correct previous biases against agriculture by reducing or eliminating price controls and parastatal marketing (Ke 2007). The expectation was that improving price incentives for farmers and reducing government intervention in the agricultural sector would generate a sizable supply response and promote the rapid emergence of well-functioning markets. The reforms, in general, have been successful, not least because of a sincere government commitment to market liberalization. Agricultural output rose substantially and there was an increase in competition and private trader entry into domestic and foreign agricultural markets. Greater competition and increasingly cost-effective private-sector trading led to lower marketing margins and improved market efficiency. As a result, farmers received a greater share of the rising retail and export prices.
Evidence also emerged, however, that reforms had not succeeded in other areas. In particular, they failed to properly transfer structural and institutional functions previously performed by the state to the private sector (Huang 1998). In some cases, parastatal firms continued to dominate the markets (grain markets in particular), while in others, government withdrawal had left a vacuum that could not be filled by the private sector (e.g., the provision of public goods). Deficiencies in research, extension, transportation, storage and communications infrastructure, as well as inadequate legal and other regulatory institutions dealing with contract enforcement, quality control, and property rights, caused high transaction costs that dampened the efficiency gains from better private entry and competition. Operations in agriculture remained informal and small-scale.
The absence of comprehensive reforms kept many urban-biased policies intact (OECD 2005). The legacy of an industry-oriented development strategy, aimed at promoting industrial growth within cities, continued to suppress the agricultural sector. A set of biased fiscal and monetary policies that favored urban residents (e.g., agricultural taxes and urban subsidies), combined with a flawed sectoral and regional development policies focusing on coastal areas), caused urban-rural income disparity to rise substantially. The continuation of a household registration system that limits labor mobility aggravated the impacts of both sector- and region-biased policies on spatial income disparity.
There was evidence that reforms had caused an increase in price volatility, resulting in high costs paid by vulnerable rural households to limit their exposure to risks and to absorb the consequences of risks. Further integration with world agricultural markets has made this effect more pronounced, leading to a dilemma in regard to agricultural policy goals, namely, market liberalization versus food security. The conflict between these policy goals arises from the difficulty of implementing interventionist government policies when the incentives for individual actors are determined by market forces (Solot 2006). Experiences in the 1990s showed that liberalization was associated with sharp price swings for some of the most important commodities, including rice. This high price variability offset gains from increases in producer prices and deteriorated investment incentives for farmers. On the demand side, the elimination of government purchase and pricing, which is equivalent to removing a price floor, often
7
amidst rising price volatility, typically had adverse impacts on income, food consumption and nutritional status, especially for poor smallholder farmers who were net food purchasers. As a result, the impacts of reforms on rural welfare in general are uncertain.
Faced with a new set of agricultural problems, the Chinese government has increasingly recognized that further progress in developing the agricultural sector will require not only further liberalization, but also a more concerted effort to go beyond the withdrawal of the public sector from agricultural markets. The government has perceived the need to assume a new, supportive role for agriculture both as a market facilitator and as a producer subsidizer. One aspect of this role is to strengthen investment in public goods such as infrastructure, research and extension, and market information, which are deemed necessary for the development of more competitive and efficient markets (Fan and Thorat 2007). A second aspect is to foster stronger government support for agriculture through pricing, marketing, trade and various transfer mechanisms to secure farm income. Consistent with these new roles, China has in recent years started a new wave of agricultural policy reforms and introduced a series of policy measures that directly favor the agricultural sector.
3.2. Trade Policies China’s foreign trade policy reforms have involved four key steps: lowering trade barriers, depreciating the exchange rate, decentralizing the trading system, and introducing competition into foreign trade so that prices can play a role in determining resource allocation (Martin 2003). China’s agricultural trade policies—as part of an agricultural policy stance intended to maintain self-sufficiency in agricultural supply, especially in food grain production—have moved more slowly than other sectors in removing restrictions and reducing protection. Notwithstanding periodic standstills and reversals, China has progressively liberalized agricultural trade. In its WTO accession protocol, China has agreed to phase out state trading, bind 100 percent of its tariff lines, replace quantitative restrictions with a TRQ system, and eliminate export subsidies for all agricultural products.
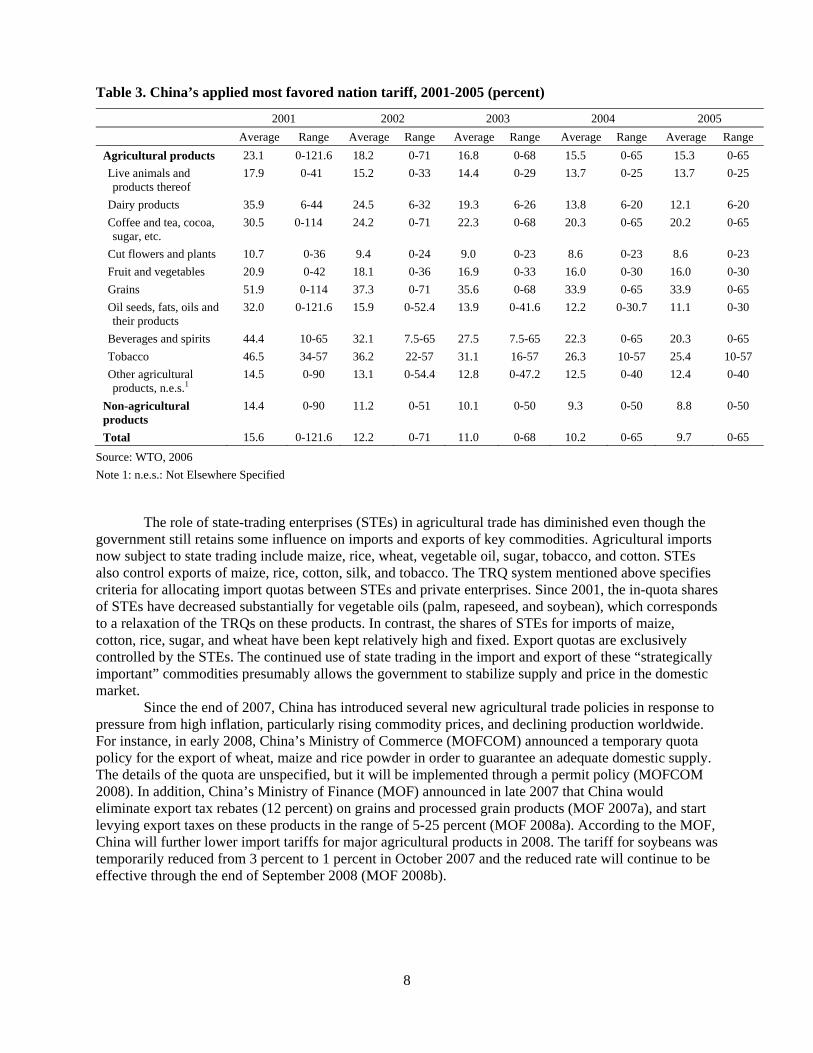
Applied tariff rates on agricultural products, which are higher than non-agricultural tariff rates, fell from 23.1 percent in 2001 to 15.3 percent in 2005, as compared to the overall average applied rate of 9.7 percent in 2005 (Table 3). Tariff dispersion has also declined, from 0-121.6 percent in 2001 to 0-65 percent in 2005. Tariffs on dairy products dropped from 35.9 percent in 2001 to 12.1 percent in 2005. Tariffs on grain and oilseeds have also fallen substantially since 2001, from 51.9 to 33.9 percent and from 32.0 to 11.1 percent, respectively. Nevertheless, grain, and other agricultural commodities that have traditionally been highly protected, such as sugar and confectionary sugar (29.9 percent in 2005) and tobacco (25.4 percent in 2005), are still subject to higher than average tariffs. Some of the lowest tariffs apply to oilseeds, a sector that was previously highly protected. With the exception of oilseeds, it appears that lower tariffs apply to subsectors in which China apparently has a comparative advantage (i.e. labor-intensive farm products), such as horticultural and animal products.
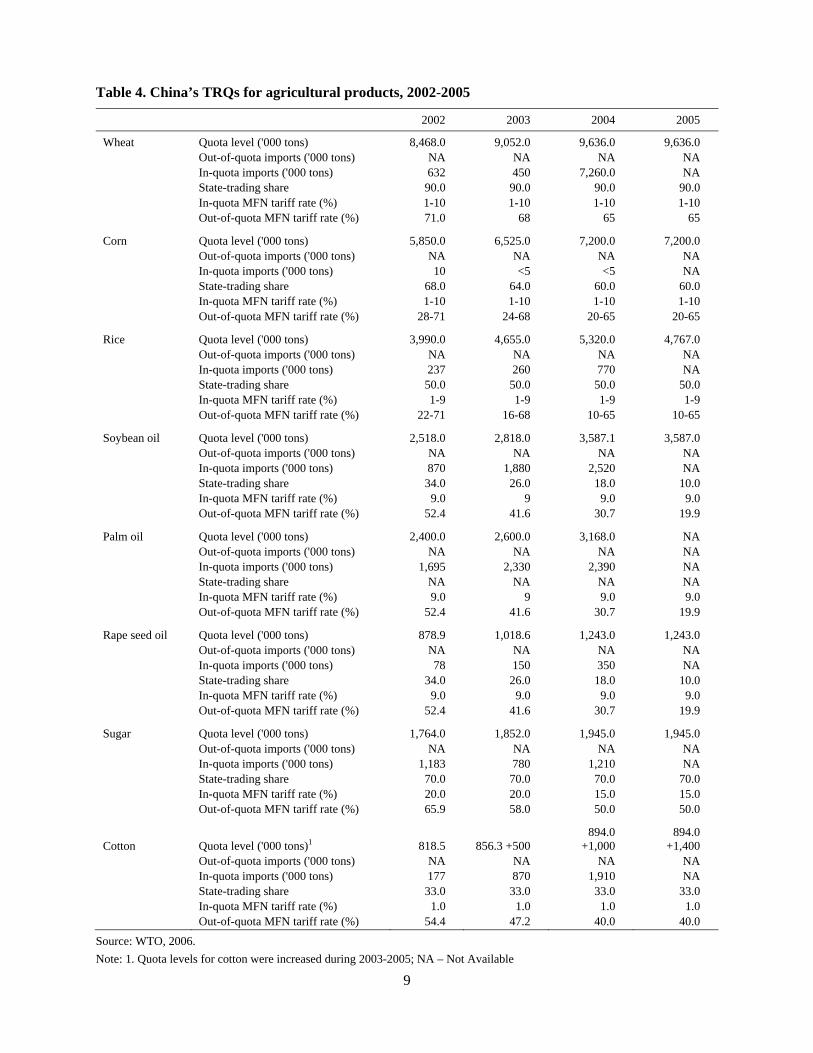
Tariff rate quotas (TRQs) have been gradually increased and out-of-quota tariff rates reduced (Table 4). In 2006, China eliminated the TRQs on vegetable oils, reducing the number of quota-related agricultural tariff lines to 55. The impacts of changing TRQs on trade flows, however, have been limited, at least for the short period examined. This is because in-quota imports are usually low and most TRQs are unfilled. Imports of grain under TRQs have been especially low, with the exception of wheat in 2004. Since 2003, imports of cotton have exceeded the quota levels specified in China’s Accession Protocol. However, out-of-quota cotton imports were charged the in-quota tariff rate, which is equivalent to an expansion of quota levels.
8
Table 3. China’s applied most favored nation tariff, 2001-2005 (percent)
2001 2002 2003 2004 2005 Average Range Average Range Average Range Average Range Average Range
Agricultural products 23.1 0-121.6 18.2 0-71 16.8 0-68 15.5 0-65 15.3 0-65 Live animals and products thereof
17.9 0-41 15.2 0-33 14.4 0-29 13.7 0-25 13.7
0-25
Dairy products 35.9 6-44 24.5 6-32 19.3 6-26 13.8 6-20 12.1 6-20 Coffee and tea, cocoa, sugar, etc.
30.5 0-114 24.2 0-71 22.3 0-68 20.3 0-65 20.2 0-65
Cut flowers and plants 10.7 0-36 9.4 0-24 9.0 0-23 8.6 0-23 8.6 0-23 Fruit and vegetables 20.9 0-42 18.1 0-36 16.9 0-33 16.0 0-30 16.0 0-30 Grains 51.9 0-114 37.3 0-71 35.6 0-68 33.9 0-65 33.9 0-65 Oil seeds, fats, oils and their products
32.0 0-121.6 15.9 0-52.4 13.9 0-41.6 12.2 0-30.7 11.1 0-30
Beverages and spirits 44.4 10-65 32.1 7.5-65 27.5 7.5-65 22.3 0-65 20.3 0-65 Tobacco 46.5 34-57 36.2 22-57 31.1 16-57 26.3 10-57 25.4 10-57 Other agricultural products, n.e.s.1
14.5 0-90 13.1 0-54.4 12.8 0-47.2 12.5 0-40 12.4 0-40
Non-agricultural products
14.4 0-90 11.2 0-51 10.1 0-50 9.3 0-50 8.8 0-50
Total 15.6 0-121.6 12.2 0-71 11.0 0-68 10.2 0-65 9.7 0-65
Source: WTO, 2006 Note 1: n.e.s.: Not Elsewhere Specified
The role of state-trading enterprises (STEs) in agricultural trade has diminished even though the government still retains some influence on imports and exports of key commodities. Agricultural imports now subject to state trading include maize, rice, wheat, vegetable oil, sugar, tobacco, and cotton. STEs also control exports of maize, rice, cotton, silk, and tobacco. The TRQ system mentioned above specifies criteria for allocating import quotas between STEs and private enterprises. Since 2001, the in-quota shares of STEs have decreased substantially for vegetable oils (palm, rapeseed, and soybean), which corresponds to a relaxation of the TRQs on these products. In contrast, the shares of STEs for imports of maize, cotton, rice, sugar, and wheat have been kept relatively high and fixed. Export quotas are exclusively controlled by the STEs. The continued use of state trading in the import and export of these “strategically important” commodities presumably allows the government to stabilize supply and price in the domestic market.
Since the end of 2007, China has introduced several new agricultural trade policies in response to pressure from high inflation, particularly rising commodity prices, and declining production worldwide. For instance, in early 2008, China’s Ministry of Commerce (MOFCOM) announced a temporary quota policy for the export of wheat, maize and rice powder in order to guarantee an adequate domestic supply. The details of the quota are unspecified, but it will be implemented through a permit policy (MOFCOM 2008). In addition, China’s Ministry of Finance (MOF) announced in late 2007 that China would eliminate export tax rebates (12 percent) on grains and processed grain products (MOF 2007a), and start levying export taxes on these products in the range of 5-25 percent (MOF 2008a). According to the MOF, China will further lower import tariffs for major agricultural products in 2008. The tariff for soybeans was temporarily reduced from 3 percent to 1 percent in October 2007 and the reduced rate will continue to be effective through the end of September 2008 (MOF 2008b).
9
Table 4. China’s TRQs for agricultural products, 2002-2005
2002 2003 2004 2005
Wheat Quota level ('000 tons) 8,468.0 9,052.0 9,636.0 9,636.0 Out-of-quota imports ('000 tons) NA NA NA NA In-quota imports ('000 tons) 632 450 7,260.0 NA State-trading share 90.0 90.0 90.0 90.0 In-quota MFN tariff rate (%) 1-10 1-10 1-10 1-10 Out-of-quota MFN tariff rate (%) 71.0 68 65 65
Corn Quota level ('000 tons) 5,850.0 6,525.0 7,200.0 7,200.0 Out-of-quota imports ('000 tons) NA NA NA NA In-quota imports ('000 tons) 10 <5 <5 NA State-trading share 68.0 64.0 60.0 60.0 In-quota MFN tariff rate (%) 1-10 1-10 1-10 1-10 Out-of-quota MFN tariff rate (%) 28-71 24-68 20-65 20-65
Rice Quota level ('000 tons) 3,990.0 4,655.0 5,320.0 4,767.0 Out-of-quota imports ('000 tons) NA NA NA NA In-quota imports ('000 tons) 237 260 770 NA State-trading share 50.0 50.0 50.0 50.0 In-quota MFN tariff rate (%) 1-9 1-9 1-9 1-9 Out-of-quota MFN tariff rate (%) 22-71 16-68 10-65 10-65
Soybean oil Quota level ('000 tons) 2,518.0 2,818.0 3,587.1 3,587.0 Out-of-quota imports ('000 tons) NA NA NA NA In-quota imports ('000 tons) 870 1,880 2,520 NA State-trading share 34.0 26.0 18.0 10.0 In-quota MFN tariff rate (%) 9.0 9 9.0 9.0 Out-of-quota MFN tariff rate (%) 52.4 41.6 30.7 19.9
Palm oil Quota level ('000 tons) 2,400.0 2,600.0 3,168.0 NA Out-of-quota imports ('000 tons) NA NA NA NA In-quota imports ('000 tons) 1,695 2,330 2,390 NA State-trading share NA NA NA NA In-quota MFN tariff rate (%) 9.0 9 9.0 9.0 Out-of-quota MFN tariff rate (%) 52.4 41.6 30.7 19.9
Rape seed oil Quota level ('000 tons) 878.9 1,018.6 1,243.0 1,243.0 Out-of-quota imports ('000 tons) NA NA NA NA In-quota imports ('000 tons) 78 150 350 NA State-trading share 34.0 26.0 18.0 10.0 In-quota MFN tariff rate (%) 9.0 9.0 9.0 9.0 Out-of-quota MFN tariff rate (%) 52.4 41.6 30.7 19.9
Sugar Quota level ('000 tons) 1,764.0 1,852.0 1,945.0 1,945.0 Out-of-quota imports ('000 tons) NA NA NA NA In-quota imports ('000 tons) 1,183 780 1,210 NA State-trading share 70.0 70.0 70.0 70.0 In-quota MFN tariff rate (%) 20.0 20.0 15.0 15.0 Out-of-quota MFN tariff rate (%) 65.9 58.0 50.0 50.0
Cotton Quota level ('000 tons)1 818.5 856.3 +500 894.0
+1,000 894.0
+1,400 Out-of-quota imports ('000 tons) NA NA NA NA In-quota imports ('000 tons) 177 870 1,910 NA State-trading share 33.0 33.0 33.0 33.0 In-quota MFN tariff rate (%) 1.0 1.0 1.0 1.0 Out-of-quota MFN tariff rate (%) 54.4 47.2 40.0 40.0
Source: WTO, 2006. Note: 1. Quota levels for cotton were increased during 2003-2005; NA – Not Available
10
3.3. Domestic Policies The post-WTO accession domestic agricultural policy regime in China was characterized by the relaxation of price and marketing controls, the expansion of government subsidies and investments, and the elimination of agricultural taxes. Following the liberalization of non-strategic agricultural products including fruits, vegetables, livestock and fish in the 1980s and “important reserved materials” including cotton, vegetable oil, and sugar in the late 1990s and early 2000s, price and marketing controls were kept only for grain and tobacco. According to China’s WTO accession protocol, tobacco was subject to “state pricing” and grains to “government guidance pricing.” At present, China’s tobacco industry remains a state monopoly, with rigid control of production, price, marketing and trade. In contrast, government intervention in grain has been gradually minimized.
Prior to 1997, Chinese farmers were required to deliver a fixed amount (quota) of grain at a procurement price (quota price). Farmers could sell surplus output either to the grain bureaus at a negotiated price or directly to the market; hence there existed a parallel free market price along with the government price. In 1998, the state procurement quota system was dismantled and farmers were allowed to sell any amount voluntarily to the state-owned grain bureaus at a pre-set protective price. Selling to individuals or private firms was no longer permitted. The protective price scheme was gradually eliminated in the years that followed, but in order to give farmers an incentive to continue growing grains, a minimum price was set, initially for rice in 2004 and then extended to wheat in 2005. In 2006 and 2007, the minimum price for rice was set at RMB1400-1500/ton while that for wheat was RMB1380-1440/ton. These prices were increased in 2008 to RMB1540-1640/ton and 1440-1540/ton for rice and wheat, respectively. Relaxation of grain price controls was accompanied by changing functionality of the grain bureaus, which until the mid-1980s had dominated upstream and downstream distribution of agricultural products. Currently, the grain bureaus are largely decentralized and commercialized, with their roles largely restricted to the provision of information and the maintenance of strategic stocks (with the exception of tobacco). Private grain users (e.g., grain processors, feed manufacturers) and traders are generally allowed to enter the marketing channel.
In recent years, China has strengthened its support for agriculture by subsidizing agricultural inputs, including machinery, fertilizers, pesticides, electricity, fuels, water, and transportation. Charges for such inputs as fuels, water, electricity and transport tend to be lower for farmers, but the level of subsidy is difficult to assess as the cost of provision is different across various users. For instance, to lower prices of fertilizers, fertilizer producers have been given access to lower priced inputs, such as electricity. In addition, export taxes, temporary exemptions from Value-added Tax (VAT) and caps on sales prices are occasionally used to curb rises in fertilizer prices. In 2002, the government introduced a subsidy for farmers purchasing improved quality soy seed (through lower prices). In 2004 and 2005, this scheme was extended to include subsidies for purchasing improved seed for production of wheat, corn and rice, as well as soybeans. Annual seed subsidies reached RMB2.85 and 3.87 billion in 2004 and 2005, respectively (MOA 2006). The government also provides a small subsidy for the purchase of farm machinery (RMB0.07 and 0.3 billion in 2004 and 2005, respectively).
China has recently experimented with direct payment policies. Direct payment tied to grain acreage was put in place in 2002 in selected major grain-producing provinces: Anhui, Henan, Hubei, and Jilin (Gale, Lohmar, and Tuan 2005). China introduced its first nationwide direct payments to farmers in 2004. In 2005, the program covered 30 provinces. The payment rates vary across provinces, but on average they were RMB10 per mu (1/15 hectare) in 2004 and since then have increased to RMB12-14 per mu in 2007. The total grain direct payments reached RMB11.6 and 13.2 billion in 2004 and 2005, respectively, according to China’s Ministry of Finance. In 2006, direct payments were RMB14.2 billion, an increase of 8 percent over the 2005 level. According to Chinese authorities, direct payments to farmers will be continued and strengthened in the coming years (MOF 2007b).
In line with the move to help farmers, China has either eliminated or reduced various taxes on agriculture.2 The tax on specialty crops (except for tobacco) was first removed, resulting in a RMB9
2 Besides taxes, China also eliminated a myriad of fees levied on farmers to fund road construction, schools, and various
other projects and services undertaken by village and township authorities (Gale, Lohmar, and Tuan 2005).
11
billion benefit to farmers in 2004. After two years of phasing-in, the government completely abolished the agricultural tax at the beginning of 2006. When the reductions in these two taxes are combined, the total annual tax savings for farmers in 2004 and 2005 were RMB18.2 and 18.3 billion, respectively (MOA 2006). It should be noted, however, that taxes on agriculture as a whole have increased in the two years when tax reforms occurred. This is due to increases in contract tax and tax on the use of cultivated land, which have very limited impacts on farmers.3 Therefore, exemption from various agricultural taxes has effectively reduced the amount farmers would otherwise have to pay and the absolute tax burden on farmers has been alleviated.
Investment in agriculture-related projects is a major instrument for China to achieve rural development targets and is by far the largest component in government budgetary support for agriculture. Projects include spending on production infrastructure, such as improved irrigation facilities, rural hydroelectric plants, pasture enclosures, research, and construction of agricultural high-technology parks. China also boosts farm investment through a system of 35,000 rural credit cooperatives and state-owned commercial and policy banks (e.g., the Agricultural Bank of China and the Agricultural Development Bank of China). These financial institutions have provided preferential loans to rural areas.
3 Both taxes are related to the conversion of cultivated land to non-agricultural usage.
12
4. PAST AND SHADOW WTO NOTIFICATIONS
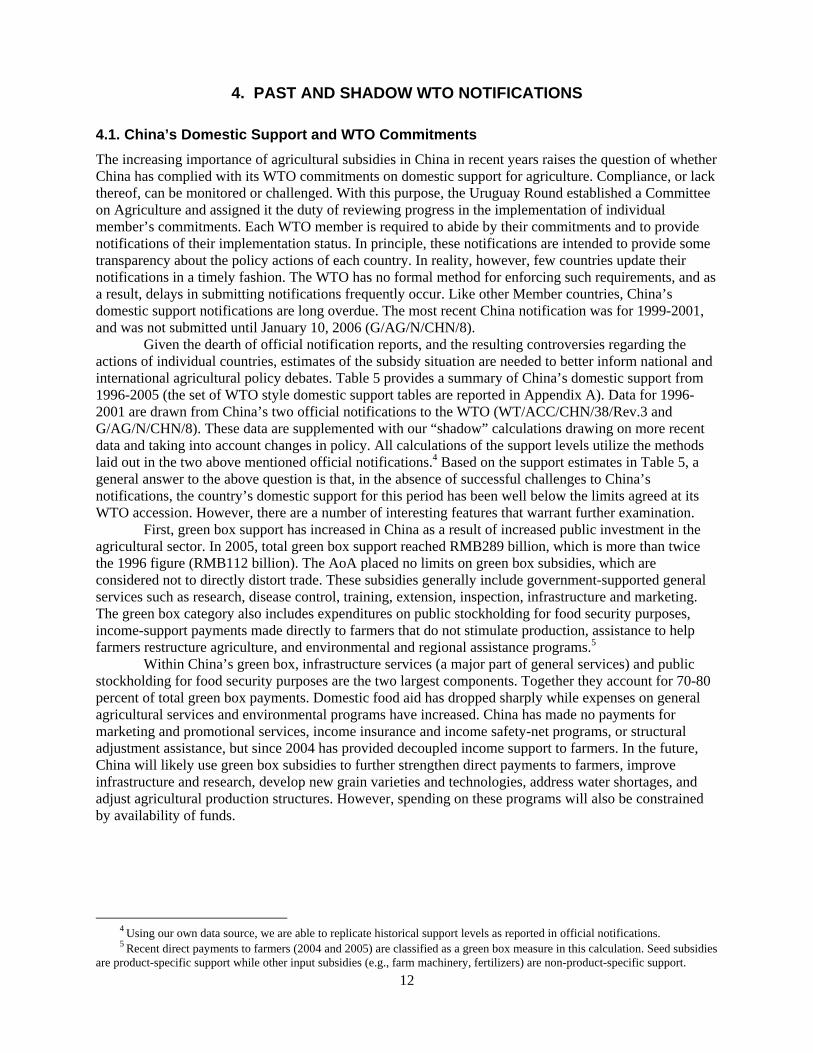
4.1. China’s Domestic Support and WTO Commitments The increasing importance of agricultural subsidies in China in recent years raises the question of whether China has complied with its WTO commitments on domestic support for agriculture. Compliance, or lack thereof, can be monitored or challenged. With this purpose, the Uruguay Round established a Committee on Agriculture and assigned it the duty of reviewing progress in the implementation of individual member’s commitments. Each WTO member is required to abide by their commitments and to provide notifications of their implementation status. In principle, these notifications are intended to provide some transparency about the policy actions of each country. In reality, however, few countries update their notifications in a timely fashion. The WTO has no formal method for enforcing such requirements, and as a result, delays in submitting notifications frequently occur. Like other Member countries, China’s domestic support notifications are long overdue. The most recent China notification was for 1999-2001, and was not submitted until January 10, 2006 (G/AG/N/CHN/8).
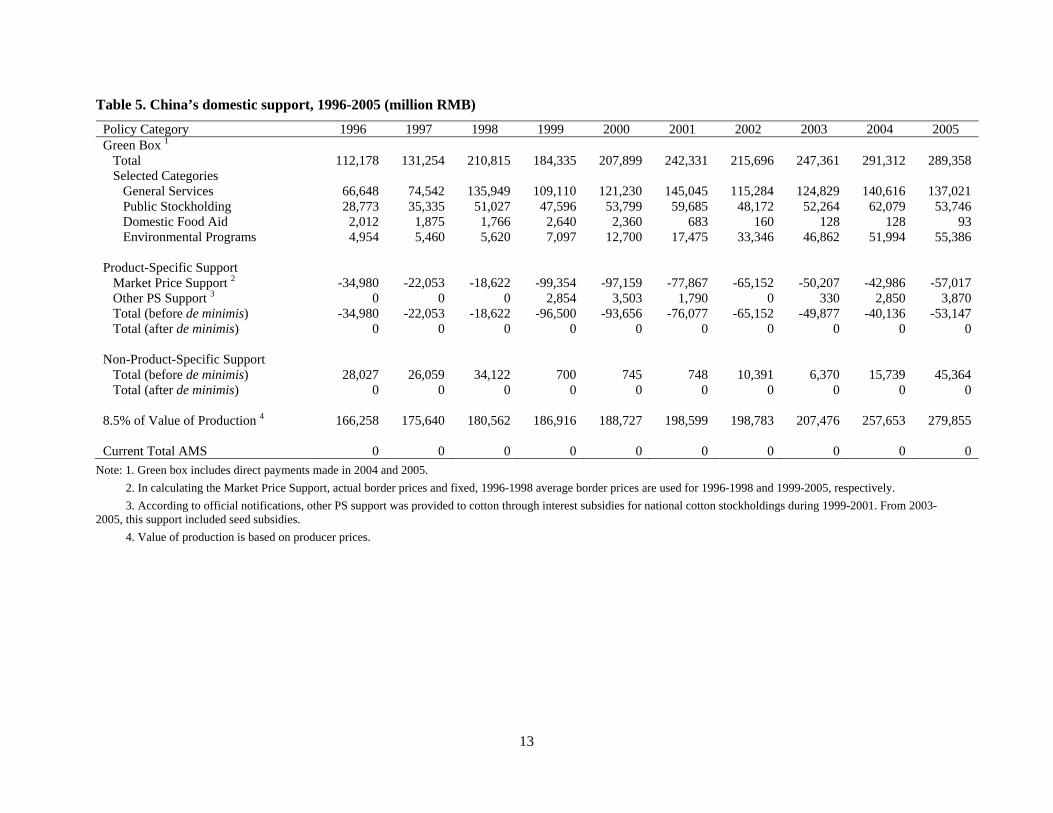
Given the dearth of official notification reports, and the resulting controversies regarding the actions of individual countries, estimates of the subsidy situation are needed to better inform national and international agricultural policy debates. Table 5 provides a summary of China’s domestic support from 1996-2005 (the set of WTO style domestic support tables are reported in Appendix A). Data for 1996-2001 are drawn from China’s two official notifications to the WTO (WT/ACC/CHN/38/Rev.3 and G/AG/N/CHN/8). These data are supplemented with our “shadow” calculations drawing on more recent data and taking into account changes in policy. All calculations of the support levels utilize the methods laid out in the two above mentioned official notifications.4 Based on the support estimates in Table 5, a general answer to the above question is that, in the absence of successful challenges to China’s notifications, the country’s domestic support for this period has been well below the limits agreed at its WTO accession. However, there are a number of interesting features that warrant further examination.
First, green box support has increased in China as a result of increased public investment in the agricultural sector. In 2005, total green box support reached RMB289 billion, which is more than twice the 1996 figure (RMB112 billion). The AoA placed no limits on green box subsidies, which are considered not to directly distort trade. These subsidies generally include government-supported general services such as research, disease control, training, extension, inspection, infrastructure and marketing. The green box category also includes expenditures on public stockholding for food security purposes, income-support payments made directly to farmers that do not stimulate production, assistance to help farmers restructure agriculture, and environmental and regional assistance programs.5
Within China’s green box, infrastructure services (a major part of general services) and public stockholding for food security purposes are the two largest components. Together they account for 70-80 percent of total green box payments. Domestic food aid has dropped sharply while expenses on general agricultural services and environmental programs have increased. China has made no payments for marketing and promotional services, income insurance and income safety-net programs, or structural adjustment assistance, but since 2004 has provided decoupled income support to farmers. In the future, China will likely use green box subsidies to further strengthen direct payments to farmers, improve infrastructure and research, develop new grain varieties and technologies, address water shortages, and adjust agricultural production structures. However, spending on these programs will also be constrained by availability of funds.
4 Using our own data source, we are able to replicate historical support levels as reported in official notifications. 5 Recent direct payments to farmers (2004 and 2005) are classified as a green box measure in this calculation. Seed subsidies
are product-specific support while other input subsidies (e.g., farm machinery, fertilizers) are non-product-specific support.
13
Table 5. China’s domestic support, 1996-2005 (million RMB)
Policy Category 1996 1997 1998 1999 2000 2001 2002 2003 2004 2005 Green Box 1 Total 112,178 131,254 210,815 184,335 207,899 242,331 215,696 247,361 291,312 289,358 Selected Categories General Services 66,648 74,542 135,949 109,110 121,230 145,045 115,284 124,829 140,616 137,021 Public Stockholding 28,773 35,335 51,027 47,596 53,799 59,685 48,172 52,264 62,079 53,746 Domestic Food Aid 2,012 1,875 1,766 2,640 2,360 683 160 128 128 93 Environmental Programs 4,954 5,460 5,620 7,097 12,700 17,475 33,346 46,862 51,994 55,386 Product-Specific Support Market Price Support 2 -34,980 -22,053 -18,622 -99,354 -97,159 -77,867 -65,152 -50,207 -42,986 -57,017 Other PS Support 3 0 0 0 2,854 3,503 1,790 0 330 2,850 3,870 Total (before de minimis) -34,980 -22,053 -18,622 -96,500 -93,656 -76,077 -65,152 -49,877 -40,136 -53,147 Total (after de minimis) 0 0 0 0 0 0 0 0 0 0 Non-Product-Specific Support Total (before de minimis) 28,027 26,059 34,122 700 745 748 10,391 6,370 15,739 45,364 Total (after de minimis) 0 0 0 0 0 0 0 0 0 0 8.5% of Value of Production 4 166,258 175,640 180,562 186,916 188,727 198,599 198,783 207,476 257,653 279,855 Current Total AMS 0 0 0 0 0 0 0 0 0 0
Note: 1. Green box includes direct payments made in 2004 and 2005. 2. In calculating the Market Price Support, actual border prices and fixed, 1996-1998 average border prices are used for 1996-1998 and 1999-2005, respectively. 3. According to official notifications, other PS support was provided to cotton through interest subsidies for national cotton stockholdings during 1999-2001. From 2003-2005, this support included seed subsidies. 4. Value of production is based on producer prices.
14
Second, China has a zero current total aggregate measure of support (AMS) during the period examined. Since no total AMS commitment exists in Part IV of China’s Schedule, the country can only provide support to agricultural producers up to the relevant de minimis level. The de minimis exemption on the AMS provided to a developing country member is generally set at 10 percent of the member’s value of production (VOP), product-wise for product-specific (PS) support or in total for non-product-specific (NPS) support. In the case of China, this exemption is 8.5 percent as specified in its WTO accession agreement. Any subsidy amount over this de minimis limit would be considered a violation of China’s WTO commitments. It seems, however, that to date neither the PS de minimis nor the NPS de minimis has imposed real constraints on domestic support measures in China because of the large value of agricultural production.
Although China’s subsidy level is far from the binding level by the de minimis, setting the percentage de minimis level was a major hurdle in the final phase of China’s WTO membership negotiations. Both sides, China and its negotiating counterparts led by US delegates, struggled to resolve their differences. The disputes, in retrospect, were more procedural rather than substantive, as the de minimis level has never been exceeded either by PS support or by NPS support in the historical period. In fact, when strictly calculated using the WTO definition and methodology (e.g., fixed reference prices at 1996-1998), the domestic support level has been far below zero for PS support (before de minimis) as a result of a large, negative Market Price Support (MPS). For NPS support, given China’s enormous agricultural sector, there is little chance that this type of support can surpass 8.5 percent of the total value of agricultural production. During 1996-2005, NPS support (before de minimis), consisting of input and interest subsidies, accounted for an average of only 1 percent of the total value of production. Given a total agricultural production of RMB3,300 billion in 2005, China can potentially pay trade-distorting subsidies up to a maximum of RMB561 billion (PS and NPS de minimis combined). Thus there appears to be substantial room for China to extend its amber box subsidy measures. Like the US, China may become a heavy user of de minimis provisions to shield subsidies from being cut back.
Third, China has given up the right as a developing country to use “special and differential treatment” (as provided in Article 6.2 of the AoA) to report subsidy measures that are exempt from the reduction commitments. This is in contrast to many other developing country members which have reported in this category subsidies that are claimed to be “development programs” and targeted at “low-income or resource poor farmers.”6 In its accession documents, China recognized the need to provide support of this type. However, it decided to include the amount of the support in the calculation of the AMS, effectively sealing off its own right under the AoA to introduce exempt S&D subsidies on agriculture in the future should this be judged necessary in order to protect the livelihoods of poor farmers or to achieve development priorities. This, the 8.5 percent de minimis and other commitments are accompanied by compromises China accepted in return for its WTO membership, which reflect both WTO+ and WTO- at work (Evenett and Braga 2005).7 In recent acceding countries including China have clearly negotiated with existing members.
Like other Member countries, China is eligible to use blue box payments (e.g., those that are associated with production limitation criteria). At present there is no cap on spending in this box. In China’s official notifications and our replication, the blue box is zero, meaning that China has not provided such subsidies. However, should future support paid in the current forms approach or even exceed the exemption ceilings in the amber box (i.e., the de minimis), China may have to redesign its support programs to make them comply with these limits. One way of doing so without cutting spending is to switch from amber box trade/production-distorting support instruments to less distorting blue box payments (or decoupled instruments which can be classified as green box payments).
6 There is no indication on how low-income or resource-poor farmers are defined in the AoA, which gives countries some
flexibility in notifying these measures. 7 WTO+ stands for additional commitments that go beyond the ones agreed to by the incumbent countries (WTO+
commitments) and WTO– denotes forgone rights available to other WTO members (WTO– rights).
15
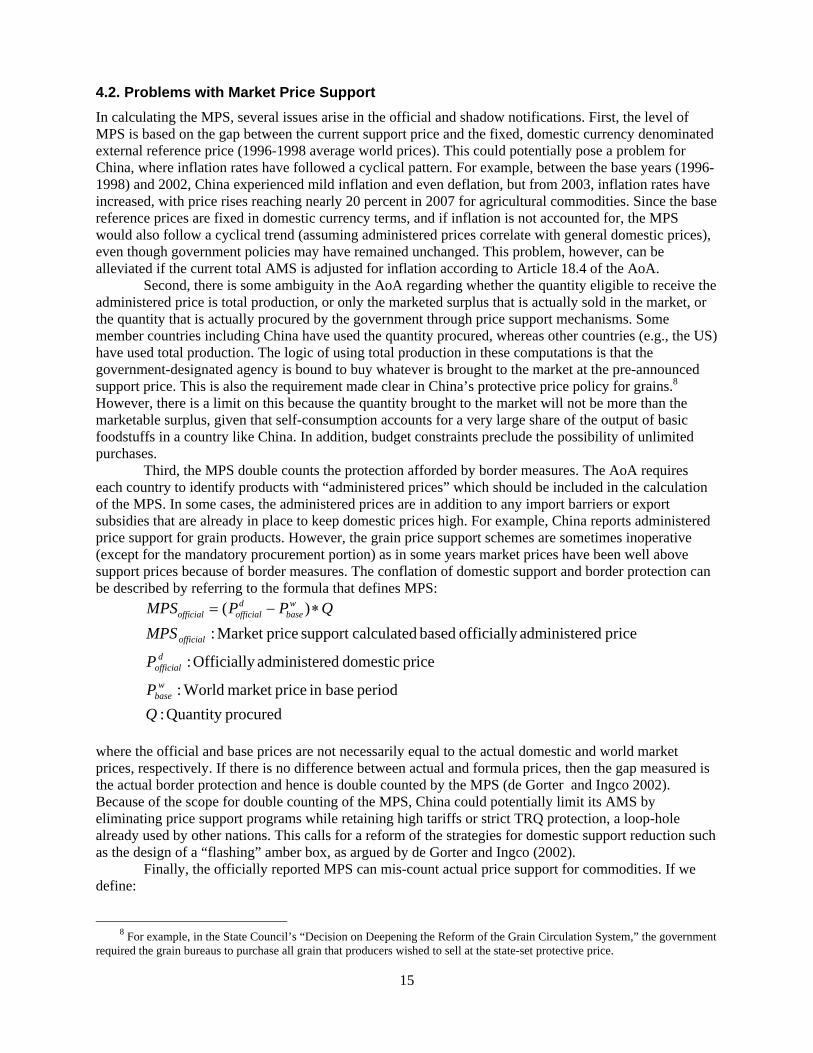
4.2. Problems with Market Price Support In calculating the MPS, several issues arise in the official and shadow notifications. First, the level of MPS is based on the gap between the current support price and the fixed, domestic currency denominated external reference price (1996-1998 average world prices). This could potentially pose a problem for China, where inflation rates have followed a cyclical pattern. For example, between the base years (1996-1998) and 2002, China experienced mild inflation and even deflation, but from 2003, inflation rates have increased, with price rises reaching nearly 20 percent in 2007 for agricultural commodities. Since the base reference prices are fixed in domestic currency terms, and if inflation is not accounted for, the MPS would also follow a cyclical trend (assuming administered prices correlate with general domestic prices), even though government policies may have remained unchanged. This problem, however, can be alleviated if the current total AMS is adjusted for inflation according to Article 18.4 of the AoA.
Second, there is some ambiguity in the AoA regarding whether the quantity eligible to receive the administered price is total production, or only the marketed surplus that is actually sold in the market, or the quantity that is actually procured by the government through price support mechanisms. Some member countries including China have used the quantity procured, whereas other countries (e.g., the US) have used total production. The logic of using total production in these computations is that the government-designated agency is bound to buy whatever is brought to the market at the pre-announced support price. This is also the requirement made clear in China’s protective price policy for grains.8
However, there is a limit on this because the quantity brought to the market will not be more than the marketable surplus, given that self-consumption accounts for a very large share of the output of basic foodstuffs in a country like China. In addition, budget constraints preclude the possibility of unlimited purchases.
Third, the MPS double counts the protection afforded by border measures. The AoA requires each country to identify products with “administered prices” which should be included in the calculation of the MPS. In some cases, the administered prices are in addition to any import barriers or export subsidies that are already in place to keep domestic prices high. For example, China reports administered price support for grain products. However, the grain price support schemes are sometimes inoperative (except for the mandatory procurement portion) as in some years market prices have been well above support prices because of border measures. The conflation of domestic support and border protection can be described by referring to the formula that defines MPS:
( )d wofficial official baseMPS P P Q= − ∗
procuredQuantity :period basein pricemarket World:
price domestic edadminister Officially :
price edadminister officially based calculatedsupport priceMarket :
QP
P
MPS
wbase
dofficial
official
where the official and base prices are not necessarily equal to the actual domestic and world market prices, respectively. If there is no difference between actual and formula prices, then the gap measured is the actual border protection and hence is double counted by the MPS (de Gorter and Ingco 2002). Because of the scope for double counting of the MPS, China could potentially limit its AMS by eliminating price support programs while retaining high tariffs or strict TRQ protection, a loop-hole already used by other nations. This calls for a reform of the strategies for domestic support reduction such as the design of a “flashing” amber box, as argued by de Gorter and Ingco (2002).
Finally, the officially reported MPS can mis-count actual price support for commodities. If we define:
8 For example, in the State Council’s “Decision on Deepening the Reform of the Grain Circulation System,” the government
required the grain bureaus to purchase all grain that producers wished to sell at the state-set protective price.
16
( )d wactual actual actualMPS P P Q= − ∗ , then
Over(under) Counting official actualMPS MPS= − .
Over- or under-counting can occur due to changes in the official domestic support price, the actual world price, the domestic actual market price, and the exchange rate. If d d
actual officialP P= and
( )w wactual baseP P> < , then actual support has declined (risen) and so the officialMPS overcounts
(undercounts). If w wactual baseP P= and ( )d d
actual officialP P< > , then actual support has declined (risen) and so the
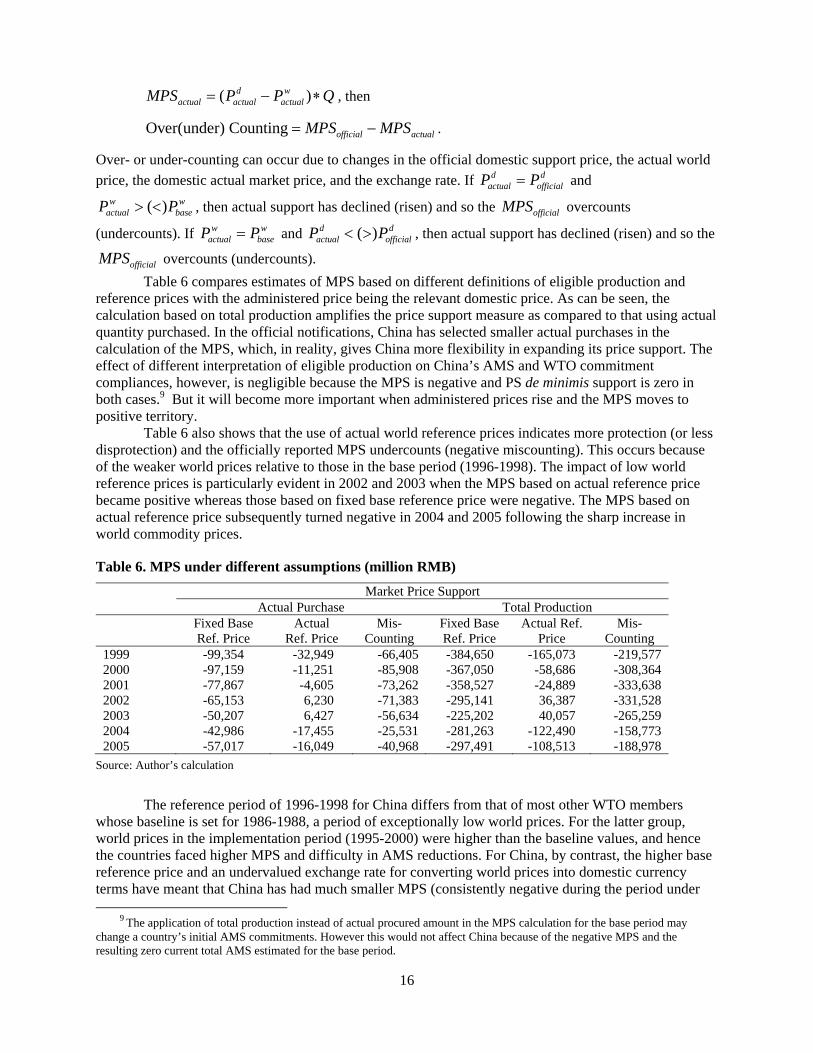
officialMPS overcounts (undercounts). Table 6 compares estimates of MPS based on different definitions of eligible production and
reference prices with the administered price being the relevant domestic price. As can be seen, the calculation based on total production amplifies the price support measure as compared to that using actual quantity purchased. In the official notifications, China has selected smaller actual purchases in the calculation of the MPS, which, in reality, gives China more flexibility in expanding its price support. The effect of different interpretation of eligible production on China’s AMS and WTO commitment compliances, however, is negligible because the MPS is negative and PS de minimis support is zero in both cases.9 But it will become more important when administered prices rise and the MPS moves to positive territory.
Table 6 also shows that the use of actual world reference prices indicates more protection (or less disprotection) and the officially reported MPS undercounts (negative miscounting). This occurs because of the weaker world prices relative to those in the base period (1996-1998). The impact of low world reference prices is particularly evident in 2002 and 2003 when the MPS based on actual reference price became positive whereas those based on fixed base reference price were negative. The MPS based on actual reference price subsequently turned negative in 2004 and 2005 following the sharp increase in world commodity prices.
Table 6. MPS under different assumptions (million RMB)
Market Price Support Actual Purchase Total Production Fixed Base
Ref. Price Actual
Ref. Price Mis-
Counting Fixed Base Ref. Price
Actual Ref. Price
Mis- Counting
1999 -99,354 -32,949 -66,405 -384,650 -165,073 -219,577 2000 -97,159 -11,251 -85,908 -367,050 -58,686 -308,364 2001 -77,867 -4,605 -73,262 -358,527 -24,889 -333,638 2002 -65,153 6,230 -71,383 -295,141 36,387 -331,528 2003 -50,207 6,427 -56,634 -225,202 40,057 -265,259 2004 -42,986 -17,455 -25,531 -281,263 -122,490 -158,773 2005 -57,017 -16,049 -40,968 -297,491 -108,513 -188,978
Source: Author’s calculation
The reference period of 1996-1998 for China differs from that of most other WTO members whose baseline is set for 1986-1988, a period of exceptionally low world prices. For the latter group, world prices in the implementation period (1995-2000) were higher than the baseline values, and hence the countries faced higher MPS and difficulty in AMS reductions. For China, by contrast, the higher base reference price and an undervalued exchange rate for converting world prices into domestic currency terms have meant that China has had much smaller MPS (consistently negative during the period under
9 The application of total production instead of actual procured amount in the MPS calculation for the base period may change a country’s initial AMS commitments. However this would not affect China because of the negative MPS and the resulting zero current total AMS estimated for the base period.
17
examination) and thus less difficulty in containing its AMS under its commitments. On the other hand, if world commodity prices were to resume their secular decline over time, the implied support from administered price (along with consumer transfers and border protection) will increase, even though the measured support in the AMS will not. This may have implications for the effectiveness of China’s WTO commitments.
Continued appreciation of the Chinese currency would add to this problem. Between 2005 and 2007, the Chinese RMB nominal exchange rate appreciated 12 percent against the US dollar and is expected to revalue even further (Goldstein 2007). The literature has suggested an undervaluation of the currency still in the range of 20 percent or more (Cheng and Orden 2007; Frankel 2006). Were the appreciation trend to continue, it would make the actual MPS (based on the prevailing exchange rate and world reference prices) diverge further from the notified MPS (calculated using the exchange rate and world reference prices in the base period). The magnitude of the difference will depend on how actual world reference prices and the exchange rate change and the degree to which exchange rate fluctuations pass through to domestic and administered prices.
4.3. The Nature of Direct Payments Controversies may arise from different interpretations of the subsidy policies and their classification in a WTO notification. Alternative subsidy definitions could affect the calculated levels of support and make otherwise unbinding commitments become binding. WTO members tend to have incentives not to notify or to mis-notify trade-distorting subsidy components because a notification of “amber box” measures amounts to an admission that the measures are subject to caps, reductions, and other disciplines. Typically, countries choose a notification scheme that best makes them appear compliant with WTO rules and then wait to see whether their measures are challenged in dispute settlement. There have been a number of complaints against such practices that have been brought to the WTO, mostly in regard to the practices of developed countries. For developing countries, non-notification or mis-notification issues also exist but are seldom challenged.
For China, a critical issue is whether its direct payments to farmers meet WTO green box criteria. Although our calculation has assumed these payments to be green box measures and therefore exempt, which is likely to be the case in future official notifications, it is far from clear whether they should be so categorized. According to the AoA, for a program to be classified as green box support, it must not distort trade, or at most cause minimal distortion (paragraph 1). The program must be publicly funded, not involve transfers from consumers, and not have the effect of providing price support to producers. In addition to these fundamental requirements, a program has to meet specific policy criteria, which are contained in Annex 2 to the AoA (the green box).
Specifically, the criteria include: (a) Eligibility for the payments shall be determined by clearly-defined criteria such as income, status as a producer or landowner, factor use or production level in a defined and fixed base period. (b) The amount of such payments in any given year shall not be related to, or based on, the type or volume of production (including livestock units) undertaken by the producer in any year after the base period. (c) The amount of such payments in any given year shall not be related to, or based on, the prices, domestic or international, applying to any production undertaken in any year after the base period. (d) The amount of such payments in any given year shall not be related to, or based on, the factors of production employed in any year after the base period. (e) No production shall be required in order to receive such payments. If a direct payment program does not meet these criteria, it must be reported to the WTO under the amber box (or possibly the blue box).
It appears that direct payments in China would violate a number of these provisions. Various methods have been used in China to provide payments to farmers, ranging from fixed subsidies not tied to the current year’s production or marketing to those that are tied to market prices or production. Fixed subsidies were based on either historical household deliveries of grain to the government, historical grain production from the household’s allocated land based on local tax records, or the actual production or marketing of grain. Thus, the fixed subsidies cannot be completely classified as green box measures as some of them are likely linked to production. In some provinces, price subsidies were used instead of
18
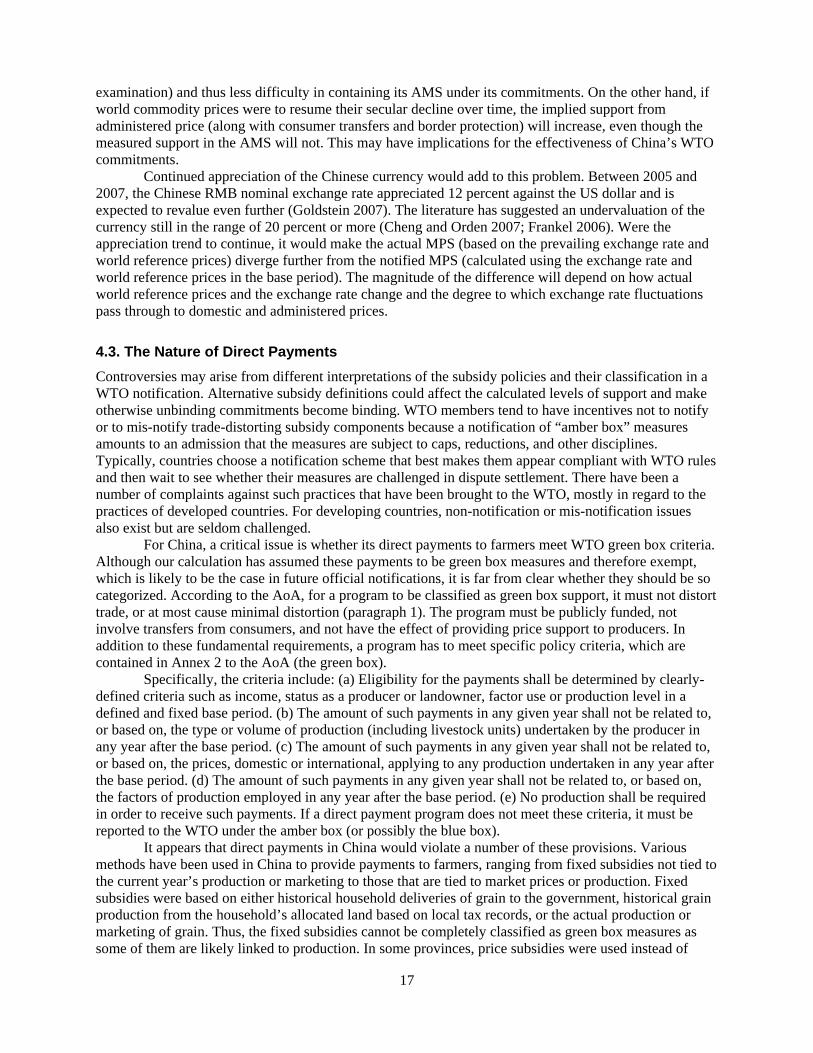
fixed subsidies. Price subsidies paid farmers the difference between a target price set by the government and a market price, which is equivalent to providing price support to farmers. This subsidy resembles two PS support components reported in the US WTO notification: “marketing loan benefits” when all outputs are eligible or “counter-cyclical payments” when only fixed base acreage is applicable. Using payment rates reported by Gale, Lohmar, and Tuan (2005) for wheat, rice and corn, Table 7 shows the potential non-exempt direct payments to farmers of these crops in 2004 and 2005 and the PS support. Because of the large negative MPS, the inclusion of these payments does not have an impact on the PS support after applying de minimis rules. However, if in the future China strengthens its direct payments and the MPS is positive, both of which are likely to occur given the current commodity boom, the PS de minimis will become a binding factor. This is shown in the next section.
Table 7. Non-exempt direct payments to farmers and product specific support
Payment Rate
Eligible Production
Non-exempt payments
MPS
PS Support (before de minimis)
8.5% (keep ‘%’)
of VOP
PS Support (after de minimis)
RMB/ton 000’ tons ---- Million RMB ---- 2004 Wheat 48.0 91,952 4,416 -7,193 -2,777 11,641 0 Rice 27.3 179,088 4,893 -26,919 -22,025 24,301 0 Corn 17.4 130,287 2,265 -8,874 -6,609 10,997 0 Total -- 401,327 11,574 -42,986 -31,411 46,939 0
2005 Wheat 50.5 97,445 4,922 -11,902 -6,980 11,432 0 Rice 29.8 180,588 5,383 -32,385 -27,002 23,842 0 Corn 20.7 139,365 2,885 -12,729 -9,844 12,154 0 Total -- 417,398 13,190 -57,016 -43,826 47,428 0
Source: Author’s calculation Note: Other non-exempt PS support is not reported.
The recent WTO panel and Appellate Body ruling in the Brazil/US upland cotton case (WT/DS267/R; WT/DS267/AB/R) makes the claim that the direct payments in China are green box measures even less convincing. In that case (DS267), Brazil brought a complaint against certain aspects of the cotton policies of the United States and a key issue was whether the direct payments provided by the US actually have an impact on production. As the payments were conditional on producers not planting certain commodities (specifically fruits, vegetables and wild rice) on the land upon which payments were based, the panel concluded that the US direct payments do not fully conform to the guidelines for green box direct payments. By the same argument, Chinese direct payments would not satisfy the green box requirements because farmers have to be current grain producers in order to receive the payments.
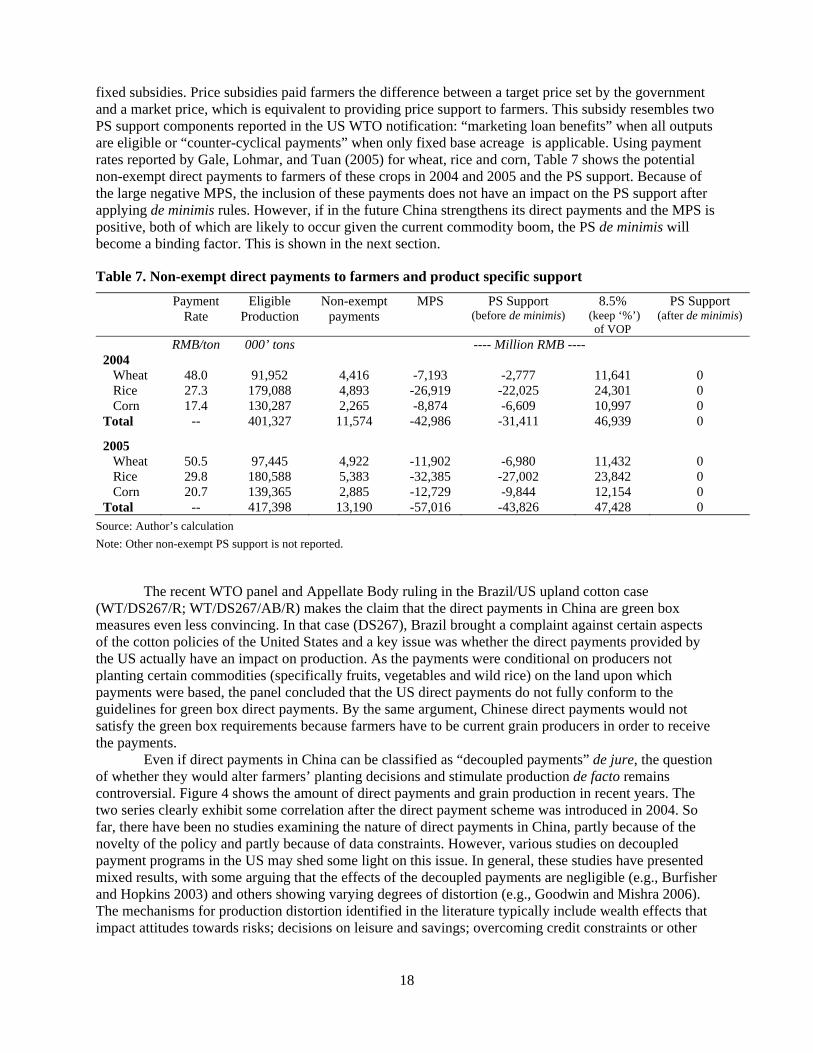
Even if direct payments in China can be classified as “decoupled payments” de jure, the question of whether they would alter farmers’ planting decisions and stimulate production de facto remains controversial. Figure 4 shows the amount of direct payments and grain production in recent years. The two series clearly exhibit some correlation after the direct payment scheme was introduced in 2004. So far, there have been no studies examining the nature of direct payments in China, partly because of the novelty of the policy and partly because of data constraints. However, various studies on decoupled payment programs in the US may shed some light on this issue. In general, these studies have presented mixed results, with some arguing that the effects of the decoupled payments are negligible (e.g., Burfisher and Hopkins 2003) and others showing varying degrees of distortion (e.g., Goodwin and Mishra 2006). The mechanisms for production distortion identified in the literature typically include wealth effects that impact attitudes towards risks; decisions on leisure and savings; overcoming credit constraints or other
19
input market imperfections; coverage of short-run production costs; and farmers’ expectation about future government decisions on agricultural policy (Abler and Blandford 2005).
Figure 4. Direct payments and grain production
400
410
420
430
440
450
460
470
480
490
500
0
2
4
6
8
10
12
14
16
2000 2001 2002 2003 2004 2005 2006
Mill
ion
Met
ric T
ons
Billi
on R
MB
Direct Payments (left axis) Grain Production (right axis)
Source: Author’s calculation.
4.4. Adjustments in NPS Support
Reported Input Subsidies
The use of government budgetary outlays to state-owned agricultural input manufacturers (consisting of fertilizer, pesticide and mulching film producers) as NPS support in notifications is permitted by the AoA, although it over-simplifies the calculations.10 Currently, government subsidies to input firms are provided through a combination of direct budgetary payments, VAT rebates (e.g., fertilizer firms are generally given 50 percent VAT rebate), cash subsidies (e.g., firms producing or importing diammonium phosphate (DAP) received RMB100 per ton of DAP in 2004) and other implicit subsidies through lowered transportation and electricity charges. It is thus difficult to assess the total government subsidies (both direct and indirect) that benefit farmers, who usually feel the effects through reduced ex-factory or purchase prices of agricultural inputs.
It is also difficult to determine how much government subsidies actually end up with farmers. Some speculate that in China much of the government subsidies are used to cover losses resulting from inefficient operations; others argue that the subsidies have become part of the profits, even though the profit margin allowed by the government is relatively small. In both cases, however, subsidies are not fully transferred into lowered input prices that farmers pay. According to the AoA, subsidy measures directed to entities other than producers “shall be included to the extent that such measures benefit the producers of the basic agricultural products” (Annex 3, paragraph 7). Thus, one could argue a downward adjustment of budgetary outlays has to be made to reflect actual subsidies to farmers.
Generally speaking, government input subsidies are distributed between input producers and consumers (farmers in this case) with the extent of each depending on supply and demand elasticities. A rough estimate of subsidies that accrue to farmers can be made by comparing the subsidized prices with the higher, subsidy-free prices. This is consistent with the AoA provision “where the use of budgetary
10 Paragraph 13 in Annex 3 of the AoA stipulates that “other non-exempt measures, including input subsidies and other
measures such as marketing-cost reduction measures: the value of such measures shall be measured using government budgetary outlays….”
20
outlays does not reflect the full extent of the subsidy concerned, the basis for calculating the subsidy shall be the gap between the price of the subsidized good or service and a representative market price for a similar good or service multiplied by the quantity of the good or service.” (Annex 3, paragraph 13). In the absence of other distorting factors, the representative market (or subsidy-free) prices would be the relevant world prices, adjusted for transportation and distribution costs. This price gap method, however, can be applied to estimate subsidies that reduce the end-use price of inputs, omitting from consideration other measures that actually raise the price of inputs to the users. These “other” measures typically refer to border measures, which, when present, would make subsidy-free prices differ from the comparable world reference prices.
In China, the input manufacturing industry has long been protected from foreign competition (Qiao et al. 2003). Imports of agricultural inputs such as fertilizers are subject to TRQs and state trading, which have kept domestic prices high. In some years, domestic agricultural input prices are higher than world reference prices, even after subsidization (and thus the net policy effect is a taxation of consumers of agricultural inputs). In this case, world prices cannot be used as a proper reference price to gauge price gaps as a result of subsidies. Instead, counterfactual simulations are sometimes needed in order to obtain the correct subsidy-free prices. One such counterfactual assessment, based on the Policy Analysis Matrix for Chinese agriculture, indicated that subsidies reduced input prices by between 13 and 30 percent on average between 1996-1998 (Fang and Beghin 2000). However, in recent years, agricultural input prices have risen at a faster rate than overall price inflation, suggesting that the effects of subsidies may have declined.
Agricultural Taxes
NPS support needs to be further adjusted to take into account various missing components in the notification, including agricultural taxes and subsidies related to irrigation, electricity and fuel (to be discussed below). There are two views as to how to incorporate agricultural taxes in the notification. One view holds that the taxes paid by farmers need to be subtracted from the NPS support. Compared to other countries, China may be the only one in the world to levy a high agricultural tax rate on farmers, which had stood as high as an average of 8 percent recently. Table 7 shows the various agricultural taxes from 1990-2005.
Not only are agricultural taxes burdensome, but they are levied differently from taxes on other sectors of the economy. For instance, agricultural taxes are levied exclusively on farmers. For instance, China’s urban taxes are generally levied on net profits, which allows adjustments for costs. In contrast, agricultural taxes are based on the amount of cultivated land and number of family members; hence farmers are obliged to pay the same amount of taxes both in prosperous and lean years. According to the AoA, specific agricultural levies or fees paid by producers should be deducted from the AMS (Annex 3, paragraph 4). As contract taxes and taxes on the use of cultivated land do not directly affect farmers, the deduction should at least include agricultural taxes, animal husbandry taxes and taxes on special agricultural products. These three taxes added up to RMB42.4 billion in 2003, but dropped sharply to less than RMB6 billion in 2005.
A different view is that agricultural taxes should not be deducted from the AMS; rather, the elimination of these taxes should be counted as a subsidy. The AoA stipulates that trade distorting subsidies include “revenues forgone by governments or their agents” in addition to budgetary outlays. The agricultural tax exemption by its very nature seems to meet this requirement as the government has “foregone revenue” that would otherwise be due. The drops in the amount of agricultural tax and animal husbandry tax combined in 2004 and 2005 were RMB9,222 million and RMB18,259 million, respectively.

21
Table 8. Agricultural taxes in China, 1990-2005 (million RMB)
Year Total Agricultural tax and animal
husbandry tax
Contract tax Tax on special agricultural
products
Tax on use of cultivated land
1990 8,786 5,962 118 1,249 1,457 1991 9,065 5,665 189 1,425 1,786 1992 11,917 7,010 361 1,624 2,922 1993 12,574 7,265 621 1,753 2,935 1994 23,149 11,951 1,182 6,369 3,647 1995 27,809 12,812 1,826 9,717 3,454 1996 36,946 18,206 2,520 13,100 3,120 1997 39,748 18,238 3,234 15,027 3,249 1998 39,880 17,867 5,899 12,779 3,335 1999 42,350 16,308 9,596 13,143 3,303 2000 46,531 16,817 13,108 13,074 3,532 2001 48,170 16,432 15,708 12,197 3,833 2002 71,785 32,149 23,907 9,995 5,734 2003 87,177 33,422 35,805 8,960 8,990 2004 90,219 24,200 54,010 0 12,009 2005 93,640 5,941 73,514 0 14,185
Source: NBS, 2006
Agricultural tax exemptions also have the attributes of subsidies defined under the WTO Subsidies and Countervailing Measures (SCM) Agreement (Article 1). Two essential components of this definition are that there is a financial contribution by government and a benefit received by the recipient (SCM Article 1.1.). “Financial contribution” is itself a defined term in the SCM Agreement, and explicitly includes a range of situations other than direct cash payments, such as provision of goods and services or tax breaks where the government foregoes revenue “otherwise due.” “Benefit” denotes the requirement that a subsidy must confer a competitive advantage on the recipient; the notion of advantage is understood by reference to the conditions the recipient would otherwise have to face in a competitive marketplace, in the absence of the government intervention in question. An agricultural tax exemption clearly has both components and thus is a subsidy in SCM terms. Such an exemption becomes “actionable” if it is found to have effects contrary to the interests of another member (SCM Article 5). When this occurs, the country providing the exemption, in this case China, must take action to remove the adverse effects of the subsidy or withdraw it. Otherwise, the complaining member may take countermeasures commensurate with the degree and nature of the adverse effects (SCM Article 7).
Non-reported Input Subsidies
Irrigation subsidies are not included in the calculations, even though they may constitute a significant component in China’s NPS support. In China, irrigation accounts for more than two thirds of total water use, although its share has been decreasing as a result of rising competition from uses in non-agricultrual sectors (e.g., industry) (Crook and Diao 2000). Major irrigation systems have been built and operated by government agencies (i.e., Ministry of Water Resources and local Water Resource Bureaus). Typically, irrigation water users are charged only a fraction of the cost of supplying water to them. The charges do not cover operations and maintenance (O&M) costs, and they never cover any of the substantial capital costs incurred in developing water collection and distribution systems. In some areas, charges for water are on a volumetric basis; in others, charges are based on the area irrigated rather than on the amount used. In both cases, however, charges are paid by townships, villages, and irrigation groups, not by
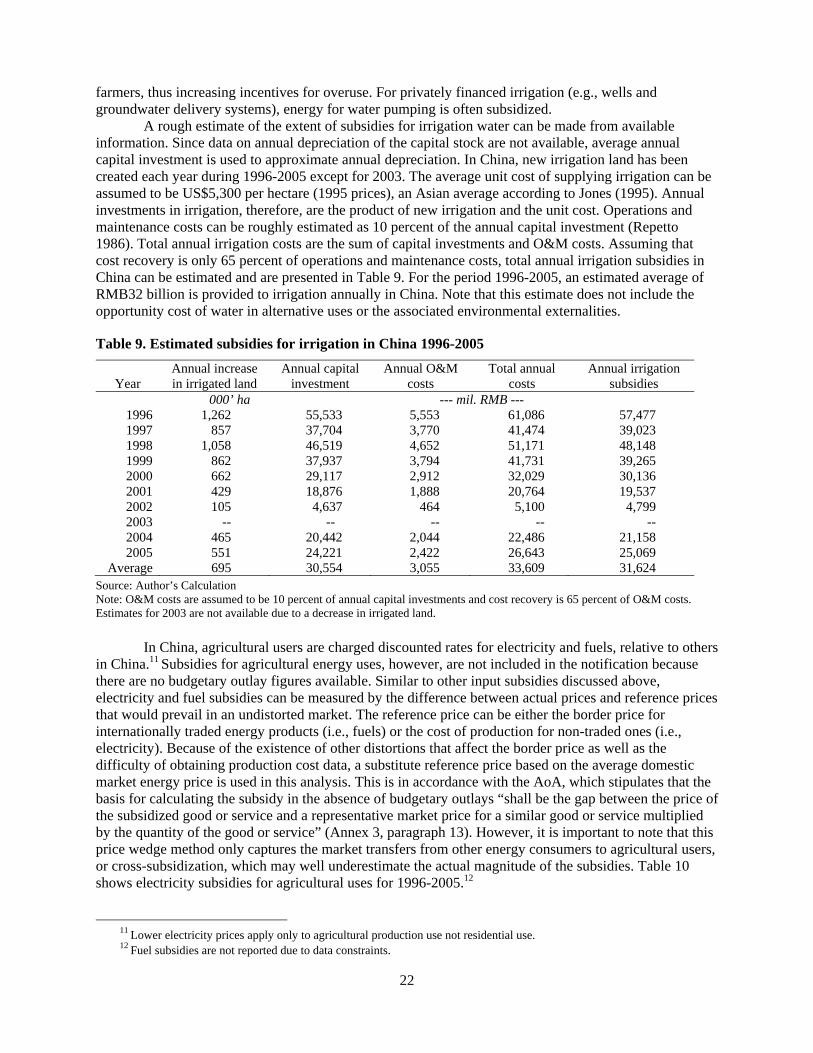
22
farmers, thus increasing incentives for overuse. For privately financed irrigation (e.g., wells and groundwater delivery systems), energy for water pumping is often subsidized.
A rough estimate of the extent of subsidies for irrigation water can be made from available information. Since data on annual depreciation of the capital stock are not available, average annual capital investment is used to approximate annual depreciation. In China, new irrigation land has been created each year during 1996-2005 except for 2003. The average unit cost of supplying irrigation can be assumed to be US$5,300 per hectare (1995 prices), an Asian average according to Jones (1995). Annual investments in irrigation, therefore, are the product of new irrigation and the unit cost. Operations and maintenance costs can be roughly estimated as 10 percent of the annual capital investment (Repetto 1986). Total annual irrigation costs are the sum of capital investments and O&M costs. Assuming that cost recovery is only 65 percent of operations and maintenance costs, total annual irrigation subsidies in China can be estimated and are presented in Table 9. For the period 1996-2005, an estimated average of RMB32 billion is provided to irrigation annually in China. Note that this estimate does not include the opportunity cost of water in alternative uses or the associated environmental externalities.
Table 9. Estimated subsidies for irrigation in China 1996-2005
Year Annual increase in irrigated land
Annual capital investment
Annual O&M costs
Total annual costs
Annual irrigation subsidies
000’ ha --- mil. RMB --- 1996 1,262 55,533 5,553 61,086 57,477 1997 857 37,704 3,770 41,474 39,023 1998 1,058 46,519 4,652 51,171 48,148 1999 862 37,937 3,794 41,731 39,265 2000 662 29,117 2,912 32,029 30,136 2001 429 18,876 1,888 20,764 19,537 2002 105 4,637 464 5,100 4,799 2003 -- -- -- -- -- 2004 465 20,442 2,044 22,486 21,158 2005 551 24,221 2,422 26,643 25,069
Average 695 30,554 3,055 33,609 31,624 Source: Author’s Calculation Note: O&M costs are assumed to be 10 percent of annual capital investments and cost recovery is 65 percent of O&M costs. Estimates for 2003 are not available due to a decrease in irrigated land.
In China, agricultural users are charged discounted rates for electricity and fuels, relative to others in China.11 Subsidies for agricultural energy uses, however, are not included in the notification because there are no budgetary outlay figures available. Similar to other input subsidies discussed above, electricity and fuel subsidies can be measured by the difference between actual prices and reference prices that would prevail in an undistorted market. The reference price can be either the border price for internationally traded energy products (i.e., fuels) or the cost of production for non-traded ones (i.e., electricity). Because of the existence of other distortions that affect the border price as well as the difficulty of obtaining production cost data, a substitute reference price based on the average domestic market energy price is used in this analysis. This is in accordance with the AoA, which stipulates that the basis for calculating the subsidy in the absence of budgetary outlays “shall be the gap between the price of the subsidized good or service and a representative market price for a similar good or service multiplied by the quantity of the good or service” (Annex 3, paragraph 13). However, it is important to note that this price wedge method only captures the market transfers from other energy consumers to agricultural users, or cross-subsidization, which may well underestimate the actual magnitude of the subsidies. Table 10 shows electricity subsidies for agricultural uses for 1996-2005.12
11 Lower electricity prices apply only to agricultural production use not residential use. 12 Fuel subsidies are not reported due to data constraints.
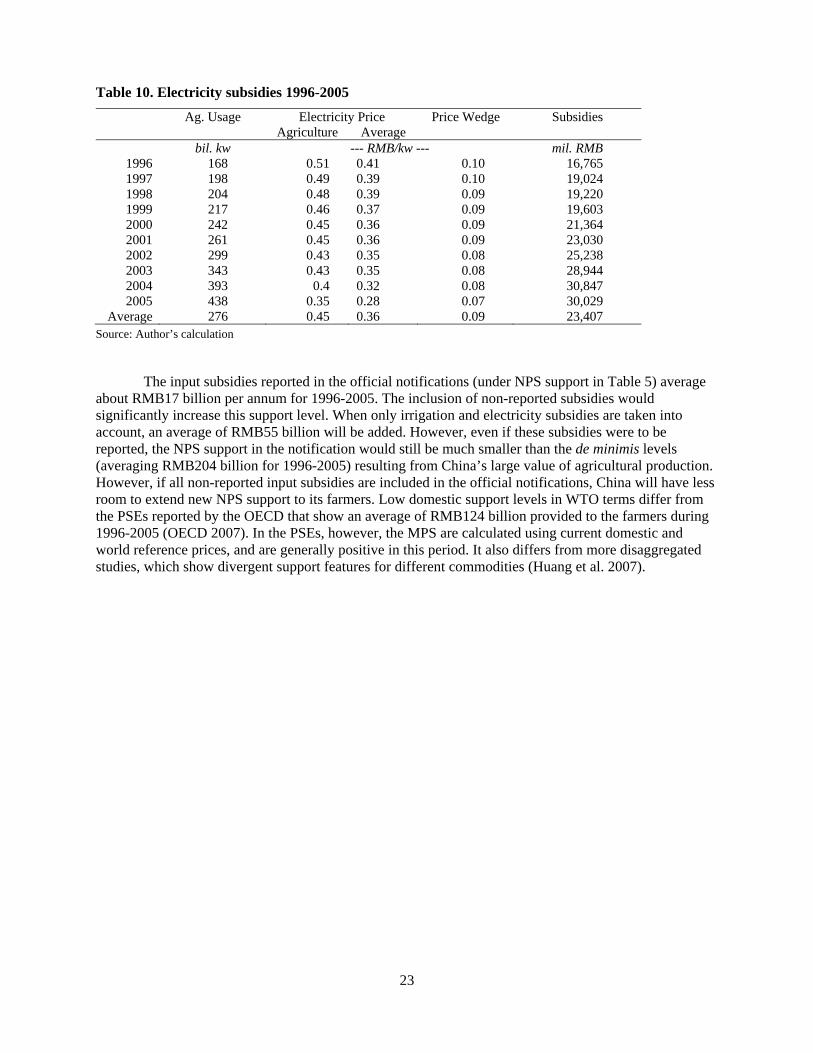
23
Table 10. Electricity subsidies 1996-2005
Ag. Usage Electricity Price Price Wedge Subsidies Agriculture Average bil. kw --- RMB/kw --- mil. RMB
1996 168 0.51 0.41 0.10 16,765 1997 198 0.49 0.39 0.10 19,024 1998 204 0.48 0.39 0.09 19,220 1999 217 0.46 0.37 0.09 19,603 2000 242 0.45 0.36 0.09 21,364 2001 261 0.45 0.36 0.09 23,030 2002 299 0.43 0.35 0.08 25,238 2003 343 0.43 0.35 0.08 28,944 2004 393 0.4 0.32 0.08 30,847 2005 438 0.35 0.28 0.07 30,029
Average 276 0.45 0.36 0.09 23,407 Source: Author’s calculation
The input subsidies reported in the official notifications (under NPS support in Table 5) average about RMB17 billion per annum for 1996-2005. The inclusion of non-reported subsidies would significantly increase this support level. When only irrigation and electricity subsidies are taken into account, an average of RMB55 billion will be added. However, even if these subsidies were to be reported, the NPS support in the notification would still be much smaller than the de minimis levels (averaging RMB204 billion for 1996-2005) resulting from China’s large value of agricultural production. However, if all non-reported input subsidies are included in the official notifications, China will have less room to extend new NPS support to its farmers. Low domestic support levels in WTO terms differ from the PSEs reported by the OECD that show an average of RMB124 billion provided to the farmers during 1996-2005 (OECD 2007). In the PSEs, however, the MPS are calculated using current domestic and world reference prices, and are generally positive in this period. It also differs from more disaggregated studies, which show divergent support features for different commodities (Huang et al. 2007).
24
5. DOMESTIC SUPPORT PROJECTION AND WTO COMMITMENTS
5.1. Projections of Notification, 2006-2013 The rapid evolution of China’s agricultural support policies has become an important element in the present trade policy debates in the Doha Round, along with continued discussion of farm policy in developed countries where subsidies are most prominent. Looking ahead, it appears that a reversal of subsidy policies in China is unlikely, given the economic progress the country is making. Rather, there are indications that the subsidies will be continued and even strengthened in the coming years. Assuming that China’s agricultural policies evolve as expected, one can also ask whether China will violate the relevant disciplines on agricultural domestic support contained in the Uruguay Round (UR) AoA or tighter rules that might be negotiated in the new round. Table 11 shows a projection of domestic support notification into 2013 under current UR rules and Chinese commitments. Appendix B presents more detailed calculations. The projection of PS support (and in particular market price support) distinguishes two administered price scenarios (high vs. medium price) and two program coverage scenarios (four vs. two commodities).13 The scenario designs follow recent world commodity market developments and domestic policy deliberations.
For instance, there has been a world commodity market boom during the past few years with prices of key commodities forecast to rise consistently through 2016 (USDA 2007). For rice and wheat, the USDA predicted price increases for the period 2005-2013 are 24.7 percent and 31.6 percent, respectively. Continued strong global economic growth, increased oil prices, and strong demand for corn and sugar for ethanol production are likely to lead to upward adjustments in future forecasts. Although domestic price changes will reflect to a large extent the global market situation, a number of other factors including domestic and trade policies, location and status as exporter or importer, macroeconomic environment and exchange rate fluctuations are also important. Exactly how much of the world price increases passes through to domestic prices and at what point these will trigger a change in administered prices remain largely uncertain. The same uncertainty applies to price forecasts themselves as changes in policies and weather conditions are hard to predict.
Notwithstanding these uncertainties, policy makers and researchers in China concur that the current support prices for wheat and rice are too low (Xinhua Net 2007). Recommendations to increase these prices have been made in various State Council meetings.14 Because of recently soaring inflation rates for food and agricultural products (reaching 20 percent by the end of 2007), we argue that, under a high price scenario, an increase of minimum prices by 20 percent will occur, while under a medium price scenario the increase will be 10 percent. We assume that each administered price increase will remain effective for three consecutive years, i.e., 2008-2010 and 2011-2013, respectively (in reality, however, small adjustments may occur within each period). In addition to price increases, there are also policy discussions on whether the minimum price system should be extended beyond wheat and rice to include cotton and corn. Therefore, two commodity coverage scenarios are compared for the notifications.
13 The scenario of low commodity prices is also possible but not presented. Given that China will comply with its WTO
commitments under the medium price scenario (to be discussed), the same conclusion can be drawn for the low price scenario. 14 The minimum prices for wheat and rice remained unchanged in 2006 and 2007 but were increased by about 10 percent in
early 2008.
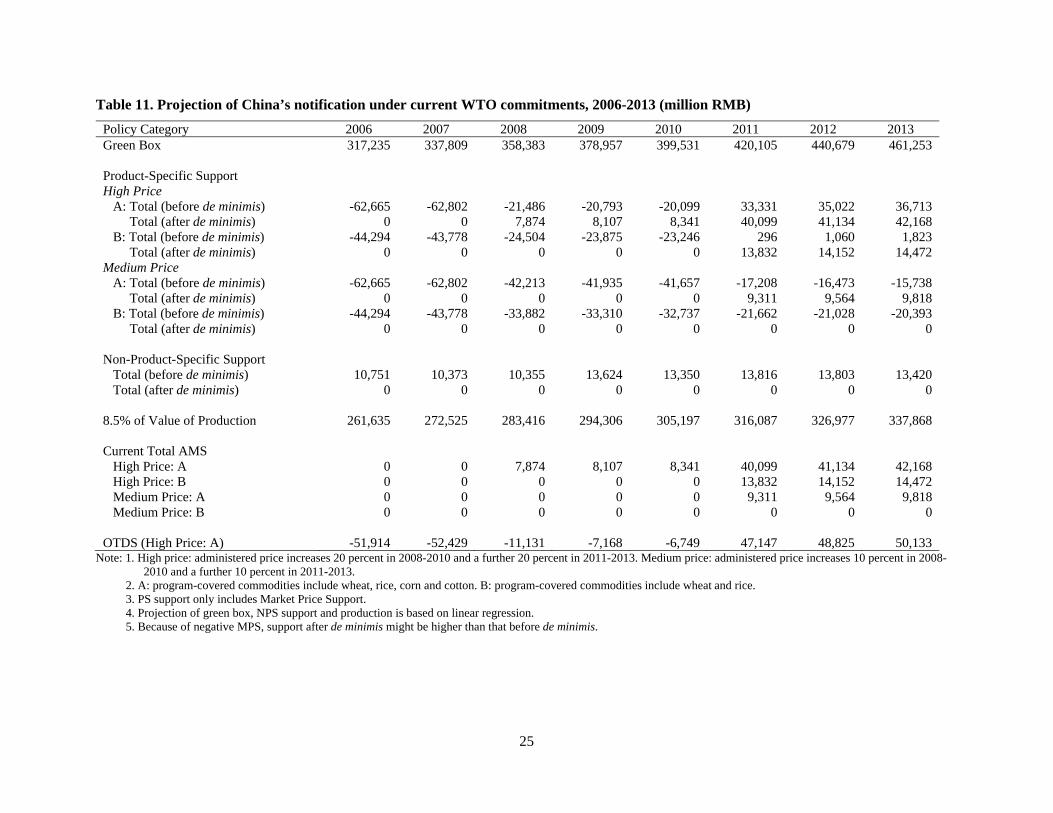
25
Table 11. Projection of China’s notification under current WTO commitments, 2006-2013 (million RMB)
Policy Category 2006 2007 2008 2009 2010 2011 2012 2013 Green Box 317,235 337,809 358,383 378,957 399,531 420,105 440,679 461,253 Product-Specific Support High Price A: Total (before de minimis) -62,665 -62,802 -21,486 -20,793 -20,099 33,331 35,022 36,713 Total (after de minimis) 0 0 7,874 8,107 8,341 40,099 41,134 42,168 B: Total (before de minimis) -44,294 -43,778 -24,504 -23,875 -23,246 296 1,060 1,823 Total (after de minimis) 0 0 0 0 0 13,832 14,152 14,472 Medium Price A: Total (before de minimis) -62,665 -62,802 -42,213 -41,935 -41,657 -17,208 -16,473 -15,738 Total (after de minimis) 0 0 0 0 0 9,311 9,564 9,818 B: Total (before de minimis) -44,294 -43,778 -33,882 -33,310 -32,737 -21,662 -21,028 -20,393 Total (after de minimis) 0 0 0 0 0 0 0 0 Non-Product-Specific Support Total (before de minimis) 10,751 10,373 10,355 13,624 13,350 13,816 13,803 13,420 Total (after de minimis) 0 0 0 0 0 0 0 0 8.5% of Value of Production 261,635 272,525 283,416 294,306 305,197 316,087 326,977 337,868 Current Total AMS High Price: A 0 0 7,874 8,107 8,341 40,099 41,134 42,168 High Price: B 0 0 0 0 0 13,832 14,152 14,472 Medium Price: A 0 0 0 0 0 9,311 9,564 9,818 Medium Price: B 0 0 0 0 0 0 0 0 OTDS (High Price: A) -51,914 -52,429 -11,131 -7,168 -6,749 47,147 48,825 50,133
Note: 1. High price: administered price increases 20 percent in 2008-2010 and a further 20 percent in 2011-2013. Medium price: administered price increases 10 percent in 2008-2010 and a further 10 percent in 2011-2013.
2. A: program-covered commodities include wheat, rice, corn and cotton. B: program-covered commodities include wheat and rice. 3. PS support only includes Market Price Support. 4. Projection of green box, NPS support and production is based on linear regression. 5. Because of negative MPS, support after de minimis might be higher than that before de minimis.
26
Furthermore, we assume in our analysis that direct payments to farmers will be notified in the green box, even though the results of the US/Brazil cotton dispute settlement have called into question the exact nature of such payments. China has sporadically provided product-specific (e.g., seed subsidies) and non-product-specific (e.g., machinery subsidies) support to grain producers. But because of the uncertainty of the continuous provision of these subsidies, we did not include them in the projection. Neither did we include subsidies related to irrigation, electricity and fuel, because they were not reported in the previous two official notifications and are not likely to be reported in the future. We further assumed that China will not report under the blue box, although the country may be forced to report in this box as a result of a progressively higher level of trade-distorting support. Projection of the green box, NPS support and quantity of production is based on a linear extrapolation of historical figures for the period of 1996-2005.
Assuming “business as usual” (i.e., a continuation of Uruguay Round rules at the WTO), China will comply with its commitments if current commodity programs are continued and there are no dramatic increases in support prices. This corresponds to a medium-price, two-commodity minimum price support program scenario (Medium Price: B in Table 11). However, if domestic administered prices increase by 20 percent in 2008-2010 and a further 20 percent in 2011-2013, and price support extends to cotton and corn (High Price: A), China’s AMS may exceed its de minimis ceiling as early as 2008. This occurs because the product specific support for cotton exceeds 8.5 percent of the value of cotton production (see Appendix Table B.1) Violations of WTO commitments will occur at a later date (2011) if prices are low or current commodity program coverage is maintained (Medium Price: A or High Price: B). It is noted that failure by China to comply with its commitments either in the high price or extended commodity coverage scenario results from over-de minimis product-specific payments; NPS support will remain under its de minimis levels despite steady increases.15
5.2. Effects of a Potential Doha Round Agreement on Agriculture The most recent draft modalities put forward by Ambassador Crawford Falconer in August 2007 (TN/AG/W/4) and clarified in the December 2007 “Working Documents” serve as the basis for further negotiations of a new Agreement on Agriculture at the WTO. The Falconer text retains some of the features of the present AoA and it also makes recommendations for reforms in the three pillars of trade policy, namely, domestic support, market access, and export competition. Several new proposals on further constraining domestic support emerged in the modalities, which include a tiered harmonizing reduction of overall trade-distorting domestic support (OTDS) and final bound total AMS, product-specific AMS limits, reduction of the de minimis, and a cap on and criteria for blue box payments. Table 12 provides a brief summary of the main provisions in the modalities and their implications in terms of China’s domestic support commitments.
The base level for the reduction of OTDS is the summation of the final bound total AMS ceiling, 10 percent of the base-period (1995-2000) average VOP (20 percent for developing countries), and the higher of average blue box payments or 5 percent of the average VOP. A tiered reduction formula is developed so that countries with higher base OTDS are required to undertake higher reduction commitments. Similarly, a tiered approach is proposed for reducing final bound total AMS.16 New caps are designed to limit PS support to below average PS AMS for 1995-2000, overall blue box payments to below 2.5 percent of VOP (5 percent for developing countries), and PS blue box payments to below base-period average PS support. Specific provisions for cotton also apply. For China, because there is no final bound AMS, an 8.5 percent de minimis, and no historical blue box measures, the base level of OTDS is equal to 22 percent of VOP (8.5%+8.5%+5%). China’s status as a developing country with no AMS
15 Because of the negative MPS, PS support after de minimis can be higher than that before de minimis. For instance, in
2008 (high price: A), PS support is RMB8 billion after de minimis and RMB-21 billion before de minimis. 16 Reductions in OTDS and total AMS require a larger “first instalment” followed by smaller equal annual instalments over
the rest of the implementation period.

27
commitments at the UR exempts it from OTDS reductions. And for the same reason, China does not have to make commitments to reduce total AMS or the de minimis. During the base period, PS support in China remained consistently below the de minimis level so that the new cap on PS AMS is effectively the present de minimis converted to monetary terms. China is entitled to make blue box payments up to 5 percent of average VOP while the PS cap in this category is 10 percent of the overall blue box ceiling.
Table 12. Main provisions of draft modalities and China’s commitments
Categories Draft Modalities China’s Commitments OTDS Base Level Final bound total AMS +10% (or 20%)
VOP + higher of average blue box payment or 5% VOP
22% VOP
Reduction Tiered reduction No reduction Total AMS Base Level Final bound values in 2000 0 Reduction Tiered reduction No reduction PS AMS Cap Base period average PS AMS de minimis in monetary terms De Minimis Reduction 50% or 60% No reduction Blue Box Overall Cap 2.5% or 5% VOP 5% VOP PS Cap Base-period average PS support 10% of overall blue box ceiling Cotton AMS Formula reduction No reduction Blue Box 1/3 of PS blue box cap 1/3 of PS blue box cap VOP Base Period 1995-2000 average 1996-2001 average
Source: TN/AG/W/4 and author’s compilation
If the above arguments are correct, then the possible new Agreement on Agriculture will have minimal impact on China’s current and future commitments. Most notably, the de minimis, which is to remain at 8.5 percent of VOP, will continue to be the binding factor for both PS and NPS domestic support. Because of China’s large value of production (an average of RMB2,150 billion during 1996-2001), the limit on OTDS for China is RMB473 billion, is not a constraint for the country even under the highest support scenario (high administered price with four covered commodities) (see Table 11, last row). The new blue box implies that China can extend domestic support up to RMB108 billion overall and RMB11 billion for a specific product, provided that such support satisfies the blue box criteria set out in the new agreement. As China’s PS AMS commitment of the draft modalities remain the same as the current one, i.e., de minimis of 8.5% of product specific VOP, support to certain key commodities would exceed the limits in high-price (wheat and cotton) and medium-price (cotton) scenarios (Table B.1.).
28
6. CONCLUSION
Agriculture has long been heavily subsidized, especially in developed nations. Agricultural subsidies came into sharp focus during the 1986–1994 negotiations of the Uruguay Round Agreement on Agriculture (AoA). One of the landmark achievements in the AoA was the extension of multiple disciplines from border measures to domestic policies. These disciplines are also important for some developing countries, where rapid economic growth has brought about shifts in domestic policies toward increasing subsidization of the agricultural sector. The present paper provides an analysis of recent changes in agricultural policies in China and empirical estimates of China’s domestic support for agriculture.
The methods used in the estimation of the “shadow” domestic support notifications are based on those reported in official WTO documents. In general, our results indicated that, unless there are legitimate challenges that notifications should be made otherwise, China’s domestic support for the recent period (1996-2006) has been well below the limits agreed at its WTO accession. However, there are a number of interesting features that warrant further examination.
First, China’s level of green box support has grown as a result of increased public investment in the agricultural sector. In 2006, total green box support reached RMB289 billion, more than double the 1996 figure (RMB112 billion). Second, China has no AMS commitments but can provide trade-distorting domestic support to agricultural producers up to 8.5 percent of the value of production (China’s de minimis level). Third, the MPS component of the AMS has been far below zero, and this has dwarfed the relatively small but positive NPS AMS and led to a zero current total AMS after de minimis. Fourth, China has given up the right to use “special and differential treatment,” as provided in Article 6.2 of the AoA, to report subsidy measures that are exempt from the reduction commitments. Instead, subsidies of this type are counted in the amber box category. Finally, China has not reported any blue box measures, although it might do so in the future if the need arises.
An economic critique of the AMS is presented and a comparison of the MPS based on alternative assumptions of reference prices and eligible production is made. We show that the MPS double-counts border measures and miscounts actual protection levels. This measurement issue becomes more important under scenarios where actual world prices change and China’s currency continues to strengthen. We provide a discussion of a set of relevant alternative subsidy-definition scenarios and their effects on the calculated levels of support when applied in the historical period of analysis. These scenarios include alternative decisions about what categories certain expenditures are notified within, as might arise from domestic reporting decisions or related dispute settlement cases at the WTO (e.g., do China’s direct payments to farmers belong to the amber or green box?), and inclusion of subsidies previously not included in notifications (e.g., irrigation, electricity, and fuel subsidies).
We project domestic support notifications through 2013 based on specified assumptions about domestic policies, including changes in administered prices and commodity program coverage. Our projections indicate that China may exceed its WTO commitment levels under certain price and commodity coverage scenarios. New constraints/latitude potentially negotiated in the Doha Round are discussed, for example, new bindings on support levels in aggregate or for specific commodities, reductions in the de minimis, and redefinition of categories such as the blue box. Due to China’s developing country status, which means it has no UR AMS commitments, the impacts of these new constraints in terms of China’s WTO commitments are shown to be limited.
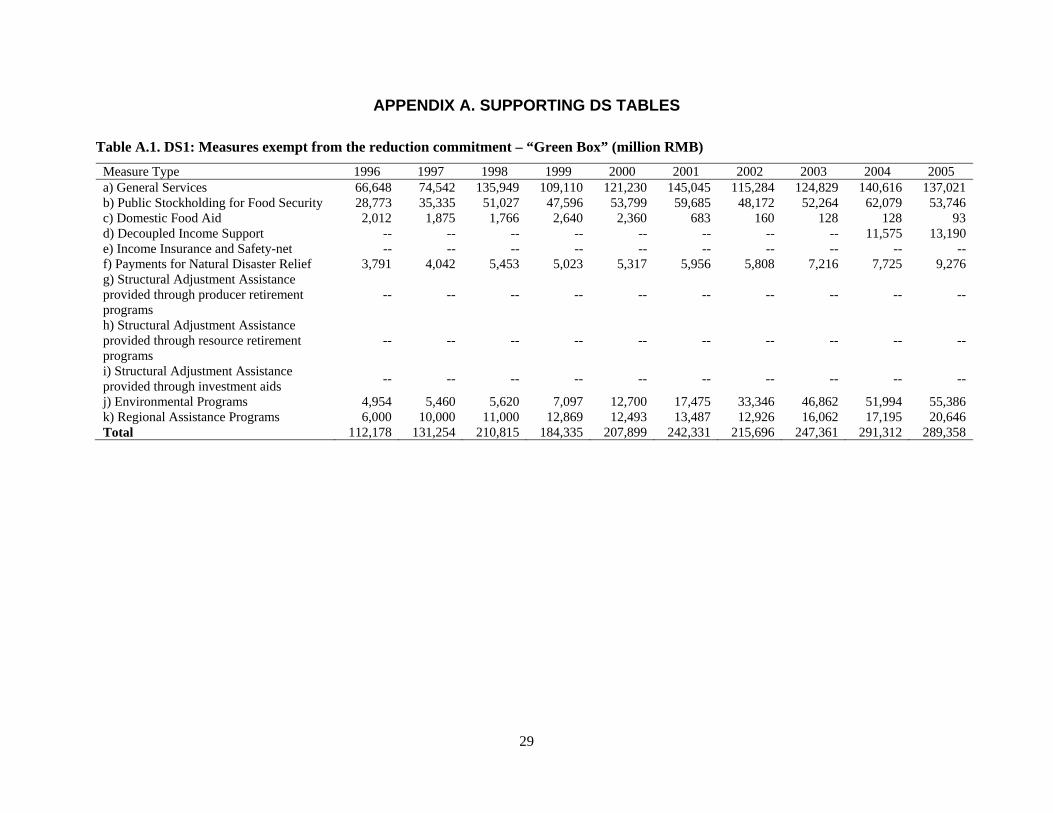
29
APPENDIX A. SUPPORTING DS TABLES
Table A.1. DS1: Measures exempt from the reduction commitment – “Green Box” (million RMB)
Measure Type 1996 1997 1998 1999 2000 2001 2002 2003 2004 2005 a) General Services 66,648 74,542 135,949 109,110 121,230 145,045 115,284 124,829 140,616 137,021 b) Public Stockholding for Food Security 28,773 35,335 51,027 47,596 53,799 59,685 48,172 52,264 62,079 53,746 c) Domestic Food Aid 2,012 1,875 1,766 2,640 2,360 683 160 128 128 93 d) Decoupled Income Support -- -- -- -- -- -- -- -- 11,575 13,190 e) Income Insurance and Safety-net -- -- -- -- -- -- -- -- -- -- f) Payments for Natural Disaster Relief 3,791 4,042 5,453 5,023 5,317 5,956 5,808 7,216 7,725 9,276 g) Structural Adjustment Assistance provided through producer retirement programs
-- -- -- -- -- -- -- -- -- --
h) Structural Adjustment Assistance provided through resource retirement programs
-- -- -- -- -- -- -- -- -- --
i) Structural Adjustment Assistance provided through investment aids -- -- -- -- -- -- -- -- -- --
j) Environmental Programs 4,954 5,460 5,620 7,097 12,700 17,475 33,346 46,862 51,994 55,386 k) Regional Assistance Programs 6,000 10,000 11,000 12,869 12,493 13,487 12,926 16,062 17,195 20,646 Total 112,178 131,254 210,815 184,335 207,899 242,331 215,696 247,361 291,312 289,358
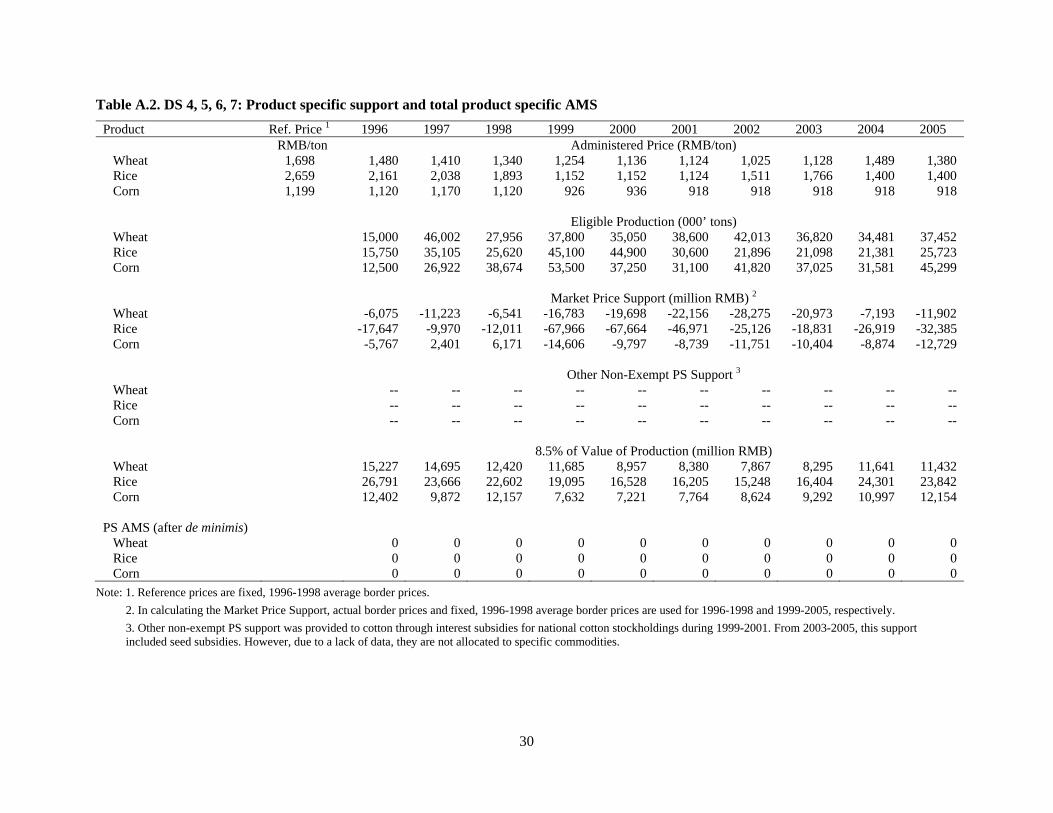
30
Table A.2. DS 4, 5, 6, 7: Product specific support and total product specific AMS
Product Ref. Price 1 1996 1997 1998 1999 2000 2001 2002 2003 2004 2005 RMB/ton Administered Price (RMB/ton) Wheat 1,698 1,480 1,410 1,340 1,254 1,136 1,124 1,025 1,128 1,489 1,380 Rice 2,659 2,161 2,038 1,893 1,152 1,152 1,124 1,511 1,766 1,400 1,400 Corn 1,199 1,120 1,170 1,120 926 936 918 918 918 918 918 Eligible Production (000’ tons) Wheat 15,000 46,002 27,956 37,800 35,050 38,600 42,013 36,820 34,481 37,452 Rice 15,750 35,105 25,620 45,100 44,900 30,600 21,896 21,098 21,381 25,723 Corn 12,500 26,922 38,674 53,500 37,250 31,100 41,820 37,025 31,581 45,299 Market Price Support (million RMB) 2 Wheat -6,075 -11,223 -6,541 -16,783 -19,698 -22,156 -28,275 -20,973 -7,193 -11,902 Rice -17,647 -9,970 -12,011 -67,966 -67,664 -46,971 -25,126 -18,831 -26,919 -32,385 Corn -5,767 2,401 6,171 -14,606 -9,797 -8,739 -11,751 -10,404 -8,874 -12,729 Other Non-Exempt PS Support 3 Wheat -- -- -- -- -- -- -- -- -- -- Rice -- -- -- -- -- -- -- -- -- -- Corn -- -- -- -- -- -- -- -- -- -- 8.5% of Value of Production (million RMB) Wheat 15,227 14,695 12,420 11,685 8,957 8,380 7,867 8,295 11,641 11,432 Rice 26,791 23,666 22,602 19,095 16,528 16,205 15,248 16,404 24,301 23,842 Corn 12,402 9,872 12,157 7,632 7,221 7,764 8,624 9,292 10,997 12,154 PS AMS (after de minimis) Wheat 0 0 0 0 0 0 0 0 0 0 Rice 0 0 0 0 0 0 0 0 0 0 Corn 0 0 0 0 0 0 0 0 0 0
Note: 1. Reference prices are fixed, 1996-1998 average border prices. 2. In calculating the Market Price Support, actual border prices and fixed, 1996-1998 average border prices are used for 1996-1998 and 1999-2005, respectively. 3. Other non-exempt PS support was provided to cotton through interest subsidies for national cotton stockholdings during 1999-2001. From 2003-2005, this support
included seed subsidies. However, due to a lack of data, they are not allocated to specific commodities.
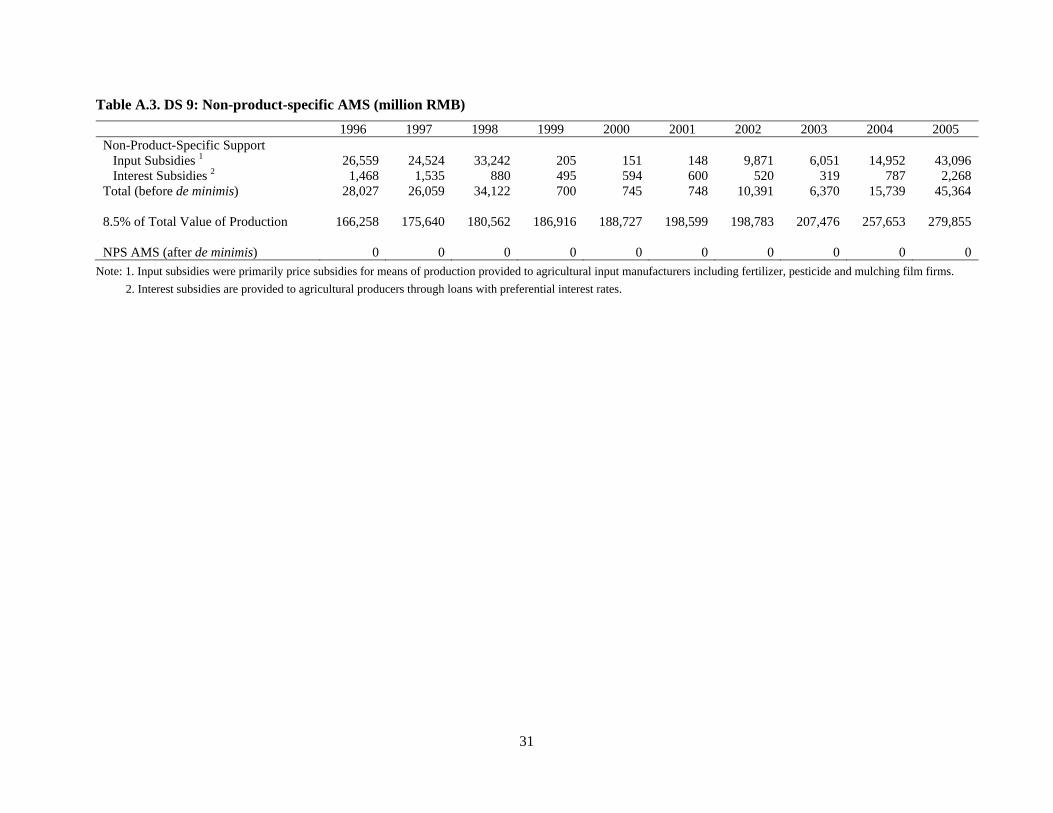
31
Table A.3. DS 9: Non-product-specific AMS (million RMB)
1996 1997 1998 1999 2000 2001 2002 2003 2004 2005 Non-Product-Specific Support Input Subsidies 1 26,559 24,524 33,242 205 151 148 9,871 6,051 14,952 43,096 Interest Subsidies 2 1,468 1,535 880 495 594 600 520 319 787 2,268 Total (before de minimis) 28,027 26,059 34,122 700 745 748 10,391 6,370 15,739 45,364 8.5% of Total Value of Production 166,258 175,640 180,562 186,916 188,727 198,599 198,783 207,476 257,653 279,855 NPS AMS (after de minimis) 0 0 0 0 0 0 0 0 0 0
Note: 1. Input subsidies were primarily price subsidies for means of production provided to agricultural input manufacturers including fertilizer, pesticide and mulching film firms. 2. Interest subsidies are provided to agricultural producers through loans with preferential interest rates.
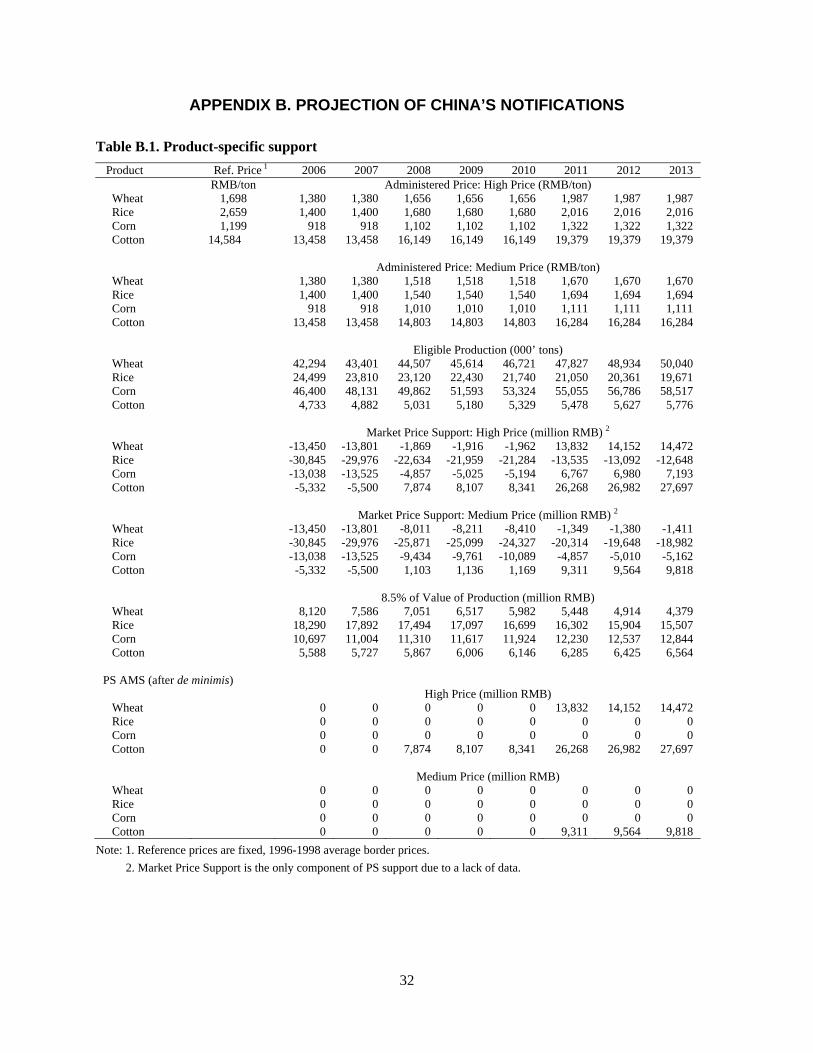
32
APPENDIX B. PROJECTION OF CHINA’S NOTIFICATIONS
Table B.1. Product-specific support Product Ref. Price 1 2006 2007 2008 2009 2010 2011 2012 2013 RMB/ton Administered Price: High Price (RMB/ton) Wheat 1,698 1,380 1,380 1,656 1,656 1,656 1,987 1,987 1,987 Rice 2,659 1,400 1,400 1,680 1,680 1,680 2,016 2,016 2,016 Corn 1,199 918 918 1,102 1,102 1,102 1,322 1,322 1,322 Cotton 14,584 13,458 13,458 16,149 16,149 16,149 19,379 19,379 19,379 Administered Price: Medium Price (RMB/ton) Wheat 1,380 1,380 1,518 1,518 1,518 1,670 1,670 1,670 Rice 1,400 1,400 1,540 1,540 1,540 1,694 1,694 1,694 Corn 918 918 1,010 1,010 1,010 1,111 1,111 1,111 Cotton 13,458 13,458 14,803 14,803 14,803 16,284 16,284 16,284 Eligible Production (000’ tons) Wheat 42,294 43,401 44,507 45,614 46,721 47,827 48,934 50,040 Rice 24,499 23,810 23,120 22,430 21,740 21,050 20,361 19,671 Corn 46,400 48,131 49,862 51,593 53,324 55,055 56,786 58,517 Cotton 4,733 4,882 5,031 5,180 5,329 5,478 5,627 5,776 Market Price Support: High Price (million RMB) 2
Wheat -13,450 -13,801 -1,869 -1,916 -1,962 13,832 14,152 14,472 Rice -30,845 -29,976 -22,634 -21,959 -21,284 -13,535 -13,092 -12,648 Corn -13,038 -13,525 -4,857 -5,025 -5,194 6,767 6,980 7,193 Cotton -5,332 -5,500 7,874 8,107 8,341 26,268 26,982 27,697 Market Price Support: Medium Price (million RMB) 2 Wheat -13,450 -13,801 -8,011 -8,211 -8,410 -1,349 -1,380 -1,411 Rice -30,845 -29,976 -25,871 -25,099 -24,327 -20,314 -19,648 -18,982 Corn -13,038 -13,525 -9,434 -9,761 -10,089 -4,857 -5,010 -5,162 Cotton -5,332 -5,500 1,103 1,136 1,169 9,311 9,564 9,818 8.5% of Value of Production (million RMB) Wheat 8,120 7,586 7,051 6,517 5,982 5,448 4,914 4,379 Rice 18,290 17,892 17,494 17,097 16,699 16,302 15,904 15,507 Corn 10,697 11,004 11,310 11,617 11,924 12,230 12,537 12,844 Cotton 5,588 5,727 5,867 6,006 6,146 6,285 6,425 6,564 PS AMS (after de minimis) High Price (million RMB) Wheat 0 0 0 0 0 13,832 14,152 14,472 Rice 0 0 0 0 0 0 0 0 Corn 0 0 0 0 0 0 0 0 Cotton 0 0 7,874 8,107 8,341 26,268 26,982 27,697 Medium Price (million RMB) Wheat 0 0 0 0 0 0 0 0 Rice 0 0 0 0 0 0 0 0 Corn 0 0 0 0 0 0 0 0 Cotton 0 0 0 0 0 9,311 9,564 9,818
Note: 1. Reference prices are fixed, 1996-1998 average border prices. 2. Market Price Support is the only component of PS support due to a lack of data.
33
REFERENCES
Abler, D. and D. Blandford. 2005. A Review of Empirical Studies of the Acreage and Production Response to US Production Flexibility Contract Payments under the Fair Act and Related Payments under Supplementary Legislation. AGR/CA/APM(2004)21/FINAL, OECD, Paris.
Burfisher, M. and J. Hopkins. 2003. Decoupled Payments: Household Income Transfers in Contemporary US Agriculture. Agricultural Economic Report No. 822, USDA ERS.
Carter, C. and X. Li. 1999. “Economic Reform and the Changing Pattern of China’s Agricultural Trade.” Working Paper No. 99-003. Department of Agricultural and Resource Economics, University of California, Davis.
Chang, G., 2002. The Cause and Cure of China’s Widening Income Disparity. China Economic Review 13(4): 335-340.
Cheng, F. and Z. Tang. 2007. “Sanitary and Phytosanitary (SPS) Barriers to China’s Agricultural Exports.” Report prepared for project “Economic Analysis of Technical Barriers Limiting Agricultural Trade of China.” International Food Policy Research Institute, Washington, DC.
Cheng, F. and D. Orden. 2007. “Exchange Rate Misalignment and Producer Support Estimates (PSEs) of China.” Paper presented at the Symposium on “China’s Agricultural Trade: Issues and Prospects” International Agricultural Trade Research Consortium, Beijing, July 8-9.
Crook, F. and X. Diao. 2000. “Water Pressure in China: Growth Strains Resources.” Agricultural Outlook, ERS USDA, Washington, DC.
De Gorter, H. and M. Ingco. 2002. “The AMS and Domestic Support in the WTO Trade Negotiations on Agriculture: Issues and Suggestions for New Rules.” Working Paper, World Bank, Washington, DC.
Evenett, S., and C. Braga. 2005. “WTO Accession: Lessons from Experience.” Trade Note 22, World Bank, Washington, DC.
Fan, S. and C. Chan-Kang. 2005. “Is Small Beautiful? Farm Size, Productivity, and Poverty in Asian Agriculture.” Agricultural Economics 32(1):135-146.
Fan, S. and S. Thorat. 2007. Public Investment, Growth, and Poverty Reduction: A Comparative Analysis of India and China. In The Dragon and the Elephant: Agricultural and Rural Reforms in China and India, eds. S. Fan and A. Gulati. Baltimore, MD: The Johns Hopkins University Press
Fang, C. and J. Beghin. 2000. “Food Self-Sufficiency, Comparative Advantage, and Agricultural Trade: A Policy Analysis Matrix for Chinese Agriculture.” Working Paper 99-WP 223, Iowa State University, Ames.
FAOSTAT. 2007. FAO Database. <http://faostat.fao.org/default.aspx> Accessed November 20, 2007. Food and Agriculture Organization of the United Nations. Rome.
Frankel, J., 2006. “On the yuan: the Choice between Adjustment under a Fixed Exchange Rate and Adjustment under a Flexible Rate.” CESifo Economic Studies 52:246-275.
Gale, F., B. Lohmar, and F. Tuan. 2005. “China’s New Farm Subsidies.” WRS-05-01, ERS USDA, Washington, DC.
Goldstein, M., 2007. “A (Lack of) Progress Report on China’s Exchange Rate Policies.” Working Paper 07-5, Peterson Institute for International Economics, Washington, DC.
Goodwin, B. and A. Mishra. 2006. “Are ‘Decoupled’ Farm Program Payments Really Decoupled? An Empirical Evaluation.” American Journal of Agricultural Economics 88(1): 73-79.
Hayes, D. and F. Fuller. 1999. “Optimal Chinese Agricultural Trade Patterns under the Laws of Comparative Advantage.” Working Paper 99-WP 233, Center for Agricultural and Rural Development, Iowa State University, Ames.
Huang, J. and S. Rozelle. 2002. “Changes in China’s Agricultural Sector: Trade, Market and Policy Reform.” Proceedings of the WCC-101, Washington, DC, April 14-16.

34
Huang, J., S. Rozelle, W. Martin, and Y. Liu. 2007. “Distortions to Agricultural Incentives in China.” Working Paper, World Bank, Washington, DC.
Huang, Y. 1998. Agricultural Reform in China: Getting Institutions Right. Cambridge: Cambridge University.
Jones, W. 1995. The World Bank and Irrigation. World Bank, Washington, DC.
Ke, B. 2007. Agricultural Marketing Reforms in China: Striking a Balance between Sequencing and Speed. In The Dragon and the Elephant: Agricultural and Rural Reforms in China and India, eds. S. Fan and A. Gulati. Baltimore, MD: The Johns Hopkins University Press.
Kwiecinski, A. and F. van Tongeren. 2007. “Quantitative Evaluation of A Decade of Agricultural Policies in China: 1995-2005.” OECD, Paris.
Martin, W. 2003. Implications of Reform and WTO Accession for China’s Agricultural Policies. In Agricultural Trade and Policy in China: Issues, Analysis and Implications, eds. S. Rozell and D. Sumner. Burlington, VT: Ashgate.
MOA (Ministry of Agriculture). 2006. China Agricultural Yearbook. Beijing.
MOF (Ministry of Finance). 2007a. “China to Eliminate Export Tax Rebates on Grains and Processed Grain Products.” <http://www.mof.gov.cn/news/20071218_1500_29938.htm> Accessed December 20, 2007.
--------. 2007b. “Strengthening Agricultural Subsidies.” <http://www.mof.gov.cn/news/20070212_3137_24064.htm> Accessed December 20, 2007.
--------. 2008a. “China to Levy Export Taxes on Grains and Processed Grain Products.” <http://www.mof.gov.cn/news/20071230_1500_30186.htm> Accessed January 2, 2008.
--------. 2008b. “Temporary Import Tariffs on Soybeans to be Effective through September 30 2008.” <http://www.mof.gov.cn/news/20080307_2119_31956.htm> Accessed March 6, 2008.
MOFCOM (Ministry of Commerce). 2008. “China Puts Quota on Grain Powder Exports to Stabilize Domestic Prices.” <http://gpj2.mofcom.gov.cn/aarticle/workaffair/200801/20080105314447.html> Accessed January 12, 2008.
NBS (National Bureau of Statistics). Various years. China Statistical Yearbook. Beijing.
OECD. 2005. OECD Review of Agricultural Policies – China. Paris.
OECD. 2007. PSE Database. <http://www.oecd.org/dataoecd/55/21/38525182.xls> Accessed November 15, 2007.
Qiao, F., B. Lohmar, J. Huang, S. Rozelle and L. Zhang. 2003. “Producer Benefits from Input Market and Trade Liberalization: the Case of Fertilizer in China.” American Journal of Agricultural Economics, 85(5): 1223-1227.
Repetto, R. 1986. Skimming the Water: Rent-Seeking and the Performance of Public Irrigation Systems. World Resources Institute, Washington, DC.
Solot, I. 2006. “The Chinese Agricultural Policy Trilemma.” Perspectives 7(1):36-46.
USDA. 2007. USDA Agricultural Long-term Projections to 2016. <http://www.usda.gov/oce/commodity/ag_baseline.htm> Accessed December 11, 2007.
WTO. 2006. Trade Policy Review. WT/TPR/S/161/Rev.1. WTO, Geneva.
Xinhua Net. 2007. “China Should Increase Minimum Prices for Grains.” <http://news.xinhuanet.com/politics/2007-05/26/content_6156143.htm> Accessed January 13 2008.
RECENT IFPRI DISCUSSION PAPERS
For earlier discussion papers, please go to www.ifpri.org/pubs/pubs.htm#dp. All discussion papers can be downloaded free of charge.
792. India: Shadow WTO agricultural domestic support notifications. Munisamy Gopinath, 2008.
791. Agricultural growth and investment options for poverty reduction in Zambia. James Thurlow, Samuel Benin, Xinshen Diao, Henrietta Kalinda, and Thomson Kalinda, 2008.
790. Agricultural growth and investment options for poverty reduction in Uganda. Samuel Benin, James Thurlow, Xinshen Diao, Allen Kebba, Nelson Ofwono, 2008.
789. Agricultural public spending in Nigeria. Tewodaj Mogues, Michael Morris, Lev Freinkman, Abimbola Adubi, and Simeon Ehui; with Chinedum Nwoko, Olufemi Taiwo, Caroline Nege, Patrick Okonji, and Louis Chete, 2008.
788. Choosing sensitive agricultural products in trade negotiations. Sébastien Jean, David Laborde, and Will Martin, 2008.
787. An Updated Look at the Recovery of Agricultural Productivity in Sub-Saharan Africa. Alejandro Nin Pratt and Bingxin Yu. 2008
786. Migration, Poverty, and Inequality: Evidence from Burkina Faso. F.S. Wouterse. 2008
785. Insecticide use on vegetables in Ghana: Would GM seed benefit farmers? Daniela Horna, Melinda Smale, Ramatu Al-Hassan, José Falck-Zepeda, and Samuel E. Timpo, 2008.
784. Agriculture for development in Ghana: New opportunities and challenges. Clemens Breisinger, Xinshen Diao, James Thurlow, and Ramatu M. Al-Hassan, 2008.
783. Understanding the investment and abandonment behavior of poor households: An empirical investigation. Ruth Vargas Hill, 2008.
782. Access to irrigation and the escape from poverty: Evidence from Northern Mali. Andrew Dillon, 2008.
781. Structural changes in the Philippine pig industry and their environmental implications. Maria Angeles O. Catelo, Clare A. Narrod, and Marites M. Tiongco, 2008.
780. Evaluating alternative policy responses to higher world food prices: The case of increasing rice prices in Madagascar. David Coady, Paul Dorosh, and Bart Minten, 2008.
779. Contract farming of swine in Southeast Asia as a response to changing market demand for quality and safety in pork. Marites Tiongco, Maria Angeles Catelo, and Ma. Lucila Lapar, 2008.
778. On-site and off-site long-term economic impacts of soil fertility management practices: The case of maize-based cropping systems in Kenya. Ephraim Nkonya, Patrick Gicheru, Johannes Woelcke, Barrack Okoba, Daniel Kilambya, and Louis N. Gachimbi, 2008
777. Development under conditions of inequality and distrust: Social cohesion in Latin America. Marco Ferroni, Mercedes Mateo, Mark Payne, 2008.
776. Exploring strategic priorities for regional agricultural R&D investments in East and Central Africa. Liangzhi You and Michael Johnson, 2008.
775. Reforming the agricultural extension system in India: What do we know about what works where and why? Katharina Raabe, 2008.
774. An experimental inquiry into the effect of yardstick competition on corruption. Angelino Viceisza, 2008.
773. Alianzas para la innovación agroalimentaria en Bolivia: Lecciones para la formulación de políticas. Frank Hartwich, Luis Ampuero, Tito Arispe, Vicente EguezJaime Mendoza, y Nancy Alexaki, 2008.
772. Tracing power and influence in networks: Net-Map as a tool for research and strategic network planning. Eva Schiffer and Douglas Waale, 2008.
771. Estimating household income to monitor and evaluate public investment programs in Sub-Saharan Africa. Samuel Benin and Josee Randriamamonjy, 2008.
INTERNATIONAL FOOD POLICY RESEARCH INSTITUTE
www.ifpri.org
IFPRI HEADQUARTERS
2033 K Street, NW Washington, DC 20006-1002 USA Tel.: +1-202-862-5600 Fax: +1-202-467-4439 Email: [email protected]
IFPRI ADDIS ABABA
P. O. Box 5689 Addis Ababa, Ethiopia Tel.: +251 11 6463215 Fax: +251 11 6462927 Email: [email protected]
IFPRI NEW DELHI
CG Block, NASC Complex, PUSA New Delhi 110-012 India Tel.: 91 11 2584-6565 Fax: 91 11 2584-8008 / 2584-6572 Email: [email protected]


