29
www.pwc.co.uk China’s agricultural challenges Roads to be travelled October 2015
www.pwc.co.uk
China’s agriculturalchallenges
Roads to be travelled
October 2015

PricewaterhouseCoopers LLP, 1 Embankment Place, London WC2N 6RHT: +44 (0) 20 7583 5000, F: +44 (0) 20 7212 4652, www.pwc.co.uk
PricewaterhouseCoopers LLP is a limited liability partnership registered in England with registered number OC303525. The registered office ofPricewaterhouseCoopers LLP is 1 Embankment Place, London WC2N 6RH.PricewaterhouseCoopers LLP is authorised and regulated by the Financial Conduct Authorityfor designated investment business.
ForewordSince reforms began some four decades ago, the world’s attention has been focussed on China’s rapideconomic growth.
However, an equally fascinating story has been unfolding that holds more profound significance forpeople both within and beyond China’s borders.
Indeed, until recently, very little attention outside China has been devoted to understanding theagricultural industry that has effectively fuelled the workforce that has underpinned the country’seconomic miracle of recent decades. Still less has been devoted to the increasingly urgent question ofhow the country will meet its future nutritional needs.
This paper has been produced jointly by PwC UK’s China Business Group and Agribusiness team. Inrecognition of the importance of this topic we have produced this paper to highlight the mostsignificant of the challenges and opportunities presented by China’s evolving agricultural andnutritional needs.
We hope it will stimulate discussion with regard to the economic, environmental and socialramifications of these issues and inspire action to address challenges and capitalise on opportunities.Furthermore, we would welcome the opportunity to discuss the issues raised in this paper with youand may be reached via the contact information provided below.
Yours sincerely
Suwei Jiang Richard Ferguson,PwC Partner, China Business Group Agriculture Advisor to PwC

Roads to be travelled PwC Contents
Contents
Summary 1
China and agriculture: Roads to be travelled 2
Consumption 3
Supply 9
Supply constraints 13
Government and the agriculture sector 21
About PwC 25
Global Agribusiness Network 25
China Business Group 25
PwC Contacts 25
China’s agricultural challenges
Roads to be travelled PwC 1
Evidence of an economic slowdown in China isdemonstrated clearly by the leading indicators offalling commodities prices. Soft commodities priceshave paralleled the decline of copper, oil and gas inrecent months. But there is a significant differencebetween them. China is likely to shift its economicemphasis from a high-investment, export-drivenmodel towards one spurred by domesticconsumption. In crude, almost simplistic, terms,manufacturing and infrastructure spending slowswhile a service-led economy emerges over time. Thus,while there might be some short-term adjustment,growing affluence should remain the norm. In short,the need to build bridges, highways and commercialproperty will become less prominent but diets willcontinue to change. This will place enormous burdenson an already challenged domestic food system andhave significant ramifications on international tradein agriculture.
The average Chinese eats some 57kg of meat a year,an increase of 11kg from 2003 when some 46kg perperson was consumed. If Chinese meat consumptionmirrors other developed Chinese societies over time,we can assume Taiwan’s current 74kg consumption isa realistic long-term extrapolation. To satisfy thisincreased consumption, China will require anadditional 94mn tonnes of corn and soybeans forfeedstock. In turn, this will require an additional15mn hectares of agricultural land – an area the sizeof England and Wales – which China simply doesnot have.
Increasing meat consumption has manifested itself inChina losing its near self-sufficiency in soybeans – akey feedstock. While it was barely self-sufficient in the1970s and 1980s, from the late 1990s, Chineseimports of soybeans have steadily increased and nowrepresent 87% of consumption. Corn – the othermajor feedstock – is at the beginning of a trajectory,which will likely prove similar to the experience ofsoybeans. China now imports a small quantity of corncompared to the past when it was self-sufficient.Simultaneously, wheat and rice – the main food cropsfor human consumption – are just self-sufficient.
These demand pressures have been augmented bysupply-side constraints such as diminished farmland,polluted rivers, depleted aquifers, overuse offertilisers, unclear ownership of farmland and anarchaic legal code. Fixing these takes time, capital andeffort, which is why the Chinese government istackling these challenges with a broad range ofmeasures. Recent policy schemes include theliberalisation of leasing activity, the promotion oflarge-scale mechanised farms, tackling land and waterpollution and the restructuring ofagricultural subsidies.
As agriculture modernises, companies, which throughtechnology can transform yields, enhance output orallocate resources more efficiently, will makesignificant gains. So too will companies that candeliver secure, safe and sustainable sources of food.Global firms that can provide services such as digitalmapping, soil analysis, precision farming, wastemanagement, traceability and so on will findsubstantial opportunities.
Self-sufficiency is no longer a practical policy goal forChina. The government appears to recognise with itspriorities shifting towards high-value crops, such asfruits and vegetables, and a focus on quality and foodsafety. Simultaneously, China is venturing overseas tobolster its food security though investments in foreignfarmland and the acquisition of companies across thebroader food value chain. This is where the globalimpact of China’s increasing food needs will be feltmost acutely. Already, numerous countries haveerected barriers to foreign ownership of farmland as aresponse to land purchase by countries such as China.In some cases this already extends to the acquisitionof food companies. However, these acquisition trends,driven by domestic policy imperatives, are likelyto continue.
Summary
China’s agricultural challenges
Roads to be travelled PwC 2
China’s size, scale and its consequent impact on anybusiness sector globally have become almost a clichéto the many observers, analysts and watchers of theworld’s second largest economy. From the export oftextiles, electronics and toys to the import of iron oreand copper, attention has switched in recent yearstowards other sectors – most notably agriculture. Ithas become increasingly apparent that a moreaffluent and more urbanised China is experiencing adramatic increase in the consumption of food –specifically meat – and this too will have a globalimpact. How we came to this point is not a simple,straightforward story of growing affluence. Tounderstand the nuance, we need to look in detail athow Chinese food consumption has changed overrecent decades.
While most analysis approach this issue from anational level, a complete picture only emerges byconsidering three factors: – 1) the change in percapita calories consumed and its composition, 2)consumption patterns of specific commodity groupsper capita, and 3) the overall demand and supply ofcommodities at national level. Taking all threetogether provides clear insights into Chinese foodconsumption patterns and offers indicators forthe future.
China and agriculture: Roads tobe travelled
China’s agricultural challenges
Roads to be travelled PwC 3
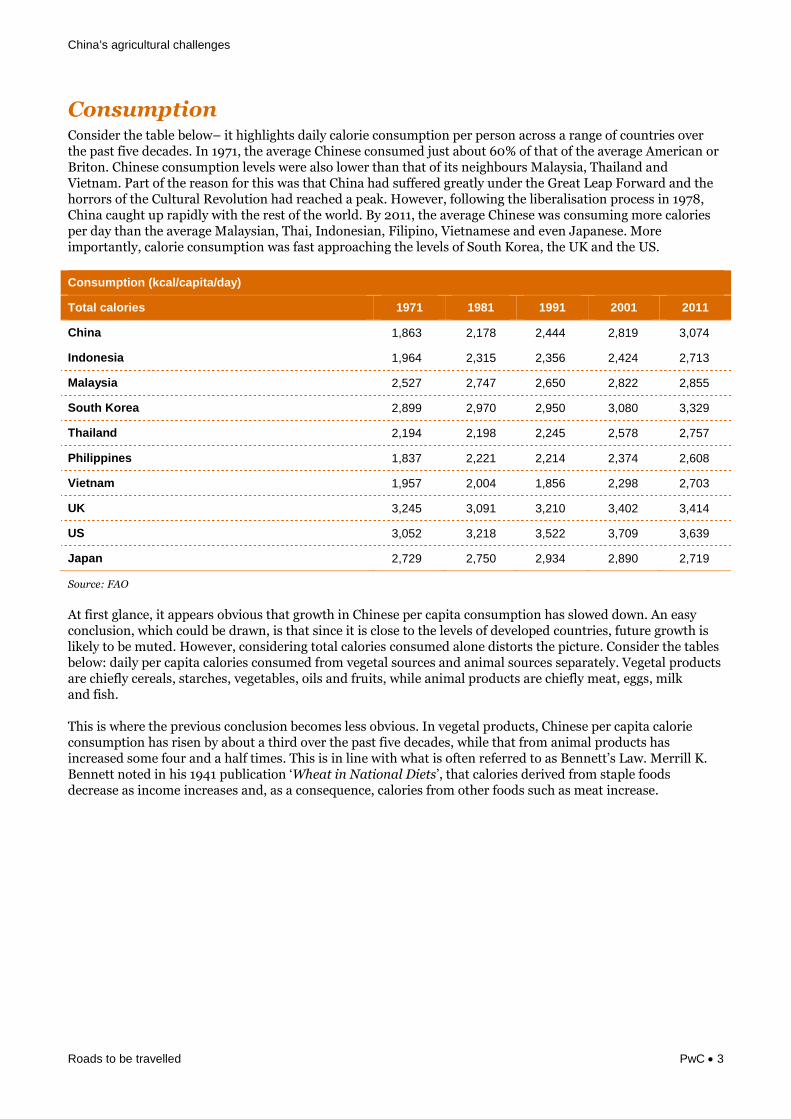
ConsumptionConsider the table below– it highlights daily calorie consumption per person across a range of countries overthe past five decades. In 1971, the average Chinese consumed just about 60% of that of the average American orBriton. Chinese consumption levels were also lower than that of its neighbours Malaysia, Thailand andVietnam. Part of the reason for this was that China had suffered greatly under the Great Leap Forward and thehorrors of the Cultural Revolution had reached a peak. However, following the liberalisation process in 1978,China caught up rapidly with the rest of the world. By 2011, the average Chinese was consuming more caloriesper day than the average Malaysian, Thai, Indonesian, Filipino, Vietnamese and even Japanese. Moreimportantly, calorie consumption was fast approaching the levels of South Korea, the UK and the US.
Consumption (kcal/capita/day)
Total calories 1971 1981 1991 2001 2011
China 1,863 2,178 2,444 2,819 3,074
Indonesia 1,964 2,315 2,356 2,424 2,713
Malaysia 2,527 2,747 2,650 2,822 2,855
South Korea 2,899 2,970 2,950 3,080 3,329
Thailand 2,194 2,198 2,245 2,578 2,757
Philippines 1,837 2,221 2,214 2,374 2,608
Vietnam 1,957 2,004 1,856 2,298 2,703
UK 3,245 3,091 3,210 3,402 3,414
US 3,052 3,218 3,522 3,709 3,639
Japan 2,729 2,750 2,934 2,890 2,719
Source: FAO
At first glance, it appears obvious that growth in Chinese per capita consumption has slowed down. An easyconclusion, which could be drawn, is that since it is close to the levels of developed countries, future growth islikely to be muted. However, considering total calories consumed alone distorts the picture. Consider the tablesbelow: daily per capita calories consumed from vegetal sources and animal sources separately. Vegetal productsare chiefly cereals, starches, vegetables, oils and fruits, while animal products are chiefly meat, eggs, milkand fish.
This is where the previous conclusion becomes less obvious. In vegetal products, Chinese per capita calorieconsumption has risen by about a third over the past five decades, while that from animal products hasincreased some four and a half times. This is in line with what is often referred to as Bennett’s Law. Merrill K.Bennett noted in his 1941 publication ‘Wheat in National Diets’, that calories derived from staple foodsdecrease as income increases and, as a consequence, calories from other foods such as meat increase.

China’s agricultural challenges
Roads to be travelled PwC 4
Consumption (kcal/capita/day)
Vegetal calories 1971 1981 1991 2001 2011
China 1,738 2,002 2,128 2,296 2,383
Indonesia 1,904 2,238 2,242 2,299 2,536
Malaysia 2,244 2,336 2,134 2,297 2,336
South Korea 1,944 2,061 2,136 1,953 1,974
Thailand 2,007 1,995 1,978 2,284 2,410
Philippines 1,581 1,980 1,925 2,020 2,218
Vietnam 1,829 1,880 1,690 2,004 2,129
UK 2,014 1,965 2,175 2,395 2,425
US 2,056 2,258 2,544 2,697 2,644
Japan 2,284 2,211 2,316 2,287 2,166
Source: FAO
Consumption (kcal/capita/day)
Animal calories 1971 1981 1991 2001 2011
China 125 177 317 523 691
Indonesia 60 77 115 126 177
Malaysia 284 411 516 525 519
South Korea 153 235 233 143 128
Thailand 188 203 267 294 347
Philippines 256 241 290 354 390
Vietnam 128 124 166 294 574
UK 1,231 1,126 1,035 1,007 989
US 996 961 978 1,012 995
Japan 445 539 618 603 553
Source: FAO
Compared to the US and the UK, Chinese vegetal-derived calories in 2011 are just marginally behind, whileanimal-derived calories are still 30% lower. This implies that in the future, growth in vegetal consumption islikely to be muted, but growth in animal protein will likely remain strong. In other words, the overall Chinesefood consumption picture will remain a globally prominent theme in the years ahead – at least with respect toanimal products.
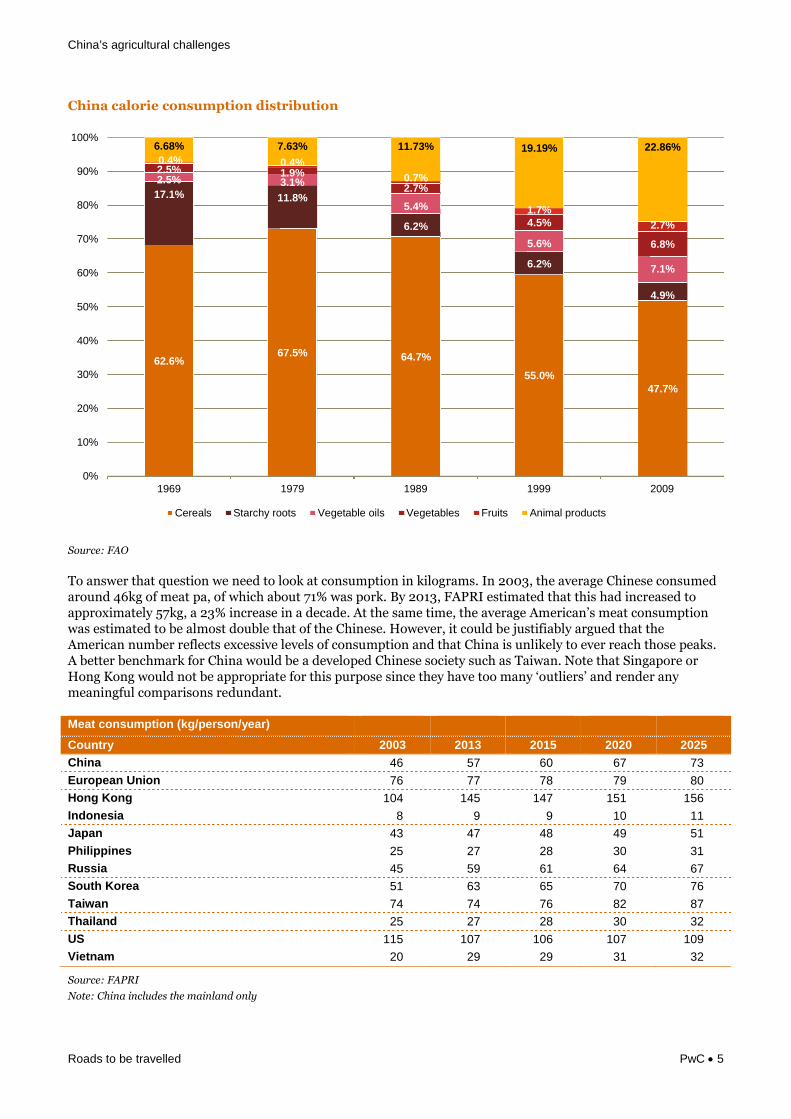
Breaking down the consumption statistics further, the chart below shows the change in Chinese per capitacalorie contribution from different commodities over the past five decades. The most obvious observations arethe decline in calorie contribution from cereals – from approximately two-thirds in 1971 to less than half in2011, and the increase in calorie contribution from animal products from 7% to 22% over the same period.Since consumption of animal products implies the indirect consumption of cereals, the net change in cerealdemand is not clear from this.
China’s agricultural challenges
Roads to be travelled PwC 5
China calorie consumption distribution
Source: FAO
To answer that question we need to look at consumption in kilograms. In 2003, the average Chinese consumedaround 46kg of meat pa, of which about 71% was pork. By 2013, FAPRI estimated that this had increased toapproximately 57kg, a 23% increase in a decade. At the same time, the average American’s meat consumptionwas estimated to be almost double that of the Chinese. However, it could be justifiably argued that theAmerican number reflects excessive levels of consumption and that China is unlikely to ever reach those peaks.A better benchmark for China would be a developed Chinese society such as Taiwan. Note that Singapore orHong Kong would not be appropriate for this purpose since they have too many ‘outliers’ and render anymeaningful comparisons redundant.
Meat consumption (kg/person/year)
Country 2003 2013 2015 2020 2025
China 46 57 60 67 73
European Union 76 77 78 79 80
Hong Kong 104 145 147 151 156
Indonesia 8 9 9 10 11
Japan 43 47 48 49 51
Philippines 25 27 28 30 31
Russia 45 59 61 64 67
South Korea 51 63 65 70 76
Taiwan 74 74 76 82 87
Thailand 25 27 28 30 32
US 115 107 106 107 109
Vietnam 20 29 29 31 32
Source: FAPRI
Note: China includes the mainland only
62.6%67.5% 64.7%
55.0%47.7%
17.1% 11.8%
6.2%
6.2%
4.9%
2.5% 3.1%
5.4%
5.6%
7.1%
2.5% 1.9%
2.7%
4.5%
6.8%
0.4% 0.4%
0.7%
1.7%
2.7%
6.68% 7.63% 11.73% 19.19% 22.86%
0%
10%
20%
30%
40%
50%
60%
70%
80%
90%
100%
1969 1979 1989 1999 2009
Cereals Starchy roots Vegetable oils Vegetables Fruits Animal products
China’s agricultural challenges
Roads to be travelled PwC 6
The average Taiwanese consumed an estimated 74kgof meat in 2013 – 30% more than the averageChinese. If China’s per capita meat consumptionequalled Taiwanese levels immediately, China wouldrequire an additional 94mnt of grains – almost theentire expected corn output of Brazil and Argentina in2014. This shows the impact that meat demand hason cereals indirectly. Fortunately, perhaps, FAPRIexpects China and Taiwan to equalise only after 2025.
The above analysis is at the individual level. To get anational view, we simply have to aggregate thenumbers across the population. However, todetermine future trends, we need to take into accountanother variable – namely, the split between rural and
urban consumers. Given the different socio-economicprofiles of the two, their consumption patterns arevastly different. Furthermore, given China’sincreasing levels of urbanisation, the average citizen isbecoming more urbanised. Thus to establish theoutlook for the country as a whole, we need toexamine both urban and rural consumptionseparately and combine that while taking into accountincreasing urbanisation rates.
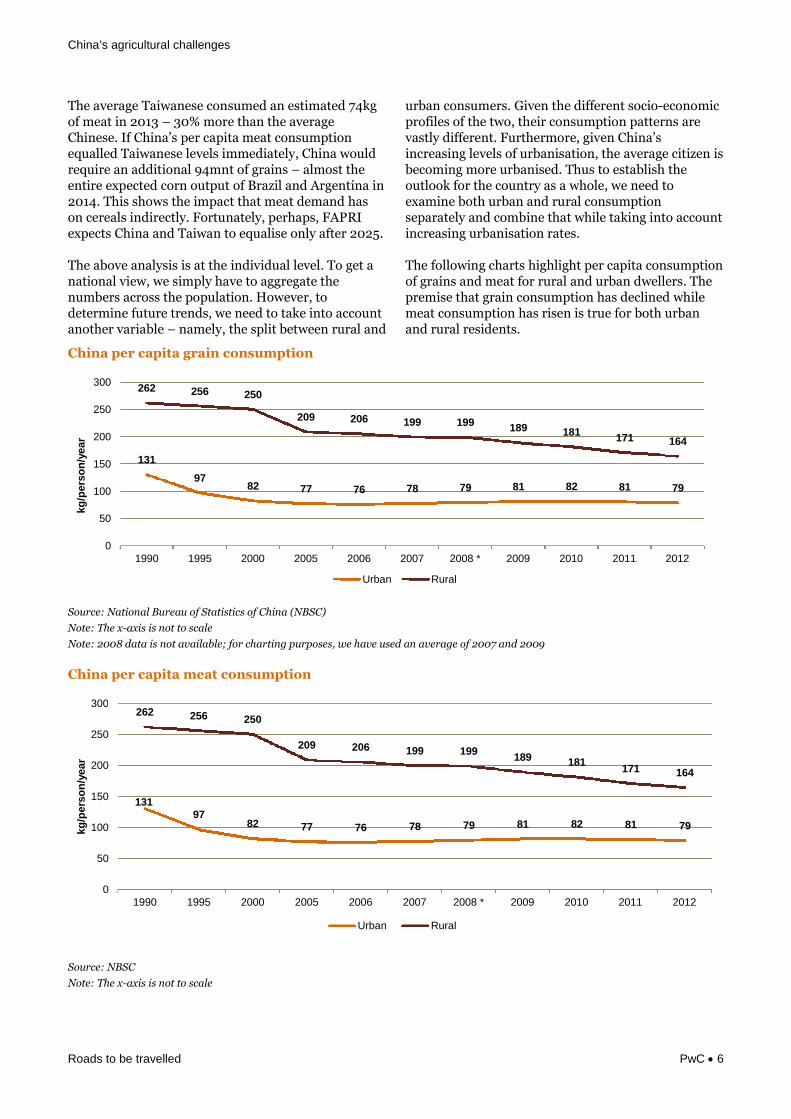
The following charts highlight per capita consumptionof grains and meat for rural and urban dwellers. Thepremise that grain consumption has declined whilemeat consumption has risen is true for both urbanand rural residents.
China per capita grain consumption
Source: National Bureau of Statistics of China (NBSC)
Note: The x-axis is not to scale
Note: 2008 data is not available; for charting purposes, we have used an average of 2007 and 2009
China per capita meat consumption
Source: NBSC
Note: The x-axis is not to scale
131
9782 77 76 78 79 81 82 81 79
262 256 250
209 206 199 199189 181
171 164
0
50
100
150
200
250
300
1990 1995 2000 2005 2006 2007 2008 * 2009 2010 2011 2012
kg
/pers
on
/year
Urban Rural
13197
82 77 76 78 79 81 82 81 79
262 256 250
209 206 199 199189 181
171 164
0
50
100
150
200
250
300
1990 1995 2000 2005 2006 2007 2008 * 2009 2010 2011 2012
kg
/pers
on
/year
Urban Rural
China’s agricultural challenges
Roads to be travelled PwC 7
Given that meat ultimately requires grains in the form of feed, this means that direct grain consumption hasdeclined much more dramatically. However, in the future, the balance of increasing meat consumption anddecreasing direct grain consumptions could be positive or negative.
Before we try to estimate that, a caveat is in order. The statistics noted above are sourced from National Bureauof Statistics of China (NBSC) and the per capita meat consumption numbers are lower compared to those fromFAPRI or FAO. This discrepancy is usually attributed to two factors – these are estimates from householdsurveys, which do not effectively measure consumption that occurs outside homes, which is especially relevantfor urban residents; and, consumption by migrant workers is not accounted for accurately.
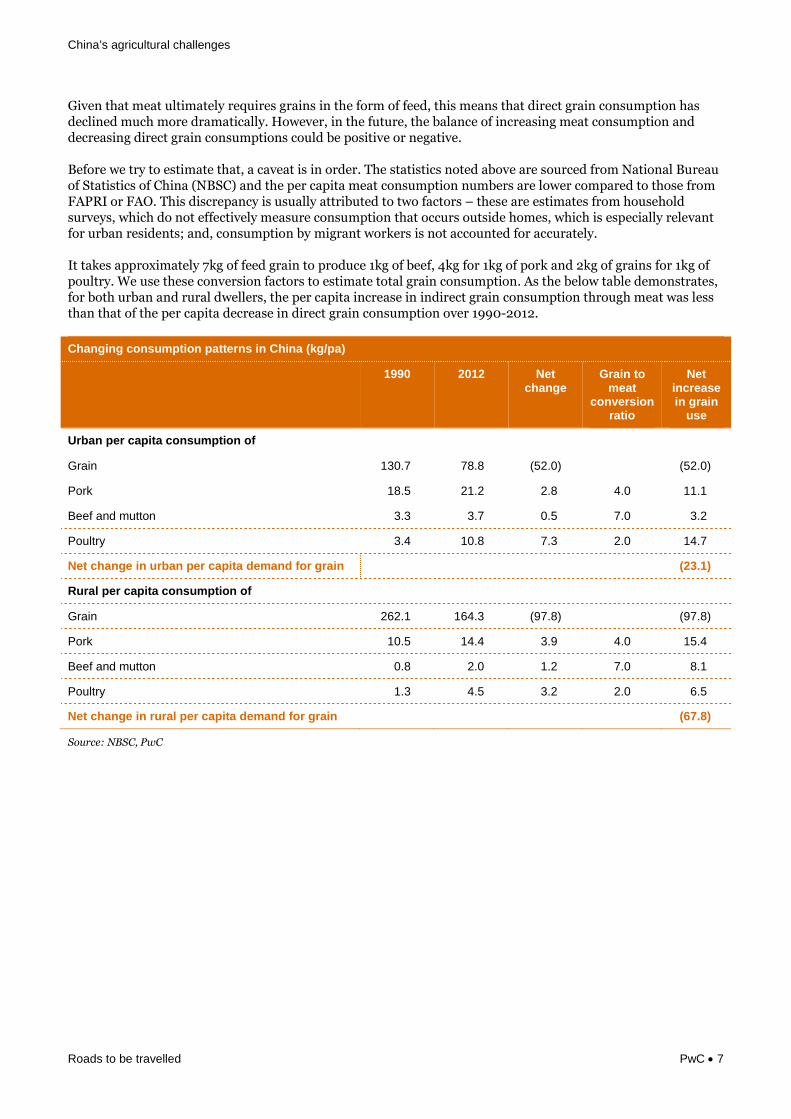
It takes approximately 7kg of feed grain to produce 1kg of beef, 4kg for 1kg of pork and 2kg of grains for 1kg ofpoultry. We use these conversion factors to estimate total grain consumption. As the below table demonstrates,for both urban and rural dwellers, the per capita increase in indirect grain consumption through meat was lessthan that of the per capita decrease in direct grain consumption over 1990-2012.
Changing consumption patterns in China (kg/pa)
1990 2012 Netchange
Grain tomeat
conversionratio
Netincreasein grain
use
Urban per capita consumption of
Grain 130.7 78.8 (52.0) (52.0)
Pork 18.5 21.2 2.8 4.0 11.1
Beef and mutton 3.3 3.7 0.5 7.0 3.2
Poultry 3.4 10.8 7.3 2.0 14.7
Net change in urban per capita demand for grain (23.1)
Rural per capita consumption of
Grain 262.1 164.3 (97.8) (97.8)
Pork 10.5 14.4 3.9 4.0 15.4
Beef and mutton 0.8 2.0 1.2 7.0 8.1
Poultry 1.3 4.5 3.2 2.0 6.5
Net change in rural per capita demand for grain (67.8)
Source: NBSC, PwC

China’s agricultural challenges
Roads to be travelled PwC 8
While on a per capita level there is a decline in totalgrain consumption, on an aggregate level, Chinesegrain consumption (rice, wheat, corn and soybeans)has increased – from about 316mnt in 1990 to545mnt in 2012. This is mainly attributable to anincreasing population and urbanisation. We wouldexpect total grain consumption in China to continueincreasing for four reasons. First, China’s population growth may be
slowing, but it is still growing.
Second, the decline in urban per capita directgrain consumption is showing signs of levellingoff. It declined to a low of 75.9kg in 2006, andthen rose in later years to reach 81.5kg in 2010.It again declined over the following two years to78.8kg in 2012. Combined with a likely increasein indirect urban grain consumption, thismeans that total per capita urban grainconsumption will most likely rise. While ruralper capita grain consumption is likely tocontinue decreasing, its effect in the aggregatewould be muted as more people migrate to thecities.
Third, as China’s meat production industrialises,feed grain demand will increase – the average pigraised in a Chinese factory farm consumes 350kgto reach slaughter weight, while that raised on afamily farm consumes only 150kg (i.e., the restcomes from household waste and so on).
Finally, we have restricted our analysis to the useof grains for food. In other words, we haveomitted the impact of industrial uses of grain suchas ethanol or biodiesel production, which maypossibly increase in the future
China’s agricultural challenges
Roads to be travelled PwC 9
SupplySelf-sufficiency in grains has long been a hallmark ofChinese government policy. Since 1996, the explicitaim was to produce 95% of its grains domestically. Or,as Chinese officials put it somewhat less prosaically,the Chinese must ‘hold the rice bowl firmly in ourhands’. However, its meaning has evolved over theyears. While it was initially understood to include rice,wheat and corn, policy makers now seemingly countonly rice and wheat, that is, the two grains useddirectly for human consumption. And soon, it couldend up as an ‘empty bowl’ – as self-sufficiencybecomes an increasingly unrealistic ideal.
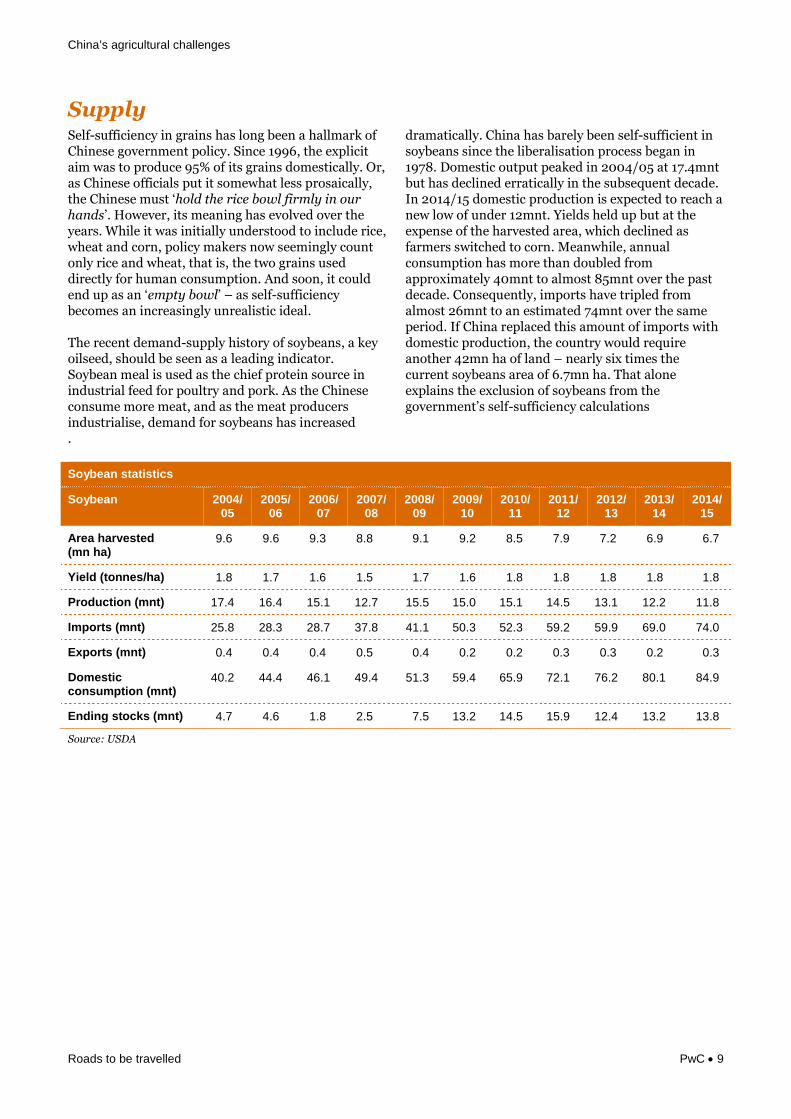
The recent demand-supply history of soybeans, a keyoilseed, should be seen as a leading indicator.Soybean meal is used as the chief protein source inindustrial feed for poultry and pork. As the Chineseconsume more meat, and as the meat producersindustrialise, demand for soybeans has increased
dramatically. China has barely been self-sufficient insoybeans since the liberalisation process began in1978. Domestic output peaked in 2004/05 at 17.4mntbut has declined erratically in the subsequent decade.In 2014/15 domestic production is expected to reach anew low of under 12mnt. Yields held up but at theexpense of the harvested area, which declined asfarmers switched to corn. Meanwhile, annualconsumption has more than doubled fromapproximately 40mnt to almost 85mnt over the pastdecade. Consequently, imports have tripled fromalmost 26mnt to an estimated 74mnt over the sameperiod. If China replaced this amount of imports withdomestic production, the country would requireanother 42mn ha of land – nearly six times thecurrent soybeans area of 6.7mn ha. That aloneexplains the exclusion of soybeans from thegovernment’s self-sufficiency calculations
.
Soybean statistics
Soybean 2004/05
2005/06
2006/07
2007/08
2008/09
2009/10
2010/11
2011/12
2012/13
2013/14
2014/15
Area harvested(mn ha)
9.6 9.6 9.3 8.8 9.1 9.2 8.5 7.9 7.2 6.9 6.7
Yield (tonnes/ha) 1.8 1.7 1.6 1.5 1.7 1.6 1.8 1.8 1.8 1.8 1.8
Production (mnt) 17.4 16.4 15.1 12.7 15.5 15.0 15.1 14.5 13.1 12.2 11.8
Imports (mnt) 25.8 28.3 28.7 37.8 41.1 50.3 52.3 59.2 59.9 69.0 74.0
Exports (mnt) 0.4 0.4 0.4 0.5 0.4 0.2 0.2 0.3 0.3 0.2 0.3
Domesticconsumption (mnt)
40.2 44.4 46.1 49.4 51.3 59.4 65.9 72.1 76.2 80.1 84.9
Ending stocks (mnt) 4.7 4.6 1.8 2.5 7.5 13.2 14.5 15.9 12.4 13.2 13.8
Source: USDA
China’s agricultural challenges
Roads to be travelled PwC 10
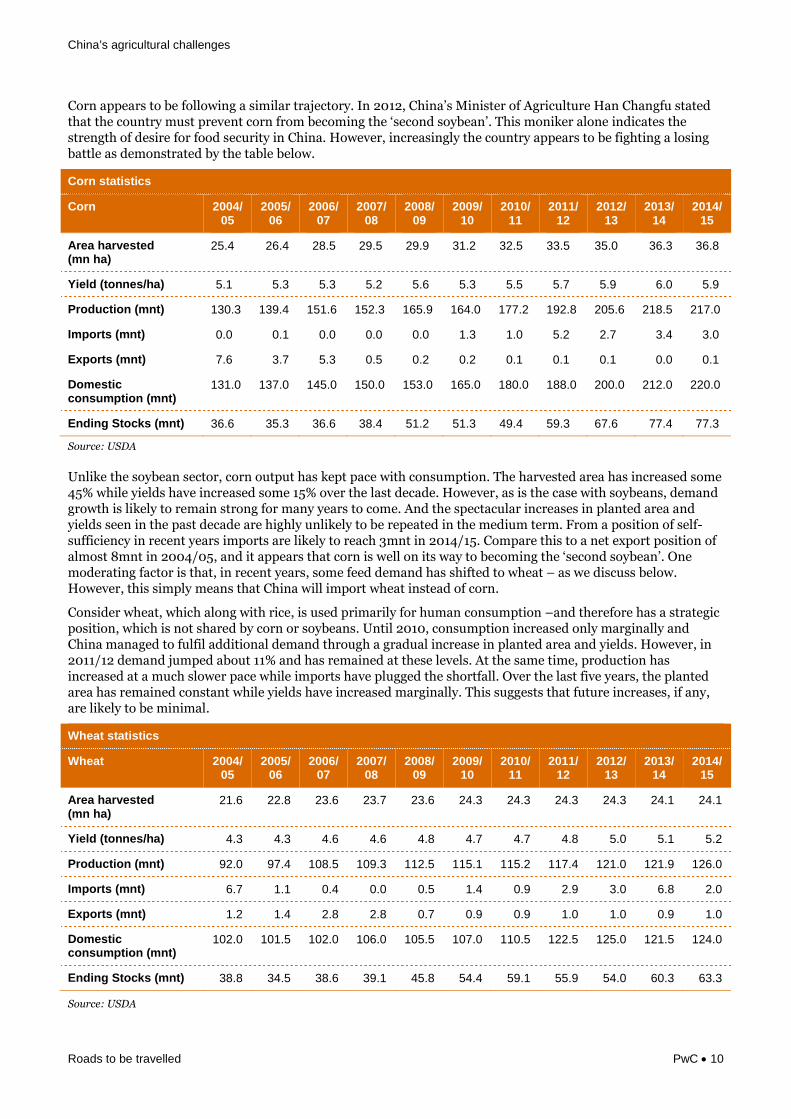
Corn appears to be following a similar trajectory. In 2012, China’s Minister of Agriculture Han Changfu statedthat the country must prevent corn from becoming the ‘second soybean’. This moniker alone indicates thestrength of desire for food security in China. However, increasingly the country appears to be fighting a losingbattle as demonstrated by the table below.
Corn statistics
Corn 2004/05
2005/06
2006/07
2007/08
2008/09
2009/10
2010/11
2011/12
2012/13
2013/14
2014/15
Area harvested(mn ha)
25.4 26.4 28.5 29.5 29.9 31.2 32.5 33.5 35.0 36.3 36.8
Yield (tonnes/ha) 5.1 5.3 5.3 5.2 5.6 5.3 5.5 5.7 5.9 6.0 5.9
Production (mnt) 130.3 139.4 151.6 152.3 165.9 164.0 177.2 192.8 205.6 218.5 217.0
Imports (mnt) 0.0 0.1 0.0 0.0 0.0 1.3 1.0 5.2 2.7 3.4 3.0
Exports (mnt) 7.6 3.7 5.3 0.5 0.2 0.2 0.1 0.1 0.1 0.0 0.1
Domesticconsumption (mnt)
131.0 137.0 145.0 150.0 153.0 165.0 180.0 188.0 200.0 212.0 220.0
Ending Stocks (mnt) 36.6 35.3 36.6 38.4 51.2 51.3 49.4 59.3 67.6 77.4 77.3
Source: USDA
Unlike the soybean sector, corn output has kept pace with consumption. The harvested area has increased some45% while yields have increased some 15% over the last decade. However, as is the case with soybeans, demandgrowth is likely to remain strong for many years to come. And the spectacular increases in planted area andyields seen in the past decade are highly unlikely to be repeated in the medium term. From a position of self-sufficiency in recent years imports are likely to reach 3mnt in 2014/15. Compare this to a net export position ofalmost 8mnt in 2004/05, and it appears that corn is well on its way to becoming the ‘second soybean’. Onemoderating factor is that, in recent years, some feed demand has shifted to wheat – as we discuss below.However, this simply means that China will import wheat instead of corn.
Consider wheat, which along with rice, is used primarily for human consumption –and therefore has a strategicposition, which is not shared by corn or soybeans. Until 2010, consumption increased only marginally andChina managed to fulfil additional demand through a gradual increase in planted area and yields. However, in2011/12 demand jumped about 11% and has remained at these levels. At the same time, production hasincreased at a much slower pace while imports have plugged the shortfall. Over the last five years, the plantedarea has remained constant while yields have increased marginally. This suggests that future increases, if any,are likely to be minimal.
Wheat statistics
Wheat 2004/05
2005/06
2006/07
2007/08
2008/09
2009/10
2010/11
2011/12
2012/13
2013/14
2014/15
Area harvested(mn ha)
21.6 22.8 23.6 23.7 23.6 24.3 24.3 24.3 24.3 24.1 24.1
Yield (tonnes/ha) 4.3 4.3 4.6 4.6 4.8 4.7 4.7 4.8 5.0 5.1 5.2
Production (mnt) 92.0 97.4 108.5 109.3 112.5 115.1 115.2 117.4 121.0 121.9 126.0
Imports (mnt) 6.7 1.1 0.4 0.0 0.5 1.4 0.9 2.9 3.0 6.8 2.0
Exports (mnt) 1.2 1.4 2.8 2.8 0.7 0.9 0.9 1.0 1.0 0.9 1.0
Domesticconsumption (mnt)
102.0 101.5 102.0 106.0 105.5 107.0 110.5 122.5 125.0 121.5 124.0
Ending Stocks (mnt) 38.8 34.5 38.6 39.1 45.8 54.4 59.1 55.9 54.0 60.3 63.3
Source: USDA
China’s agricultural challenges
Roads to be travelled PwC 11
A key feature highlighted the table above is the sudden jump in demand for wheat in recent years. The reasonfor this rise is the growing use of wheat as feed. Total demand is split into food, seed, and industrial demand(FSI) and feed demand. FSI demand has barely moved in recent years and only rose marginally over the lastthree years. However, feed demand has risen steadily. In 2011/2012, it nearly doubled and has stayed at thatlevel since. While corn remains the main carbohydrate component of industrial feed other cereals such as wheatare also used depending on relative prices.
Wheat consumption split
Wheat 2004/05
2005/06
2006/07
2007/08
2008/09
2009/10
2010/11
2011/12
2012/13
2013/14
2014/15
Feed consumption (mnt) 4.0 3.5 4.0 8.0 8.0 10.0 13.0 24.0 25.0 21.0 23.0
Food, seed and industrialconsumption (mnt)
98.0 98.0 98.0 98.0 97.5 97.0 97.5 98.5 100.0 100.5 101.0
Total (mnt) 102.0 101.5 102.0 106.0 105.5 107.0 110.5 122.5 125.0 121.5 124.0
Source: USDA
While we can safely predict a rise in feed use, the split between corn and wheat is difficult to estimate. However,regardless of the split, it is reasonably certain that the bulk of this excess consumption will be satisfied byimports. The reason for our pessimistic view on Chinese production is explained later in this report when welook at supply constraints.
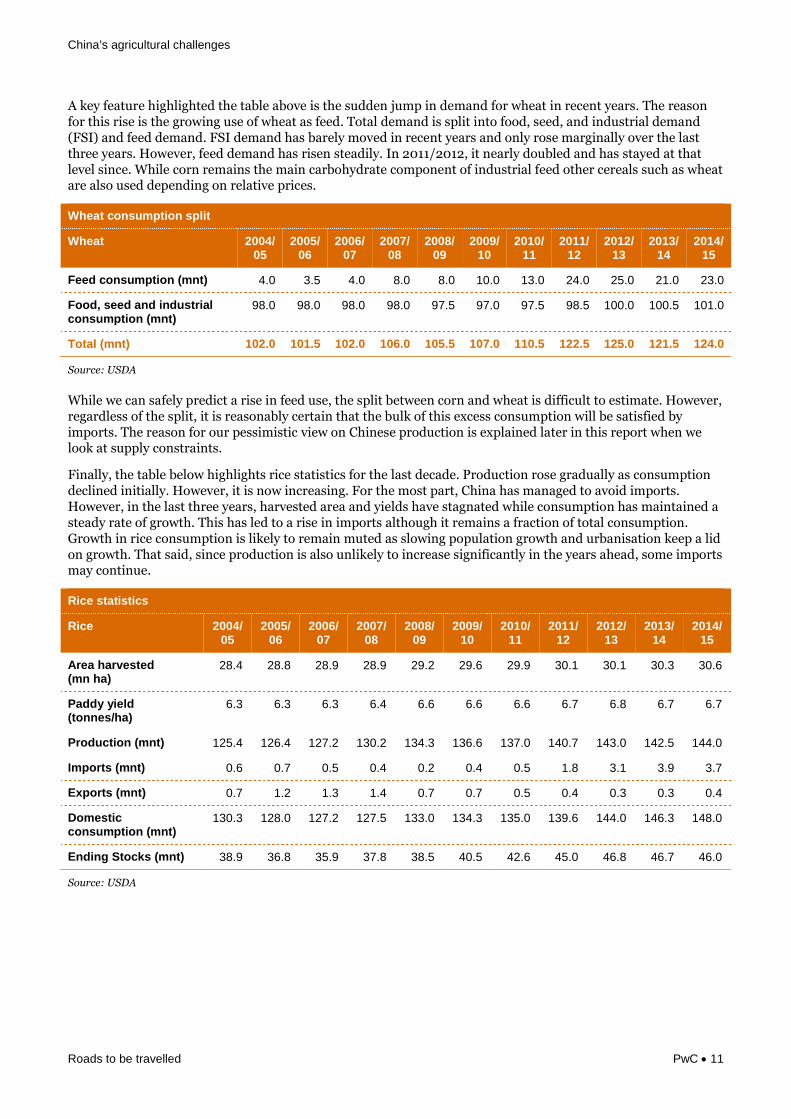
Finally, the table below highlights rice statistics for the last decade. Production rose gradually as consumptiondeclined initially. However, it is now increasing. For the most part, China has managed to avoid imports.However, in the last three years, harvested area and yields have stagnated while consumption has maintained asteady rate of growth. This has led to a rise in imports although it remains a fraction of total consumption.Growth in rice consumption is likely to remain muted as slowing population growth and urbanisation keep a lidon growth. That said, since production is also unlikely to increase significantly in the years ahead, some importsmay continue.
Rice statistics
Rice 2004/05
2005/06
2006/07
2007/08
2008/09
2009/10
2010/11
2011/12
2012/13
2013/14
2014/15
Area harvested(mn ha)
28.4 28.8 28.9 28.9 29.2 29.6 29.9 30.1 30.1 30.3 30.6
Paddy yield(tonnes/ha)
6.3 6.3 6.3 6.4 6.6 6.6 6.6 6.7 6.8 6.7 6.7
Production (mnt) 125.4 126.4 127.2 130.2 134.3 136.6 137.0 140.7 143.0 142.5 144.0
Imports (mnt) 0.6 0.7 0.5 0.4 0.2 0.4 0.5 1.8 3.1 3.9 3.7
Exports (mnt) 0.7 1.2 1.3 1.4 0.7 0.7 0.5 0.4 0.3 0.3 0.4
Domesticconsumption (mnt)
130.3 128.0 127.2 127.5 133.0 134.3 135.0 139.6 144.0 146.3 148.0
Ending Stocks (mnt) 38.9 36.8 35.9 37.8 38.5 40.5 42.6 45.0 46.8 46.7 46.0
Source: USDA
China’s agricultural challenges
Roads to be travelled PwC 12
Early in 2014, the State Council called for grainproduction to stabilise at 550mnt, lower than the602mnt produced in 2013, signalling a shift from self-sufficiency. It seeks to set a priority on labour-intensive and high-value crops such as fruits andvegetables at the expense of land-intensive, low-valuegrains. Furthermore, the guidelines demonstrate anincreasing emphasis on for quality and food safety.Some of this newfound stress on quality and safetystems from the many negative cases reported inrecent years in China. These range from cadmiumcontamination of rice, adulterated fox meat sold asmutton and dead pigs floating down the HuangpuRiver through Shanghai.
Part of the reason for this strategic shift, in our view,is merely the government facing up to reality. To meetrapidly rising demand, supply can increase primarilythrough an increase in planted area and enhancedyields. In China’s case, while yields can increase – anarea we discuss later – an increase in planted area ishighly unlikely. In short, China has been struggling tomaintain its ‘red line’ of 120mn ha of farmland due toland degradation, water scarcity and pollution.
Thus, the only option is to set priorities. That is,accept that self-sufficiency is not possible for all themajor grains and oilseeds, which is what the countryappears to be doing in practice. Initially, thegovernment encouraged corn planting over soybeansover the last decade. Now, rice and wheat remain highpriority grains given that they are used for humanconsumption, while corn and soybeans are consideredlower priority.
Even with meat, there are two options available:import meat directly or import feed grains andproduce meat domestically. The implications of thesealternatives are quite different. If China imports cornand soybeans from the US or Brazil for its livestock, itwill have to address the livestock-related negativeeffects on the environment and health. On the plusside, it will have an industry that provides high levelsof employment. If China were to import meat fromthe US or Brazil, it would transfer environmental andhealth problems to the US or Brazil but would besusceptible to supply and price volatility. The othermajor benefit of this approach would be to allowscarce land and water resources to be shifted fromanimal husbandry to priority crops such as riceand wheat.
Evidence suggests that China is doing a bit of both. Aswe saw earlier, in the past decade, corn imports havegone from being non-existent to about 3mnt andsoybean imports have tripled to 74mnt.Simultaneously, meat imports have grown five-fold to1.5mnt. This trend is likely to continue with both feedgrains and meat imports growing. The purchase of theUSA’s largest pork producer Smithfield, by theChinese company Shuanghui International (nowcalled the WH Group), is a demonstration of howChinese meat imports are likely to rise.
China’s agricultural challenges
Roads to be travelled PwC 13
Supply constraintsChina feeds 20% of the world’s population with just8% of the earth’s arable land, which works out atabout 0.09ha per person. The ‘red line’ of 120mn haof farmland as a Chinese policy goal is anacknowledgement of this pressure. The first policydocument of 2014, referred to as ‘No.1 Document’,emphasised that the ‘red line’ should bestrictly protected.
The reason for this obsession is simple: China has lostfarmland consistently over the years due tourbanisation, construction, land degradation and soon. According to China’s first national land survey in1996, arable land amounted to 130mn ha. This wasestimated to have fallen to about 121mn ha by 2008.However, after a second national land survey whichconcluded in 2009, but whose result were onlypublished last year, arable land was now estimated atabout 135mn ha. However, after deducting land setaside for restoration or polluted, available arable areawas estimated to be just above 120mn ha.
The ‘No.1 Document’ also recognises the importanceof developing sustainable agriculture and the need torestore polluted and degraded land. Land is degradedusually due to over-cultivation, over-grazing anddeforestation. In 2008, a three-year study conductedjointly by the Ministry of Water Resources, theChinese Academy of Sciences and the ChineseAcademy of Engineering, found that over 350mn haof land was affected by erosion, of which 160mn hawas due to water and 200mn ha was due to wind.Combined, about 4.5bn tonnes of soil were erodedeach year, at a cost of RMB200bn since 2000.
Land can also be degraded by pollution and this hasbecome a major concern in recent years. Earlier thisyear, China’s vice-minister of land and resources,Wang Shiyuan, noted that a soil survey had identifiedsome 3.33mn ha of contaminated land. Not that theseare new problems. In 2006, Zhou Shengxian, thedirector of the State Environmental ProtectionAdministration (SEPA) said that China faced ‘serious’soil pollution that would affect both people’s healthand the environment. He further noted thatapproximately 12mnt of grain are polluted each yearby heavy metals from the soil, with economic losses ofover US$2.5bn.
To tackle this issue, SEPA along with the Ministry ofLand and Resources jointly launched a soil pollutionsurvey with a budget of US$125m, with the aim ofassessing land pollution due to heavy metals,pesticides, and organic pollutants, and use the resultsto rehabilitate affected land. While this soil surveywas completed in 2010, its results were neverannounced. The Environment Ministry rejectedrequests for the survey data to be published sayingthat they were a ‘state secret’. Fears that the surveyresults might prove disquieting may be well founded.According to Bai Chengshou, Deputy Head of theNature and Ecology Conservation Department at theMinistry of Environmental Protection, the results ofthe survey would be published after further samplingto improve accuracy. He also said that thegovernment was in the process of coming up with anaction plan to control soil pollution.
Recently, the government released statistics from asoil survey – it is not clear if it is the one previouslynoted – which indicate that nearly a fifth of China’sfarmland is polluted mostly by human, industrial andagricultural activities. Again, there were assurances ofthe government taking action to stop and reversethis pollution.
The key point here is that the Chinese government isstruggling to maintain its existing cultivated landbank. Under these circumstances, increasing thesupply of available land is highly unlikely. So, anyincrease in output will have to come viaenhanced yields.
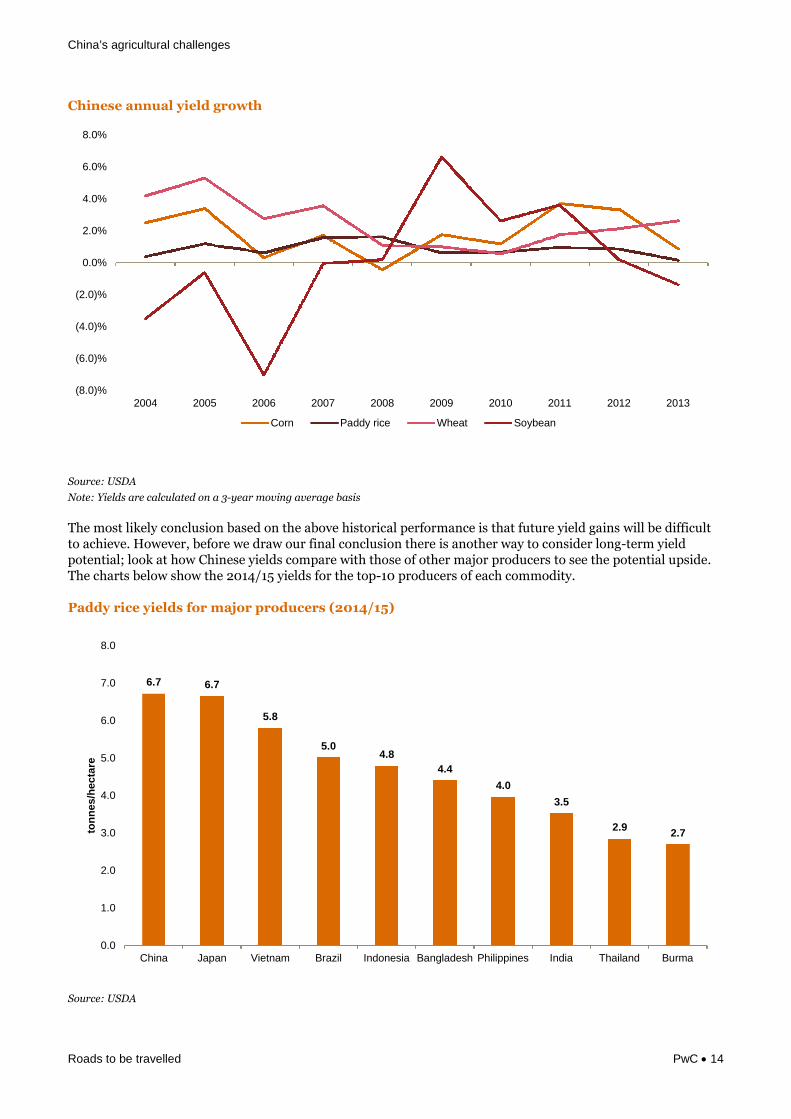
As we pointed out in the previous section, yields ofmajor commodities have stagnated or grown slowly inrecent years. The chart below shows the yield growthover the past decade for rice, wheat, corn andsoybeans. The yield growth for both wheat and cornare showing a declining trend, while that for rice ismoribund and just barely positive. Soybean yieldgrowth has been erratic in recent years and on a netbasis has been effectively stagnant over thepast decade.
China’s agricultural challenges
Roads to be travelled PwC 14
Chinese annual yield growth
Source: USDA
Note: Yields are calculated on a 3-year moving average basis
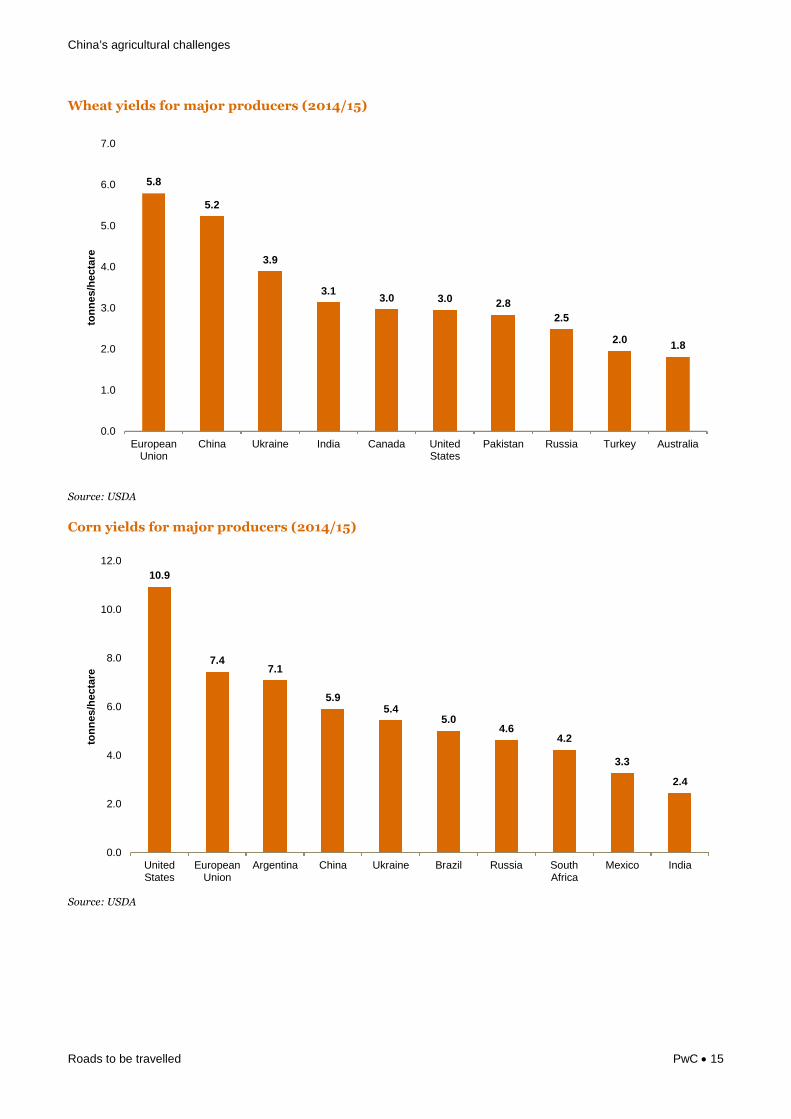
The most likely conclusion based on the above historical performance is that future yield gains will be difficultto achieve. However, before we draw our final conclusion there is another way to consider long-term yieldpotential; look at how Chinese yields compare with those of other major producers to see the potential upside.The charts below show the 2014/15 yields for the top-10 producers of each commodity.
Paddy rice yields for major producers (2014/15)
Source: USDA
(8.0)%
(6.0)%
(4.0)%
(2.0)%
0.0%
2.0%
4.0%
6.0%
8.0%
2004 2005 2006 2007 2008 2009 2010 2011 2012 2013
Corn Paddy rice Wheat Soybean
6.7 6.7
5.8
5.04.8
4.4
4.0
3.5
2.92.7
0.0
1.0
2.0
3.0
4.0
5.0
6.0
7.0
8.0
China Japan Vietnam Brazil Indonesia Bangladesh Philippines India Thailand Burma
ton
nes/h
ecta
re
China’s agricultural challenges
Roads to be travelled PwC 15
Wheat yields for major producers (2014/15)
Source: USDA
Corn yields for major producers (2014/15)
Source: USDA
5.8
5.2
3.9
3.13.0 3.0 2.8
2.5
2.01.8
0.0
1.0
2.0
3.0
4.0
5.0
6.0
7.0
EuropeanUnion
China Ukraine India Canada UnitedStates
Pakistan Russia Turkey Australia
ton
nes/h
ecta
re
10.9
7.47.1
5.95.4
5.04.6
4.2
3.3
2.4
0.0
2.0
4.0
6.0
8.0
10.0
12.0
UnitedStates
EuropeanUnion
Argentina China Ukraine Brazil Russia SouthAfrica
Mexico India
ton
nes/h
ecta
re
China’s agricultural challenges
Roads to be travelled PwC 16
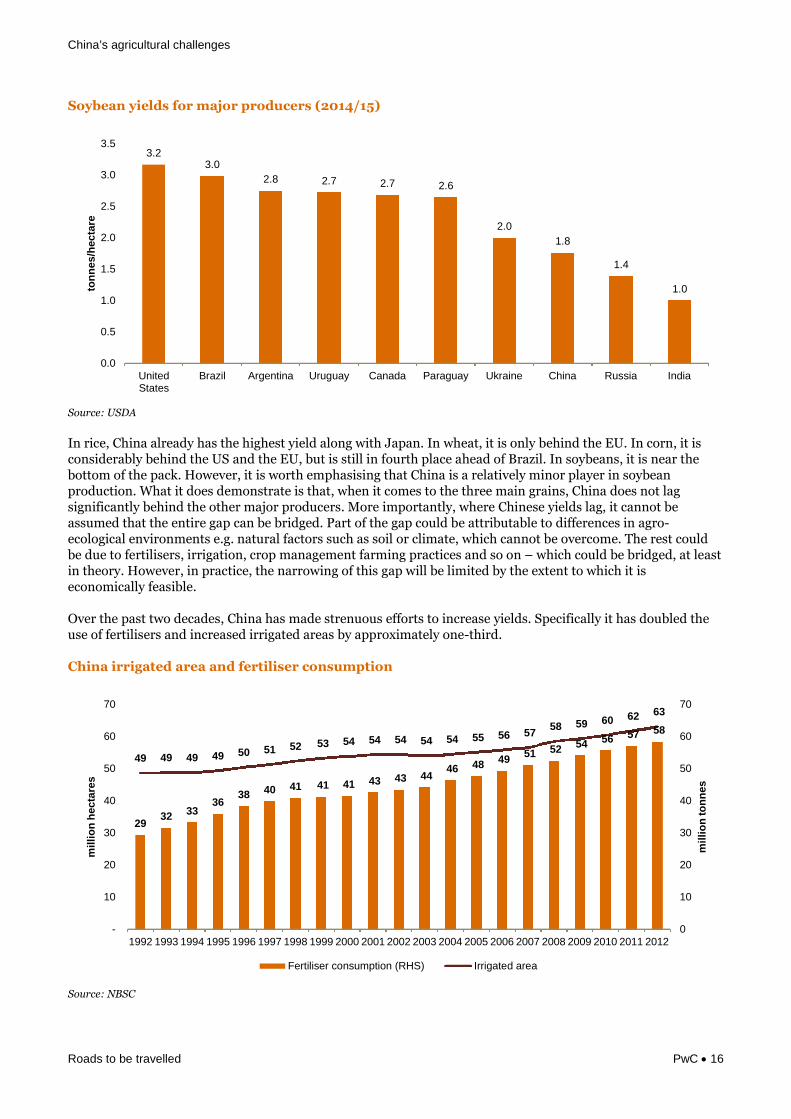
Soybean yields for major producers (2014/15)
Source: USDA
In rice, China already has the highest yield along with Japan. In wheat, it is only behind the EU. In corn, it isconsiderably behind the US and the EU, but is still in fourth place ahead of Brazil. In soybeans, it is near thebottom of the pack. However, it is worth emphasising that China is a relatively minor player in soybeanproduction. What it does demonstrate is that, when it comes to the three main grains, China does not lagsignificantly behind the other major producers. More importantly, where Chinese yields lag, it cannot beassumed that the entire gap can be bridged. Part of the gap could be attributable to differences in agro-ecological environments e.g. natural factors such as soil or climate, which cannot be overcome. The rest couldbe due to fertilisers, irrigation, crop management farming practices and so on – which could be bridged, at leastin theory. However, in practice, the narrowing of this gap will be limited by the extent to which it iseconomically feasible.
Over the past two decades, China has made strenuous efforts to increase yields. Specifically it has doubled theuse of fertilisers and increased irrigated areas by approximately one-third.
China irrigated area and fertiliser consumption
Source: NBSC
3.23.0
2.8 2.7 2.7 2.6
2.0
1.8
1.4
1.0
0.0
0.5
1.0
1.5
2.0
2.5
3.0
3.5
UnitedStates
Brazil Argentina Uruguay Canada Paraguay Ukraine China Russia India
ton
nes/h
ecta
re
2932 33
3638 40 41 41 41 43 43 44
46 48 4951 52 54 56 57 58
49 49 49 49 50 51 52 53 54 54 54 54 54 55 56 5758 59 60 62 63
0
10
20
30
40
50
60
70
-
10
20
30
40
50
60
70
1992 1993 1994 1995 1996 1997 1998 1999 2000 2001 2002 2003 2004 2005 2006 2007 2008 2009 2010 2011 2012
mil
lio
nto
nn
es
mil
lio
nh
ecta
res
Fertiliser consumption (RHS) Irrigated area
China’s agricultural challenges
Roads to be travelled PwC 17
While the rate of growth in fertilisers has slowed inthe past decade, irrigation has increased. However,the growth in yields that China can expect from thesetwo measures in the future is limited for reasons weoutline below.
While the use of fertilisers has increased yields, it hasalso contributed to land, water and air pollution. Mostof China’s chemical inputs are applied inefficiently.The World Bank estimated that, in 2012, Chinaapplied some 650kg of fertiliser per hectare of arableland – the highest by far among major agriculturalnations, even developed ones. For comparison, thecorresponding numbers were 163kg for India, 156kgfor the EU, 181kg for Brazil, 131kg for the US, 75kg forCanada, 45kg for Australia and 39kg for Argentina.So, even greater use of fertiliser is likely to have alesser effect on yields, and might even have a negativeindirect effect due to land and water pollution.
Zhuang Guotai, the Ministry of EnvironmentalProtection’s Director of Nature and EcologyConservation, stated in a press conference in April2013, that only about 35% of fertiliser used in a
typical Chinese farm contributed to crop growth. Therest evaporates, washes off into streams, or isconsumed by people or animals. So, it not onlycontains an economic cost but an environmental onetoo. The Chinese Academy of Agricultural Sciences(CAAS) predicted last year that all central and SouthEastern provinces bar Jiangxi and Shanxi were at highrisk of suffering groundwater nitrate pollution by2015.
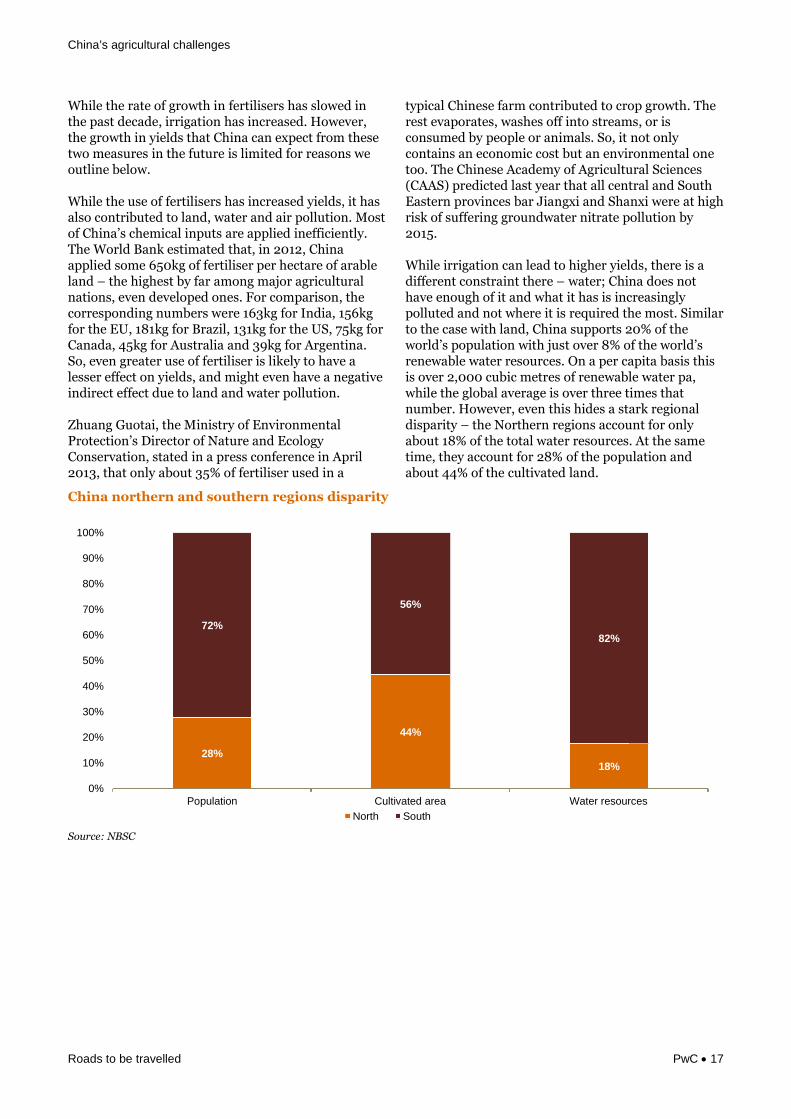
While irrigation can lead to higher yields, there is adifferent constraint there – water; China does nothave enough of it and what it has is increasinglypolluted and not where it is required the most. Similarto the case with land, China supports 20% of theworld’s population with just over 8% of the world’srenewable water resources. On a per capita basis thisis over 2,000 cubic metres of renewable water pa,while the global average is over three times thatnumber. However, even this hides a stark regionaldisparity – the Northern regions account for onlyabout 18% of the total water resources. At the sametime, they account for 28% of the population andabout 44% of the cultivated land.
China northern and southern regions disparity
Source: NBSC
28%
44%
18%
72%
56%
82%
0%
10%
20%
30%
40%
50%
60%
70%
80%
90%
100%
Population Cultivated area Water resources
North South

China’s agricultural challenges
Roads to be travelled PwC 18
The chart below shows the renewable water resources available per person across provinces. The range extendsfrom 143 cubic metres in Shanghai to 137,378 cubic metres in Tibet. Tibet is obviously an outlier, since it is thesource of many large rivers and has a low population. However, Shanghai is not. The chart below shows theprovinces with the lowest water resources, most of which are in the North. To put this into perspective, theglobal comparables for similar renewable water resource levels are Jordan and Israel.
Renewable water resources
Source: NBSC
Note: Northern regions are in yellow
The previous discussion focused on the supply of water while the following focuses on water usage. The keymetric here is the percentage of supply that is used annually. Consider Beijing: the average inhabitant usedabout 176 cubic metres in 2012, about 91% of the supply. The table below highlights usage per capita and usageas a percentage of supply for those few selected provinces where usage already exceeds availability or close to it.
Water usage in selected provinces
Source: NBSC
Note: Northern regions are in yellow
143
168
193
238
145
231
0.0
50.0
100.0
150.0
200.0
250.0
Shanghai Ningxia Beijing Tianjin Jordan Israel
cu
bic
metr
es/p
ers
on
167 176 204 230 254 269 491 698 1,078
70% 91% 69% 81% 90%83%
342%
148%
642%
0%
100%
200%
300%
400%
500%
600%
700%
0
200
400
600
800
1,000
1,200
Tianjin Beijing Shanxi Shandong Henan Hebei Shanghai Jiangsu Ningxia
cu
bic
metr
es
Water use per capita Usage / supply (RHS)
China’s agricultural challenges
Roads to be travelled PwC 19
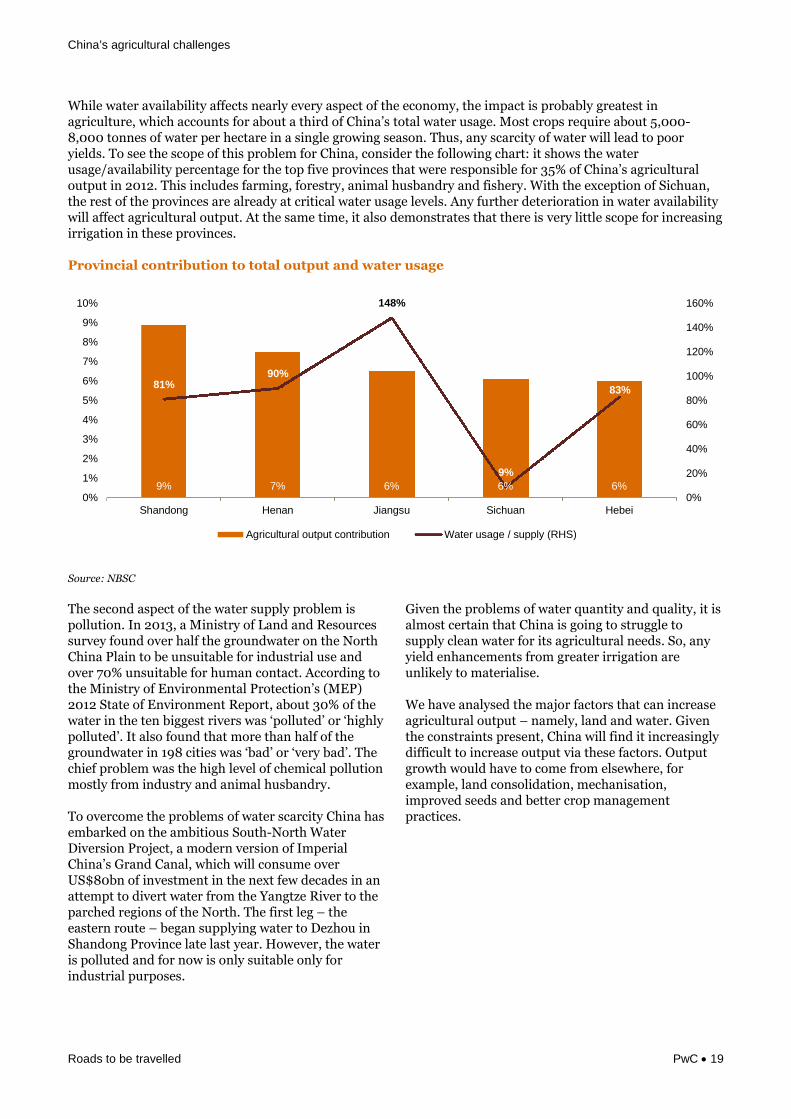
While water availability affects nearly every aspect of the economy, the impact is probably greatest inagriculture, which accounts for about a third of China’s total water usage. Most crops require about 5,000-8,000 tonnes of water per hectare in a single growing season. Thus, any scarcity of water will lead to pooryields. To see the scope of this problem for China, consider the following chart: it shows the waterusage/availability percentage for the top five provinces that were responsible for 35% of China’s agriculturaloutput in 2012. This includes farming, forestry, animal husbandry and fishery. With the exception of Sichuan,the rest of the provinces are already at critical water usage levels. Any further deterioration in water availabilitywill affect agricultural output. At the same time, it also demonstrates that there is very little scope for increasingirrigation in these provinces.
Provincial contribution to total output and water usage
Source: NBSC
The second aspect of the water supply problem ispollution. In 2013, a Ministry of Land and Resourcessurvey found over half the groundwater on the NorthChina Plain to be unsuitable for industrial use andover 70% unsuitable for human contact. According tothe Ministry of Environmental Protection’s (MEP)2012 State of Environment Report, about 30% of thewater in the ten biggest rivers was ‘polluted’ or ‘highlypolluted’. It also found that more than half of thegroundwater in 198 cities was ‘bad’ or ‘very bad’. Thechief problem was the high level of chemical pollutionmostly from industry and animal husbandry.
To overcome the problems of water scarcity China hasembarked on the ambitious South-North WaterDiversion Project, a modern version of ImperialChina’s Grand Canal, which will consume overUS$80bn of investment in the next few decades in anattempt to divert water from the Yangtze River to theparched regions of the North. The first leg – theeastern route – began supplying water to Dezhou inShandong Province late last year. However, the wateris polluted and for now is only suitable only forindustrial purposes.
Given the problems of water quantity and quality, it isalmost certain that China is going to struggle tosupply clean water for its agricultural needs. So, anyyield enhancements from greater irrigation areunlikely to materialise.
We have analysed the major factors that can increaseagricultural output – namely, land and water. Giventhe constraints present, China will find it increasinglydifficult to increase output via these factors. Outputgrowth would have to come from elsewhere, forexample, land consolidation, mechanisation,improved seeds and better crop managementpractices.
9% 7% 6% 6% 6%
81%90%
148%
9%
83%
0%
20%
40%
60%
80%
100%
120%
140%
160%
0%
1%
2%
3%
4%
5%
6%
7%
8%
9%
10%
Shandong Henan Jiangsu Sichuan Hebei
Agricultural output contribution Water usage / supply (RHS)

China’s agricultural challenges
Roads to be travelled PwC 20
The Chinese government has invested heavily ingenetically modified crops. However, there areconcerns among the Chinese over the safety of GMcrops safety – an understandable one given assortedfood safety scandals in recent years. To allay fears, thegovernment launched a media campaign inSeptember 2014 in support of GM crops. It hopes toeducate the public and create a favourableatmosphere for the development of the GM industry.In the same month, the government also releasedPresident Xi Jinping’s unpublished speech fromDecember 2013, wherein he endorsed GM crops.
Paradoxically, despite an active campaign to promoteGM crops, the Chinese government has rejectedimports of US corn since November 2013 due to thepresence of Syngenta’s MIR162 genetically modifiedcorn, marketed as Viptera. China has yet to approvethe MIR162 variety for imports although Syngentaapplied in 2010. The same strain can be imported intothe EU – despite its virulently anti-GMO stand.Therefore the actions of the Chinese governmentmight, at first glance, appear irrational. Howeverthere is logic to their policy response. Recall ourearlier table on Chinese corn statistics, whichhighlights how Chinese production has increased by
some 70% over the past decade. Much of this wasachieved by the government using higher prices toincentivise and promote domestic production. Seenfrom this perspective, the Chinese are most likelyusing the GM issue as a smoke screen to limitimports. Another possible explanation is that theChinese are attempting to diversify their corn importsource. After all, in 2013, nearly all of China’s cornimports originated in the US. Although imports willlikely continue to rise, equally likely, the governmentwill continue to limit them.
As a footnote, note that Syngenta is being sued byCargill and some US-based farmers for marketing itsViptera seed before it obtained import approval fromChina. This demonstrates the impact that Chinesepolicies now have overseas. Although the countrycurrently imports a mere 3mnt of corn, you only needto look a few years hence when this near roundingerror becomes material.
Obviously all of the above demonstrates that theChinese government recognises that the agriculturesector needs to be transformed. The following sectionlooks at how the state supports agriculture.
China’s agricultural challenges
Roads to be travelled PwC 21
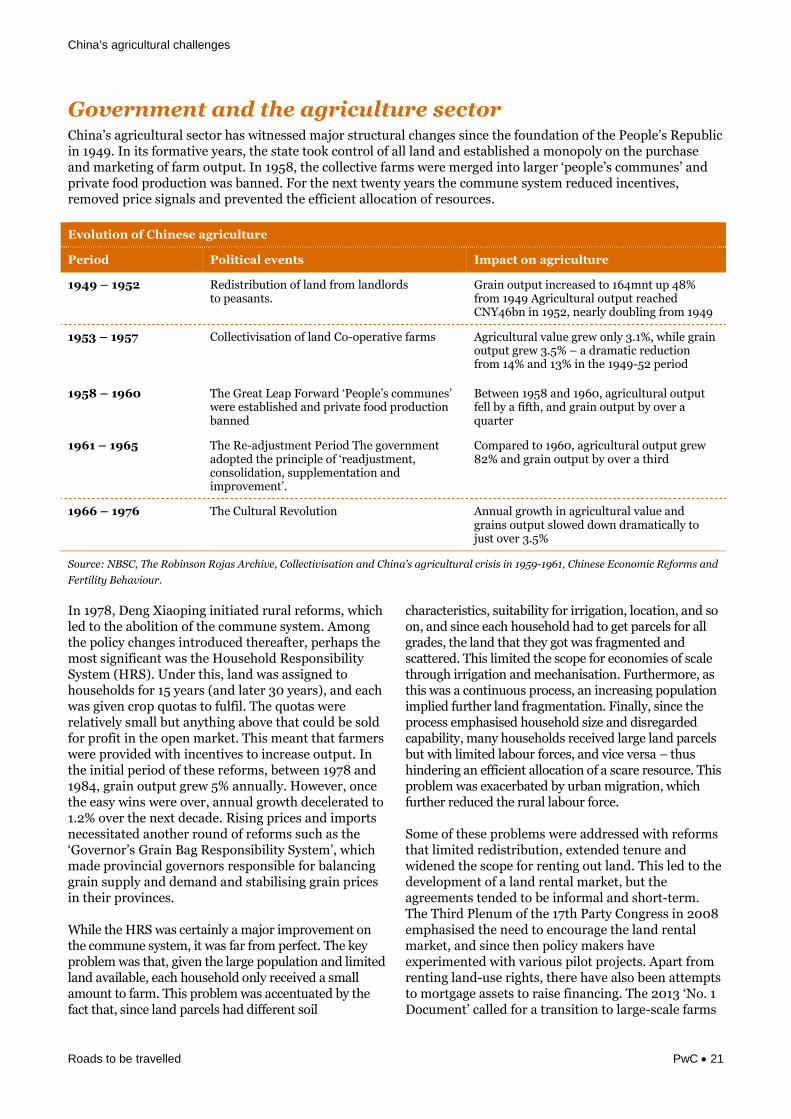
Government and the agriculture sectorChina’s agricultural sector has witnessed major structural changes since the foundation of the People’s Republicin 1949. In its formative years, the state took control of all land and established a monopoly on the purchaseand marketing of farm output. In 1958, the collective farms were merged into larger ‘people’s communes’ andprivate food production was banned. For the next twenty years the commune system reduced incentives,removed price signals and prevented the efficient allocation of resources.
Evolution of Chinese agriculture
Period Political events Impact on agriculture
1949 – 1952 Redistribution of land from landlordsto peasants.
Grain output increased to 164mnt up 48%from 1949 Agricultural output reachedCNY46bn in 1952, nearly doubling from 1949
1953 – 1957 Collectivisation of land Co-operative farms Agricultural value grew only 3.1%, while grainoutput grew 3.5% – a dramatic reductionfrom 14% and 13% in the 1949-52 period
1958 – 1960 The Great Leap Forward ‘People’s communes’were established and private food productionbanned
Between 1958 and 1960, agricultural outputfell by a fifth, and grain output by over aquarter
1961 – 1965 The Re-adjustment Period The governmentadopted the principle of ‘readjustment,consolidation, supplementation andimprovement’.
Compared to 1960, agricultural output grew82% and grain output by over a third
1966 – 1976 The Cultural Revolution Annual growth in agricultural value andgrains output slowed down dramatically tojust over 3.5%
Source: NBSC, The Robinson Rojas Archive, Collectivisation and China’s agricultural crisis in 1959-1961, Chinese Economic Reforms and
Fertility Behaviour.
In 1978, Deng Xiaoping initiated rural reforms, whichled to the abolition of the commune system. Amongthe policy changes introduced thereafter, perhaps themost significant was the Household ResponsibilitySystem (HRS). Under this, land was assigned tohouseholds for 15 years (and later 30 years), and eachwas given crop quotas to fulfil. The quotas wererelatively small but anything above that could be soldfor profit in the open market. This meant that farmerswere provided with incentives to increase output. Inthe initial period of these reforms, between 1978 and1984, grain output grew 5% annually. However, oncethe easy wins were over, annual growth decelerated to1.2% over the next decade. Rising prices and importsnecessitated another round of reforms such as the‘Governor’s Grain Bag Responsibility System’, whichmade provincial governors responsible for balancinggrain supply and demand and stabilising grain pricesin their provinces.
While the HRS was certainly a major improvement onthe commune system, it was far from perfect. The keyproblem was that, given the large population and limitedland available, each household only received a smallamount to farm. This problem was accentuated by thefact that, since land parcels had different soil
characteristics, suitability for irrigation, location, and soon, and since each household had to get parcels for allgrades, the land that they got was fragmented andscattered. This limited the scope for economies of scalethrough irrigation and mechanisation. Furthermore, asthis was a continuous process, an increasing populationimplied further land fragmentation. Finally, since theprocess emphasised household size and disregardedcapability, many households received large land parcelsbut with limited labour forces, and vice versa – thushindering an efficient allocation of a scare resource. Thisproblem was exacerbated by urban migration, whichfurther reduced the rural labour force.
Some of these problems were addressed with reformsthat limited redistribution, extended tenure andwidened the scope for renting out land. This led to thedevelopment of a land rental market, but theagreements tended to be informal and short-term.The Third Plenum of the 17th Party Congress in 2008emphasised the need to encourage the land rentalmarket, and since then policy makers haveexperimented with various pilot projects. Apart fromrenting land-use rights, there have also been attemptsto mortgage assets to raise financing. The 2013 ‘No. 1Document’ called for a transition to large-scale farms
China’s agricultural challenges
Roads to be travelled PwC 22
in China and encouraged farmers to rent out theirland to large farming entities, co-operatives andagricultural enterprises. There is even a ‘large farm’subsidy being tested in a few provinces, given tofarmers planting more than a certain province-specific area of grain. All of this has had an effect –the Ministry of Agriculture estimated that in 2013,around 26% of China’s farmland had been rented, upfrom approximately 9% in 2008.
More reforms are on the way. The Third Plenum ofthe 18th CPC Central Committee, concluded last year,aimed to provide famers with greater property rights,increase farmers’ property income and allow ruralresidents to benefit from modernisation. Specifically:(i) endow farmers with mortgage and guaranteepower for contractual management rights, (ii)propose to push forward ‘cautiously and steadily’collateral, guarantee and transfer of farmers’residential property rights, (iii) endow farmers withrights for possession, income, pledge, guarantee,inheritance and paid withdrawal of shares incollective assets, and (iv) propose to support thedevelopment of large-scale, professionalised andmodernised operations. A concrete example is that itallows collectively-owned ‘rural construction land forcommercial use’ to be transferrable and rentable andaims to build a unified market for both urban andrural construction land. Other major reforms includethe reduction in scope of land expropriation by localgovernments.
For sure, this is a statement of intent at this stage andthe extent of implementation remains to be seen.Most reforms to date are at the pilot-test stage andnot close to rollout and execution at national level.Moreover, some of these initiatives might be difficultto implement because local governments, whoserevenues will be reduced, might oppose them.According to World Bank data, on average, localgovernments receive 40% of the tax revenues from thecentral government, but are responsible for 80% oftotal government spending. These deficits are usuallycovered through the sale of collectively owned landseized from farmers. Rural land reform will curtailthese activities and put more strain on localgovernments’ fiscal positions. In short, progress inland reform is an arduous, slow process.
Land reform was important and led to higher outputbut it did not increase rural incomes in sharp contrastto what happened with urban incomes. Crucially italso led to widespread income inequality across thecountry. Thus, a decade back, Chinese policymakersbegan seeking ways to extend direct benefits tofarmers. In 2004, China introduced the first nationaldirect subsidies to farmers and began phasing outagricultural taxes. The direct subsidy was based onthe land area. However, the unintended consequenceof this action was that landowners could leave theland fallow and still get subsidies, while farmers whocultivated leased land would not. Since 2013, thegovernment has moved towards linking directsubsidies to land planted or grain harvested.
In September 2014, the government released detailsabout the pilot ‘target price’ subsidy programme forcotton and soybeans. This policy represents a newapproach to agricultural support that will reducegovernment interference in prices and let the marketshave a greater role. The subsidy under thisprogramme is calculated as the difference between a‘target price’ set by the government before plantingand the market price in each province.
In addition to recognising the need to increaseproductivity, the government also introducedsubsidies for seeds, fertilisers and agriculturalmachinery. Subsidies are available for high-qualityseeds, such as high-oil soybean, industrial-use cornand high-protein wheat varieties. These are usuallypaid directly to farmers but, in some areas, they arepaid to seed suppliers, who are then supposed to passit on to farmers. Fertiliser subsidies also work in asimilar way. Machinery subsidies are paid tomachinery dealers, who are expected to pass it on. Inthe Twelfth Five-Year Plan, the government aimed toincrease total agricultural machinery power to 1bnKW and the agricultural mechanisation rate to 60%by 2015. However, the power target was achieved by2012, and the mechanisation rate reached 59%in 2013.
Other government support measures include aminimum price scheme for rice and wheat, VATrefunds or waivers and transport tax waivers. Thegovernment has also sought to increase investmentthrough the extension of finance via the Rural CreditCo-operatives that provide loans to farmers for inputpurchases, machinery and other investments.

China’s agricultural challenges
Roads to be travelled PwC 23
All these government measures to increaseproduction aim to get around the problem of limitedland and water resources. Will these be sufficient toprevent imports? In our view, no. While these policieswill most likely boost yields, it will not be anywherenear sufficient to meet the strong growth in demandin the years ahead.
Thus China has begun to turn its attention overseas; ifthere are constraints on land and water at home, whynot buy land in Ukraine or Zambia and grow wheatand corn for export to China? For sure, this does notreplicate ‘self-sufficiency’ as China would still bevulnerable to external shocks such as export bans andland expropriation. However, it does possess merit.Firstly, it provides an avenue for China to diversify itscurrent account surpluses away from financial assetssuch as US treasuries into real assets such asfarmland. Secondly, it fits in with the wider theme offood production shifting to low-cost producers such asAfrica. Finally, it will also help to promote free tradethrough interdependency.
In its 10th five-year plan in 2001, China initiated its‘Go Out’ policy aimed at encouraging Chineseinvestment abroad. Although China has been involvedin African agriculture since the 1960s, it was mostly ina technical capacity, with some trade relations andlimited farming investments. But since the ‘Go Out’policy, its involvement has shifted to include large-scale farming, processing, equipment export andagricultural infrastructure development. In 2009,Chinese investment in African agriculture wasestimated at US$30bn. In the 2014 ‘No.1 Document’,the government called for the ‘Go Out’ policy to beaccelerated and in an August 2014 press release, theMinistry of Commerce announced that over 300farming enterprises had invested across 46 countries.
However, most of these farming deals are at smallscale and mostly less than 10,000ha. There have beenmedia reports of large transactions but actual hardevidence is hard to come by. For example, mediareports since 2007 have recorded ZTE Agribusiness’sconcession to cultivate palm on an area ranging from100,000ha to the somewhat larger 3m ha of land.Another Chinese grand plan was to cultivate jatrophafor bio-fuels on over 2mn ha in Zambia. Again, noprogress was registered on either project. Hyperboleis not restricted to land alone – another commonrefrain in recent years was that China would send 1mnfarmers to settle in Africa.
A similar scenario played out in Ukraine. There werereports last year of China, via state-owned companies,leasing 100,000ha of land in Ukraine for farming andthat the area could potentially expand over 50 years to3mn ha – or about 10% of Ukraine’s arable land.Ukrainian agricultural firm KSG Agro, which wassupposed to be the counterparty, denied those reportssaying that the agreement was with regard to thetransfer of irrigation technology for a mere 3,000ha.
Finally, there is Latin America. While China importslarge quantities of soybeans from Brazil andArgentina, its direct involvement remains limited.There have been no acquisitions of farmland and it isalso unlikely change in the near term, given therestrictions imposed on foreign land ownership inBrazil and Argentina – itself is a response to growingChinese interest.
The same is true elsewhere; whether Australia, NewZealand, the Philippines and so on. The conclusion wewould draw is that China may pursue this strategy butit is likely to remain small scale in the medium term.Deals involving millions of hectares, or even hundredsof hectares invariably generate hostility and localresentment. More importantly, large-scale projectsremain difficult to execute successfully – there arenumerous examples in Africa, where companies havehardly progressed beyond acquiring a large parcelof land.
That doesn’t negate an alternative strategy: thepossibility of China acquiring strategic assets alongdifferent points of the value chain. That is, instead ofacquiring land, buy elevators and processing facilities,or provide financing and logistics services. These werethe intentions behind State-owned Chongqing GrainGroup’s plans in 2011 to build a soybean-crushingplant, railway line and a storage and transportationhub to export goods back to China – with aninvestment of over US$2bn. However, as with otherlarge Chinese agricultural projects, this too has yet tomaterialise. But the wider strategic argumentremains valid.
China’s agricultural challenges
Roads to be travelled PwC 24
In February 2014, China’s largest grain trader, state-owned COFCO, acquired a 51% stake in Dutch grain traderNidera, which has a strong procurement platform in Brazil, Argentina and Central Europe. In April 2014,COFCO acquired a 51% stake in Singapore-based Noble Group Ltd’s agribusiness unit for US$1.5bn. COFCOaims to form a joint venture to link its grain processing and distribution business in China with Noble’s grainsourcing and trading business. Noble’s agribusiness unit includes sugar mills in Brazil, grain elevators inArgentina, and oilseed crushing plants in China, Ukraine, South Africa, and South America. Co-incidentally,China Investment Corporation – China’s sovereign wealth fund – already owns a 14.1% in the Noble Group.With these acquisitions, COFCO will be able to purchase soybeans from Brazil and other producers directly,bypassing the ‘ABCD’ quartet of grain traders: ADM, Bunge, Cargill and Louis Dreyfus.
Other similar deals include the previously mentioned WH Group’s purchase of US-based Smithfield Foods,China Fishery Group’s purchase of Peruvian fish exporter Copeinca ASA, and COFCO’s purchase of Australiansugar producer Tully Sugar. China’s US$3bn loan-for-grains deal with Ukraine was another although Chinarecently sued Ukraine for the breach of this contract and which will be complicated still further by ongoing civilunrest in the country.
China’s agricultural challenges
Roads to be travelled PwC 25
Global Agribusiness NetworkPwC has been supporting the global agricultural sector at a corporate, NGO and government level for manyyears. During this time, we have built up a detailed and practical understanding of how agricultural systemsaround the world work. Resources around the world include Agribusiness service centres in Brazil andArgentina; Agribusiness practices in India and the MENA region and Agribusiness heads in every major region.
We have helped at least four different governments formulate comprehensive food security strategies. We alsohave a dedicated, global food safety advisory team. In China, for instance, Assure Quality and PwC New Zealandsigned a collaboration framework agreement with China Mengniu Dairy Company and COFCO Corporation toinvestigate the development of a China- New Zealand agribusiness service and Food Safety Centre of Excellencein China. Do feel free to contact us for further details.
China Business GroupPwC UK’s China Business Group is a dedicated team of bilingual specialists who can provide in-depthknowledge of the markets, culture, legal systems, tax, accounting, auditing and regulatory framework in boththe UK and China.
Together with our rich industry knowledge and working with our colleagues in PwC’s global network asnecessary, we provide hands-on, practical assistance to Chinese companies looking to expand in to the UK oreurozone and Africa, as well as UK companies wishing to develop their operation in China.
We provide thoughtful, bespoke services which support our clients’ development strategies, wherever in theworld those ambitions may take them.
PwC ContactsIf you would like to discuss any of the issues raised in this report, please contact:
Richard FergusonAgriculture Advisor to PwC
M: +44 (0) 7880 827282E: [email protected]
Suwei JiangPwC Partner, China BusinessGroup
T: +44 (0) 20 7804 9248M: +44 (0) 7932 007128E: [email protected]
Mark JamesGlobal Agribusiness Coordinator
M: +44(0)78038 58721E: [email protected]
Ross JacksonPwC Senior Manager, RiskAssurance
T: +44 (0) 20 7804 1874M: +44 (0) 7725 633465E: [email protected]
About PwC

This publication has been prepared for general guidance on matters of interest only, and does not constitute professionaladvice. You should not act upon the information contained in this publication without obtaining specific professional advice.No representation or warranty (express or implied) is given as to the accuracy or completeness of the information containedin this publication, and, to the extent permitted by law, PricewaterhouseCoopers LLP, its members, employees and agentsdo not accept or assume any liability, responsibility or duty of care for any consequences of you or anyone else acting, orrefraining to act, in reliance on the information contained in this publication or for any decision based on it.
© 2015 PricewaterhouseCoopers LLP. All rights reserved. In this document, ‘PwC’ refers to the UK member firm, and maysometimes refer to the PwC network. Each member firm is a separate legal entity. Please see www.pwc.com/structure forfurther details.
150925-163846-YF-OS


