55
China’s Agricultural Water Scarcity: Implications for Future Agricultural Production and Trade Bryan Lohmar Economist, Economic Research Service, USDA
| Date post: | 25-Dec-2015 |
| Category: |
Documents |
| Upload: | clarence-owen |
| View: | 218 times |
| Download: | 2 times |

China’s Agricultural Water Scarcity: Implications for Future Agricultural
Production and Trade
Bryan LohmarEconomist,
Economic Research Service, USDA

Water Problems in China
• Signs of depleted water resources– Centered in northern China– Dry surface systems– Falling water tables– Acute pollution
• Increasing water demand
– Non-agricultural– Agricultural
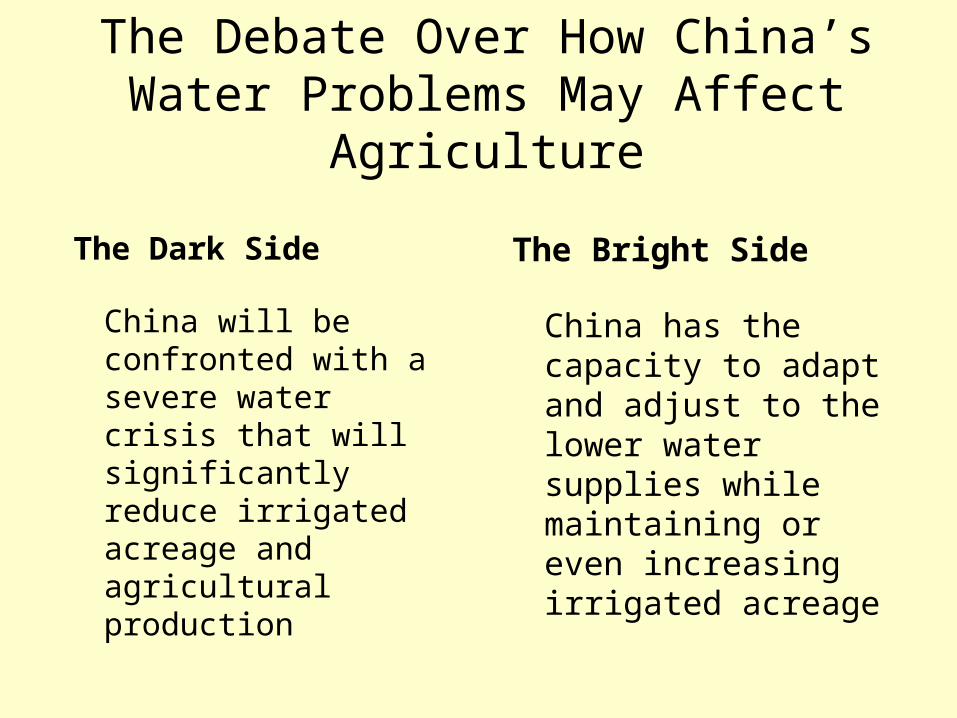
The Debate Over How China’s Water Problems May Affect Agriculture
The Bright Side
China has the capacity to adapt and adjust to the lower water supplies while maintaining or even increasing irrigated acreage
The Dark Side
China will be confronted with a severe water crisis that will significantly reduce irrigated acreage and agricultural production

Future Agricultural Production will Depend on New Policies and
Institutions
• Past focus of policies and institutions was to exploit water as a cheap resource to boost agricultural and industrial production
• Current changes emphasize more rational water allocation and water conservation
Today’s Presentation• Introduce water shortage problems in China
• Provide an overview of our findings:– Irrigation district management– Water-saving irrigation technology – Water pricing policies
• Present modeling results and discuss implications for agricultural production and trade

Water Scarcity is Centeredin Northern China
Hai RiverBasin
Huang (Yellow)River Basin
Huai RiverBasin
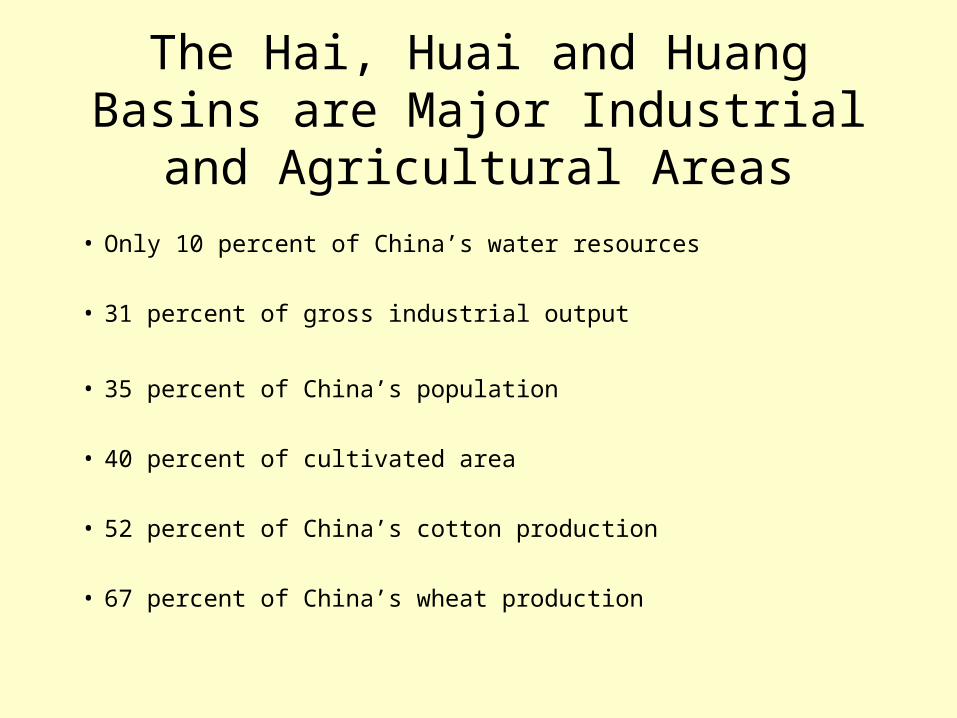
The Hai, Huai and Huang Basins are Major Industrial and Agricultural Areas
• Only 10 percent of China’s water resources
• 31 percent of gross industrial output
• 35 percent of China’s population
• 40 percent of cultivated area
• 52 percent of China’s cotton production
• 67 percent of China’s wheat production
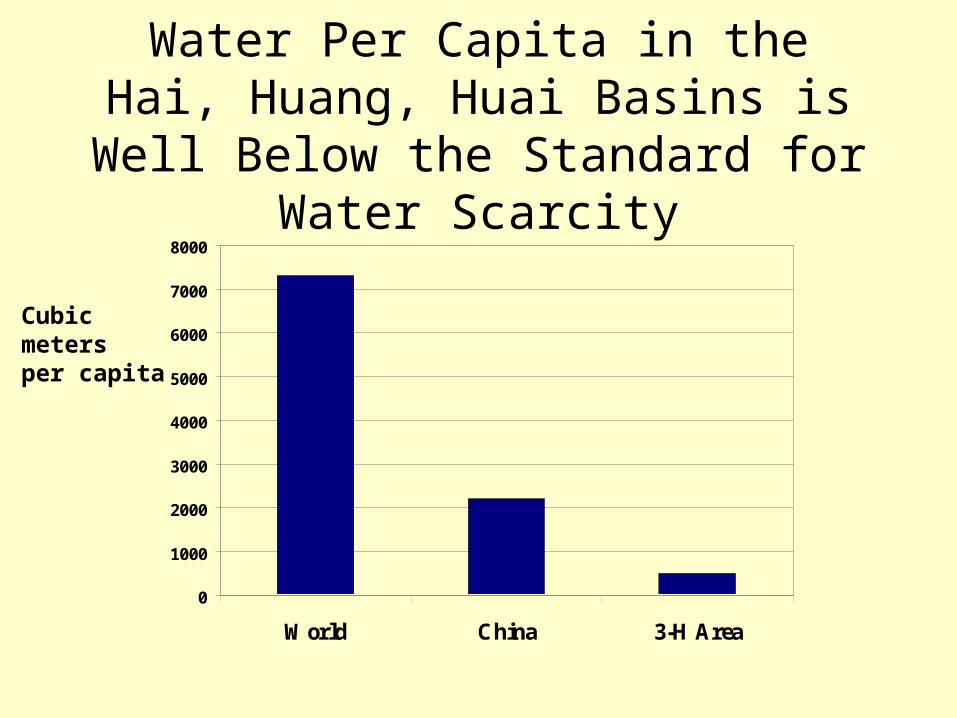
Water Per Capita in the Hai, Huang, Huai Basins is Well Below the Standard
for Water Scarcity
Cubicmetersper capita
0
1000
2000
3000
4000
5000
6000
7000
8000
World China 3-H Area

Water Per Capita in the Hai, Huang, Huai Basins is Well Below the Standard
for Water Scarcity
Cubicmetersper capita
0
1000
2000
3000
4000
5000
6000
7000
8000
World China 3-H Area
WaterScarce

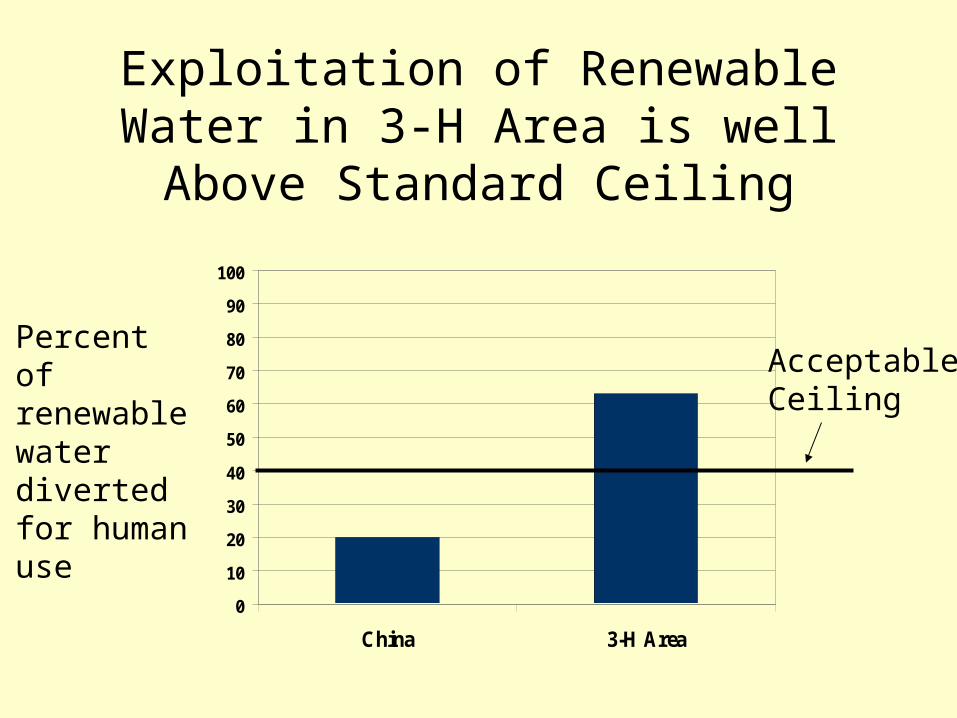
Exploitation of Renewable Water in 3-H Area is well Above Standard Ceiling
Percentof renewable water divertedfor humanuse
0
10
20
30
40
50
60
70
80
90
100
China 3-H Area
Exploitation of Renewable Water in 3-H Area is well Above Standard Ceiling
Percentof renewable water divertedfor humanuse
0
10
20
30
40
50
60
70
80
90
100
China 3-H Area
AcceptableCeiling

River Basin Management Reform
• When water becomes more scarce, the costs of allocating water to low use values increases– with possible policy driven exceptions
• Devising policies and institutions so that parties are compensated for transferring water to higher value uses is important

Collaboration with ABARE on Allocation Issues
• Yellow River Model– Substantial gains from allocating water to
downstream users (roughly US$1 billion/year)– These allocations will increase crop production
but not change the structure of production
• Current research into the gains from reallocation within and between villages

Surface Irrigation Water Management in China
• Ministry of Water Resources– Develop and manage a system of withdrawal
quotas and management practices, largely through a system of Irrigation Districts (IDs)
• Price Bureau– Set price guidelines for water deliveries
• Local Governments– Administer local activity, collect and deliver fees

Problems with Surface Water Management
• Cost recovery and infrastructure investment– Prices too low to cover operating costs – Income insufficient to maintain infrastructure
• Lack of incentive to reduce water use– IDs receive too little money for improved water
deliveries to make it worthwhile to monitor

ID Management Reforms
• Water User Associations (WUAs)– Ostensibly farmer organized groups to elect
managers and make joint irrigation policy decisions
• Canal Contracting– Contracting the management of lateral canals
out to individuals who make investments, provide delivery services and collect fees

Increased Adoption of Irrigation District Management Reform in
Yellow River Basin
0%
20%
40%
60%
80%
100%
1990 1995 2001
Col lective WUA Contracting
Percent of Villages Adopting New Reforms
Data from Fieldwork in Ningxia and Henan Provinceso

Do Reforms Matter?
0%
20%
40%
60%
80%
100%
WUA Contracting
Percent of WUAs and Canal Contracting arrangementswhere managers have direct incentives
to reduce water deliveries
WithIncentives
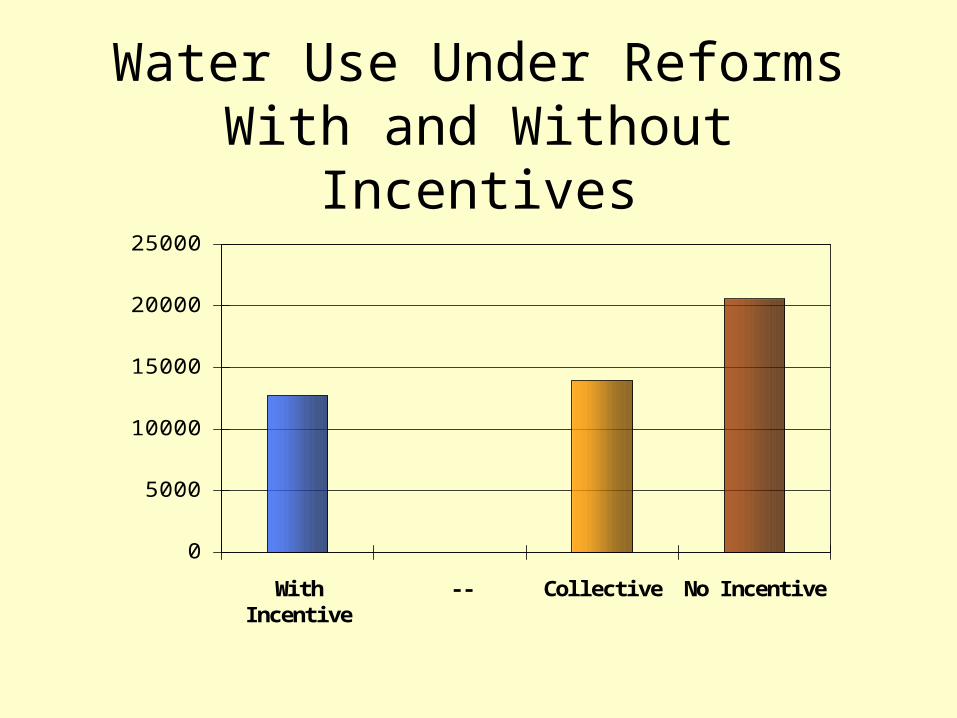
Water Use Under Reforms With and Without Incentives
0
5000
10000
15000
20000
25000
WithIncentive
-- Collective No Incentive
Summary of Findings on Irrigation District Management Reform
• When effective, ID management reform can– Reduce water applications significantly– Have little negative effect on crop production or
rural incomes
• Unclear how the reforms affect– Cost recovery– Longer term investments– Efficient distribution of water deliveries

Pricing and Delivery Practices Present Major Obstacles to
Promoting Water Conservation
• Prices are too low– 20-30 percent of VMP for ground water, less
for surface water
• Prices are not always volumetric– Costly with so many small plots of land to
irrigate
• Farmers do not control deliveries– Do not decide when or how much

Elasticity Estimates Are Off• Prices are below marginal product of water
and water allocations are constrained
Qwater
Pwater
Qobserved
D = VMPPobserved
VMP
QuantityConstraint
Observed priceand quantity

14%7%3%1%
0
200
400
600
800
1,000
1,200
Currentcost
10%increase
25%increase
50%increase
100%increase
Econometric Estimates of the Relationship Between Water Price
and Water Use in Agriculture
Not muchcapacity toreduce wateruse withpricing policies
Irrigationwater use (m3/ha)

Using Maximum Entropy Estimation and Setting P=VMP Yields
Different Results
79%
58%
36%18%
0
200
400
600
800
1,000
1,200
Currentcost
VMP 10%increase
25%increase
50%increase
100%increase
Irrigationwater use (m3/ha)
Price increasesinduce significantreductions inwater use
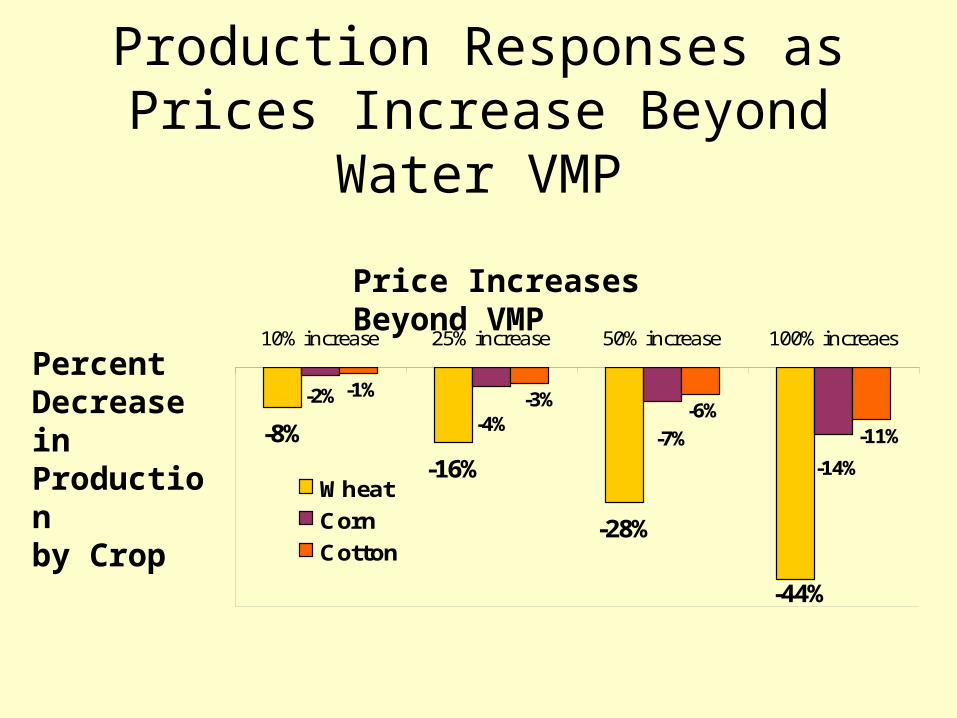
Production Responses as Prices Increase Beyond Water VMP
-8%-16%
-28%
-2%
-44%
-4%-7%
-14%
-1%
-11%-6%-3%
10% increase 25% increase 50% increase 100% increaes
Wheat CornCotton
Price Increases Beyond VMP
PercentDecrease in Production by Crop

Caveats to Price Policies• Nearly all surface water is not priced
volumetrically
• Price must rise significantly to induce conservation
• Raising prices runs counter to other important policy goals:– Raising rural incomes– Grain self-sufficiency
Water-saving Irrigation Technologies
• Both the Ministry of Water Resources and the Ministry of Agriculture have been actively promoting water-saving irrigation technologies
• Incentives to adopt such technologies are not strong, but often they are profitable despite water savings
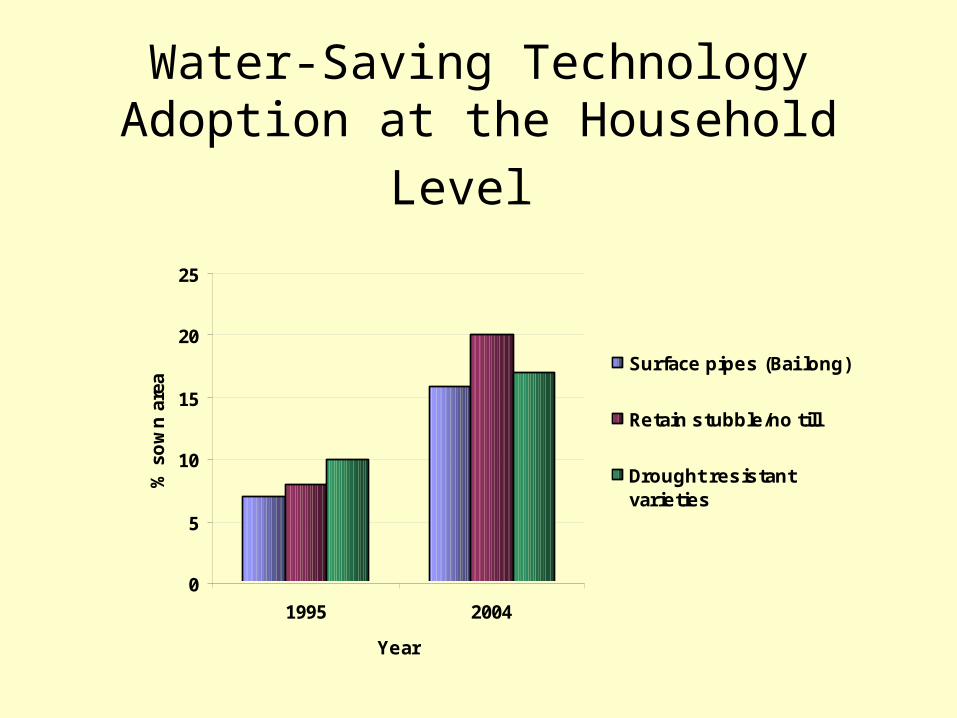
Water-Saving Technology Adoption at
the Household Level
0
5
10
15
20
25
1995 2004
Year
% s
ow
n a
rea
Surface pipes (Bai long)
Retain stubble/no till
Drought resistantvarieties
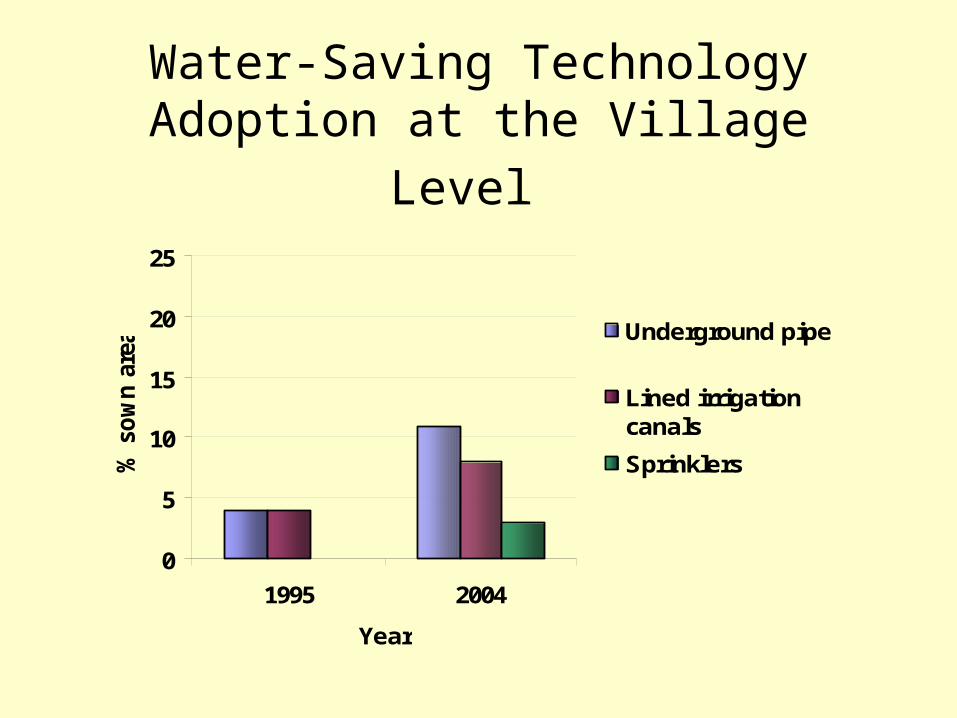
Water-Saving Technology Adoption at
the Village Level
0
5
10
15
20
25
1995 2004
Year
% s
ow
n a
rea Underground pipe
Lined irrigationcanals
Sprinklers

Determinants of Technology Adoption
• Econometric results indicate– Relationship to water price
– Correlation with groundwater
– Some technologies correlated with extension activity• Plastic sheeting• Drought resistant varieties

Water-saving Irrigation Technology Adoption: Summary
• Adoption is occurring but is slow– Substantial capacity to increase adoption rates
• Households adopting more than villages– Perhaps due to costs of collective action
• Future work will look more closely into the determinants of adoption and the effects of these technologies on water use and crop choice
Water Quality
• Interactions within agriculture:– Nitrogen fertilizers– Pesticides– Salinity– Soil erosion
• Industrial-agriculture interactions– In one survey, respondents reported that 95
percent of groundwater pollution was from industry
What Does All This Mean for Future Production and Trade?
• How can one predict China’s future?
• Observe current trends in overall economy, and understand their effects– Urbanization and growing incomes– Farm commercialization and market integration– Resource constraints
Water Scarcity and Agricultural Production: Forecasts
• What are plausible scenarios of water scarcity affecting future agricultural production in North China?
• How might other players respond to production declines in North China?– Producers in other areas– Consumers– International Markets

Scenario Results Using the ERS China Model
• Isolate problem to North China
• Separate yields and sown area for wheat, corn and cotton into two categories:– Irrigated yields and sown area– Non-irrigated yields and sown area
• Estimate scenarios of falling irrigated area using the ERS China Model and compare the scenario estimates to 2007 USDA long-term projections.

ERS China Model• Partial equilibrium dynamic simulation model
of 28 commodities used for USDA long-term (formerly USDA Baseline) projections– Segmented into 6 regions
• Explicitly models China’s Tariff-Rate Quota (TRQ) regime by filling increasingly inelastic import demand functions sequentially– Non-state share of the TRQ– State-share of the TRQ– Outside the TRQ
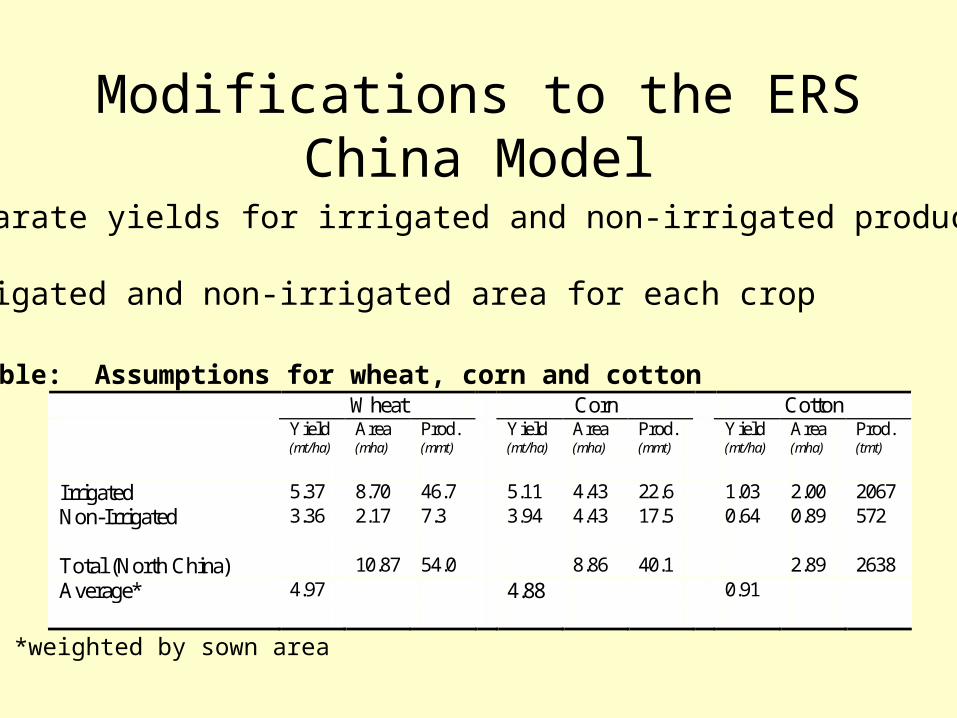
Modifications to the ERS China Model
Wheat Corn Cotton Yield
(mt/ha) Area (mha)
Prod. (mmt)
Yield (mt/ha)
Area (mha)
Prod. (mmt)
Yield (mt/ha)
Area (mha)
Prod. (tmt)
Irrigated 5.37 8.70 46.7 5.11 4.43 22.6 1.03 2.00 2067 Non-Irrigated 3.36 2.17 7.3 3.94 4.43 17.5 0.64 0.89 572 Total (North China) 10.87 54.0 8.86 40.1 2.89 2638 Average* 4.97 4.88 0.91
1) Separate yields for irrigated and non-irrigated production
2) Irrigated and non-irrigated area for each crop
Table: Assumptions for wheat, corn and cotton
*weighted by sown area
Scenarios Using Modified Model
• Scenarios of total irrigated area in northern China falling by– 10 percent decline– 20 percent decline– 30 percent decline– 40 percent decline
• Intended to shock the model similar to how falling water availability for agriculture will affect agricultural production in northern China

Scenario Results: Wheat
-25
-20
-15
-10
-5
0
5
10
15
10% decline 20% decline 30% decline 40% decline
production responsein northern China
production responsein other China
consumptionresponse
netimports
millionmetric
tons

Scenario Results: Corn
-15
-10
-5
0
5
10
10% decline 20% decline 30% decline 40% decline
production responsein northern China
production responsein other China
netimports
consumptionresponse
millionmetric
tons

Scenario Results: Cotton
-1500
-1000
-500
0
500
1000
10% decline 20% decline 30% decline 40% decline
production responsein northern China
production responsein other China
consumptionresponse
netimports
thousandmetric
tons

Modeling Results: Summary• Results suggest that China’s large agricultural
economy has substantial capacity to absorb shocks to agriculture through domestic adjustments– Increasing production in other areas– Reducing consumption
• The extent of these adjustments depends on trade policy
• These adjustments also come at a cost:– Higher production costs– Higher food prices

What are the Implications for Economic Surpluses?
• Model the changes in production as a supply shift
• Calculate changes in:– Consumer surplus– Producer surplus– Total surplus
Given the supply and demand for each crop
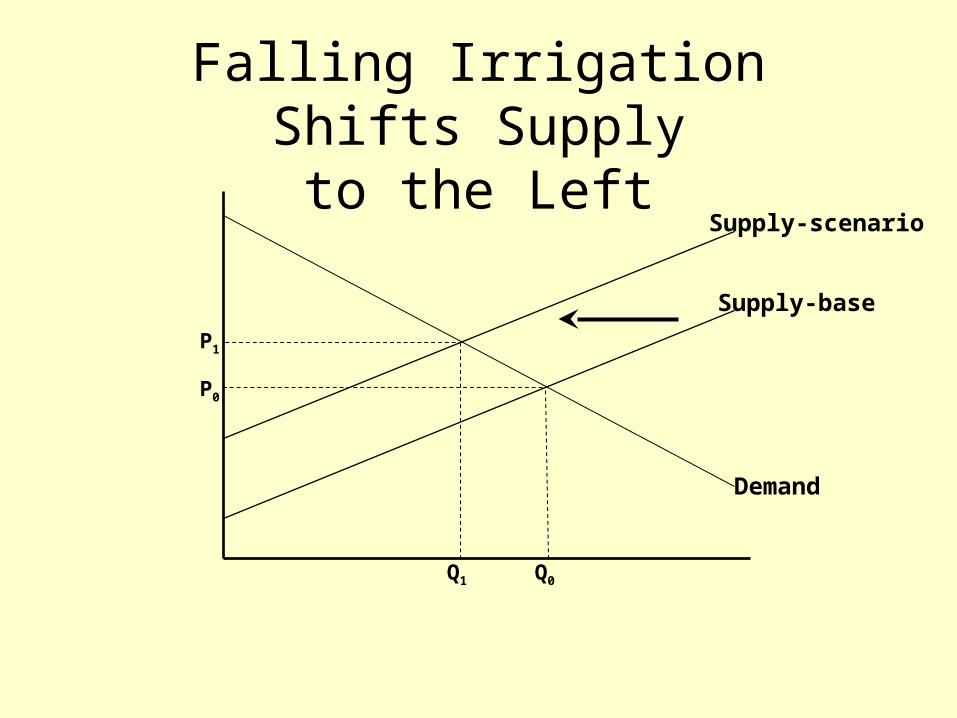
Falling Irrigation Shifts Supplyto the Left
Demand
Supply-base
Supply-scenario
P0
P1
Q1 Q0
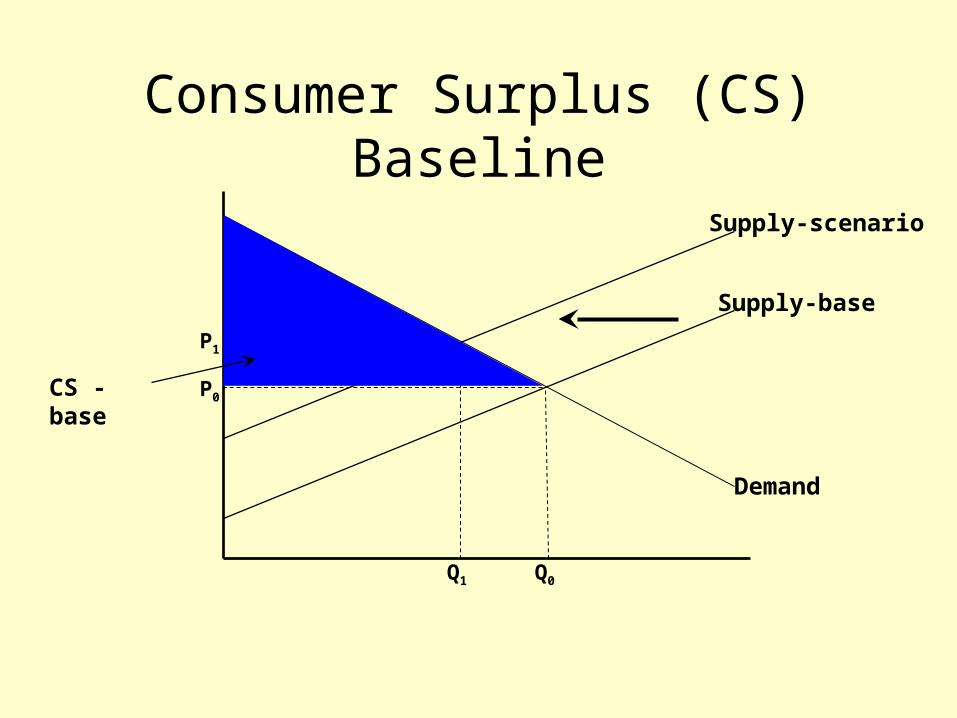
Consumer Surplus (CS)Baseline
Demand
Supply-base
Supply-scenario
P0
P1
Q1 Q0
CS - base

Consumer Surplus (CS)Scenario
Demand
Supply-base
Supply-scenario
P0
P1
Q1 Q0
CS - scenario

Producer Surplus (PS)Baseline
Demand
Supply-base
Supply-scenario
P0
P1
Q1 Q0
PS - base

Producer Surplus (PS)Scenario
Demand
Supply-base
Supply-scenario
P0
P1
Q1 Q0
PS - scenario
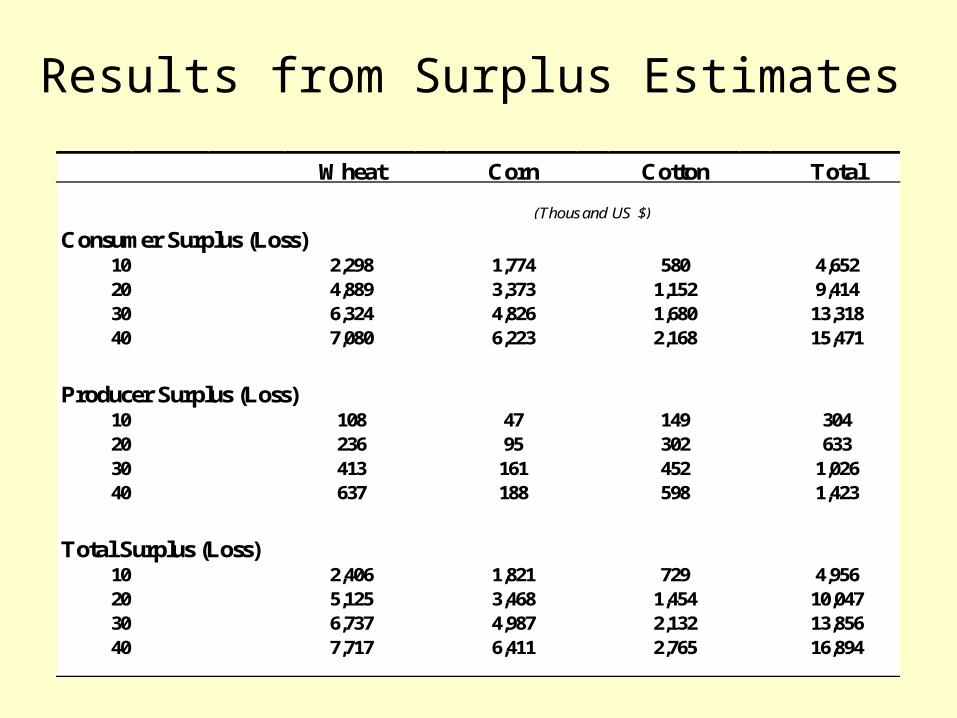
Wheat Corn Cotton Total
Consumer Surplus (Loss)10 2,298 1,774 580 4,65220 4,889 3,373 1,152 9,41430 6,324 4,826 1,680 13,31840 7,080 6,223 2,168 15,471
Producer Surplus (Loss)10 108 47 149 30420 236 95 302 63330 413 161 452 1,02640 637 188 598 1,423
Total Surplus (Loss) 10 2,406 1,821 729 4,95620 5,125 3,468 1,454 10,04730 6,737 4,987 2,132 13,85640 7,717 6,411 2,765 16,894
(Thousand US $)
Results from Surplus Estimates
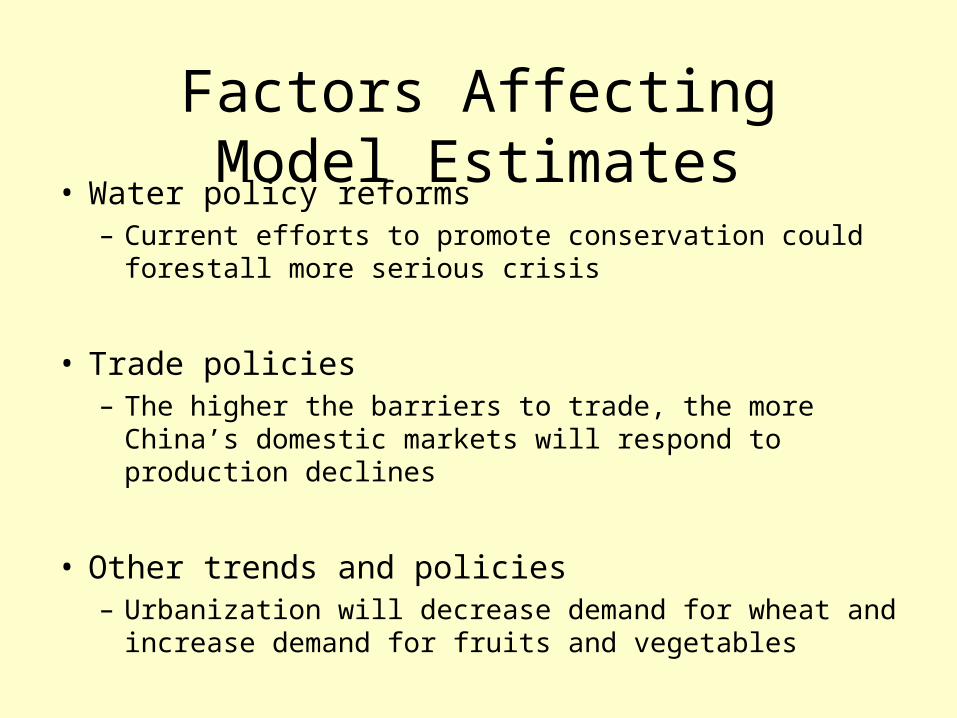
Factors Affecting Model Estimates
• Water policy reforms– Current efforts to promote conservation could forestall
more serious crisis
• Trade policies– The higher the barriers to trade, the more China’s domestic
markets will respond to production declines
• Other trends and policies– Urbanization will decrease demand for wheat and increase
demand for fruits and vegetables
Will water scarcity will shape China’s future agricultural
production and trade?• Yes!
– Already seeing changes in part of North China Plain
– Competition for limited water resources, will induce policymakers and farmers to make difficult choices that weigh agriculture against other interests

Trade Implications: Take Home Point 1
• Trade policy matters– If domestic prices rise and production
falls in north China, then consumers and producers in other areas will respond
– If China can successfully develop export markets for fruits, nuts and vegetables, then they may loosen grain self-sufficiency goals and use water more effectively

Trade Implications: Take Home Point 2
• Water policy matters– There is still plenty of capacity to adapt
to limited water availability for agriculture
– This will require more investments, institutions to resolve conflicts, and policies that provide incentives to conserve

Trade Implications: Take Home Point 3
• Other policies matter– Current policies to increase rural
incomes, subsidize agriculture and provide more secure land tenure will color how China adapts to water scarcity
– Urbanization and commercialization trends will also influence production and trade
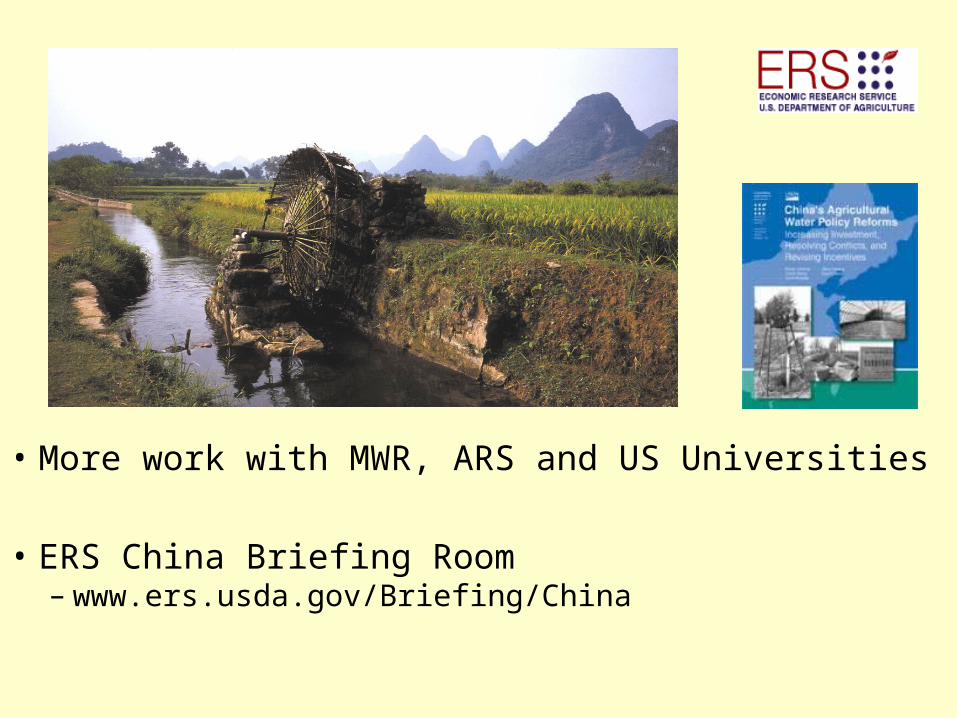
• More work with MWR, ARS and US Universities
• ERS China Briefing Room– www.ers.usda.gov/Briefing/China


