China’s Export Growth and the China Safeguard: Threats to the World Trading System? †,‡ Chad P. Bown Meredith A. Crowley Brandeis University Federal Reserve Bank of Chicago This Draft : December 2007 Abstract China’s deepening engagement in the global trading system and the threat of its export capacity have affected the negotiation, formation, and rules of international trade agreements. Among other changes, China’s 2001 accession to the World Trade Organization (WTO) intro- duced new allowances for existing members to deviate from core WTO principles of reciprocity and most-favored-nation (MFN) treatment by giving existing members access to a discriminatory, import-restricting China safeguard based on the threat of “trade deflection.” This paper asks whether there is historical evidence that imposing discriminatory trade restrictions against China during its pre-accession period led to Chinese exports surging to alternative markets. To examine this question, we use a newly constructed data set of product-level, discriminatory trade policy actions imposed on Chinese exports to two of its largest destination markets over the 1992-2001 period. Perhaps surprisingly, we find no systematic evidence that either U.S. or EU imposition of such import restrictions during this period deflected Chinese exports to alternative destina- tions. To the contrary, we provide evidence that such import restrictions may have a chilling effect on China’s exports of these products to secondary markets - i.e., the conditional mean U.S. antidumping duty on China is associated with a 20 percentage point reduction in the relative growth rate of China’s targeted exports. We explore explanations for these puzzling results as well as potential implications for the sustainability of the rules of the world trading system. JEL No. F10, F12, F13 Keywords: Reciprocity, MFN, GATT, WTO, Trade Deflection, Safeguards, Antidumping †Bown: Department of Economics, MS 021, Brandeis University, Waltham, MA 02454-9110 USA tel:781-736-4823, fax:781-736-2269, email: [email protected], http://www.brandeis.edu/˜cbown/ Crowley (corresponding author): Department of Economic Research, Federal Reserve Bank of Chicago, 230 S. LaSalle St, Chicago, IL 60604-1413 USA tel: 312-322-5856, fax: 312-322-2357, email: [email protected], http://www.chicagofed.org ‡ For helpful discussions, we thank Tom Prusa, Robert Staiger, Robert Feinberg, Rachel Mc- Culloch, Mike Moore, John Fernald, Xenia Matschke, Paroma Sanyal, Patricia Tovar, William Alford, James Durling, Daniel Klett, Maurizio Zanardi, and seminar participants at Brandeis, the University of Connecticut, Florida International University, the Federal Reserve Bank of Chicago, the IMF Conference on Global Implications of China’s Trade, Investment and Growth, and the 2005 SEA meetings. Jaimie Lien, Jaewoo Nakajima, Saad Quayyum and Matthew Niedzwiecki provided outstanding research assistance. Bown acknowledges financial support from the World Bank. The opinions expressed in this paper are those of the authors and do not necessarily reflect those of the Federal Reserve Bank of Chicago or the Federal Reserve System. All remaining errors are our own.
Transcript
China’s Export Growth and the China Safeguard:
Threats to the World Trading System?†,‡
Chad P. Bown Meredith A. Crowley
Brandeis University Federal Reserve Bank of Chicago
This Draft: December 2007
Abstract
China’s deepening engagement in the global trading system and the threat of its exportcapacity have affected the negotiation, formation, and rules of international trade agreements.Among other changes, China’s 2001 accession to the World Trade Organization (WTO) intro-duced new allowances for existing members to deviate from core WTO principles of reciprocity
and most-favored-nation (MFN) treatment by giving existing members access to a discriminatory,import-restricting China safeguard based on the threat of “trade deflection.” This paper askswhether there is historical evidence that imposing discriminatory trade restrictions against Chinaduring its pre-accession period led to Chinese exports surging to alternative markets. To examinethis question, we use a newly constructed data set of product-level, discriminatory trade policyactions imposed on Chinese exports to two of its largest destination markets over the 1992-2001period. Perhaps surprisingly, we find no systematic evidence that either U.S. or EU impositionof such import restrictions during this period deflected Chinese exports to alternative destina-tions. To the contrary, we provide evidence that such import restrictions may have a chillingeffect on China’s exports of these products to secondary markets - i.e., the conditional mean U.S.antidumping duty on China is associated with a 20 percentage point reduction in the relativegrowth rate of China’s targeted exports. We explore explanations for these puzzling results aswell as potential implications for the sustainability of the rules of the world trading system.
†Bown: Department of Economics, MS 021, Brandeis University, Waltham, MA 02454-9110 USAtel:781-736-4823, fax:781-736-2269, email: [email protected], http://www.brandeis.edu/˜cbown/
Crowley (corresponding author): Department of Economic Research, Federal Reserve Bank ofChicago, 230 S. LaSalle St, Chicago, IL 60604-1413 USA tel: 312-322-5856, fax: 312-322-2357,email: [email protected], http://www.chicagofed.org
‡ For helpful discussions, we thank Tom Prusa, Robert Staiger, Robert Feinberg, Rachel Mc-Culloch, Mike Moore, John Fernald, Xenia Matschke, Paroma Sanyal, Patricia Tovar, WilliamAlford, James Durling, Daniel Klett, Maurizio Zanardi, and seminar participants at Brandeis, theUniversity of Connecticut, Florida International University, the Federal Reserve Bank of Chicago,the IMF Conference on Global Implications of China’s Trade, Investment and Growth, and the2005 SEA meetings. Jaimie Lien, Jaewoo Nakajima, Saad Quayyum and Matthew Niedzwieckiprovided outstanding research assistance. Bown acknowledges financial support from the WorldBank. The opinions expressed in this paper are those of the authors and do not necessarily reflectthose of the Federal Reserve Bank of Chicago or the Federal Reserve System. All remaining errorsare our own.
1 Introduction
China’s entry into global markets has had an important effect on the rules of the world trading system.
After close to fifteen years of negotiations that began under the General Agreement on Tariffs and
Trade (GATT), China was finally granted membership in the World Trade Organization (WTO) in
2001. While China’s accession to the organization was heralded as a significant achievement for trade
policy negotiators, its terms of accession introduced new allowances for existing members to deviate
from historic and core GATT/WTO principles. In particular, the commitment that members adhere
to the fundamental rules of reciprocity and most-favored nation (MFN) treatment, the second of which
is also referred to as nondiscriminatory treatment across trading partners, was substantially weakened
through the introduction of a newly available “China safeguard” import-restricting policy instrument.
A political justification for the new safeguard was that China’s export capacity threatened to disrupt
established trade patterns. Furthermore, an unprecedented statutory trigger for use of the import
restriction is the phenomenon of “trade deflection,” i.e., where a second country’s imports from China
surge because of a first country imposing its own trade restriction that shut Chinese exports out of
its market.
This paper empirically investigates whether there is historical evidence that the imposition of
discriminatory import restrictions on Chinese trade deflected Chinese exports to secondary markets
during its pre-accession period. Since the discriminatory China safeguard was not in use during this
period, we address the question by matching data on Chinese exports to roughly forty destination
markets to a new dataset of discriminatory antidumping measures imposed on China by two of its
most important trading partners. To the best of our knowledge, this is the first paper to investigate
whether Chinese exports have been deflected to alternative markets when hit with discriminatory
trade restrictions. Prior research investigating related questions has found evidence of such trade
deflection; nevertheless, the prior evidence has not investigated Chinese exports, as it has been limited
to the examination of exports from other countries and/or is focused on specific industries.1
WTO members created a “Transitional Product-Specific Safeguard Mechanism” that can be used
against imports from China until 2014 under Section 16 of China’s terms of accession (WTO, 2001).
Many characteristics of the new China safeguard are at odds with core WTO principles and estab-
1In work motivated by the EU’s 2002 global safeguard policy on steel which invoked a similar concern over trade
deflection emanating from the U.S. steel safeguard (EU, 2002), Bown and Crowley (2007) find substantial evidence
that the imposition of administered import-restricting trade policies against Japanese exports led to export surges
to alternative markets. Durling and Prusa’s (2006) investigation of global exports from the hot rolled steel market
provides some evidence for trade deflection, as does Debaere’s (2005) investigation of the shrimp market in response to
the EU’s discriminatory revocation of GSP status for Thai exporters.
1
lished instruments of administered import protection traditionally available to its Members.2 First,
unlike any other import-restricting policy instrument legally available to the WTO membership, the
allowance of a China-specific trade restriction on imports of fairly traded goods is otherwise incon-
sistent with MFN treatment.3 Second, the use of the new China safeguard also does not require the
policy-imposing country to immediately compensate China for withdrawing trade concessions. This,
in effect, weakens the commitment to the WTO’s reciprocity principle as well.4
The most radical change introduced by the new China safeguard is the weakened evidentiary
criterion that WTO members must satisfy in order to legally impose a new barrier to Chinese trade.
Specifically, section 16.8 of China’s accession introduced the following,
“If a WTO Member considers that an action [i.e., a China safeguard imposed by another
Member]... causes or threatens to cause significant diversions of trade into its market [i.e.,
‘trade deflection’], it may request consultations with China and/or the WTO Member
concerned... If such consultations fail to lead to an agreement... the requesting WTO
Member shall be free, in respect of such product, to withdraw concessions accorded to or
otherwise limit imports from China...” (WTO, 2001, p. 10).
The implication of section 16.8 is that, if one WTO member imposes a China safeguard, a second
WTO member can automatically impose a China safeguard on the same product without having to
undertake its own injury investigation. Thus the second country can impose a China safeguard on the
same product without having to demonstrate actual evidence of a threat of deflected imports from
China, evidence of an actual increase in imports from China, or even evidence of injury (or a threat of
2Some of the discriminatory elements of the China safeguard are reminiscent Japan’s 1955 entry into the GATT.
In particular, a 1987 GATT working party pointed out that, despite the desire at the time for some existing members
to introduce a new Japan-specific safeguard, “Japan became a contracting party in September 1955 without any new
general safeguard clause being added to the General Agreement. Some [13 out of 34] contracting parties invoked
Article XXXV [“Non-Application of the Agreement between Specific Contracting Parties”] on Japan’s accession. In a
number of cases, Japan negotiated bilateral trade agreements containing special safeguard clauses which were followed
by the countries concerned disinvoking Article XXXV.” (GATT 1987, p. 2) For an additional discussion of the China
safeguard, see Messerlin (2004).3There are three other primary areas under the WTO in which exceptions to MFN-treatment for import restrictions
are broadly permissible: 1) raising discriminatory trade barriers against unfairly traded goods under antidumping or
countervailing duty laws; 2) lowering trade barriers in a discriminatory manner under a reciprocal preferential trade
agreement; and 3) lowering trade barriers in a discriminatory manner to developing countries unilaterally, such as under
the Generalized System of Preferences (GSP).4Bagwell and Staiger (1999) provide an economic interpretation of reciprocity under the GATT/WTO, noting that
it is primarily a rule for renegotiations that limits a WTO trading partner’s permissible compensatory retaliation when
a first country seeks to raise its tariff above a previously agreed-upon level, as would be the case here.
2
injury) to its own domestic industry. This is a substantial difference from all other WTO-authorized
import restrictions, which require some evidence and impose a nontrivial resource and political cost
on a country seeking to limit the market access previously granted to another WTO member.5 This
policy is based on the now codified provision that there exists a substantial threat that one country’s
China safeguard will deflect Chinese exports to a secondary market.
Thus far, the most public battles over use of the new China safeguard focused on the U.S. and
EU imposing import restrictions on fair trade from China in the textile and clothing sectors in 2005.6
Nevertheless, any WTO member can impose a China safeguard on any of China’s exported products,
an increasing share of which are outside of the textiles and apparel sectors. Data collected from
the WTO and reported in Bown (2007) indicates that at least 10 different WTO members initiated
investigations under the new China-safeguard policy between 2002 and 2006, with at least five of
those countries imposing trade-restricting measures on products as varied as float glass, polyvinyl
chloride and porcelain tiles (Turkey), in addition to textiles and clothing products (U.S., EU, Peru
and Colombia). An examination of countries with relatively transparent import policy governance
such as Canada (CITT, 2007) and the U.S. (ITC, 2007) indicates that WTO members were quick to
include the “trade deflection” provision into their domestic implementing legislation thus making it
readily accessible for competing industries and policymakers seeking a new trigger to limit Chinese
exports.7
Is there historical evidence that discriminatory trade restrictions imposed on China have disrupted
trade flows via trade deflection? To investigate this question we examine the impact of discriminatory
trade policies on Chinese product-level exports over its pre-accession 1992-2001 period. We focus on
U.S. and EU imposition of product-specific, discriminatory import restrictions.8 As table 1 indicates,
one motivation for focusing on the U.S. and EU is that they are two of China’s four largest destination
markets for its exports. If China’s exporters are able to deflect trade, these are two of the markets
from which we expect trade deflection to derive.9 Moreover, our focus on the effect of U.S. and
5The standard safeguard investigation requires evidence of injury (or threat thereof) caused by increased imports.
Antidumping (countervailing duty) investigations also require evidence of less than fair value pricing (illegal export
subsidies) in addition to the evidence of injury caused by imports. For a discussion of the general role of safeguards in
the WTO, see Hoekman and Kostecki (2001).6See, for example, “Made in Washington: How the Textile Industry Alone Won Quotas on Chinese Imports,” Wall
Street Journal, 10 November 2005, p. A1.7For the U.S., see ‘Section 422: China Trade Diversion Investigations’ of the U.S. Trade Act of 1974, and for Canada,
see ‘Safeguard Inquiry: Trade Diversion Imports from China’ of the Canadian International Trade Tribunal Act.8In what follows below, for convenience we may refer to the EU as a “country” since it invokes a singular trade
policy stance toward Union non-members such as China.9Furthermore, we believe there are good reasons to be less interested in focusing on two other primary export
markets for China - Hong Kong and Japan - as the “triggers” for the trade deflection. While Hong Kong was technically
3
EU discriminatory trade policies is motivated by data requirements. Both the U.S. and EU utilize
discriminatory, antidumping import restrictions and publish very detailed, product-level information
on these policies. Using newly collected data on policy impositions at the product level (Bown, 2005)
allows us to directly identify evidence of trade deflection associated with such measures.10
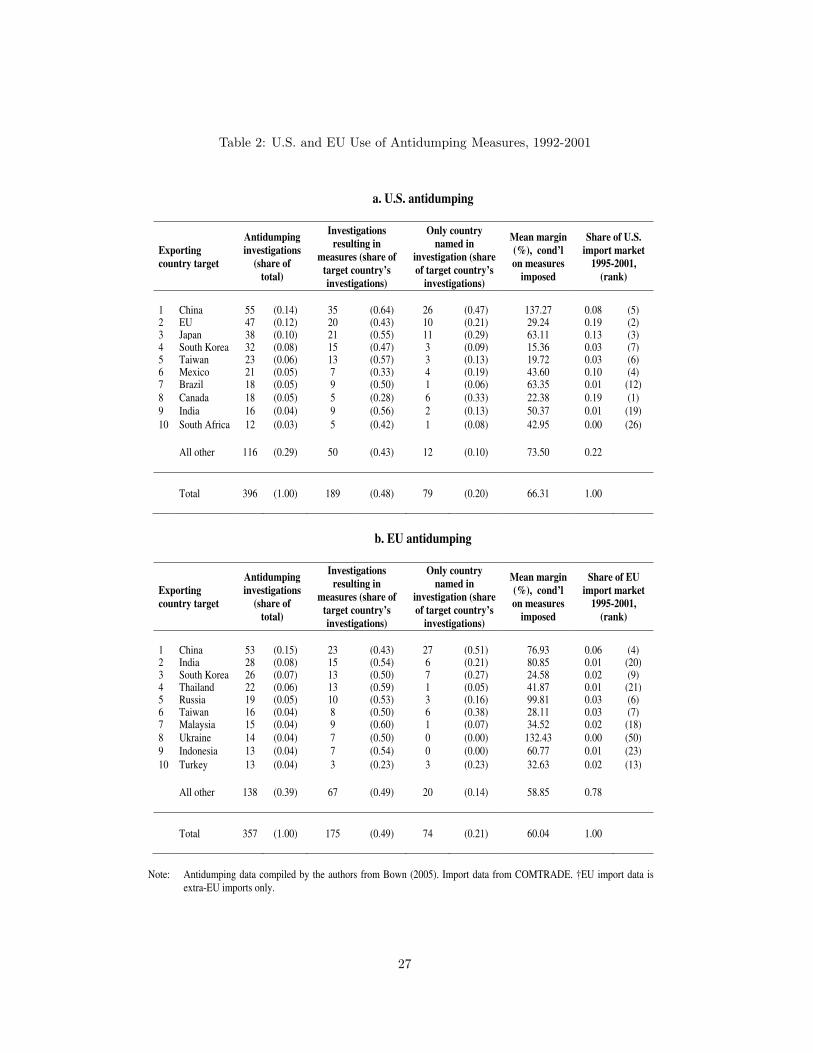
Furthermore, as table 2 indicates, the U.S. and EU are useful countries on which to focus because
their antidumping authorities frequently targeted Chinese exports with new, discriminatory import
restrictions. Indeed, China faced the most antidumping investigations and the most imposed mea-
sures over the 1992-2001 period, nearly twice as many as the next most-targeted exporter. And as
the middle columns indicate, under both the U.S. and EU antidumping regimes, China was also a
frequent single target of investigation, implying that it often faced the imposition of discriminatory
antidumping measures that will be most similar to the WTO’s new China safeguard.11 Moreover,
even in investigations that target multiple foreign countries exporting the same product, an importer
can discriminate against China by imposing higher antidumping duties or more stringent price under-
taking requirements than those that are imposed on non-Chinese exporters of the same product. The
second-to-last column provides evidence that China faces higher-than-average antidumping measures
as well.
Nevertheless, despite China being a frequent target of both countries, as table 3 indicates, there is
surprisingly little overlap to the Chinese products that are targeted by both the U.S. and EU regimes.
For example, of the 123 unique 6-digit Harmonized System (HS) products exported from China that
faced antidumping measures in the U.S. and the EU during the 1990-2001 period, only fourteen of
those products were targeted by both countries over that twelve year period. As table 4 indicates,
most of these products are in the steel (metals) and chemicals industries, and it is even more rare
China’s largest export market in 1997, much of China’s exports sent to Hong Kong are never intended for consumption,
but instead for processing and re-export to other markets (Feenstra and Hanson, 2004). Furthermore, while Japan is
China’s third largest export market and a potential additional country to investigate, Japan has rarely used antidumping
historically.10Since China was not a WTO member during the sample period under investigation, even the mere attempt to
track other (non-U.S., non-EU) countries’ imposition of new import restrictions against China at the product level is
extremely difficult, given that such policies were neither restricted by the WTO nor were countries required to report
to the WTO the trade policies imposed against China.11An antidumping measure would be less discriminatory than a China safeguard if there were multiple exporters
targeted in a multi-country investigation of the same product. Hansen and Prusa (1996) argue that this is likely to
occur in the U.S. due to the incentive created by U.S. law for petitioning industries to seek to cumulate imports in
injury investigations. Furthermore, note that we do not examine the impact of countervailing duties because the U.S.
did not impose any countervailing measures against Chinese products over the 1992-2001 period (Bown, 2005) due to
a 1984 Department of Commerce decision (upheld by the 1986 Georgetown Steel case) not to consider anti-subsidy
investigations of exports from non-market economies like China and the former Soviet Union.
4
that the impositions occur in the same (or even adjacent) years.
With respect to our econometric investigation and results, perhaps surprisingly, we find no sys-
tematic evidence that U.S. or EU antidumping restrictions deflected Chinese exports to secondary
markets over the 1992-2001 period. We examine the potential impact of contemporaneous as well as
lagged effects of such policies, and we employ two distinct econometric approaches. Not only is there
no evidence of trade deflection to these markets, there is some weak evidence of a reduction in the
relative growth of Chinese exports of these targeted products to secondary markets. One interpreta-
tion is that this evidence is consistent with a global “chilling effect” of U.S. and EU antidumping on
Chinese exports to alternative markets: i.e., Chinese exporters may be learning that certain products
are in politically sensitive sectors and choosing to slow down their export expansion in these prod-
ucts. The size of the estimated effect is substantial as the conditional mean U.S. antidumping duty
on China of 125% is associated with a 20 percentage point reduction in the relative growth rate of
China’s exports.
Our empirical results indicate no historical evidence of import restrictions deflecting Chinese trade
and disrupting established trading patterns. Ironically, it may not be China’s export growth and
ability to deflect trade that poses a threat to the world trading system. Rather, a more substantial
threat to the WTO could be the China safeguard policy that has been designed in part to remedy
(the historically non-existent for China) trade deflection, but which allows existing WTO members
to easily deviate from the WTO’s core principles of reciprocity and MFN treatment. A substantial
theoretical literature examining the GATT/WTO, closely associated with the work of Bagwell and
Staiger (2002),12 identifies reciprocity and MFN as some of the weakest rules necessary for countries
to rely on to negotiate an efficiency-enhancing trade agreement initially and to sustain the agreement
over time in the face of political and economic shocks. From this perspective, our results raise
the question of any political-economic benefit to inclusion of the trade deflection provision, when
easy access to the new China safeguard generated by this provision imposes costs via risks to the
sustainability of the WTO.
The rest of this paper proceeds as follows. Section 2 details our empirical approach and the related
literature. Section 3 describes the data used in the estimation, and section 4 presents our results and
12While much of the initial work in this area is contained in Bagwell and Staiger (2002), other recent papers also
examine the roles of MFN and reciprocity as they relate to issues surrounding the accession of a substantial trading
partner. For example, the principles combine to form a first line of defense against ‘bilateral opportunism,’ or the value
of a concession won by one country in an earlier negotiation being eroded due to the outcome of a subsequent set of
negotiations to which it is not party (Bagwell and Staiger, 2005). Furthermore, the principles can also be combined
to facilitate multilaterally efficient outcomes, even when trade policy negotiations occur bilaterally and sequentially
(Bagwell and Staiger, 2004).
5
basic robustness checks using a difference-in-difference estimation approach. In section 5 we provide
a last sensitivity analysis using an alternative, instrumental variables estimation approach. Section 6
concludes.
2 Empirical Model and Estimation
2.1 The empirical investigation
Our empirical analysis is motivated by a three country theoretical model in Bown and Crowley (2007)
which develops a number of predictions relating a change in one country’s trade policy to changes
in trade flows among other countries. The most novel predictions are termed “trade deflection” and
“trade depression.” When one country (A) imposes a country-specific tariff on imports from another
country (B), the consequent rise in exports from the second country (B) to the third country (C) is
termed trade deflection. Trade depression refers to the reduction in the third country’s (C’s) exports
to the second country (B) when the first country (A) imposes a country-specific tariff on imports
from country B. While it will not be the focus of empirical investigation here, the model also predicts
“trade destruction,” i.e., that country A’s import tariff against country B will result in a fall in A’s
imports from country B. Lastly, the model predicts “trade creation through import source diversion”
or, more succinctly “trade diversion,” i.e., that country A’s imports from country C will rise (Viner,
1950).
In this paper, we estimate an augmented gravity model of China’s (country B’s) product-level
exports to 38 trading partners (countries C) which has been adapted to estimate the effects of U.S.
and EU (countries A) imposition of product-level antidumping duties. For clarity of exposition,
ignoring China’s other trading partners, what effects on trade flows might we expect when the country
imposing the tariff is the U.S. and the foreign countries are Japan (country C) and China (country
B)? First, if the U.S. imposes a country-specific tariff against China in the form of an antidumping
duty and imposes no tariff against Japan, we might expect deflected trade, an increase in Chinese
exports to Japan. Second, if the U.S. imposes a country-specific tariff against Japan in the form of
an antidumping duty, but not against China, we might expect that Chinese exports to Japan will
fall, i.e., depressed trade. In this case, Japanese exports that are diverted away from the U.S. market
by the tariff and sold domestically within Japan depress Japanese imports from China.
6
2.2 The empirical model
In light of the WTO rules on the China safeguard, our primary interest is identifying trade deflection,
an increase in China’s exports to some country i in response to a trade restriction imposed by another
country such as the U.S. or EU. We begin with a basic gravity specification for China’s exports to
country i that incorporates trade policy changes introduced by the U.S. and EU on their own imports
from China. Ultimately we utilize two different econometric approaches to estimating trade deflection.
Each approach relies on a different source of variation in the data to obtain identification and, thus,
speaks to the robustness of our results.
To begin, assume that China’s exports to country i of a 6-digit HS product h in year t can be
written as a standard gravity model,
xciht = aih + aht + ait + act +t∑
j=t−2
β′
1jτUSc,ushj +
t∑
j=t−2
β′
2jτEUc,euhj +
t∑
j=t−2
β′
3jτUSi,ushj
+
t∑
j=t−2
β′
4jτEUi,euhj +
t∑
j=t−2
β′
5jτic,ihj + ǫciht,
(1)
where xciht denotes exports from China to country i of 6-digit HS product h in year t, aih is country i’s
time-invariant propensity to import good h (e.g., time-invariant trade barriers, transportation costs,
distance, culture, etc.), aht is a time-varying cost or productivity shock to good h, ait represents
country i’s time-varying aggregate variables (e.g., GDP, the exchange rate, aggregate demand for
imports), and act represents China’s time-varying aggregate variables (e.g., GDP, the exchange rate,
aggregate supply of exports). The τ ’s in equation (1) are the trade policy changes that might impact
China’s exports to country i. Their first subscript indicates the country against which the restrictive
trade policy is imposed, the second subscript indicates the country imposing the trade restriction, the
third subscript denotes the product h, and the fourth subscript denotes the year j. Specifically, we
include: the U.S. import tariff on good h exported from China (τUSc,ushj), the EU import tariff on good
h exported from China (τEUc,euhj), the U.S. import tariff on good h exported from country i (τUS
i,ushj),
the EU import tariff on good h exported from country i (τEUi,euhj), and country i’s import tariff on
good h exported from China (τ ic,iht). Finally, it may be the case that the impact of a change in a
tariff on trade flows to secondary markets occurs only after a time delay. Thus we allow for current
trade flows to be affected by both the contemporaneous (j = t) imposition of a new trade restriction,
as well as trade policy changes of up to two lags (j = t − 1, t − 2).
In equation (1), the coefficients β1j (β2j) and β3j (β4j) for j = t−2, t−1, t identify trade deflection
and trade depression associated with U.S. (EU) antidumping duties, respectively. If the imposition
7
of a U.S. (EU) antidumping duty against China is associated with an increase in China’s exports to a
secondary market, we expect that β1j (β2j) will be greater than zero. Furthermore, estimates of β3j
(β4j) that are less than zero indicate trade depression; i.e., the imposition of a U.S. (EU) antidumping
duty against country i is associated with a decrease in China’s exports to that secondary market.
The greatest econometric concerns in estimating trade deflection and trade depression in equa-
tion (1) are the potential endogeneity of the tariffs and the relationship between a change in a tariff
and any underlying cost or productivity shock affecting a particular 6-digit HS good. With regard to
the tariffs, it seems reasonable to assume that the U.S. and EU antidumping duties are set indepen-
dently vis-a-vis China’s exports to some third country i. Moreover, the correlation between U.S. and
EU trade policy changes against China in our sample is a very low 0.0006 suggesting that the U.S.
and EU only rarely, if ever, respond to a common cost or technology shock in China. Despite this
evidence against the concern that trade policy is responding to a common Chinese technology shock
at the 6-digit HS level, we still want to carefully control for product-level shocks so that our estimates
of the coefficients β1j through β4j can be interpreted as treatment effects of the policy change.
2.3 Difference-in-difference model to estimate trade deflection
Our first approach identifies trade deflection by utilizing variation within a 6-digit HS product across
two exporting countries. First, rewrite an analog to equation (1) in which the exporter, China, is
replaced with a subscript d to denote a different exporting country with exporting characteristics
(described below) similar to China. Then we take the time difference of (1) for China as well as
the time difference of the analog equation for exporter d, and we difference those two equations.
Under the assumption that importing country i’s trade policy is constant over the time period under
consideration,13 we then have:
(∆xciht − ∆xdiht) = ∆act − ∆adt +
t∑
j=t−2
β′
1j(∆τUSc,ushj − ∆τUS
d,ushj)
+t∑
j=t−2
β′
2j(∆τEUc,euhj − ∆τEU
d,euhj) + (∆ǫciht − ∆ǫdiht).
(2)
The variable ∆xciht (∆xdiht) denotes the growth of Chinese (country d) exports of h to country i
at time t where ∆xciht ≡xciht−xciht−1
(xciht+xciht−1)/2 in our basic specifications. This average measure of the
growth rate of exports, used by Davis and Haltiwanger (1992), allows us to include observations of
13Alternatively, if we assume that country i trade policy varies over time, but is MFN, or nondiscriminatory, we
arrive at the same specification.
8
zero trade in our estimation sample. Specifically, this measure caps the growth rate of trade between
t− 1 and t at +200% when there is entry into a market and -200% when there is exit from a market.
Including observations of China’s entry (and exit) into specific markets is important in our empirical
work because we wish to understand if China, as a developing country, is also able to deflect its
exports to new markets when it faces trade restrictions that may be shutting it out of the U.S. or EU
markets. Nevertheless, so as to check the robustnsess of our results, we also include specifications that
use conventional log growth rate measures ∆xciht ≡ lnxciht − lnxciht−1, omitting all observations on
entry and exit by construction. Next, we use year dummies to control for aggregate shocks in China
and country d, (∆act and ∆adt). The variable ∆τUSc,usht (∆τEU
c,euht) designates the magnitude of the
contemporaneous change in the U.S. (EU) tariff rate against imports from China. Similarly, the
variable ∆τUSd,usht (∆τEU
d,euht) designates the magnitude of the contemporaneous change in the U.S.
(EU) tariff rate against imports from country d.
When implementing the model on a sample of data, we choose India as ‘country d’ for a number of
reasons. As we detail below, India has considerable similarities with China when it comes to export
structure (both by commodity and by destination market), export growth during this time period,
and it is also an important target of both U.S. and EU use of antidumping.
The coefficients β1j and β2j for j = t−2, t−1, t identify trade deflection associated with U.S. and
EU antidumping duties. If the imposition of a U.S. antidumping duty against China is associated
with an increase in China’s exports relative to India’s (country d’s) exports, we expect that β1j will
be greater than zero. Similarly, if an increase in the U.S. antidumping duty against India induces
Indian trade deflection, we expect India’s exports to market i to rise relative to China’s exports to
i, yielding a positive coefficient on β1j . The same reasoning implies that trade deflection associated
with an EU antidumping measure will yield an estimate of β2j that is positive.
Note, however, that one implication of this particular difference-in-difference approach is that we
cannot identify β3j and β4j - i.e., trade depression - from equation (2). We therefore introduce a
framework for estimating trade depression separately in the next section.
Finally, while equation (2) forms our baseline specification, as a robustness check we also estimate
a variant of the model to examine the possibility of “aggregate deflection” by China and India (country
d) to all markets other than the U.S. and EU. Specifically, in this particular sensitivity analysis we
sum Chinese exports to China’s top 41 trading partners less the U.S., EU and India (country d)
for each product in year t (xrowcht ). Similarly, in accordance with our difference-in-difference strategy,
we sum India’s (country d’s) exports to those same (China’s top 41) trading partners less the U.S.,
and the EU for each product h in each year t (xrowdht ). We then estimate an aggregated analog to
equation (2) given by
9
(∆xrowcht − ∆xrow
dht ) = ∆act − ∆adt +
t∑
j=t−2
β′
1j(∆τUSc,ushj − ∆τU.S.
d,ushj)
+t∑
j=t−2
β′
2j(∆τEUc,euhj − ∆τEU
d,euhj) + (∆ǫrowcht − ∆ǫrow
dht ).
(2′)
We also expect that aggregate trade deflection associated with U.S. and EU duties will be associated
with positive coefficient estimates of β1j and β2j .
2.4 Difference-in-difference model of trade depression
We use a similar difference-in-difference approach to estimate trade depression. To fix ideas once
again, we are interested in the question of whether China’s exports to a secondary country market
fall if that country’s own exports of a 6-digit HS product are subject to a U.S. or EU antidumping
trade restriction. In order to obtain identification in this case, we utilize variation in China’s exports
to two different countries that faced U.S. and EU antidumping restrictions between 1992-2001.
Taking the time difference of (1) for two separate export markets, we write the difference between
China’s export growth to countries i and k as:
(∆xciht − ∆xckht) = ∆ait − ∆akt +t∑
j=t−2
β′
3j(∆τUSi,ushj − ∆τUS
k,ushj)
+
t∑
j=t−2
β′
4j(∆τEUi,euhj − ∆τEU
k,euhj) + (∆ǫc,iht − ∆ǫckht),
(3)
where variables are defined as in (2), and we use year dummies to control for aggregate variation in
countries i and k. The coefficients β3j and β4j for j = t−2, t−1, t identify potential trade depression
associated with U.S. and EU trade policies. Trade depression, a decline in China’s exports to countries
i or k in the face of an antidumping measure, would imply estimates of β3j and β4j that are less than
zero.
Note, finally, that there are two subtle differences between equations (3) and (2). First, with
respect to Chinese exports to two different countries, even a China-specific 6-digit HS productivity
shock falls out of the expression, so the restrictiveness of the assumption about time-varying produc-
tivity is less stringent in equation (2). Second, equation (3) implicitly assumes that tariff policies
by countries i and k are constant over the time period under consideration. In order to estimate
equation (3), we choose countries that infrequently changed their own tariffs over the sample period.
For reasons we detail below, we estimate equation (3) on relative Chinese export growth to Japan (i)
and Korea (k).
10
3 Variable Construction and Data
In this section we discuss the construction of variables used in the estimation. Tables 5 and 6 present
summary statistics for the primary data used in the estimation.
3.1 Trade variables
The dependent variables in the estimation of equations (2), (2′), and (3) are constructed from the
annual volume of China’s exports to 38 of its top markets for roughly 4700 6-digit Harmonized System
(HS) products for the years 1992 to 2001 (table 1). The data derives from the World Integrated Trade
System (WITS) COMTRADE data base. The dependent variable of equation (2) also requires data
on Indian (country d) exports of the same 4700 products to 38 of China’s top markets. In our
robustness checks, we also use data on the value of Chinese and Indian exports to these markets. Our
final estimation sample includes observations on the dependent variable from 1993 to 2001.
First consider the dependent variable in the estimation of equation (2), the difference between
the annual growth of China’s exports to 38 different countries i of commodity h and India’s exports
of the same commodities to the same countries. In choosing India as ‘country d’ in equation (2) we
were guided by a desire to match as closely as possible China’s mix of export markets, its mix of
exported goods, its relatively high aggregate growth rate of exports, and the relatively high number
of antidumping measures imposed by the U.S. and EU between 1992-2001. Table 1 presents the
shares of exports by country for China and India in 1997, the midpoint of our sample. First, the
U.S. and EU are important destination markets for both countries and represent a combined 31.0%
(46.1%) of China’s (India’s) total exports. They share a number of other important export markets
including Japan, South Korea, Singapore, Taiwan, Russia, Australia, Canada and Malaysia. The
biggest difference is that Hong Kong is China’s top export market with a 24.0% export share while
Hong Kong receives only 5.6% of India’s exports. One likely explanation for this disparity is Hong
Kong’s role in entrepot trade for exports originating in China (Feenstra and Hanson, 2004).14 Finally,
export shares are similar in other years, but they do reflect some changes in the structure of trade
over time.
Table 7 presents the shares of China’s and India’s exports by broadly defined goods categories
for 1997. In terms of the mix of exported goods, the top category for both countries is textiles and
apparel, which account for 14.1% (17.5%) of China’s (India’s) exports. Metals including steel, are
14In the formal estimation, we have run specifications of the model that drop Hong Kong as an export market, and
we have also examined whether Hong Kong’s re-exports of Chinese goods might account for trade deflection. None of
our results were affected by these considerations, though the estimates are available from the authors upon request.
11
another important category of exports, representing 10.1% (11.8%) of China’s (India’s) exports. In
terms of growth rates, average annual real growth of exports between 1993 and 2001 was 15.8% for
China and 11.0% for India. In our product-level data set, which excludes exports by each country to
the U.S., EU and China or India, average annual growth of the volume of exports (across all markets)
was 16.2% for China and 11.9% for India. Given the similarities of trade structure by destination
markets and by products, the similar high rates of trade growth, and the similar frequencies of AD
investigations that we discuss in the next section, India is the best country to use as a control for
China in such a difference-in-difference framework.
On the other hand, when we estimate equation (3), we define the dependent variable as the
difference between Chinese export growth of product h in year t to Japan and Korea. We choose
Japan and Korea as the export destinations i and k for the following reasons: (1) Japan and Korea
are at similar stages of development with similar industrial structures, (2) the two countries have
similar aggregate rates of import growth from China, and (3) both countries frequently face U.S. and
EU antidumping measures during this time period with some overlap of products that China exports,
making them potentially good targets for identifying trade depression.
While Japan and Korea were not required by WTO rules to report changes in trade policy, in-
cluding antidumping, against China during the 1992-2001 period and, thus, any reporting may be
incomplete, some information is available. Japan reported one antidumping case against China (initi-
ated in 1991) and Korea reported eight investigations between 1992 and 2001. While the information
reported may be incomplete, it is supportive of our assumption that Japan and Korea’s trade policies
against China did not involve high frequency tariff changes during this period.
3.2 U.S. and EU antidumping policy variables
The main explanatory variables of interest are the changes to U.S. and EU import policy facing a
commodity h exported from China or from another country. Our estimates use the level of duties
imposed by the U.S. and by the EU. For EU cases that result in price undertakings, we use reported
dumping margins to proxy for the magnitude of the policy change.15
The information on U.S. and EU measures imposed at the product level derives from a newly
compiled data source (Bown, 2005).16 For the case of the U.S. (EU) antidumping, the information
in the dataset has been collected from original source government publications such as the Federal
Register (Official Journal of the European Communities), where we are able to track the dates of
15In unreported results, we have also separated antidumping cases that end in duties versus those that end in price
undertakings, and this does not affect our results.16See the publicly available ‘Global Antidumping Database,’ at http://www.brandeis.edu/˜cbown/global ad/ .
12
investigations, measures imposed, countries affected, and 6-digit HS products that were targeted.
Our estimation examines the export growth path for products targeted by an antidumping measure
for multiple years around the policy’s actual imposition. For both U.S. and EU antidumping measures
examined in the estimation, we identify the focal year t as the initiation year of the antidumping
investigation, as opposed to the year the final measure was actually imposed, though frequently they
will be the same. One motivation for this choice is that there has been evidence in prior research that
even antidumping investigations that do not end in imposed measures can have a destructive effect
on imports, due to the uncertainty as to the final disposition of the case (Staiger and Wolak, 1994).
Nevertheless, we expect that this decision could lead us to estimate a differential impact of Chinese
export growth with respect to the timing of U.S. versus EU measures, and in some specifications we
therefore allow for the lagged imposition of policies (t − 1, t − 2) to affect contemporaneous export
growth.
4 Empirical Results
4.1 Difference-in difference-estimates of trade deflection
Do U.S. and EU antidumping duties deflect Chinese and Indian exports to secondary (non-U.S.,
non-EU) markets? Our difference-in-difference deflection estimates, presented in table 8, indicate no
robust evidence of statistically significant deflection. In fact, rather than an increase in exports to
third markets, U.S. antidumping duties may be associated with a “chilling” effect on Chinese exports
to such alternative markets. With respect to EU trade policy, the only economically and statistically
significant finding is a chilling effect associated with EU duties on steel products.
Our baseline specification (1) examines the response of the difference between China’s and India’s
yearly growth of the volume of trade to the contemporaneous initiation of an AD investigation that
resulted in duties imposed by the U.S. and EU against China and/or India, respectively. At this short
time horizon, the difference between the within-year policy changes against China and India has no
effect on the difference in the growth of the volume of exports to alternative markets. Given that it
could take over a year for a U.S. or EU antidumping investigation to result in the imposition of a
definitive import restriction, the finding of no contemporaneous response in not entirely surprising.
Our second specification (2) utilizes the same dependent variable, but includes lags of the difference
in the change in the U.S. and EU duties, respectively. We include lags in case the full impact of a
new antidumping restriction is not felt until the full administrative process (or perhaps even longer)
is completed. Furthermore, the timing of the effect of U.S. versus EU policies could vary because of
13
differences in their administrative structures, the likelihood that preliminary measures are imposed
earlier on in the investigation, etc. In this specification, we find that at one lag, an increase in the U.S.
duty against China (or India) is associated with a reduction in the growth rate of Chinese (or Indian)
exports to third countries relative to the growth rate of Indian (or Chinese) exports. We interpret this
as evidence of a potential chilling effect of the U.S. policy on Chinese exports to alternative markets.
In terms of the magnitude of the estimates reported in specification (2), a 1% increase in the duty
against China is associated with the difference in the mean export growth rates between China and
India narrowing by 0.302 percentage points. In our sample, mean growth for Chinese exports over this
period was 16.2% while mean growth for Indian exports was 11.9%. Thus, raising the duty against
China by 1% is associated with a decline in the differential of the average growth rate of exports
between the two countries from roughly 4.3% (=16.2% - 11.9%) to 4.0%. If the U.S. were to apply
the conditional mean duty against China in the sample (125%), this would imply a 20 percentage
point reduction in Chinese export growth relative to Indian export growth of the same product.
Proceding across specifications, in column (3) we redefine the dependent variable to be the differ-
ence in the growth rates of the value of exports and find that our estimates are robust. A 1% increase
in a U.S. AD duty against one country leads that country’s export growth to be 0.3 percentage points
lower in the year after initiation of the AD investigation that resulted in a duty. In column (4), we
replace the Davis and Haltiwanger definition for the growth rate of exports (used in construction of
the dependent variable) with the standard log growth rate measure. This measure, by construction,
omits all observations in which China or India enters or exits a particular country’s import market
in a given year. We find that the estimate of chilling associated with a U.S. AD duty at a lag of one
year is again robust, suggesting our results are not sensitive to allowing for entry and exit.
Turning to column (5) of table 8, we redefine our dependent variable to be the difference in the
growth rate of China’s and India’s aggregate exports (to 38 markets) for each particular product,
and we estimate equation (2′). Specifically, we aggregate the total value of exports of each 6-digit
HS product (less exports to the U.S., EU and India or China) in each year for China and India and
then calculate the Davis and Haltiwanger growth rate for each product aggregated across destination
markets in each year. Relative to our other specifications in which each observation of product-level
export growth to each market i carries equal weight, the aggregated growth specification is less likely
to be influenced by outlier observations of very high or low growth coming from modest changes in
trade volumes when the level of trade is low. Notably, the mean (and standard deviation) of growth
aggregated across products for China and India are 9.3% (0.76) and 11.2% (1.15) respectively, which
are considerably lower than the mean (and standard deviation) of export growth for China and India
of 17.9% (1.27) and 11.9% (1.54), respectively, from our estimation sample for specification (3). In
14
the aggregated growth specification we find a slightly stonger chilling effect; a 1 percent increase in
the U.S. AD duty against China or India is associated with a growth rate for the targeted country
that is 0.41 percentage points lower than the non-targeted country in the year following initiation of
an investigation that resulted in a duty.
Column (6) presents our final specification which is the effect of U.S. and EU antidumping duties
on a subsample of steel products (HS chapters 72 and 73). Because the steel industry is an active user
of antidumping trade restrictions, we might be concerned that the estimated effects are driven entirely
by steel products. Nevertheless, our restricted steel sample indicates no statistically significant effect
of U.S. antidumping duties, but there is evidence of a chilling effect associated with EU antidumping
measures in the year after the AD investigation is initiated. For this subsample of products, the
magnitude of the chilling effect of an EU antidumping duty is slightly larger - a 1 percent increase in
the duty against one country is associated with the growth rate for the targeted country being 0.93
percentage points lower than that of the non-targeted country.
Thus, while there is no evidence of trade deflection, there is some evidence that U.S. and EU
antidumping measures are associated with these targeted Chinese and Indian products slowing down
their export growth to secondary markets. One explanation for the “chilling effect” result could be
that it is self-imposed - i.e., that Chinese or Indian exporters recognize through the U.S. and EU
policy that these products are in politically sensitive product categories. Therefore, in the hope
that they might avoid such import restrictions in secondary markets as well, the exporters take it
upon themselves to curtail their export growth. Nevertheless, this is only one interpretation, as we
cannot rule out the possibility that this chilling effect is the result of the secondary market imposing
its own import restrictions. We would only be able to address this distinction by having access to
data that would fully control for any product-level changes in trade policy on Chinese imports into
these other (i.e., non-U.S., non-EU) markets, a difficult endeavor given the lack of data reporting
requirements vis-a-vis China during the pre-WTO accession period of the sample, as we described in
the introduction. We do note, however, that alternative markets such as Japan and South Korea that
did report use of antidumping to the WTO during this time period targeted China with AD actions
in products that were different from those targeted by the U.S. and EU.
4.2 Difference-in-difference estimates of trade depression
While there is evidence of a “chilling” effect of U.S. and EU antidumping policies on Chinese exports
to third markets, is there evidence that when the U.S. and EU impose such policies on third countries
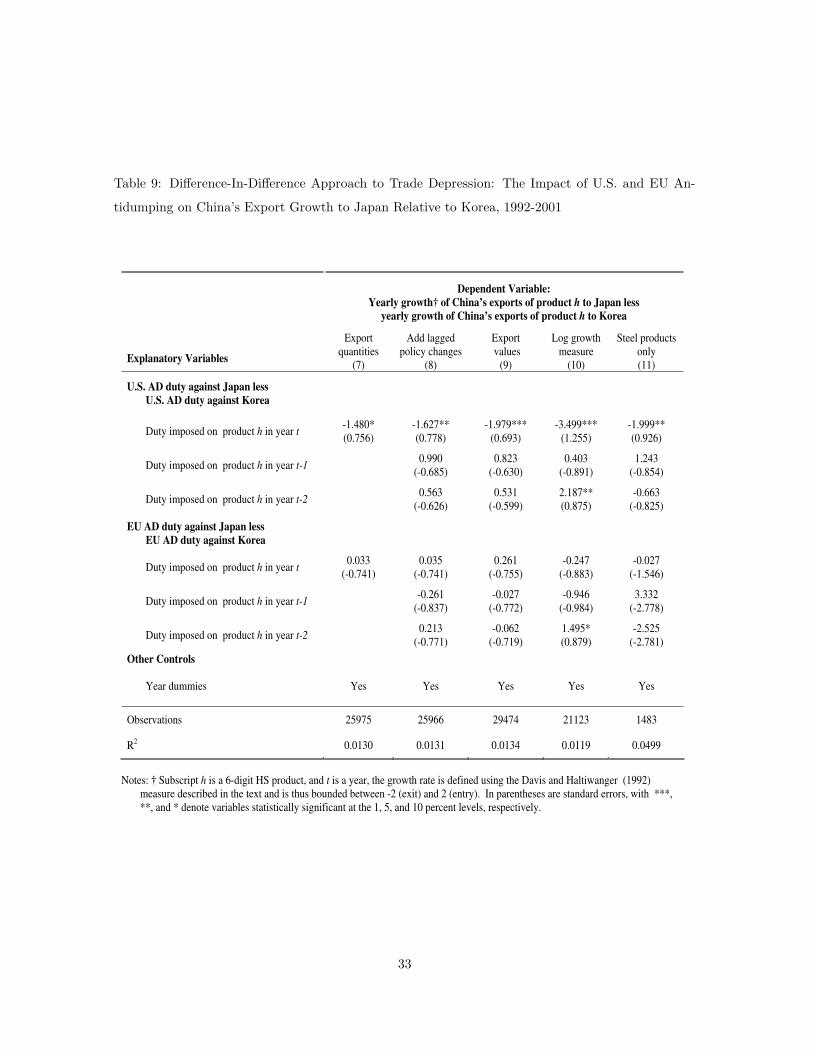
that there is also a trade depressing effect on Chinese exports? Table 9 presents our results on trade
15
depression for Chinese exports to Japan and Korea in the face of those two countries being hit with
U.S. and EU antidumping. We find strong evidence that the imposition of U.S. antidumping duties
against Japan and Korea is associated with a large, economically and statistically significant decline
in Chinese exports to Japan and Korea.
Beginning with column (7), our baseline specification uses the difference in the growth of the
volume of Chinese exports to Japan and Korea as the dependent variable. We find that a 1% increase
in the U.S. AD duty against Japan or Korea is associated with the growth of Chinese exports to the
targeted country being roughly 1.5 percentage points lower than growth to the non-targeted country.
In contrast we find no evidence of depression associated with EU AD duties. This economically large
depression effect of U.S. antidumping is robust across specifications using the different dependent
variable. Column (8) presents a similar result when we add lags of the change in the duty. Column
(9) reports a somewhat larger effect when we redefine the dependent variable to be the difference
in the value of export growth. In column (10) we use a log growth measure in order to eliminate
observations on entry and exit. The contemporaneous effect of the depression result still exists, though
it is moderated by relative export growth two years later. Lastly, column (11) restricts our sample
steel products and finds that the magnitude of the coefficient is roughly equal to the coefficient in
the sample of all products, suggesting that the effect in steel products is similar to that in non-steel
products.
We estimate, but do not report, some additional specifications to help us understand and interpret
the magnitude of our depression result. First, we observe that entry and, especially, exit by Chinese
exporters from specific markets do not drive our results. To check our results from the log growth
measure specification (10), we re-estimate specification (9) but drop all observations of Chinese export
growth to Japan or Korea that have a value of +/- 2 (indicating entry and exit). For this specification,
our estimate of the effect of the difference in a change in the U.S. duty on product h in year t increases
slightly in absolute value relative to specification (9) to -2.02 (standard error=.818) from -1.98.
Second, we observe that depression is primarily driven by U.S. AD activity against Japan. A few
statistics bring this into view. In our sample of 29474 observations, we have only 16 antidumping
duties imposed by the U.S. against Korea, but 42 imposed against Japan.17 Moreover, when we
look at the mean growth rates of Chinese exports to Korea and Japan conditional upon a U.S.
antidumping duty, we find that Chinese exports to Korea are higher while Chinese exports to Japan
are substantially lower.
17To clarify, although the U.S. imposed antidumping measures on roughly 95 (120) different 6-digit HS export
products from Korea (Japan) during this time period, Korea (Japan) only imported 16 (42) of these same products
from China.
16
Third, we have performed a number of industry-specific regressions which indicate that depression
is driven by a variety of products for which Japan faced antidumping duties over a number of years.
Fourth, because two products, ferro-silicon/silico-manganese (HS=720230) and temporary lighters
(HS=961310) were subject to antidumping investigations in different years by Japan, Korea, the U.S.
and EU, we re-estimated all of our depression specifications in the absence of observations on these
products. Our estimates were identical to those reported in table 4 to one decimal place.18
Lastly, to better understand the magnitude of our depression coefficient, we calculate the mean
change in the level of the value of Chinese exports to Japan, conditional on a U.S. AD duty being
imposed. We find that Chinese exports to Japan fall by about U.S.$1 million when the U.S. imposes
an AD duty on its imports from Japan. In our dataset, aggregate Chinese exports to Japan rise from
roughly U.S.$15 billion in 1993 to U.S.$44 billion in 2001. Thus, our estimate of depression, while
large and economically significant in the markets for some products, is small relative to the total
value of Japanese imports from China.
5 Robustness: IV estimates of trade deflection and trade de-
pression
5.1 Panel data regression model
Given that our estimates of equations (2) and (3) could be sensitive to the choice of countries d (India),
i (Japan), and k (Korea), we present a final check on the robustness of our results by examining an
alternative model that relies more on cross-sectional variation across 6-digit products and countries to
obtain identification. This has some similarities to the approach taken in Bown and Crowley (2007).19
In this alternative approach, we start with the time difference of (1):
18Japan reported initiating an AD investigation on imports of ferro-silicon (HS=720230) from China in 1991. The
U.S. imposed an antidumping restriction on the same 6-digit product in 1993, the EU in 1996 and Korea in 1997. The
EU restricted imports of temporary lighters (HS=961310) from China in 1990 and Korea restricted imports of the same
product in 1997.19Bown and Crowley (2007) estimate trade deflection and trade depression associated with U.S. antidumping against
Japanese exports in a panel data model in which Japanese industry-level covariates proxy for technology and cost
shocks. The analysis above, in contrast, uses the difference-in-difference equation (2) that does not require product-
level controls to estimate trade deflection. This is useful because comparably disaggregated data to proxy for technology
and costs shocks is not available for China during the sample. Nevertheless, as a robustness check to the panel data
model in Bown and Crowley (2007), they also estimated the Japanese sample on a similar model with product-level
where we assume that country i’s trade policy toward China is constant over the time period under
investigation. Then, we use 6-digit product fixed effects and lagged export growth to proxy for
time-varying cost or productivity shocks at the product level. Our estimating equation is then:
∆xciht = ah + ∆act + ∆ait +
t∑
j=t−2
β′
1j∆τUSc,ushj +
t∑
j=t−2
β′
2j∆τEUc,euhj
+
t∑
j=t−2
β′
3j∆τUSi,ushj +
t∑
j=t−2
β′
4j∆τEUi,euhj + β′
5∆xciht−1 + ∆ǫciht,
(5)
where in estimating we apply the instumental variables techniques of Anderson and Hsiao (1981,
1982) because the autocorrelation of the dependent variable implies that least squares estimation
yields biased estimates.20 In the estimation, we instrument for the lagged growth rate, ∆xciht−1,
with the second lag of the log level of exports, ln(xciht−2) if xciht−2 > 1 and a value of zero if the
second lag of the level of exports is less than 1.21
By utilizing 6-digit HS product fixed effects in (5) we control for changes in production costs or
technology that imply that a particular good h will have a growth rate for exports that is higher
or lower than average. Note that commodities with very high average growth rates also tend to be
those most likely to be targeted for antidumping measures. As in equations (2) and (3) we use year
dummies to control for all aggregate variation in China and country i over time.
For estimating equation (5), we calculate annual export growth of China’s exports to 38 different
countries i listed in table 1, excluding the U.S., EU and India.
20An alternative approach such as the Arellano and Bond (1991) GMM estimator which utilizes multiple lags of
the level of the dependent variable as an instrument for the lagged growth rate is not computationally feasible in our
estimation because of the large number of parameters in (5).21Because the bias associated with using a weak instrument may be large, we test the quality of our instrument.
First-stage restricted and unrestricted regressions are reported in table A-1 for our baseline specification. For all
specifications, the F-statistics of roughly 312,000 are far larger than the 99% critical χ2(1) of 6.63. We conclude that
the second lag of the log level of exports is a strong instrument for the lagged growth rate.
18
5.2 Instrumental variables estimates of trade deflection and trade depres-
sion
Table 10 presents our estimates of trade deflection and trade depression from a panel of Chinese
exports to 38 countries. Our finding of a chilling effect of U.S. AD duties from the difference-in-
difference equation (2) discussed in section 4.1 appears to be robust across models. Although we
find no evidence of chilling in specification (12) which regresses the growth of the volume of Chinese
trade on only the contemporaneous initiation of AD cases that resulted in changes in U.S. and EU
AD duties, when we include two lags of each change in a duty in specification (13), we find that a 1%
increase in the U.S. AD duty against Chinese exports is associated with a 0.127% reduction in the
growth of exports in the following year. For the conditional mean U.S. antidumping duty on China’s
exports in the sample of 125%, this implies a 15.9 percentage point fall in the growth of Chinese
exports to an alternative market. When we redefine the dependent variable to be the value of exports
(14), we estimate a chilling effect that is similar in magnitude but which is not statistically significant
at standard confidence levels. Part of the explanation for this result is the additional observations
added to the sample when we switch to values from volumes, as the COMTRADE data reports many
observations for Chinese export values that do not include a volume counterpart.
In specification (15), we redefine the dependent variable to be the log growth of the value of exports,
and in (16) we redefine it to be the Davis-Haltiwanger growth of the value of exports aggregated across
the 38 markets in our sample. Both specifications also yield chilling estimates at one lag, a 1% duty
implies roughly a 0.10 and 0.15% reduction in export growth, respectively. The last specification,
(17), restricts the sample to steel exports and finds evidence consistent with our difference-in-difference
estimates of table 8, i.e., there is no statistically significant evidence of deflection or chilling associated
with U.S. imposition of antidumping on Chinese steel.
The next set of estimates in table 10 suggest evidence of a contemporaneous chilling effect of an
EU antidumping duty against imports from China on Chinese exports to third countries. This differs
slightly from our difference-in-difference estimates presented in table 8 which found no statistically
significant relationship between EU antidumping and Chinese exports to third countries. Across the
6 specifications in table 10, estimates of the magnitude of the effect range from a low of a 0.17% fall
in the growth of the value of Chinese exports to a high of a 0.52% fall in the value of Chinese exports
of steel products when the EU increases its duty by 1%. For the regression on steel products (column
17), although the timing is slightly different, the relative size of the result vis-a-vis the estimate on
the full sample of products is in line with the estimates from our difference-in-difference model.
In order to understand the differences between the results of our difference-in-difference model
19
and our IV panel model, we can also examine the sources of variation in the data that identify the
deflection/chilling effect for EU AD duties. In the difference-in-difference model of trade deflection,
identification comes from variation between Chinese and Indian growth rates within a product. How-
ever, EU antidumping measures are highly correlated across China and India, especially for steel. The
correlation between EU antidumping measures for China and India is 0.31 in our sample compared
to only 0.26 for the U.S. Moreover, the correlation for EU measures is higher (0.66) when we limit
our sample to steel products compared to a correlation of 0.47 for the U.S. Thus, identification of
the effect of EU AD duties is relatively weak in the difference-in-difference model. However, there is
some evidence of chilling in the IV panel estimates because identification in that model comes from
(a) time variation in the growth rate within a product exported by China and (b) cross sectional
variation across products exported by China.
Next consider the third panel of table 10 which presents our estimates of trade depression associ-
ated with U.S. AD duties against China. In contrast to our results from the difference-in-difference
model, there is no robust evidence of trade depression associated with U.S. AD duties from our
IV estimates on a panel of 38 of China’s trading partners. While the estimated coefficient on the
contemporaneous effect is frequently negative, it is not statistically significant.
The lowest panel of estimates in table 10 presents coefficient estimates of potential trade depres-
sion arising from EU AD duties. As with the U.S. estimates, there is no robust evidence of trade
depression associated with EU antidumping duties. For two specifications, the logged growth measure
(column 15) and steel products (column 17), there is one statistically significant coefficient estimate
that indicates trade depression. However, as these results are not robust to slight changes in the
specification.
A simple explanation for the lack of trade depression in the IV panel model can be found by
re-estimating the specification in column (13) on a restricted sample of Chinese exports to Japan
and Korea only. In this smaller sample we do observe contemporaneous trade depression, consistent
with our difference-in-difference estimates reported in table 9. This suggests that Japan and Korea
are unusual among China’s export partners and that the phenonomenon of trade depression is likely
limited to the few countries that face very high antidumping duties emanating from the U.S. and EU.
5.3 Puzzles and Potential Explanations
A number of potentially complementary explanations are consistent with our results that Chinese
exporters did not deflect trade during the 1992-2001 period. First, it could be that the Chinese
products hit with U.S. and EU antidumping measures are primarily the function of export platform
20
activity that can easily be disassembled and relocated to another country. It could also be that some
of the products are highly differentiated with specifications designed (by U.S. or EU retailers) for
one particular export market. Or it could be that these other WTO members were applying higher
(non-MFN) tariffs against China during its pre-accession period that China was not able to penetrate.
Finally, it could relate to the fact that as a “new” entrant into the global economy, Chinese firms did
not yet have the networks over the 1992-2001 period to deflect trade to alternate markets, perhaps
not yet having paid the market-specific fixed cost of entry.
Regardless of the explanation, our result of “missing” trade deflection is puzzling given that
there was such concern about the phenomenon among the WTO membership that China’s terms of
accession include a safeguard to pre-emptively control it.
6 Conclusion
China’s accession to the World Trade Organization (WTO) introduced a new China safeguard that
allowed existing members to substantially deviate from the WTO’s core principles of reciprocity and
most-favored-nation (MFN) treatment based on the threat of trade deflection. This paper uses a
new data set to construct measures of product-level, discriminatory trade policy actions that two of
China’s most important trading partners imposed on its exports during the 1992-2001 period. We
find no systematic evidence that either U.S. or EU imposition of discriminatory import restrictions
during this period deflected Chinese exports to alternative destinations. To the contrary, we provide
some evidence that EU and U.S. trade restrictions may have a chilling effect on China’s exports to
secondary markets - i.e., the application of the mean U.S. duty is associated with a 20 percentage
point reduction in the relative growth of targeted Chinese (vis-a-vis untargeted Indian) exports of
the same product.
Our results do raise a number of policy concerns. One derives from a comparison of the results
in this paper and the empirical evidence of trade deflection from studies of developed countries (e.g.,
Bown and Crowley, 2007). Developing country exporters may face an additional cost to antidumping
if they are unable to deflect trade and recoup some of their losses.22 This could suggest that the
failure to reform antidumping in the Doha Round is even more detrimental to developing countries
than had previously been considered.
The lack of historical evidence of Chinese trade deflection presents a potential additional con-
22For example, we found China did not deflect steel exports whereas Japan did deflect steel exports in the face of
U.S. antidumping measures. Thus, the lack of trade deflection by developing countries is not simply a product-level
phenomenon determined solely by the differences in the countries’ export baskets.
21
cern raised by the terms of China’s WTO accession. Given the theoretical insights of Bagwell and
Staiger (2002) regarding the importance of the reciprocity and MFN rules to the sustainability of the
efficiency-enhancing features of the WTO, the easy-to-access, new China safeguard remains a threat
to the WTO. The China safeguard policy itself may pose a bigger threat to the world trading system
than the trade deflection it was partially designed to control.
22
References
[1] Anderson, T.W. and Hsiao, Cheng. 1981. “Estimation of Dynamic Models with Error
Components.” Journal of the American Statistical Association, 76: 598-606.
[2] Anderson, T.W. and Hsiao, Cheng. 1982. “Formulation and Estimation of Dynamic Models
Using Panel Data.” Journal of Econometrics, 18: 47-82.
[3] Arellano, Manuel and Bond, Stephen. 1991. “Some Tests of Specification for Panel Data:
Monte Carlo Evidence and an Application to Employment Equations.” Review of Economic
Studies, 58: 277-297.
[4] Antkiewicz, Agata and Whalley, John. 2005. “China’s New Regional Trade Agreements.”
The World Economy, 28(10): 1539-1557.
[5] Bagwell, Kyle and Staiger, Robert W. 1999. “An Economic Theory of GATT.” American
Economic Review, 89: 215-248.
[6] Bagwell, Kyle and Staiger, Robert W. 2002. The Economics of the World Trading System.
Cambridge, MA: MIT Press.
[7] Bagwell, Kyle and Staiger, Robert W. 2004. “Backward Stealing and Forward Manipulation
in the WTO.” NBER Working Paper No. 10420, April.
[8] Bagwell, Kyle and Staiger, Robert W. 2005. “Multilateral Trade Negotiations, Bilateral
Opportunism and the Rules of GATT/WTO.” Journal of International Economics, 67(2): 268-
294.
[9] Bown, Chad P. 2005. “Global Antidumping Database, Version 1.0.” World Bank Policy Re-
search Paper No. 3737, October.
[10] Bown, Chad P. 2007. “China’s WTO Entry: Antidumping, Safeguards, and Dispute Settle-
ment.” NBER Working Paper #13349, August.
[11] Bown, Chad P. and Crowley, Meredith A. 2007. “Trade Deflection and Trade Depression.”
Journal of International Economics, 72(1): 176-201.
[12] Bown, Chad P.; Crowley, Meredith A.; McCulloch, Rachel; and Nakajima, Daisuke.
2005. “The U.S. Trade Deficit: Made in China?” Economic Perspectives, 29 (4th Quarter): 2-18.
23
[13] Bown, Chad P. and McCulloch, Rachel. 2007. “U.S. Trade Policy toward China: Discrim-
ination and its Implications.” in Sumner La Croix and Peter A. Petri (eds.) Challenges to the
Global Trading System: Adjustment to Globalization in the Asia Pacific Region. Oxford, UK:
Notes: † Subscript h is a 6-digit HS product, and t is a year, the growth rate is defined using the Davis and Haltiwanger (1992) measure described in the text
and is thus bounded between -2 (exit) and 2 (entry). In parentheses are White’s heteroskedasticity-consistent standard errors corrected for clusters defined on
the variable defined as the 6-digit HS product and year combination. ***, **, and * denote variables statistically significant at the 1, 5, and 10 percent levels,
respectively.
34
Table A-1: Testing Instrument Quality: First Stage Regressions
Dependent Variable: Yearly growth† of China’s exports of
product h to country i in t-1
Explanatory Variables Unrestricted first stage regression
(13)
Restricted first stage regression
(13)
U.S. AD duty against China
Duty imposed on product h in year t0.049
(0.039)
0.088
(0.065)
Duty imposed on product h in year t-10.022
(0.050)
0.006
(0.071)
Duty imposed on product h in year t-2-0.113***
(0.038)
-0.174***
(0.058)
EU AD duty against China
Duty imposed on product h in year t0.009
(0.085)
0.005
(0.114)
Duty imposed on product h in year t-1-0.131*
(0.077)
-0.181**
(0.090)
Duty imposed on product h in year t-2-0.005
(0.068)
-0.005
(0.088)
U.S. AD duty against country i
Duty imposed on product h in year t0.243
(0.361)
-0.548
(0.509)
Duty imposed on product h in year t-10.379
(0.315)
0.184
(0.442)
Duty imposed on product h in year t-20.685**
(0.291)
0.672*
(0.355)
EU AD duty against country i
Duty imposed on product h in year t0.376
(0.297)
0.265
(0.313)
Duty imposed on product h in year t-10.433
(0.287)
0.152
(0.309)
Duty imposed on product h in year t-2-0.305
(0.275)
-0.672*
(0.398)
Other Controls
Second lag of the log level of China’s exports of h to country i-0.131***
(0.000)--
Product h fixed effects Yes Yes
Year fixed effects Yes Yes
Observations 534768 534768
R2 0.39 0.03
Notes: † Subscript h is a 6-digit HS product, and t is a year, the growth rate is defined using the Davis and Haltiwanger (1992) measure described in the
text and is thus bounded between -2 (exit) and 2 (entry). In parentheses are White’s heteroskedasticity-consistent standard errors corrected for clusters
defined on the variable defined as the 6-digit HS product and year combination. ***, **, and * denote variables statistically significant at the 1, 5, and