CHINA’S STRUCTURAL DEMAND AND THE COMMODITY SUPER CYCLE; IMPLICATIONS FOR AFRICA. Abstract: Since the Second World War, commodity prices have experienced three major price booms, in 1951-53, then again in 1973-75 and finally in 2003-08. In 2003-08, it was China’s resource intensive growth that substantially increased demand. The steady rise in prices for most of the 2000s has been termed as a Super Cycle, fuelled by China’s domestic infrastructure and manufacturing growth. As China looked for supply security to fuel its growth, its resource driven engagement with Africa steadily increased. By 2008 China was one of the largest trade partners and investors in the continent. In the second half of 2008, as the financial crisis spread across the Advanced Economies, global recession set in and the commodity boom came to an end. With the 2008 global financial crisis, global commodity demand has fallen and so have commodity prices. This has strong implications for China’s resource driven engagement with Africa in the medium to long term. This paper examines the Commodity Boom of 2003-08, looking at the supply and demand factors behind the price rise. The 2003-08 period is contrasted with the previous two commodity booms in 1951-53 and 1973-75 in order to learn if the latest boom was unique in any manner. We then look at the nature of China’s structural demand and its future needs. Finally we highlight the implications of the commodity price fall for African countries, in relation to Chinese demand in the near future. Masuma Farooki Development Policy and Practice, The Open University. Milton Keynes [email protected]February 2009 Paper prepared for Research Workshop China – Africa Development Relations Leeds University (UK) 1
Transcript
CHINA’S STRUCTURAL DEMAND AND THE COMMODITY SUPER CYCLE; IMPLICATIONS FOR AFRICA.
Abstract: Since the Second World War, commodity prices have experienced three major price booms, in 1951-53, then again in 1973-75 and finally in 2003-08. In 2003-08, it was China’s resource intensive growth that substantially increased demand. The steady rise in prices for most of the 2000s has been termed as a Super Cycle, fuelled by China’s domestic infrastructure and manufacturing growth. As China looked for supply security to fuel its growth, its resource driven engagement with Africa steadily increased. By 2008 China was one of the largest trade partners and investors in the continent.
In the second half of 2008, as the financial crisis spread across the Advanced Economies, global recession set in and the commodity boom came to an end. With the 2008 global financial crisis, global commodity demand has fallen and so have commodity prices. This has strong implications for China’s resource driven engagement with Africa in the medium to long term.
This paper examines the Commodity Boom of 2003-08, looking at the supply and demand factors behind the price rise. The 2003-08 period is contrasted with the previous two commodity booms in 1951-53 and 1973-75 in order to learn if the latest boom was unique in any manner. We then look at the nature of China’s structural demand and its future needs. Finally we highlight the implications of the commodity price fall for African countries, in relation to Chinese demand in the near future.
The demand for natural resources is linked to the various stages of economic development. As an economy moves from an agricultural base towards industrialisation, the call for raw materials as inputs into manufacturing, construction and infrastructure make greater demands on energy and industrial raw material commodities. The structure of an economy; the contribution from the services and manufacturing sector, has a large part in determining the strength of the relationship between growth and demand. For example, a stronger contribution to GDP from the industrial sector will generate higher demand for commodities than a GDP generated mainly by services or oil revenues. The industrial sector comprises both infrastructure and the manufacturing sector and therefore requires higher levels of commodity inputs as compared to that generated by services such as banking and insurance. In general, rising income levels are accompanied by rising investments in infrastructure, residential housing as well as transport networks and links. This in turn generates demand for commodities.
Countries that have natural resources can benefit from accessing their raw materials domestically, or increase revenues by trading with countries in need of these resources. In a growingly integrated world, emerging economies unable to meet their demand from domestic sources are increasingly turning towards international markets to source raw materials for their growth. As the demand and supply of commodities becomes increasingly global, the factors affecting the price of these goods are also increasingly international.
Commodity prices react to both international demand and supply and a price increase is likely to result when markets are facing supply constrains in face of rising demand. There have been three commodity price booms since the Second World War, the first in 1951-53, the second in 1973-75 and the latest in 2003-08. Each period has seen a sustained increase in the international prices of hard and soft commodities generated by demand and supply fundamentals in the global economy.
The 2003 price rise in commodities brought new opportunities for investment in resource rich countries, including those in Africa. China, the largest expanding economy in this period in particular was seeking raw materials to fuel its domestic infrastructure and manufacturing growth. In mid 2008 the financial centres in the developed economies slowly began to unravel, as banks and investment institutions collapsed from poor risk management in their portfolios. Government bailouts and crashing stock markets took their toll and a majority of the OECD economies were officially in recession by the start of 2009. Commodity prices have now fallen from their peaks in early 2008, by almost two third of their value. The financial crisis in the western economies has brought about the start of a global recession and the slowest growth in Chinese GDP for over a decade.
With the economic slow down in the OECD and emerging economies demand for commodities has also slowed. Although China is still expected to achieve positive growth rates in the near future, other western economies are not. With the prospect of lower commodity demand from these countries, what expectations can we have for commodity prices? How will the behaviour of these prices effect the resource material driven engagement between China with Africa?
In order to answer these questions, we first examine the three post World War II Commodity Booms in 1951-53, 1973-75 and 2003-08, looking at the supply and demand factors behind the price rise. We then contrast the 2003-08 with the previous two commodity price booms in order to assess whether the latest boom was unique in any manner. In Section 2, we examine the largest driver of commodity demand, China and the structural nature of this demand. In Section 3 we turn towards the resource driven trade and investment from China towards Africa and the long term
2
nature of this engagement. Finally in Section 4, we consider the drivers of commodity price change and implications for the near future.
SECTION 1: COMMODITY PRICE BEHAVIOUR AND THE COMMODITY BOOM.
The study of Commodity prices has a lot to offer in terms of the dynamics within the price movement itself and in trying to explain the variables that drive its behaviour. There are many generalised facts that we know about commodity prices; they tend to fluctuate widely in the short term (Radetzki 2006), they usually move together (Pindyck and Rotemberg, 1990), periods of low prices will be interrupted by sharp peaks (Deaton and Laroque; 1992) and that price cycles tend to asymmetrical with price booms being shorter than price slumps. (Cashin, McDermott and Scott 1999)
Price fluctuations in the short period are present for both soft and hard commodities. ‘Rapid, unexpected and often large movements in commodity prices are an important feature of their behaviour’. (Cashin and McDermott: 2002). For example, daily Copper prices in 2007 on averaged were at $7117/ton, but fluctuated as high as $8007/ton and as low as $5669/ton in the same year.
Different commodity prices also tend to exhibit ‘co-movement’ i.e. ‘where the commonality in prices reflects the tendency of commodity markets to respond to common business cycle and trend factors’. (Labys, Achouch and Terraza (1999:229). This co-movement in many unrelated commodities is explained by Pindyck and Rotemberg, (1990) to be linked to firstly the spill over of supply or demand shocks from one commodity to the other. Secondly, macroeconomic shocks such as interest rates or income levels that will impact all prices and finally the role of speculators reacting to information in one commodity spilling over as reactions for another commodity. Labys et.al. (1999) further identify the level of Industrial Production in advanced economies, to be strongly correlated to the co-movement of commodity prices.
In examining the behaviour of prices within a cycle, i.e. slump and boom, Cashin, McDermott and Scott (1999) reach four main conclusions. Firstly that in term of time duration, prices tend to experience longer slumps than booms. Secondly the fall they experience in a slump is larger as compared to the rise in the consequent boom causing cycles to be asymmetrical in shape. Finally the time that it takes to recover/fall from the slump/boom is independent of the duration of the slump/boom itself.
The examination of price cycles, volatility and trends is dependent on the time lens that we use to study such behaviour. Daily price movements can be fairly volatile, but stable within a range when studied over months. When looked at in years they may exhibit cyclical behaviour, and may have different trend behaviour when studied over decades. Therefore when examining commodity price behaviour it is important to outline the time horizon in which that behaviour is being studied.
A Price Cycle is a short to medium term phenomena, and is defined by the NBER as a trough to trough measurement. Thus ‘A cycle consists of an expansion phase from trough to peak plus a contraction phase from peak to trough’. (Labys, Kouassi and Terraza 2000:331). In a trough to trough measurement every change in direction does not necessarily represent a cycle in itself, and a turning point cannot be established until a fixed number of observations after the fact.
The duration of a cycle is the time measurement between one trough and the next. Each commodity differs on the duration of its cycle as well the number of cycles experienced. For example, between 1960 and 1993 coffee experienced 16 price cycles with 134 month maximum and 6 month
3
minimum duration. Copper experienced 24 cycles, with a maximum duration of 46 months and a minimum duration of 6 months.1
Fluctuations within a price cycle are based on the frequency and magnitude of price changes over weeks or months. An increase in either frequency or magnitude, or both, will lead to higher volatility in commodity prices. Slade (1991) has argued that price volatility in commodities has increased over the years as pricing mechanism moved from being set by producers pricing regimes to terminal markets such as the LME.
Cashin and McDermott (2002) believe that the duration of price cycles is becoming shorter in recent years. In examining data from 1862-1999, they conclude that commodity price variability over time has increased, with volatility first rising around 1899 and then again in the early 1970s. They conclude (2002:196); ‘… although the rise in volatility in the early 1900s was due to greater amplitude of price movement, the further rise in volatility in the early 1970s was due to the increased frequency of large price moments.’ This would indicate large price cycles of shorter durations.
A Commodity Price Boom occurs within a price cycle, when the increase in prices or the peak of the cycle is much higher than peaks reached in previous cycles. Since World War II we have experienced three periods where commodity prices have been persistently high over a medium time period. These periods are referred to as a Commodity Boom although as yet there is no precise definition of a commodity boom. The Commodity Boom therefore can be simply defined as a concurrent rise in all commodity prices, which is higher than previous price peaks.
A Super-Cycle is a medium to long term phenomena, and is defined as ‘… a prolonged (decade or more) trend rise in real commodity prices driven by urbanisation and industrialisation of a major economy’ (Heap:2; 2005). Super cycles are demand driven and have been identified previously in the 1800’s with the growth in the US, and then in the 1947 to 1975 period driven by demand from reconstruction in Europe. Although commodity prices rise in a trend in a super cycle, Heap (2005) argues that this does not prevent the occurring of business cycles within that trend. A super cycle recedes when the drivers of demand moves out of a phase of materials intensive development as it matures.
The Structural Break is a long term phenomena and follows a price trend that is observed over decades. A structural break occurs when the relationship between two variables changes. For example in commodities a structural break reflects a relative change in the prices of commodities to manufactures. The last structural break for commodity prices was during the industrial revolution, where prices of commodities relative to those of manufactures began to fall.
Figure 3.1 shows the UNCTAD Monthly all commodities price index from 1960 to 2008. As the figure shows, a price cycle can be measured from a peak to peak or trough to trough period. There are fluctuations within a cycle and not every turn in price movement qualifies as a cycle. A price boom is a peak within a cycle where prices rise above their previous highs. In this figure there are two price booms, one in 1973-75 period and the other in 2003-08. Finally the figure also shows a trend rise in prices over 2003-08 which we refer to as a super cycle.
1 Labys (2000:333)
4
Figure 3.1 All Commodity Price Monthly Index Movements 1960-2008 (2000=100)
Source: UNCTAD All Commodity Price Index
There have been three major commodity price booms since World War II. The first of these was in 1951-53 and the second in 1972-75. The latest commodity boom started in 2003 and ended in mid 2008.
1.1 The First Commodity Price Boom; 1951-53
The first post World War II boom in commodity prices occurred over 1951-1953. Commodity prices peaked in the 1st quarter of 1951, and were 45% above their 1949 values. However the boom rapidly lost momentum, with prices only rising by 16% over their 1949 values in the 2nd quarter of 1952 (figure 1.1).The rise in prices was not spread equally across all commodities. Agricultural prices rose more than metals and peaked in early 1951. Metal prices peaked in mid 1952, but the increase was lower than those experienced by agricultural commodities. Energy prices remained stable around their 1949 values.
Figure 1.1: Quarterly Index of Commodity Prices in Nominal US $. (1949-52) (1949=100)
0
50
100
150
200
250
1949 1950 1951 19520
50
100
150
200
250
Agricultural raw materials Metals Energy All
Source: Radetzki (2006)
5
Demand: The 1950 price boom appeared at the end of an economic recession as the global economy experienced a recovery. As industrial production began to pick up pace, demand for industrial raw materials increased. The IP index for industrial countries rose from 16, to 21 over 1949-19532. However expectations of widespread shortages, spurned by memories of the Great Depression led to an increase in consumer purchases and hoarding. Only when it was clear that the ‘shelves were not going to be empty’ did this demand decrease.
The second impetus underlying commodity demand in the early the 1950s was a result of the Korean War. As the United States went on to a war footing, increased industrial production increased the demand for commodities. Lewis (1955) reports that US national security spending doubled over two years (1951-53) to $ 26 billion. Non-defence spending increased by $6 billion. Within the private sector fixed capital expenditure rose by $ 3.5 billion over their $35 billion value in 1951. In total real output expanded by $17 billion p.a. over the 1951-53 period3. This level of economic expansion would increase the demand for commodities as inputs into the manufacturing sector. The metals sector saw the second highest increase in prices in this boom and can be linked to the increased spending within the US reflecting the strong demand for metals.
However, even with expanding output the fear of shortages was high, forcing manufactures to accumulate inventories. The producers feared supply disruptions if the Korean war were to spread and therefore increased their demand for commodities to build inventories. This resulted in the demand increase to be focused in industrial raw materials and metals. As it become clear that the Korean war would not spread to other regions, and industrial production would not be harmed, demand for commodities began to cool down.
Supply: The importance of the Asian region as suppliers of industrial raw material, coupled with memories of supply shortages in the previous era was enough to spurn stockpiling. The push for increased inventories was responsible for short term supply constraints rather than fundamental constrictions in the supply side. Threats to the security of supply with the Korean War in a major production area of industrial raw material, led to increasing pressure to build inventories, and prices in this sector responded by rising quickly.
Industrial consumers increased their personal inventories in 1950, for example in the US, in 1951 manufacturing and trade inventories were above their June 1950 level by $ 15 billion. As it became clear that the Korean war was not going to spread to other regions, and industrial production was not being affected, inventories were brought down. In the US, the last two quarters of 1951 and the first two quarters of 1952 saw a drop in investment in inventories by $ 16.4 billion.4 As supplies were also released from government strategic stockpiles, demand pressures eased and the markets were in balance again.
The two sectors, energy and food, where supply security was not perceived and therefore stockpiling was not an issue did not experience the same level of price increase as industrial raw material. The major consumers of agricultural products and energy were in general self-sufficient at this period of time, and so a major import demand did not originate in the global economy. The United States was an oil exporter at this stage and there had been no significant harvest failure to cause security scares in the food sector. Security issues did not arise in the energy and food, and so no efforts were made to stockpile in these sectors.
2 IMF IP index, (2000=100) 3 All data from Lewis 1955 4 Lewes 1955
6
The 1951-53 commodity boom is more about perceived supply security issues rather than actual bottleneck in the supply side. Eventually the very rises in inventories responsible for rising prices were also the cause of the end of the price boom when destocking took place.
1.2 The Second Commodity Price Boom; 1973-75
In the Second Commodity price boom all commodities experienced increasing prices, with differences in the timing and duration of that price increase. Prices started to rise in the last quarter of 1972, finally peaking in the last quarter of 1974. (figure 1.2)
Figure 1.2: Monthly Averages of UNCTAD Commodity Index 1970-75. (2000=100)
0
20
4060
80
100
120140
160
180
1970 1971 1972 1973 1974 1975
All Agri. Raw Materials Minerals & Metals Oil
Source: UNCTAD Statistics online accessed February 2009
Agricultural raw material prices were the earliest to peak in the first quarter of 1974 followed by food prices peaking in the last quarter of 1974. By 1971 levels, prices had just about doubled in these two sectors. The largest price increases were seen in the oil sector, prices initially doubled between the first and last quarter of 1973, but by the end of 1975 rose by four and a half times their 1971 values. By contrast metals prices only doubled between the first quarter of 1972 and second quarter of 1974. Although the price index for all commodities was higher at the end of 1975 than its value in 1972, only the increase in oil prices was permanent, while the other returned to their pre boom price levels.
Demand: The early 1970’s was a period of expanding economic activity in the Western world. The industrial production index for the advanced economies rose by 15% between 1971 and 1976. However inflation was a rising concern in this period, with the Consumer Price Index in the advanced economies rising by nearly 25% between 1971 and 1976.
The demand surge for commodities came from the simultaneous economic expansion of three major industrial regions; the US, Western Europe and Japan. The global economy was in a strong macro economic position in 1972-73, with IP index for OECD Europe rising from 53 to 62 over the 1970 to 1974 period. Increasing demand pressures were being generated from all three major industrial economies. On average, the OECD economies experienced annual GDP growth of 4.4% in 1969-71 and 3.2% in 1972-75. Japan’s annual average GDP growth was 9.3% and 4.6% over the
7
same period. The demand for commodities in the early 1970’s was a result of the increasing economic expansion in the OECD economies.
Supply: Initially in the 1970’s the concern for commodities was more about over-supply rather than constrained supply. Fried (1976:644) reports; ‘In the past two decades … most of the attention devoted to commodity issues was concentrated on proposals to reduce burdensome surplus and to support prices.’ Therefore the possibility of constrained supplies was an eventuality not prepared for. However during the 1972-75 period supply constraints were experienced in all sectors. All major commodity sectors; soft and hard commodities and the energy sector experienced rising prices, although for different supply related reasons.
The Soviet Union experienced bad harvests for two consecutive years in 1971 and 1972 with South Asia and North America suffering crop failure in 1972. The Soviet Union choose to import the deficit from international markets rather than allow domestic prices to increase and curtail consumption. At the same time, the US Department of Agriculture had drawn down its own inventories and stocks. The US suffered from a bad harvest as well in 1972, which resulted in an overall short fall of supply to meet demand. Agricultural raw material prices were affected when the traditional producers of these commodities turned land towards growing food crops rather than cash crops. The supply deficits from the food sector were passed on to the cash crops sector. Therefore 1973 saw a dearth in inventories of both food and agricultural raw materials and consequently the first to see price increases.
Politically, the major event during this period was the Arab Israel war that led to oil embargos being raised by certain Middle East oil producers on western countries. Although the embargo itself did not last long, it did raise concerns of security related to oil imports from the Arab countries. This was also the period where the OPEC cartel asserted its power over oil prices leading to the first of the oil price shocks to the global economy in 1973.
In the hard commodities sectors, prices rose due to supply constraints. Metal and mineral supply was affected by labour disputes in the mining areas, as well as political unrest in the metal producing economies. Strikes in Chile had reduced copper exports. Jamaica and later other bauxite producers imposed huge increases in taxes on Bauxite5. This led to increasing supply constrains in the metals and mineral sectors leading to rising prices in the metals category.
Supply constraints in the agricultural sector due to harvest failures, oil supply security due to political decisions and labour disputes in the mining sector all lead to supply constriction arising at a time when demand was strong. The price boom receded when economic recession took hold towards the end of 1975 and most prices receded to their pre boom levels of 1972.
1.3 The Third Commodity Price Boom; 2003-08
The 2003-08 commodity boom accompanied a major expansion in the global economy. Growth in the global economy post 2000 was robust in both the developing and the emerging economies. Advanced Economies were expanding at 2.5% p.a on average in 2000-07. Emerging and developing economies showed higher growth rates, averaging around 6.4% p.a 6 . International commodity prices began to rise for most sectors post 2003 and continued on an upward trend until mid 2008. With the collapse of the financial system, the credit crisis and recession in western
5 Fried (1976:642) 6 IMF WEO data accessed via ESDS on 15th Feb 2009
8
economies towards the end of 2008, the commodity prices also dropped. The 2003-08 commodity boom lasted for five years.
Between 2000 and 2003 the UNCTAD All Commodities Price Index rose from 100 to 105, and by 2007 it had doubled to 207. Different commodities experienced different price increases, and as figure 1.3 shows, oil and metals and minerals experienced much higher prices than agricultural or soft commodities. The peak of the price boom was seen in mid 2008, where after prices crashed for all sectors. However, even at the end of 2008, the indices for all sectors were above their 2000 values. Since the 2003-08 boom was mainly centred in the metals and minerals section, we take a closer look at the fundamentals in that sector7.
Source: Calculated from UNCTAD Statistics online accessed February 2009
Demand: The demand for commodities was generated in two different regions, the OECD economies and the emerging economies. The Industrial Production Index in the Advanced Economies, which account for 70% of world GDP in 2008, rose form a 98 in 2003 to 108 in 20078. Meanwhile non OECD economies, such as China and India, which are not included in the IP index, have exhibited growth at an average of 10% and 7% p.a. respectively in 2000-2007. Both China and India are large developing countries moving through a resource intensive stage of growth. The demand for infrastructure, construction and consumer goods is associated with more commodity intensive growth than similar growth rates for industrialized countries. In the case of China, its size, both geographically and by population is one contributor, while the nature of its economic expansion is another for commodity intensive growth in relation to others.
First China accounts for nearly 20% of the global population in 2007. The Chinese population is still aggregated in lower income segments, who are now experiencing rising incomes. As incomes increase, new demand for consumer goods is generated, leading for new manufacturing demands
7 Although oil prices rose substantially in 2008, this was over a shorter period and was linked mainly to speculative activity. 8 IMF Advanced Economies IP
9
for inputs. In comparison the percentage of population in the lower income level in advanced economies tends to be quite small as a percentage of the total population.
The second impetus to the relative commodity intensive growth is the emerging economy nature of China. Growth in the infrastructure and construction sectors is focused on new projects rather than maintenance and expansion. New dams, roadways, railway tracks and buildings will require more hard commodities as inputs in comparison to the needs of advanced economies primarily focused on the upkeep of existing infrastructure.
Thus the ‘new’ demand within China has been responsible for the bulk of increase by China, seen in global demand for base metals (figure 1.2). In 1995-2000 China’s share of new demand was less than 50%, but in 2000-2007 China accounted for more than half the increase in demand for Aluminium, Nickel and Steel and nearly all of the increase in demand for Copper.
Figure 1.4 Increase in Global demand for metals accounted for by China
0102030405060708090
100
Aluminium Copper Zinc Nickel Steel
1995-2000 2000-2007
Source: Macquarie Presentation September 2008
Supply: Whereas as substantial growth was seen in the demand for commodities, the supply side remained constrained in the metals sectors for different reasons in 2003-08.
Metals during the 1980’s and the 1990’s saw depressed prices leading to inadequate investment in mining and processing. New investments have gestation periods of 2 to 5 years; inventories take time to build up. New capacity was not built into the system due to low prices. The initial increase in demand for mineral and metal commodities in early 2000’s was met by using long built up inventories and stocks at producers, consumers and international exchanges. However by the second quarter of 2003, these inventories were not being replenished quickly enough from new production and began to decline, indicating a dearth of supply. The London Metals Exchange, which is the premier metals trading exchange, saw inventories of copper drop from 856 kilo tons in 2002 to 49 kiloton in 2004, before rising to 199 kiloton in 20079. Markets picking up on the low inventories responded by increasing prices.
Exploration budgets in mining, and investment into new capacity was also limited during the initial years of the price boom and only began to materialise post 2005. With limited investment activity in the 1980’s and 1990s, the money available for exploration tended to be restricted as well.
9 Source: Bloomsbury Minerals Economics
10
Exploration budgets in the 1990s averaged at $3.7 billion p.a. Only after price increases in metals in 2003 did budgets begin to rise from $ 3.8 billion in 2004 to $ 10.5 billion in 2007. Budgets were expected to be around $ 14 billion in 200810, however some cuts have been made after the mid 2008 price crash.
Supply takes time to build up, as mining projects have gestation periods of atleast five years, if not more. The inventory levels at the LME indicate that despite the price rise, supply lags remained contributing to higher prices. Only in the second half of 2008, as the recession set in and global demand decreased, did inventory levels begin to rise again.
The 2003-08 commodity prices were mainly driven by unanticipated demand surge from China and inadequate supply response from the minerals and metal sector. The Chinese growth was seen as unprecedented and the mining community was not prepared for the surge in demand. As inventories began to be drawn down, with limited new supply coming on line, the price surge was a logical reaction to the physical market fundamentals. Only as growth slowed and demand receded in the second half of 2008, were inventories rising, leading to an end in the commodity price boom.
1.4 Comparing the Commodity Booms
The three post World War II commodity booms have exhibited different price behaviour, in terms of their duration, extent of price increases and sustainability. The first two booms (1951-53 & 1973-75) were very much supply driven while the latest one (2003-08) has a large demand component.
The Price Rise: The price rise in the 1951-53 boom was quite small, with the All Commodity Index never rising more than 50% over the 1949 values. The 1973-75 period and 2003-08 period both saw prices triple over levels preceding the boom, however the time taken to reach the highest price peak was much shorter in the case of the first (23 months) and much longer in the case of the later (57 months).
The Duration: The 1951-53 boom subsided as soon as it was clear that supply constraints were unlikely to materialize, while the 1973-75 price rise subsided as the global economy moved towards economic recession. The 2003-08 commodity boom has been tracked over five years, much longer than the other two. The end of the 2003-08 boom was largely due to the financial crisis and the credit crunch.
Demand Disruption: The increase in demand for commodities is generated by industrial production and GDP growth, and expectations of future demand and supply (which affects stockpiling). The 1951-53 boom was experienced at the beginning of a recovery while the 1973-75 boom was experienced towards the end of an expansionary phase. In the 1951-53 the main trigger in price increases was the anticipated supply problems while in the 1973-75 price rise supply constrains in the agricultural sector and the oil price hike by the OPEC economies were major drivers. Only in the 2003-2008 period was unanticipated commodity demand from outside the OECD economies a possible demand trigger. China and India have shown strong GDP growth rates in the past decade, but more importantly the level of demand from China was unanticipated by the mining sector.
10 Source: Metals Economics Group
11
Supply Disruption: Supply constraints, perceived or actualized were real factors in the 1950-53 and 1972-75 commodity booms. Destocking in the first, and eventual decline in industrial output in the second period, resulted in supply being able to catch up with demand. However, in the 2003-08 commodity boom low inventory levels lead to price increases and new supply constraints continue to manifest across various commodity sectors. Only a fall in demand due to the recession has resulted in supply/inventories rising. However, if demand were to rise again in the near future, supply constraints felt in the pre-August 2008 period may reassert themselves, again leading to tight markets in metals and minerals.
2003-08 Super Cycle: The 2003-08 commodity boom has been termed by some as a ‘super cycle’. In the two earlier booms the demand drivers were the industrialised economies. However, in contrast, the 2003-08 commodity prices have been driven to a very large extent by the economic expansion in China. With the financial crisis in the second half of 2008, commodity prices have dropped to two thirds their values in the first half of 2008. As the global economy contracts in 2009 and western economies head into recession, Chinese annual growth is also expected to slow down from 11% to an anticipated 8% in 2009. With the global economy not expected to return to an expansionary phase until 2010 or 2011, will commodity prices tend to remain subdued that is, it will have experienced a cycle? Or is the 2003-08 a commodity super cycle, interrupted by a business cycle in 2008, which can be expected to resume its upward trajectory as the fall out from the financial crisis is cleared in 2009?
In order to understand the impact of Chinese demand on commodity price trends, we turn to examine the nature of domestic demand generated by China’s GDP growth. If this change in China’s national economy is indeed structural, we can reasonably expect commodity demand to resume in the medium future.
SECTION 2; STRUCTURAL CHANGE IN CHINA AND COMMODITY DEMAND.
China’s economic growth has been phenomenal by any standard of development, with the GDP averaging growth of 10% p.a. from 1990 to 2007. In 2006 and 2007 this rate climbed to 12% per year. GDP per capita (constant 2000 $) increased from $949 in 2000 to $ 1,791 in 2007. This growth has been driven by the industrial sector which accounted for 48% of value added in GDP in 2006. Whereas as trade was a large driver of growth, (72% of GDP) the Chinese growth miracle has not all been about its exports. In 2006 exports were valued at 40% of GDP, but importantly imports were valued at 32% of GDP. As China sources industrial and agricultural raw material from imports, its growth is increasingly becoming a source of revenue for natural resource exporting developing countries.
The increasing economic activity within China is a major driver for its domestic growth. The share of the industrial sector accounts for nearly half of China’s national output, when compared to that of the more advanced economies such as the US (22%) and Japan (29%), or even to transition and emerging economies such as South Korea (40%) and Russia (40%). Domestic growth generates demand for urbanisation, infrastructure and manufactured durable goods. Expenditure on Gross Fixed Capital Formation in China was 43% of GDP in 2006, much higher than the 18% for Germany and 29% for South Korea.11 Such expenditures generate demand for metals and minerals thereby domestic growth being a large driver for increased commodity demand. Heap (2005:1) argues; “In China, intensity of use [of metals consumed per unit of economic activity] is now three
11 Source: World Development Indicators (December 2008)
12
times that of the USA, with demand driven by urbanization, industrialization and fixed capital formation. Importantly, the domestic market drives China’s metals demand, not exports.”
GDP growth and higher per capita incomes are associated first with an increasing use of commodities, and then smoothing out of commodity consumption as an economy reaches a mature stage. The advanced economies, with higher per capita GDP tend to have lower elasticity of commodity demand with respect to growth as the major infrastructure and urbanisation processes have been achieved and focus remains on expansion and upkeep rather than on new projects. Emerging economies on the other hand are more focused on the construction of new projects, which require higher commodity usage. The derived demand for minerals and metals comes from increased infrastructure, residential housing and other construction as well as the expansion in consumer goods demand. Industrial output is only part of the domestic growth story.
A cross country comparison of GDP per capita and percentage share of mineral and metals costs in the economy is shown in (Figure 2.1) for selected emerging and advanced economies. The advanced economies are concentrated in the lower right quadrant of the figure where the highest per capita incomes are associated with low metal and mineral costs in the economy. China on the other hand, is found towards the left hand side of the curve, where it is still experiencing higher metals and minerals costs as compared to other transition economies. South Korea, Malaysia, and Turkey lie midway between China and the developed countries, indicating the path that China is likely to take as it progresses.
Figure 2.1: % Share of Costs of Minerals/Extractive Sector and GDP Per Capita (PPP). (2004)
Source: Calculated from GTAP and World Bank Development Indicators for 2004
13
With lower GDP per capita, China still has much progress to make before it reaches similar levels to South Korea and then the more advanced economies. Looking at the precedence of minerals and metals costs in relation to GDP per capita, it is evident that as China continues to grow, the cost of metals and minerals in relation to the GDP will decrease. However there is a considerable distance for incomes to grow before China’s mineral and metals consumption reaches levels similar to the advanced economies. For the near future that would indicate China’s continued high consumption of minerals and metals in relation to its per capita income levels.
2.1 Domestic Infrastructure and Urbanisation
China is the fourth largest country by size and covers 9,596,960 sq km; the United Kingdom is just 2.5% the size of China in terms of geographical expanse. In 2007, China had 287 officially classified cities, with 13 having populations over 4 million people and 26 cities with populations between 2 and 4 million. 45 % of the Chinese population (594 million) is in urban centres. The population of Beijing is the same size as London, whereas Shanghai is twice that size.
As urban centres continue to grow, new cities and expansion of older cities generate demand for more housing and infrastructure. Chinese cities have been seen population density in city districts increasing from 442 pers./sq. km in 2000 to 2,104 pers./sq.km. in 2007 12 . More residential buildings also increase infrastructure demand; pipes for water and gas, cables for electricity and phone lines etc. The UN population division estimates that from an urban population of 530 million in 2005, by 2015 the urban population will rise to 684 million. By 2030 this will amount to 890 million people, a population larger than that of the US and Europe combined13.
Of China’s total expenditure on fixed assets in 2007, 61% was spent on construction and installations. Within urban centres, the number of large projects, (investment value of more than 1 billion yaun) account for nearly 30% of all urban fixed assets investment. Given China’s status as an emerging economy, a large share of infrastructure investments are for ‘new’ projects and less for upkeep and repair as would be the case in an advanced economy. Table 2.1 shows the share of new projects has been increasing since 1995 and takes nearly half of the share in 2007, while expansion and reconstruction remain fairly stable. New projects tend to be much more commodity intensive as compared to expansion and reconstruction investments.
Table 2.1 : Investment In Fixed Assets In Urban Area By Type Of Construction
% Share in Total Investment Year
Total Investment (100 ml Yaun) New Construction Expansion Reconstruction
Since fixed asset investments require large inputs of commodities, an emerging economy with larger infrastructure investments will reflect a tendency to incur a higher proportion of minerals and metals in their infrastructure costs. Figure 2.2 is drawn for a cross section of countries and
12 Source: Chinese Statistical Year book 2008 13 Source: Population Division of the Department of Economic and Social Affairs of the United Nations Secretariat.
14
shows the relationship between Gross Fixed Capital (as % of GDP) and the costs of mineral and metals in construction and infrastructure.
Low Gross Fixed Capital (as % of GDP) is accompanied by low costs of mineral and metals in construction and infrastructure, in the lower left hand quadrant. The advanced economies, such as Germany, United States and France are found in this sector. These economies currently require low investments in infrastructure, and the nature of their investments tends to be less commodity intensive. Therefore the cost of commodities to infrastructure is also low.
Figure 2.2: Mining Extraction Sector As Costs In Infrastructure And Construction And Gross Fixed Capita (% Of GDP) 2004.
Source: Calculated from GTAP and World Bank Data.
As investment in fixed assets increases on the left hand scale, the costs of commodities in construction also tend to increase on the x axis. The emerging economies of Turkey, Poland, India, Thailand and Malaysia are centred within the figure reflecting the increase in investments and related rise in costs of commodities in construction and infrastructure.
China appears as an outliner in this figure, as it has the highest expenditure on fixed assets in relation to GDP, of all countries in the sample. The high expenditure is accompanied by similar levels of costs for commodities in infrastructure as other emerging economies. As the Chinese economy matures, we can expect its investment to decrease in fixed assets to the levels of other advanced economies. With lower investments, its percentage share of costs of commodities in infrastructure is also likely decrease. However China’s move from its current investment levels to those exhibited by the developed world, is still a long term horizon. Chinese urban population is expected to reach 1.12 billion urban residents by 2050. For the short to medium term we can expect
15
Chinese investments to retain their high levels, ensuring that commodity costs and therefore demand in infrastructure is going to remain strong in the medium term.
2.2 Domestic Manufacturing
The contribution to GDP value added by the industrial sector in China was 48% in 2007, indicating the strong role of manufacturing in the sector. Countries with large industrial sectors tend to consume larger amounts of commodity raw materials as inputs. Countries with lower contribution from the industrial sector to GDP value added will also consume less commodities and vice versa. As an economy moves from an agricultural based economy to an industry based economy, its consumption of commodities will increase. However as economies continue to mature and the service sector becomes a larger contributor to GDP, the share of manufacturing and the associated consumption of commodities will also decrease. Figure 2.3 shows the ratio between industrial value added as a % of GDP and the input of minerals and extractive sectors in manufactured products for various countries.
The advanced economies with smaller share of manufacturing in GDP and a therefore a lower consumption of commodities in manufacturing, tend to be found in the lower left hand quadrant. The emerging economies with stronger manufacturing sectors tend to lie above the curve reflecting a higher cost of commodities in manufacturing associated with the higher contribution of the industrial sector to GDP. As these economies move towards stronger services sectors, such as Singapore, their consumption of commodities in manufactures will also decrease. However given the strong manufacturing nature of the current Chinese economy, the move towards a services dominated economy is almost certainly on a longer time horizon.
Figure: 2.3 Industrial Value Added As A % Of GDP And The Input Cost Of Minerals And Extractive Sectors In Manufactured Products
Source: Calculated from GTAP and World Bank Data.
16
2.3 Structural Growth and the Financial Crisis.
As the scale of the financial crisis began to manifest itself in the later half of 2008, the impact of the global recession on the Chinese economy has started to appear. By early 2009, China’s expected GDP growth rate was down to 8% from the anticipated 12% in the previous year. As its major export markets began to cut down on spending, manufacturing activity decreased within China as well.
In order to combat the recession and avert too swift of an economic slow down, the Chinese government has turned towards various stimulus packages to help domestic growth. In November 2008, China announced $ 586 billion to be spent on rebuilding houses destroyed in the summer earthquake and still more infrastructure projects: railroads, airports, subways and bridges in the next two years. A fall in interest rates and other schemes to encourage domestic consumption have been put into place, although it is too early to tell as to what degree these programs will be successful in bringing domestic growth.
Section 2 has highlighted the nature of demand for commodities within China. The demand is led by the domestic growth of infrastructure, urbanisation and manufacturing. Although we can expect some slow down in these indicators in 2009, the structural movement is likely to remain robust until China graduates from emerging economy to a mature economy status.
SECTION 3: CHINESE ENGAGEMENT WITH AFRICA
Africa’s importance for China has been steadily increasing, linked to its potential as a largely untapped source for oil and minerals and metals.14 Africa also offers China new markets for its products and opportunities for investment. Since 2000 China has increased its engagement with the continent on political and economic forums. The China-Africa Summit in Beijing in 2006 was a major event in developing this relationship, and China has continued to increase aid, trade and FDI with Africa. China’s trade with Africa hit the $ 100 bn mark in 2008, and it is has now become a major actor in aid and investment.
One of the major vectors of engagement has been around the natural resources sector. Africa has some of the largest reserves of metals and minerals on the planet and potential of growth in production is quite large. In 2006, the ratio of production to reserves for Manganese, Cobalt and Aluminium was as low as 34%, 33% and 9% respectively. In other metals the production to reserve ratio is quite high such as for Platinum (90%), Gold (48%) and Chromium (91%). Table 3.1 shows these ratios in detail. The United States Geological Survey estimates that between 2000 and 2013, the production for Platinum, Aluminium and Copper will increase by 119%, 109% and 360% respectively in Africa.
Table 3.1: Africa’s share of Global Production and Reserves (% share) Mineral Production Reserves Ratio Platinum Group Metals 54 60+ 0.90 Gold 20 42 0.48 Chromium 40 44 0.91 Manganese 28 82 0.34
14 Canada, Australia, Russia and Latin America have been the largest traditional exporters of minerals and metals
Source: Calculated from African Development Bank(2008)
Raw material supply security for the future is a major issue for the Chinese, and given the recent period of high international commodity prices, China is looking for continued access to raw materials. The Chinese presence within Africa is increasingly being viewed as China’s attempts to secure its ‘resource basket’.
3.1 China’s Engagement with Africa
China’s activities in the continent are mainly seen as resource seeking where trade, aid and FDI are often linked to the resource rich countries. The Chinese government itself acknowledges that part of its strategic policy is to secure supply of essential commodities and oil for its own development.
There have been a wide range of forums to enhance China Africa relationships. The largest of these was the Forum on China Africa Corporation (FOCAC). The first ministerial meeting for the Forum was held in Beijing in 2000, followed by the second in Addis Ababa in 2003. The third forum was held in 2006, also referred to as the China-Africa Summit, which was widely seen as China’s attempt to shift up gears in its engagement with Africa.
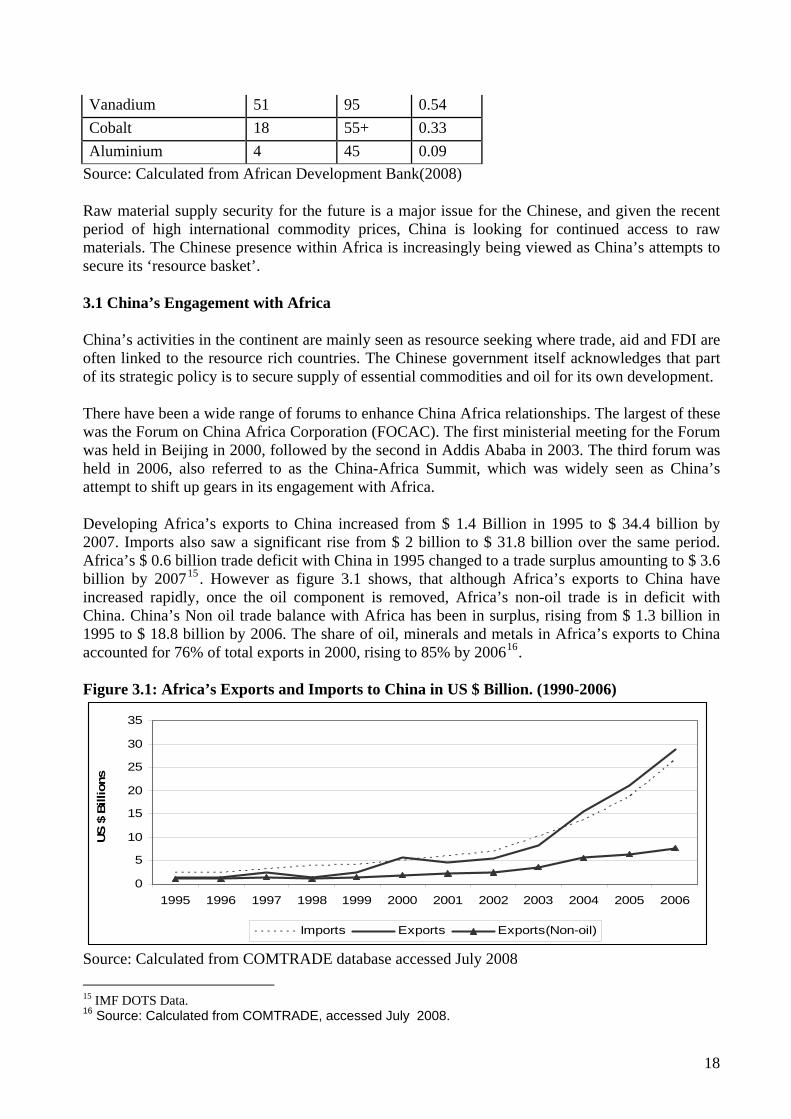
Developing Africa’s exports to China increased from $ 1.4 Billion in 1995 to $ 34.4 billion by 2007. Imports also saw a significant rise from $ 2 billion to $ 31.8 billion over the same period. Africa’s $ 0.6 billion trade deficit with China in 1995 changed to a trade surplus amounting to $ 3.6 billion by 200715. However as figure 3.1 shows, that although Africa’s exports to China have increased rapidly, once the oil component is removed, Africa’s non-oil trade is in deficit with China. China’s Non oil trade balance with Africa has been in surplus, rising from $ 1.3 billion in 1995 to $ 18.8 billion by 2006. The share of oil, minerals and metals in Africa’s exports to China accounted for 76% of total exports in 2000, rising to 85% by 200616.
Figure 3.1: Africa’s Exports and Imports to China in US $ Billion. (1990-2006)
Source: Calculated from COMTRADE database accessed July 2008 15 IMF DOTS Data. 16 Source: Calculated from COMTRADE, accessed July 2008.
18
According to UNCTAD (2007), China’s FDI in Africa has been increasing, rising from just $ 1.5 million in 1991 to $ 60.8 million by 2003. Besada and Whalley (2008) using various sources estimated Chinese FDI flows into Africa to be just above $ 500 million in 2006, rising from $ 400 million in 2005.
In 2005 Chinese FDI stock in 48 African countries reached a value of $ 1.6 billion. Although China’s FDI in Africa is geographically dispersed, five countries (Sudan, Algeria, Zambia, Nigeria and South Africa) accounted for 56% of the FDI stock in 2005).
China’s investment in Africa is fairly well divided over different sectors. Between 1979-2000, 46% of investment was in the manufacturing sector, textiles being the main category. Services, mainly construction, accounted for 18% of the FDI inflows, with Resource Extraction accounting for 28%.17
3.2 China’s Strategic Interest in Africa
China uses a combination of aid, trade and FDI bundled together to engage with African counterparts. Chinese investments in infrastructure are often combined with loans from the Chinese Export Import (ExIm) bank, while rights to exploration of minerals is associated with larger aid packages. For example in December 2007, China and the Democratic Republic of Congo signed a deal valued at $ 9 billion. As part of the agreement, China would invest in transport infrastructure, and in the social sector in schools and hospitals. It would also assist in the rehabilitation of the mining sector. In return China was to be granted access and majority rights in the copper and cobalt mining sectors18. Although currently the deal is under scrutiny by the IMF and other traditional donors, it does clearly highlight the nature of engagement between China and African states. Similar deals, although of lower value, have been agreed between the Chinese and governments in Sudan, Angola, Nigeria, Equatorial Guinea, and Gabon. The exact nature of these deals is rarely published by either governments, but mining rights are often exchanged for assistance in infrastructure development.
Even with the 2008 decline in commodity prices and economic growth, China has continued to pursue mineral sector based engagement with Africa. In January 2009, China signed a $2.3 billion deal with Liberia, the biggest FDI project in the country, for iron ore mining. Revamping the country’s rail network and electricity generation is also part of the agreement 19 . In Zambia, Chinese owned firms opened copper smelters in January 2009, while other competitors were shutting down t 20heir plants .
Thompson (2009) reports that despite the global downturn Chinese investors are still looking to expand their markets in Africa, especially in the telecommunications sectors. Other firms that are looking to buy in the mineral and metals sector given the lower price for these resources due to a fall in commodity prices. South Africa's Standard Bank, where China holds a 20% stake, has been advising Chinese clients on buying opportunities in Africa. Cui Yongqian, a former Chinese ambassador to the Republic of Congo and Central African Republic, remarked at a China-Africa trade forum in January 2009; "Some developed Western countries hit by the financial crisis are
17 All data from UNCTAD 2007 18 The FT ‘China in the Congo’ 9th February 2009 19 http://www.voanews.com/english/Africa/2009-01-23-voa8.cfm 20 Thompson (2009)
reducing their investment in Africa. Objectively, this is a powerful opportunity for Chinese businesses to expand their investment and market share in Africa”.21
The global crisis has brought some decrease in Chinese investment activity in Africa as well. There have been mine closures in Guinea, revaluation of the DRC deal from $9 billion to possibly $ 6 billion, and delay in agreements over mining projects in Gabon. In the DRC 40 Chinese smelters shut down in December 2008, with their owners fleeing the country without paying wages or royalties.22 Overall China is looking for a long term strategic position in Africa, as its need for hard commodities are also long term. 23 Africa still stands to gain from the increased trade, aid and FDI that China offers.
3.3 Implications for Africa
China’s growing presence in Africa has both positive and negative implications. If we focus on the direct impact, consumers, producers and governments can draw major benefits from engagement with China. However policy concerns remain in connection to this engagement.
Kaplinsky (2009) discusses this engagement in terms of international trade. If Africa exports what China imports then Africa benefits, as is the case when China exports what Africa imports. This leads to a win-win situation. For example, Africa’s exports of minerals and metals are beneficial as Chinese demand for these products has increased prices and can generate revenues for African countries. In the case of Chinese exports, low cost manufactured items, from shoes, clothing and household electronic items, when imported into Africa, benefit domestic consumers. Therefore the benefit to the African consumers of low cost Chinese imports, while the revenue from high prices commodity exports can result in a win-win situation.
However, domestic policy issues have to ensure that cheap Chinese imports do not severely challenge or destroy local manufacturing capability. Similarly in signing agreements over mineral rights and concessions, the State has to ensure that an equitable distribution of rents takes place, and the benefits are passed on to the local communities. Environmental and labour standards also need to be enforced. Therefore while Chinese engagement may bring opportunities, the African governments need to ensure that policies are in place to fully benefit from these ventures.
Kaplinsky (2009) also points out that there are indirect trade vectors that may harm Africa. This is likely to occur when Africa exports the same goods as China, or when Africa imports the same commodities as China. For example, China’s demand for oil has had some impact in increasing oil prices, which has also increased the oil import bill for African countries. While Angola and Nigeria may benefit from high oil prices, the rest of the African nations are oil importers. Similarly textiles and clothing are a major African export to the USA under the Africa Growth and Opportunity Act (AGOA). With increased Chinese exports after the removal of the Multi Fibre Agreement in 2005, exports from the AGOA region declined by 21% between 2005 and 200724.
The implications of China-Africa engagement cover a whole variety of direct and indirect issues, as well as macro, micro and meso level outcomes. On the one hand China has brought much needed aid, trade and investment to African countries. In return it has access to oil and other hard commodities which are important for its own development. While China has made contributions to 21 Thompson (2009) 22 The FT; 19th February 2009 23 Thompson (2009) 24 For a detailed discussion see Kaplinsky and Morris (2008)
20
developing the infrastructure in African countries, its exports have harmed the manufacturing sector as well.25Chinese demand for commodities has led to increased investments by Chinese and Western mining firms in Africa, but environmental, labour and equity issues remain. While China has emerged as a new partner in terms of economic and social assistance, this has led to emerging tensions with traditional donors26.
These are complex political and economic issues, and the most important component of this engagement has to be the response of the African governments. The policy proposals, agreements and implementation by the African States are in large part going to determine how beneficial Chinese engagement with the continent will be.
SECTION 4 DRIVERS OF COMMODITY PRICE.
The 2003-08 commodity boom saw a sustained increase in prices over a period of five years, driven by expansion in China. The Chinese growth is resource intensive in relation to other economies, and each percentage point growth results in higher demand for commodities.
By the end of 2008, as the financial crisis took hold the advanced economies entered a recessionary phase, with China’s economic growth also slowing down. In the beginning of 2009, there remains no clear indication of when recovery will occur and at what pace.
The fundamentals of commodity demand in 2003-08 were very much driven by China’s structural change. Demand for raw materials as inputs into infrastructure, construction and manufacturing accounted for a major portion of the increase in demand for base metals. Due to supply side constraints in terms of capacity and expansion, the global inventories of metals fell below pre 2003 levels.
As China sought raw material supply, its engagement with Africa increased. Aid, Trade and FDI policy measures were used to enhance access to African reserves. However, as commodity prices declined in 2008, the extent of continuation of China’s interest in Africa as a ‘resource basket’ is under question.
The Chinese demand for metals and minerals is largely due to the increased expenditure on infrastructure, construction and manufacturing. Section 2 highlighted the stage of economic growth that China is currently experiencing, and it is clear that the intensive use of metals is likely to continue in the medium term. China may be the world’s second largest economy by size, but it is still a developing economy and far from reaching mature economy status. The demand for commodities will continue.
The supply constraints in the mining industry have receded partly due to the lowering of demand for commodities. Production cut backs and postponing of new project investments have been accompanied the recession. However, if demand were to return the constraints within supply may manifest again.
The end of the 2003-08 commodity boom was brought about by the credit crunch and the unravelling of the global financial markets, mainly in the advanced economies. As credit facilities become harder to avail and economic recession sets in, in the EU and the USA, the globalised
25 For a detailed discussion see Kaplinsky and Morris (2008) 26 For example the current debate in relation to the DRC, China and the IMF
21
transmission of this crunch has also reached China. Expectations of when we can see the bottom of the financial cycle and a recovery set in range from the end of 2009 to 2011. As yet it is too early to know how deep an impact the financial crisis will have.
With government spending in the US, EU and Japan there is the possibility that strong economic fundamentals may return. The United States announced a $787 billion stimulus packaged, followed by other advanced countries including Japans’ $51 billion package to stimulate demand growth in Asia. As the crisis in the financial institutions such as banks is sorted, and the financial institutions are returned to health, the turnaround in the global economy could be possible. As liquidity and confidence returns to the markets, economic recovery will also begin. Economic recovery in the advanced economies would encourage growth in the emerging economies. As demand returns to commodity markets, prices will again resume their upward trends, perhaps not reaching levels as high as those in mid 2008, but will be above their median range in the 1990’s.
Currently China is aiming at an 8% GDP growth for 2009, and the government is currently focused on increasing domestic growth when its export markets have deteriorated. The Chinese State has indicated that it would be willing to increase its stimulus package from $ 589 billion announced in 2008, if it feels the need. Depending on the degree of success it achieves, its demand for commodities is likely to return in the medium term.
The structural nature of China’s commodity demand indicates its continued need for natural resources. Its engagement with Africa has also centred on access to these resources. Despite the export orientated economic slow down in China, the government is making attempts to strengthen domestic growth. It is too early to discern the impact of its stimulus package and policy interventions during 2009. However the question is not whether China will recover, but when it will recover. China’s engagement with Africa is aimed at securing raw material over the long term, and hence it continues to invest in mining and investment activities in the continent. We can expect this engagement to be a reasonably long term one, until China reaches a mature economy status. It remains largely to the African governments how they benefit from this opportunity.
The 2003-08 cycle carries all the hallmarks of a super cycle; extended duration and driven by demand of an emerging economy. Whether the financial crisis in 2008 has brought it to an end, or will prices recover in a years time is unclear. It is too early to determine the impact of stimulus packages being applied by the US, EU, Japan and China to bring about an early recovery. Depending on the success of these policies, economic growth may return quickly, leading to demand for commodities. The super cycle may yet continue, after a break.
22
23
References: Besada, H., Wang, Y. and Whalley, J. (2008) 'China's Growing Economic Activity in Africa',
NBER Working Paper No. 14024; National Bureau of Economic Research Cashin, P. and McDermott, C. J. (2002) 'The Long-Run Behaviour of Commodity Prices: Small
Trends and Big Variability', IMF Staff Papers Vol. 49 (2). IMF. Cashin, P. A., McDermott, C. J. and Scott, A. (1999) 'Booms and Slumps in World Commodity
Prices ', IMF Working Paper No. 99(155). IMF. Deaton, A. and Laroque, G. (1992) 'On the Behaviour of Commodity Prices', Review of Economic
Studies Vol. 59, pp. 1-25. Fried, E. R. (1976). ‘International Trade in Raw Materials: Myths and Realities.’ Science Vol.
191(4228): pp 641-646 Heap, A. (2005). ‘China – The Engine of a Commodities Super Cycle’. Working Paper, Smith
Barney; Citigroup. Kaplinsky, R. and Morris M. (2008). ‘Do the Asian Drivers Undermine Export-oriented
Industrialization in SSA?’ World Development Vol. 36(2): pp 254–273. Labys, W. C., Kouassi, E. and Terraza, M. (2000). 'Short Term Cycles in Primary Commodity
Prices', The Developing Economies Vol. 38(3) , pp. 330–342. Labys, W. C., Achouch A. and M.Terraza. (1999) 'Metal Prices and the Business Cycle', Resources
Policy Vol. 25, pp. 229-238. Lewis, J. P. (1955). ‘The Lull That Came To Stay.’ The Journal of Political Economy Vol. 63(1):
pp 1-19. Pindyck, R. S. and Rotemberg, J. J. (1990). 'The Excess Co-Movement of Commodity Prices',
Economic Journal Vol. 100, pp. 1173-1187. Radetzki, M. (2006). ‘The Anatomy of Three Commodity Booms.’ Resources Policy Vol. 31(1):
pp 56-64. Thomson, A. (January 2009) ‘China marches on in Africa Despite Downturn.’
Slade, M. E. (1991). 'Market Structure, Marketing Method, and Price Instability', Quarterly Journal of Economics Vol. 106, pp. 1309-1340.
UNCTAD (2007). ‘Asian Foreign Direct Investment in Africa: Towards a New Era of Cooperation Among Developing Countries’. Geneva, UNCTAD.
Kaplinksy, R. (February 2009). ‘China's Engagement with Africa’. Presentation at The Expert Group Meeting; Africa’s Cooperation with New and Emerging Development Partners, Addis Ababa; Ethiopia.
Macquarie Commodity Research, (September 2008). ‘Overview of Commodities Outlook with Focus On Copper, Zinc and Coking Coal.’ (Presentation).
African Development Bank (2008). ‘African Development Report 2007’. Abidjan. Bloomsbury Minerals Economics (January 2009). ‘The Copper Briefing Service’. London. Metals Economics Group (2000 to 2008). ‘Special Report on World Exploration Trends’. Canada.