PREFACEFrom The China International Council for the Promotion of Multinational Corporations (CICPMC)The Belt and Road Initiative covers most parts of the world, from China to South Asia, Southeast Asia, West Asia, North Africa and Central and Eastern Europe. It encompasses 38% of the world’s land area and 62% of the world’s total population. Yet the gross domestic product (GDP) of B&R countries accounts for just 31% of global GDP, according to the World Bank WDI database.
Due to varying resources and institutional conditions, B&R countries are at different stages of development. Each has its own economic model and each has unique consumption activity. Before entering B&R markets, Chinese brands must have a detailed understanding of overall economic conditions, consumer behavior and market trends. This approach will help businesses integrate their brands and, in turn, promote China’s comprehensive cooperation with countries along B&R trade corridors.
China’s B&R initiative is set to become a key focus of businesses around the world. As a world leader in measurement and analytics, Nielsen leverages its data expertise and global coverage to analyze the economic and consumer forces throughout B&R countries. By providing solutions that drive marketing effectiveness and optimize return on investment, Nielsen is enabling Chinese brands to go global and realize international success.
About the CICPMCThe CICPMC is a non-governmental organization approved by the Chinese State Council to specialize in work related to multinational corporations in China, and was granted Special Consultative Status with the Economic and Social Council of the United Nations. Relying on the government, focusing on multinationals and aiming to serve, the CICPMC is committed to the growth and cooperation of multinational corporations, and has done a lot of fruitful work in this regard. Most Fortune 500, top 500 Chinese SOEs and top 500 Chinese private companies are members of CICPMC, and many UN agencies, commercial offices of embassies in China, chambers of commerce and international organizations are CICPMC strategic partners. For more information, please visit www.cicpmc.org.
CHINESE BRANDS GO GLOBALThe Belt and Road Initiative (B&R) is a turning point for global economic development and China’s relationship with markets around the world. It will open new trade corridors that allow Chinese businesses to expand their horizons and create truly global brands. Once in place, the B&R initiative will cover two thirds of the world’s population and one third of the global economy.
China has already signed cooperation agreements with more than 80 countries and international organizations. In 2017, it invested US$14.4 billion in countries along B&R corridors. The initiative has led to 75 economic and trade cooperation zones, attracting nearly 3,500 companies to the region and more than US$270 billion of investment. Following this increased collaboration and investment, import and export trade volumes grew 17.8% in 2017.
For Chinese companies, B&R will create significant opportunities to bring products, services and brands to new markets and new pools of consumers. Players in industries like technology, auto, e-commerce and FMCG are already leading the way. According to the China Association of Automobile Manufacturers, more than 640,000 automobiles were exported from China to B&R countries in 2017 – a year-on-year increase of 24%.
The opportunities that the B&R initiative offers are enormous, and Nielsen draws on its global footprint and extensive industry expertise to help companies seize opportunities and tackle challenges that arise. Of the 65 countries and regions included in the initiative, Nielsen covers 41 of these markets, which account for 96% of total GDP along B&R corridors. More broadly, Nielsen China has significant experience delivering the commercial and consumer insights needed by companies with overseas ambitions.
In order to successfully “go global” and ensure sustainable future growth in new markets, Chinese businesses must also “go local” with strategies that reflect consumer and market trends. Nielsen China recently collaborated with Nielsen colleagues in key high-growth B&R markets to uncover critical insights that will help Chinese companies navigate challenges and maximize new opportunities.
This report draws on the insights of Nielsen leaders in Indonesia, the Philippines, Turkey and Egypt to uncover the macroeconomic trends, consumer behavior and retail landscape in each of these important B&R markets. We aim to show Chinese businesses how they can take advantage of Indonesia’s population boom; appeal to the Philippines’ digitally savvy, on-the-go consumers; win over Turkey’s young, connected shoppers; and capitalize on Egypt’s economic renaissance.
Together, we can grasp this new opportunity for regional and global growth.
EVA NGHead of Client Global Expansion, Nielsen Global Market Groups
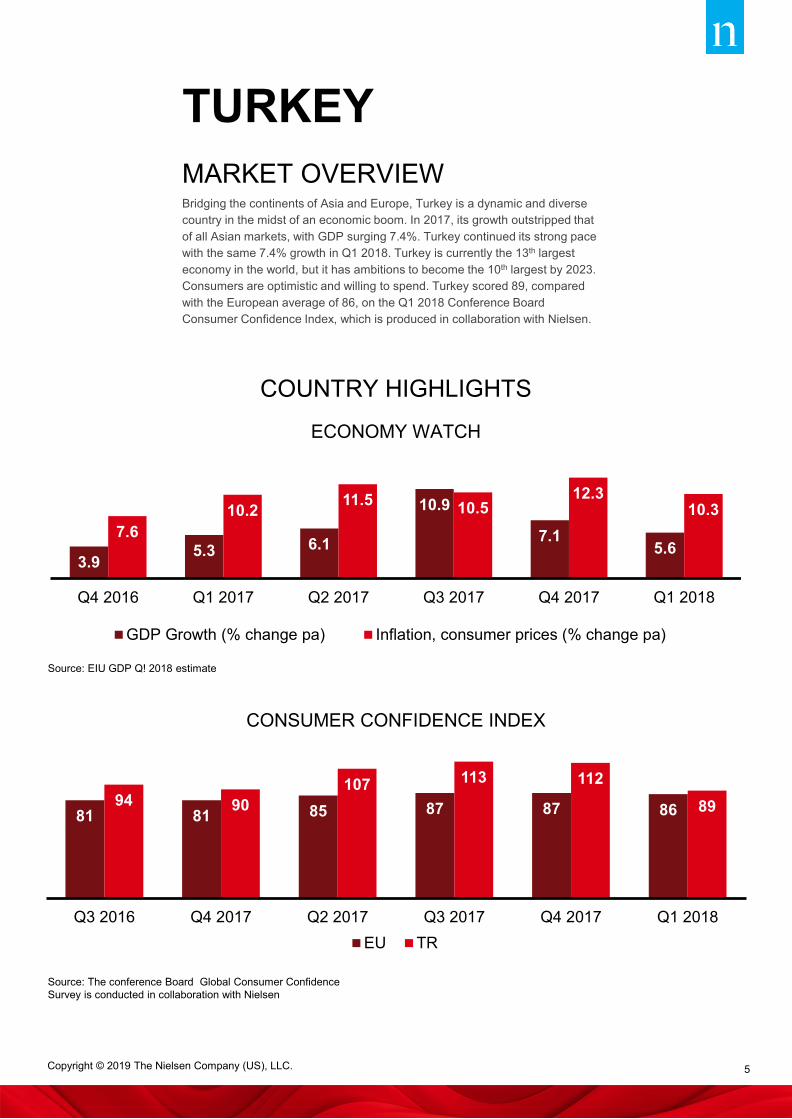
Bridging the continents of Asia and Europe, Turkey is a dynamic and diverse country in the midst of an economic boom. In 2017, its growth outstripped that of all Asian markets, with GDP surging 7.4%. Turkey continued its strong pace with the same 7.4% growth in Q1 2018. Turkey is currently the 13th largest economy in the world, but it has ambitions to become the 10th largest by 2023. Consumers are optimistic and willing to spend. Turkey scored 89, compared with the European average of 86, on the Q1 2018 Conference Board Consumer Confidence Index, which is produced in collaboration with Nielsen.
Turkey is home to young, urban and digitally savvy consumers. Its population is expected to grow by 9.2% between 2015 and 2025 to hit 83.7 million. Today, 67% of people are connected to the internet, and 73% own a mobile device. Turkey’s tech-enabled consumers now spend longer online than Chinese netizens, clocking more than 7 hours on the internet each day and almost 3 hours on social media.
2015 2025
76.69 MILLION 83.71 MILLION
26.6%
73.4%
22.3%
77.7%
RURAL RURAL
URBAN URBAN
20.40M 18.70M
56.29M 65.01M
Source: United Nations, Urbanization Prospects (2014)
As technology transforms society and shopping habits, Turkey has become a melting pot of traditional and modern behaviors. Traditional trade has been a mainstay of the retail landscape, but shoppers are now turning their attention to modern store formats. Online shopping uptake is currently low, but it shows significant growth potential. Surging inflation recently created cost pressures for consumers, but economic equilibrium is now returning. Overall, the spending outlook remains strong. To succeed in this market, Chinese companies must appeal to young consumers’ desire for innovation and develop distinctive offers that reflect local trends, tastes and traditions. At the same time, social media investment will be critical to winning over Turkey’s digitally savvy population.
Turkey’s increasingly health-conscious shoppers are willing to spend on products that improve their health and wellbeing.
CONSUMERS PRIORITIZE HEALTH PURCHASESHealthy eating has emerged as a key trend in Turkey, with consumers more conscious about nutrition than ever before. Nielsen data shows 65% of the population is now overweight and a further 49% are trying to lose weight. Against this backdrop, consumers have increased their health spending. They see diet as a key way to stay healthy and are more discerning about their food choices. According to Nielsen data, 86% of consumers read packaging labels for nutrition content and 91% choose local, natural and organic alternatives wherever possible. Consumers are willing to spend on healthy items. Nielsen’s Retail Panel shows sale volumes of nut bars and croquants increased 158% between 2016 and 2017. Sale volumes of kefir grew 63% over the same period, and probiotic/fruit yogurt experienced a 23% increase.
CONSUMER TRENDS
Read packaging labels carefully for nutrition content
Choose local, natural and organic alternatives
whenever possible
75%67%
76%76%
TURKEY - 86% GREECE – 82% ROMANIA - 81%
Global
E. Europe
Source: Nielsen (On the Cusp of a Food Revolution) Report, 2017
CONSUMERS ARE BECOMING MOREDISCERNING ABOUT FOOD CHOICES
PERSONAL CARE EMERGES AS A KEY GROWTH CATEGORYAs Turkey’s economy continues on a positive trend, consumers are increasing their discretionary spend. They are now more confident buying items outside essential categories. This has led to an upswing in personal care purchases. According to Nielsen data, personal care was among the best-performing categories in a rolling 12-month average from Q1 2018, recording strong value and volume gains. Body care grew 22% during the same period and hair care by 20.6%. These categories also benefited from growing penetration, store expansion and successful promotions in the perfumery and discounter formats. Personal care is expected to see continued growth in the coming years.
Turkey’s retail landscape is experiencing fundamental shifts as modern formats replace traditional trade, and e-commerce spending shows significant growth potential.
WHAT’S HAPPENING OFFLINE? The importance of modern trade formats has increased in recent years. Nielsen data shows the number of modern stores more than doubled between 2007 and 2017 to hit 28,134. Today, they account for 71% of sales excluding tobacco and alcohol, up from 61% 10 years ago. The trend has been fuelled by the proliferation of hard discounters, which grew from 1,877 to 16,253 over the same period. Shopping habits are also changing. Consumers are shifting some of their spending from hypermarkets to more high-frequency purchases at small format stores. Nielsen research shows 36% of Turkish shoppers made monthly grocery shopping trips in 2017, down from 49% in 2011. Meanwhile, the rate of weekly shopping rose to 42%, up from 23% in 2011.
WHAT’S HAPPENING ONLINE?Amid a backdrop of digital transformation, e-commerce is rapidly developing in Turkey. Between 2013 and 2016, the market doubled in size to hit $5.8bn. However, e-commerce sales are yet to peak. A huge opportunity for growth exists. Turkish consumers spent an average of just $181 online in 2017, compared with $858 in China and a global average of $833. In 2017, 9% of consumers had visited an online retailer in the last month, up from 5% in 2016. But Turkish consumers are still reluctant to shop for food online – just 7% of consumers bought their groceries through e-commerce sites in 2017. Other categories show good growth potential, however. Baby care, personal care, home care and pet care are top categories bought online.
HOW TO WIN TARGET YOUNG CONSUMERSTurkey is a young and dynamic market – 41% of the population is under 24 years old and the median age of consumers is 31 years old. To win in this fast-changing market, Chinese companies must position their brand to appeal to young consumers. Innovative and fresh product ideas will be key to success.
INNOVATE WITH A LOCAL TASTETurkish consumers are happy to experiment, with seven out of ten saying
they are open to trying new products. This behavior is fueling growth, as new product innovation generates a far higher contribution to overall growth than core products. At the same time, traditional tastes and cultures run deep and Chinese companies must develop distinctive offers that integrate with the local culture. Focusing on Turkish trends, tastes and traditions will be an important way to forge emotional resonance with consumers.
BE ACTIVE ON SOCIAL MEDIAActive and effective use of social media is critical to generate a big impact in Turkey. Since Turkey is a very young country, social media penetration is far higher in Turkey than the global average and time spent on social media is at a record high and almost 50% more than China and the U.S.A. To succeed in Turkey, Chinese companies must create word of mouth recommendations through social media buzz. Targeted digital expenditure will be critical in this connected market.
The Philippines is in the midst of a transformation as years of stable growth contribute to a thriving economic outlook. GDP grew 6.7% in 2017, making the Philippines the third fastest-growing economy in Asia. Increasing affluence has led to greater purchasing power, and Filipinos have been quick to spend. The market is home to Asia’s most optimistic consumers. In Q1 2018, the Philippines scored 128 against a regional average of 115 on the Consumer Confidence Index.
Source: United Nations, Urbanization Prospects (2014)
The market is also experiencing a population boom. Between 2015 and 2025, its population will expand by 17.1%, making the Philippines the fastest-growing population in Asia. At the same time, growing affluence means connectivity has become within reach of many. According to Nielsen’s Consumer and Media View, internet penetration has almost doubled over the past five years to hit 59%. Alongside this trend, smartphone ownership has soared. Between 2015 and 2017, the proportion of consumers who own a smartphone grew from 33% to 57%. As consumers enjoy the freedom of being connected anytime and anywhere, technology has become an intrinsic part of everyday life. Filipinos now spend 37 hours online each week to browse the internet, connect with friends or watch the latest shows.
Despite consumers’ love affair with digital technology, e-commerce is yet to take off. Instead, convenience stores and supermarkets continue to dominate the retail market. Consumption has remained healthy in recent years. However, the developing market also presents many challenges. To win in this fast-changing market, Chinese companies must align their offerings and strategy with a consumer base that is confident and growing in affluence, yet remains price conscious and focused on brick and mortar retail. Targeted strategies that look beyond major cities will also be critical to success.
Almost half of Filipinos now live and work in urban areas. These on-the-go consumers keep convenience front of mind – they look to spend on products and services that make their busy lives easier. At the same time, recent regulatory changes could create cost pressures, leading to more discerning purchase decisions.
CONVENIENCE DRIVES CONSUMPTIONFilipinos like to shop. It is widely seen as a family bonding activity and spare income is quickly spent. Basic necessities, such as food, clothing and housing and utilities, account for the biggest share of expenditure each month. At the same time, consumers’ growing demand for convenience means they are increasing their discretionary spend. Dining out is a key growth area. According to Nielsen’s Consumer and Media View, one in five Filipinos eat at fast-food restaurants at least once a week. Shoppers also have an appetite for on-the-go products. Nielsen data shows that beverages, confectionery and snacks, and prepared cooking/food are some of the top purchased items in the FMCG category in 2018.
SPENDING PRESSURES AHEAD In recent years, Filipinos have been happy to part with their spare cash. Household expenditure increased by 5.8% in 2017. However, growing pressures may begin to influence future spending. Between 2016 and 2017, inflation almost doubled as higher oil prices, a weaker Peso and adverse weather caused cross-sector price hikes. Recent changes to the tax system could further impact consumption habits. The introduction of the Tax Reform for Acceleration and Inclusion (TRAIN) in January 2018 increased levies on fuel, cars and sugar-sweetened beverages. These costs are already being passed onto consumers. Nielsen data shows that during the first three months of 2018, local stores raised the prices of six sugar-based categories by an average of 13.8%. Against this backdrop, consumers could start to shift to lower-priced options or alternatives. It will be important to watch the impact of these changes in the year ahead.
RETAIL LANDSCAPE The Philippines is home to some of the world’s most connected consumers, but this is yet to translate into online sales. Filipinos still prefer to visit local stores to meet their shopping needs.
WHAT’S HAPPENING OFFLINE?Long commutes and busy lives mean time-strapped Filipinos choose to shop close to where they work or live. Convenience stores are fast becoming the preferred option for on-the-go consumers. According to the Nielsen Consumer and Media View, 68% of consumers had visited a convenience store in the past four weeks in 2017, up from 40% in 2015. Supermarkets are also growing in popularity as consumers increasingly look for one-stop-shop experiences, with value growth up 6.2% in 2017. Today, modern trade accounts for 58% of retail sales. At the same time, Filipinos continue to shop at the millions of neighborhood sari-sari stores and market stalls. In the first three months of 2018, traditional trade accounted for 39% of retail purchases.
6.9%
4.2%
-6.6%
Traditional Trade On PremiseModern Trade
WHAT’S HAPPENING ONLINE?Online grocery is still in its infancy in the Philippines. Nielsen’s 2018 Shopper Trends report shows just 3% of consumers bought groceries online in the past six months. Concerns about product quality is the top reason shoppers avoid e-commerce purchases. Other factors include the inability to look at products before they buy, additional charges and dissatisfaction about the selection of available items. With so many purchase barriers, the online retail landscape is unlikely to significantly change in the short term. Nielsen data shows that 86% of consumers do not plan to buy groceries online in the next six months. However, if China is any indicator, the emergence of a dominant e-commerce retailer could quickly change the landscape.
HOW TO WIN HARNESS PURCHASE DRIVERSIn a digital-led landscape, the fastest way to get products in front of consumers is through social media. Celebrity endorsements hold huge sway over Filipinos, particularly if promotions involve NBA stars. At the same time, discounts are popular with shoppers, with buy one, get one free offers an important tool to nudge them towards purchase. Pricing will only become more important as TRAIN comes into effect throughout 2018. A robust promotion and pricing strategy will be key to success.
LOOK BEYOND MAJOR CITIESLooking ahead, urbanization will rapidly spread across the Philippines.
Megacities such as Manila will experience 14% population growth by 2025. Yet mid-tier cities will experience even faster urbanization – cities with between 1 and 5 million people will grow 36% over the same period, while those with 550,000 to 1 million people will grow 31%. For Chinese businesses, focusing on mid-tier cities could provide opportunities for more sustainable returns.
DEVELOP TARGETED STRATEGIESWith more than 7,000 islands and complex or incomplete infrastructure networks, the Philippines can create distribution and logistics headaches. Building economies of scale is often a major challenge. To win in this fragmented market, Chinese businesses must develop targeted retail strategies. Sales and distribution analytics are essential for prioritizing geographical areas or stores that will lead to the best returns.
Egypt is experiencing an economic renaissance as it starts to bounce back from political upheaval between 2011 and 2014. After years of stagnant growth, GDP expanded 4.95% in 2017. Looking ahead, macroeconomic indicators remain positive, with GDP expected to reach 5.7% by 2019. As Egypt continues to recover, it will offer significant growth opportunities for overseas businesses.
Today, Egypt is home to 94 million people – the largest population in North Africa and the Middle East. But it is set for even more growth. Between 2015 and 2025, its population is expected to expand by 18.8% to hit more than 111,400 million. Digital technology continues to spread across the country. Overall, 29% of the total population and 69% of urban consumers have access to the internet. Approximately 65% own a mobile device. Social media penetration is also strong, with 68% of internet users now active on social platforms.
POPULATION
2015 2025
93.778 MILLION 111.471 MILLION
56.9%
43.1%
55.0%
45.0%
RURAL RURAL
URBAN URBAN
53.3M 61.3MM
40.4M 50.1MM
Source: United Nations
+17.6M (+18.8%)
The recent economic rebound is fuelling a positive spending outlook. Throughout 2017, consumer confidence continued to climb, reaching 85 on the Consumer Confidence Index in Q1 2018. At the same time, consumers remain price conscious, keeping promotions and value for money products top of mind. Chinese businesses must target young consumers, fine-tune their pricing strategies and focus on discount stores if they are to win in Egypt’s quickly growing, yet cost-conscious market.
As inflation eases in Egypt, consumers are increasingly able to open their wallets to products and categories beyond day-to-day essentials, restoring some growth in the market.
While early indicators point to more favorable FMCG spend, consumers will be reticent to adjust the shopping habits they have adopted over the past year, with their decision-making process still firmly rooted in price, closely followed by quality and brand.
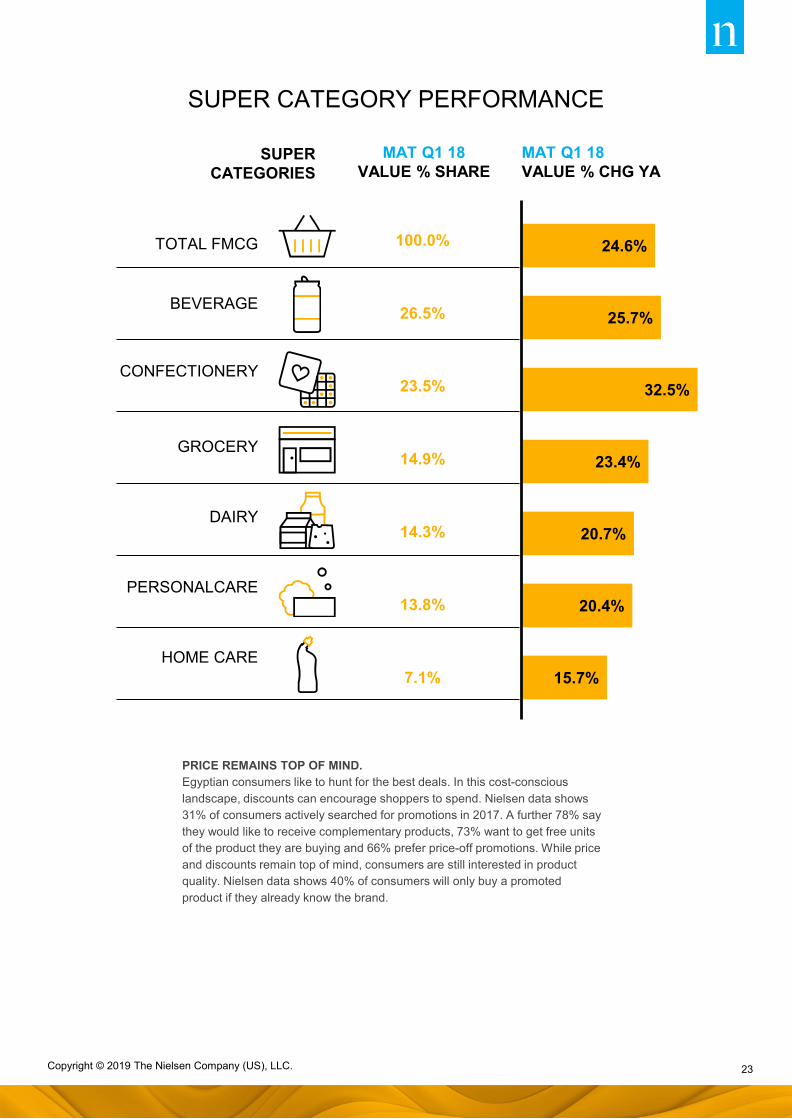
CONSUMERS INCREASE ESSENTIAL SPENDING. Amid growing economic stability, consumer optimism is growing. In Q1 2018, inflation fell to 11.6% – its lowest level since 2016. Against this backdrop, household consumption is expected to grow by 3.3% in 2018/19. Consumers are focusing attention on essential categories. Nielsen data shows FMCG purchase volumes increased 4.6% in Q1 2018, with groceries, confectionery and beverages experiencing the highest value growth over this period. These categories now collectively account for 64.9% of the total FMCG value share, up from 57.5% in the previous quarter.
CONSUMER TRENDS
13.1%
34.8%
2.5% 3.7%
11.5%
29.8%
36.4% 37.8% 36.9%
19.3%5.9%
-10.2%
6.0% 3.1%
-6.2%-14.8%
-15.5% -15.2%
-5.8%
4.6%19.1%
24.6%
8.5%6.8% 5.3%
14.9%
20.8%22.7%
31.1%
23.9%
Unit Value Growth Volume Growth Nominal Value Growth
PRICE REMAINS TOP OF MIND.Egyptian consumers like to hunt for the best deals. In this cost-conscious landscape, discounts can encourage shoppers to spend. Nielsen data shows 31% of consumers actively searched for promotions in 2017. A further 78% say they would like to receive complementary products, 73% want to get free units of the product they are buying and 66% prefer price-off promotions. While price and discounts remain top of mind, consumers are still interested in product quality. Nielsen data shows 40% of consumers will only buy a promoted product if they already know the brand.
Ongoing price pressures have fuelled a boom in discounting stores. While technology is yet to transform behaviors, online shopping is poised for significant growth.
WHAT’S HAPPENING OFFLINE? With consumers prioritizing price and promotion, Egypt is experiencing a golden era of discount stores. Nielsen data shows that between 2016 and 2018, the number of shoppers that visited discounters to buy their groceries increased from 23% to 43%. Cost-conscious shoppers also favor local stores, with Nielsen data revealing that traditional trade accounted for 69% of sales in Q1 2018. Alongside this trend, shoppers are increasing the frequency of visits to local stores for top-up purchases. Modern trade accounts for just 11.4% of FMCG sales, but it is expanding rapidly. According to Nielsen’s FMCG Pulse Report, sales in modern formats grew more than 26% between 2016 and 2017.
RETAIL LANDSCAPE
DETERGENT SHOPSTRADITIONAL TRADE
TOTAL FMCG SUPERMARKET/KEY ACCOUNT
HABERDASHERIES-MEKLA-KIOSKS CATERING (OUT OF HOME)
WHAT’S HAPPENING ONLINE? The potential for e-commerce in Egypt is immense. However, just 8% of internet users currently shop online. Looking ahead, this means there is significant growth potential to be realized. Apparel and electronics are emerging as important online categories, but grocery sales are also expanding. Growing connectivity will fuel this trend. Between 2015 and 2025, the proportion of consumers who have access to the internet will nearly double to hit 68%.
HOW TO WIN TARGET YOUTHEgypt is home to a very young consumer market – 34% of the population is younger than 15 years old, and 27% is aged between 15 and 29 years old. These rising consumers will soon control the majority of the spending power in Egypt. They will be key to the country’s continued economic resurgence. Chinese businesses must appeal to younger consumers’ needs with novel, yet relevant, product innovations and brand messages.
FINE-TUNE YOUR PRICING STRATEGYWhile there are strong opportunities for Chinese companies in Egypt, a robust pricing strategy will be key to success. Nielsen research shows 26% of consumers are looking to move to cheaper imported products to protect their wallets. Chinese businesses will need to prioritize smart positioning that is focused on showing value for money if they are to entice consumers away from local brands.
PRIORITIZE DISCOUNTINGPromotions and discounts hold heavy sway over Egypt’s cost-conscious shoppers. To win in this market, channel strategies must focus on discount stores. At the same time, Chinese businesses must not overlook modern formats. Here, promotional tactics and discounts will be key to encouraging increased traffic and appealing to consumer demand for value for money products.
TAMER EL ARABY Managing Director,Nielsen North Africa& Levant
As the largest economy in Southeast Asia, Indonesia is a land of opportunities. Its economic picture has remained strong, with GDP expanding 5.1% in 2017. This buoyant mood has fuelled a consumption boom and Indonesia is now home to some of the region’s most optimistic shoppers. In Q1 2018, the market reached 127 on the Consumer Confidence Index, against an Asia Pacific average of 115.
MARKET OVERVIEW
INDONESIA
COUNTRY HIGHLIGHTS
4.9 5.0 5.0 5.1 5.2 5.1
3.3 3.64.2 3.8 3.5 3.4
Q4 2016 Q1 2017 Q2 2017 Q3 2017 Q4 2017 Q1 2018
GDP (% change pa) Inflation, consumer prices (% change pa)
Source: United Nations, Urbanization Prospects (2014)
+26.30M (+10.3%)
Looking ahead, rapid population growth will continue to transform the market. Indonesia is already the fourth most populous country in the world, but its population is expected to grow by more than 10% between 2015 and 2025 to exceed 282 million. The market is also rapidly urbanizing, with the proportion of city dwellers increasing from 54% to 60% over this period.
At the same time, Indonesians have been quick to adopt new technologies. According to Nielsen data, 45% of consumers were connected to the internet in 2017, up from 20% in 2013. Indonesia is also a mobile-first society, with 78% of consumers accessing the internet through their smartphones. Alongside this trend, Indonesia is experiencing a social media boom, with 87% of consumers using social platforms to chat with friends and keep up with the latest news and trends.
Against this backdrop, the retail landscape is undergoing a transformation, with consumers increasingly turning their attention to e-commerce sites. Nielsen data shows that 38% of Indonesian internet users are now also online shoppers. At the same time, however, it is important to not overlook offline tactics. To thrive in this market, Chinese businesses must appeal to middle class consumers, focus on traditional channels and embed localized strategies with tailored messages and products.
Indonesian consumers are big savers, but they are also willing to splash out. Overall, the consumption outlook remains favorable, with food and beverage purchases a top spending priority.
A BUOYANT CONSUMPTION OUTLOOKIndonesia is home to some of the world’s most optimistic consumers. This buoyant mood means shoppers are increasing their spend. Across all socioeconomic groups, Nielsen Consumer Panel Data shows that overall consumption grew by 11% between 2016 and 2017 across 76 FMCG categories. In terms of the top areas where Indonesians are spending their disposable income, a recent Nielsen survey found that despite two thirds of consumers putting part of their disposable income into savings, 44% also plan to spend spare cash on holiday and vacation. Dining out is also a growing area, with visits to coffee shops and fast-food restaurants increased by 19% between 2015 and 2017. Differentiation will be key to encouraging consumers to loosen their purse strings.
FOOD AND BEVERAGE IS A SPENDING PRIORITY Indonesia is home to a thriving FMCG market, with sales reaching $25.4 billion in 2017. F&B purchases are important growth drivers. Nielsen data shows both foods and beverages each accounted for a 35% share of FMCG sales during Q1 2018, with growth at 2.1% and 1.1% respectively. Cooking condiments, instant foods, and snacks and confectionery are frequent food favorites, while diary-based drinks and tea and coffee dominate beverage sales. In recent years, consumers have also turned their attention to ready-to-drink beverages. Consumers continue to look for new tastes and products, and prioritize the price, promotions and availability when making purchases.
The spread of the internet is changing consumption patterns in Indonesia. But while shoppers have started to spend more online, offline purchases continue to dominate the retail landscape.
What’s happening offline?
Indonesian consumers’ need for convenience means they prefer to shop locally and frequently. Traditional trade remains an important element of purchases, with consumers making frequent trips to wet markets, vegetable vendors and traditional grocery stores each week, however growth is relatively stable at 0.2% in Q1 2018. Modern formats are driving growth, as they account for 43% of retail sales with growth of 3%. Against this backdrop, larger formats have started to fall out of favor. As shoppers prioritize proximity, efficiency and simplicity, visits to hypermarkets have declined.
RETAIL LANDSCAPE
GENERAL TRADE MODERN TRADE
57%
43%
TOTAL INDONESIA-CHANNEL PERFORMANCEVALUE CONTRIBUTION AND GROWTH – MAT Q1-2018
WHAT’S HAPPENING ONLINE?
Digital connectivity has started to transform shopping behavior. According to Nielsen Indonesia’s Bricks and Clicks Survey, $5.5 billion was spent online in 2016. Consumer electronics and travel were the top categories, contributing to more than 50% of the total online shopping market value. Consumers also visit e-commerce sites to buy fashion and sportswear as well as IT and mobile products. At the same time, consumers are increasingly buying household purchases online. Online FMCG sales increased by 47% between 2016 and 2017 to hit $11.7m. Skincare products, cosmetics, soaps, diapers and perfume were the top products purchased. However, Indonesians are still hesitant to purchase groceries online. In 2017, just 1% of F&B sales were made through e-commerce sites.
HOW TO WIN EMBED LOCALIZED STRATEGIESDistribution will be key to winning in Indonesia. The islands of Java and Sumatra are key markets, contributing 80% of the country’s GDP. But Chinese companies should not rule out potential elsewhere. Despite Sulawesi making up only 6% of GDP, it’s 7% growth rate is currently the fastest of all Indonesian islands. Understanding the consumption patterns in each local area, and tailoring messaging and products will be critical to success.
APPEAL TO MIDDLE CLASS CONSUMERS As Indonesia’s middle class population balloons, demand will continue to rise for more premium and convenient products and services. Strategies should focus on the upper-middle class consumer base and the future growth potential of this target segment. We expect high quality products that deliver convenience in terms of packaging or benefits, like instant drink or cooking mixes and easy-open or single-serving packaging, will continue to perform well with Indonesia’s increasingly sophisticated consumers.
FOCUS ON TRADITIONAL CHANNELSIndonesia is home to one of the world’s most digitally savvy populations, but the retail market has been slow to modernize. Indonesian consumers continue to shop primarily in the offline world, with 57% of all sales coming from traditional trade. Small groceries and traditional vendors remain the preferred shopping channels. In 2017, Indonesians made an average of four times as many trips to traditional retail than modern trade stores. A targeted distribution approach will be key to winning in Indonesia’s developing retail landscape.
WHAT’S NEXT?The Belt and Road Initiative means there has never been a better time for Chinese businesses to bring their brands, products and services to global markets. Each new trade route will unlock thousands of new consumers and offer unparalleled opportunities for growth.
In Indonesia, businesses can capitalize on a rapidly growing population of nearly 300 million people, while the Philippines provides the chance to connect with Asia’s most optimistic shoppers. In Egypt, there are opportunities to win over a new generation of young, rising consumers. And as Turkey’s GDP growth outstrips that of all other Asian markets, brand owners can benefit from substantial returns.
But Chinese companies must create robust strategies if they are to win in this new landscape. Each market along the B&R initiative will present unique consumer attitudes and behaviors. With so many opportunities, businesses must take a targeted approach. Deep-dive analytics will be key to understanding local preferences and trends, and which marketing strategies will lead to the best return on investment.
Nielsen is committed to helping companies maximize the opportunities created by B&R. As the world's leading performance measurement and data analytics company, our network covers the majority of countries along B&R corridors. Drawing on 96 years of experience, our research and multi-platform solutions offer insights on local consumer preferences and buying behaviors.
Together, Nielsen and Chinese brands can capitalize on the B&R opportunity, and drive business success and sustainable growth for years to come.
ABOUT NIELSENNielsen Holdings plc (NYSE: NLSN) is a global measurement and data analytics company that provides the most complete and trusted view available of consumers and markets worldwide. Our approach marries proprietary Nielsen data with other data sources to help clients around the world understand what’s happening now, what’s happening next, and how to best act on this knowledge. For more than 90 years Nielsen has provided data and analytics based on scientific rigor and innovation, continually developing new ways to answer the most important questions facing the media, advertising, retail and fast-moving consumer goods industries. An S&P 500 company, Nielsen has operations in over 100 countries, covering more than 90% of the world’s population. For more information, visit www.nielsen.com.