August 13, 2014 China SECTOR RESEARCH | SEE PAGE 62 FOR IMPORTANT DISCLOSURES AND ANALYST CERTIFICATIONS Chinese Wind Power Time to set sail Initiate coverage of wind power sector at OVERWEIGHT. Build-out of Ultra High Voltage (UHV) transmission network lays ground for a multi-year bull case for the sector. Sector trading at ~0.52x PEG. Share price weaknesses due to low wind speeds and concerns over higher maintenance costs provide excellent long-term buying opportunity. Favour Huaneng Renewables and China Longyuan, due to high capacity growth, stronger balance sheet, and both are key beneficiaries of the UHV transmission build-out. Favourable policies to support the sector Low utilization hours due to weak wind speeds in 1H14 and concerns about wind tariff cuts are already priced in, in our view. Recommend investors to look past the near-term volatility and focus on the structural growth story of the Chinese wind power industry, including UHV transmission cable build-out and more strategic approvals of wind power projects. We estimate the UHV transmission line development could help lower wind curtailment from 10.7% in 2013 to 8.2% in 2015E upon completion, helping to transmit wind electricity from Hebei, Gansu and Inner Mongolia to southern or eastern China. Even if wind tariffs are cut, we estimate the average IRR of wind power assets of three companies is attractive at around 14.7%. Furthermore, the two recent batches of wind project pre- approvals are mainly in regions with a low wind curtailment ratio and higher utilization hours. We expect wind farm operators’ asset quality will keep improving to induce higher profitability. We also forecast the average earnings CAGR for the three companies will be a robust 39% (from 2013 to 2016E) on the back of a strong pipeline of pre-approved projects. Time to board Share prices of wind farm operators have declined ~25% on average YTD. The sector is trading at around 0.52x PEG (a two- year low). We recommend investors to OVERWEIGHT the sector. Our Top Picks are Huaneng Renewables (958 HK, TP HKD3.50) and China Longyuan (916 HK, TP HKD11) as the development of power transmission lines across China will first benefit these two companies. Robust capacity growth for Huaneng Renewables and stronger balance sheet for Longyuan are also among our considerations. Datang Renewable (TP: HKD1.10), HOLD, due to large exposure to high wind curtailment regions. Analysts One year share price performance Source: Maybank KE, Note: total market cap. of three wind operators under our coverage. Maybank vs Market - Longyuan Power Maybank vs Market - Huaneng Renewables Maybank vs Market – Datang Renewable (New) OVERWEIGHT Ricky WK Ng, CFA (852) 2268-0689 [email protected]Jessica Ng (852) 2268-0678 [email protected]-30% -20% -10% 0% 10% 20% 30% 60,000 70,000 80,000 90,000 100,000 110,000 120,000 130,000 140,000 Jul 13 Oct 13 Jan 14 Apr 14 Jul 14 Total market cap. of wind developers (LHS) Relative to HSCEI (RHS) Positive Neutral Negative Market Recs 17 3 1 Maybank Consensus % +/- Target Price (HKD) 11.00 9.70 13.4 '14 PATMI (CNYm) 3,380 2,927 15.5 '15 PATMI (CNYm) 3,926 3,714 5.7 Source: FactSet; Maybank Positive Neutral Negative Market Recs 15 2 1 Maybank Consensus % +/- Target Price (HKD) 3.50 3.37 4.0 '14 PATMI (CNYm) 1,274 1,124 13.4 '15 PATMI (CNYm) 1,729 1,654 4.5 Source: FactSet; Maybank Positive Neutral Negative Market Recs 3 4 5 Maybank Consensus % +/- Target Price (HKD) 1.10 1.15 (4.4) '14 PATMI (CNYm) 205 146 39.9 '15 PATMI (CNYm) 553 344 60.8 Source: FactSet; Maybank Stock Mkt cap Rating Price TP Upside 3 years PEG (x) (USD'm) (LC) (LC) (%) 14E 15E 14E 15E 14E 15E EPS CAGR 14E China Longyuan 8,563.9 Buy 8.26 11.00 33 15.7 13.4 1.5 1.4 1.2 1.4 31% 0.50 Huaneng Renewables 3,040.3 Buy 2.61 3.50 34 13.9 10.3 1.2 1.1 1.5 2.0 34% 0.41 Datang Renewable 1,107.3 Hold 1.18 1.10 (7) 33.3 12.3 0.7 0.7 0.3 0.7 52% 0.64 P/E (x) P/B (x) Dividend yld (%)
Transcript
August 13, 2014
Chin
a SE
CTO
R R
ESEA
RC
H |
SEE PAGE 62 FOR IMPORTANT DISCLOSURES AND ANALYST CERTIFICATIONS
Chinese Wind Power Time to set sail Initiate coverage of wind power sector at OVERWEIGHT.
Build-out of Ultra High Voltage (UHV) transmission network lays ground for a multi-year bull case for the sector.
Sector trading at ~0.52x PEG. Share price weaknesses due to low wind speeds and concerns over higher maintenance costs provide excellent long-term buying opportunity.
Favour Huaneng Renewables and China Longyuan, due to high capacity growth, stronger balance sheet, and both are key beneficiaries of the UHV transmission build-out.
Favourable policies to support the sector Low utilization hours due to weak wind speeds in 1H14 and concerns about wind tariff cuts are already priced in, in our view. Recommend investors to look past the near-term volatility and focus on the structural growth story of the Chinese wind power industry, including UHV transmission cable build-out and more strategic approvals of wind power projects.
We estimate the UHV transmission line development could help lower wind curtailment from 10.7% in 2013 to 8.2% in 2015E upon completion, helping to transmit wind electricity from Hebei, Gansu and Inner Mongolia to southern or eastern China. Even if wind tariffs are cut, we estimate the average IRR of wind power assets of three companies is attractive at around 14.7%.
Furthermore, the two recent batches of wind project pre-approvals are mainly in regions with a low wind curtailment ratio and higher utilization hours. We expect wind farm operators’ asset quality will keep improving to induce higher profitability. We also forecast the average earnings CAGR for the three companies will be a robust 39% (from 2013 to 2016E) on the back of a strong pipeline of pre-approved projects.
Time to board Share prices of wind farm operators have declined ~25% on average YTD. The sector is trading at around 0.52x PEG (a two-year low). We recommend investors to OVERWEIGHT the sector. Our Top Picks are Huaneng Renewables (958 HK, TP HKD3.50) and China Longyuan (916 HK, TP HKD11) as the development of power transmission lines across China will first benefit these two companies. Robust capacity growth for Huaneng Renewables and stronger balance sheet for Longyuan are also among our considerations. Datang Renewable (TP: HKD1.10), HOLD, due to large exposure to high wind curtailment regions.
Analysts
One year share price performance
Source: Maybank KE, Note: total market cap. of three wind operators under our coverage.
Source: Bloomberg, Maybank Kim Eng Source: Bloomberg, Maybank Kim Eng
0
500
1,000
1,500
2,000
2,500
2012 2013 2014E 2015E 2016E
hoursLongyuan Huaneng Renewables Datang Renewable
8%
10%
12%
14%
16%
18%
20%
22%
2012 2013 2014E 2015E 2016E
Longyuan Huaneng Renewables Datang Renewable
0
3
6
9
12
15
18
Dec 09 Jun 11 Dec 12 Jun 14 Dec 15
24x
HKD
20x
16x
12x
8x
0
1
2
3
4
5
6
7
8
Jun 11 Dec 12 Jun 14 Dec 15
25x
HKD
20x
15x
10x
5x
Build-out of the UHV transmission grid will help lower wind curtailment rates and improve utilization hours in the long run, laying the ground for a structural bull story for the China wind power sector.
August 13, 2014 4
Chinese Wind Power
OVERWEIGHT wind power sector Wind farm operator stocks outperformed the market in 2013 but underperformed in 1H14. We believe the main reason for the share price decline in 1H14 was the lower wind speeds and the higher benchmark in 2013. Wind speeds in May 2014 improved slightly. Although wind speed is always unpredictable, the development of the wind power market is actually becoming more favourable for the Chinese operators. There are three reasons:
1) Power transmission grids are improving, and this will increase utilization hours and lower the wind curtailment ratios in the long run.
2) More strategic plan for wind power capacity growth.
Huaneng Renewables & Longyuan will benefit earlier; We expect both will record strong utilization hours
We like Huaneng Renewables and Longyuan as we expect a power transmission project will be commissioned this year to transmit wind electricity from the Zhangbei wind bases in Hebei province. As 8.2% of Longyuan’s total capacity and 4.4% of Huaneng Renewables’ were in Hebei at end-2013, we believe the two companies will benefit more.
We believe there are two major factors structurally impacting the utilization hours of companies: curtailment ratios and the location of new capacities. For curtailment ratios, we believe the UHV cable layout could help lower them. For example, we estimate the Zhangjiakou cable in Hebei could help lower Huaneng Renewables’ curtailment ratio by 1.7ppt in 2014E. As for the location of new capacities, we calculate the breakdown of the pre-approvals of the 3rd (2013) and 4th (2014) batches of capacities. Based on this, we calculate the improvement in utilization hours for the three companies as the new pre-approved capacities are generally located in regions with higher IRRs and utilization hours. Our base case scenario is that the new capacities will be located proportionally similar to the proportion of pre-approval. Our bull case scenario is that all new capacities will be located in the 10 regions (based on the proportion of pre-approval) with highest IRRs whilst the bear case scenario is that all new capacities will be located in the 10 regions with lowest IRRs.
Figure 6: Transmission lines could help reduce curtailment ratios
Commissioning Capacity breakdown (2013) Curtailment ratio decrease
(ppt changes) Transmission cables Start End kV Capacity date LY HR DR LY HR DR Zhangjiakou 500kV Hebei North
China 500 1,800 2014 8.2% 4.4% 0.9% 1.45 1.71 0.14
0.00 Huaidong - Sichuan DC Xinjiang Sichuan 1,100 10,000 2015
Jiuquan-Hunan DC Gansu Hunan 800 8,000 2016 8.7% 0.0% 6.9% 1.53 0.00 0.86 Source: Maybank Kim Eng Note: Assumes curtailment ratio in the region will be reduced by 70% with the new UHV lines become commissioned.
We believe the utilisation hours of the three companies will increase as we expect a fall in curtailment ratios and the possibility of more new capacities located in regions with higher IRRs.
August 13, 2014 5
Chinese Wind Power
Figure 7: Curtailment ratios by company
Source: Maybank Kim Eng
Figure 8: LY – estimated changes in utilisation hours due to possible new project locations
With more UHV transmission cables to help export the excess power, we expect the curtailment ratios of the companies will decrease in FY14E-16E.
In the base case scenario, we estimate Huaneng Renewables will have the highest improvement in utilisation hours in FY14-15E based on both curtailment ratio improvement and possible better project locations.
August 13, 2014 6
Chinese Wind Power
We forecast an average three-year 39% EPS CAGR
This is on the back of a strong new capacity pipeline and we forecast the three companies’ average capacity CAGR (2013 to 2016E) will reach 17%. Of the three, we expect Huaneng Renewables to achieve the highest cumulative capacity CAGR of 23% from 2013 to 2016E, as it received lots of project pre-approvals in the 3rd and 4th batches. We forecast HR’s new-build installed capacity will grow ~2000MW in 2014, compared to ~1900MW for Lonyuan and ~600MW for Datang Renewable.
Figure 16: DR’s EPS and core EPS growth forecasts Figure 17: DR - cumulative installed capacity
Source: Maybank Kim Eng Source: Maybank Kim Eng
0.0
0.1
0.2
0.3
0.4
0.5
0.6
0.7
2013 2014E 2015E 2016E
CNY
3 years CAGR = 31%
0
4,000
8,000
12,000
16,000
20,000
2013 2014E 2015E 2016E
MW
3 years CAGR =15.2%
0.0
0.1
0.1
0.2
0.2
0.3
0.3
2013 2014E 2015E 2016E
CNY
3 years CAGR = 34%
0
4,000
8,000
12,000
16,000
2013 2014E 2015E 2016E
MW
3 years CAGR =23.2%
0.00
0.02
0.04
0.06
0.08
0.10
0.12
0.14
2013 2014E 2015E 2016E
CNY
3 years CAGR = 52%
0
4,000
8,000
12,000
2013 2014E 2015E 2016E
MW
3 years CAGR =11.2%
We forecast Huaneng Renewables will have the highest three-year CAGR in terms of capacity.
August 13, 2014 7
Chinese Wind Power
Power transmission grid improving in China Wind curtailment, due to a shortage of UHV transmission lines, has been a key bottleneck to development of the wind power industry in China since 2011. In 2013, the National Energy Administration (NEA) of China estimates the wind curtailment rate was as high as 10.7%, significantly above its global peers of less than 4% on average. To tackle this wastage, the State Grid Corp of China will invest CNY1.2t in the UHV transmission build-out from 2013 to 2020.
With better grid infrastructure, we expect the curtailment ratio to improve in regions such as Hebei, Gansu and Inner Mongolia. There will be an improvement in Hebei province in 2015 as three electricity transmission channels will connect the Zhangjiakou (Zhangbei) region to the North China grid in Beijing, Tianjin and Tangshan. This project is expected to be commissioned by the end of this year and will increase the wind power transmission capacity by 1,800MW when completed.
In addition, for Gansu, Xinjiang and Inner Mongolia, we expect the State Grid’s UHV construction plan can help transmit wind power. We estimate there are eight upcoming transmission projects that will benefit wind operators. Long-distance transmission cables can help transmit wind power generated in high curtailment regions to other provinces. These projects are expected to be commissioned after 2015.
In early 2014, the NEA included the construction of transmission lines as among the top priorities in its Air Pollution Prevention and Control Plan in the energy sector. The plan aims to add 2GW of transmission capacity to the Beijing, Tianjin and Hebei regions by the end of 2015. The government has proposed adding a total of 68GW of transmission capacity by the end of 2017: 41GW in Beijing, Tianjin and Hebei, 22GW in the Yangtze River Delta and 5GW in the Pearl River Delta.
Wind curtailment could improve in long run With more and more projects located in the southern provinces and the planned UHV lines, we expect the grid curtailment ratio will improve gradually. In the short term, we expect to see a similar level of utilization hours in 2014 as compared with 2013, or maybe a slight decline as indicated by 1H14 utilization hours. However, we expect once UHV cables commence, the utilization hours will improve structurally. We forecast the grid curtailment ratio will decrease over the long run.
Figure 18: China wind curtailment ratio (2011-2016E) Figure 19: Global wind curtailment ratio (2013)
Source: NEA, China Renewable Energy Engineering Institute, Maybank Kim Eng Securities
Source: China Renewable Energy Engineering Institute, National Renewable Energy Laboratory, Maybank Kim Eng, Note: * only 2012 data is available
0%
2%
4%
6%
8%
10%
12%
14%
16%
18%
2011 2012 2013 2014E 2015E 2016E0%
2%
4%
6%
8%
10%
12%
China US * Spain * UK Italy * Denmark
We expect the curtailment ratios in Hebei, Gansu and Inner Mongolia will improve with UHV transmissions.
August 13, 2014 8
Chinese Wind Power
Figure 20: China high voltage transmission line construction map
Source: various sources, State Grid, South China Power Grid, National En, Maybank Kim Eng
Figure 21: China transmission projects that will transmit wind power
# Transmission line Start End Voltage
(kV)Length
(km)
Transmission capacity
(MW) Status
Const-ruction
start date
Oper-ational
date
Expected operation
date
1a Jindongnan-Nanyang-Jinmen AC Shanxi Hubei 1,000 640 2,800 Operational Aug 2006 Jan 2009 -1b Jindongnan-Nanyang-Jinmen AC Shanxi Hubei 1,000 - 2,200 Operational Jan 2011 Dec 2011 -2 Xiangjiaba – Shanghai HVDC Sichuan Shanghai ±800 1,980 6,400 Operational Dec 2007 Jan 2009 -3 Yunnnan – Guangdong HVDC Yunnan Guangdong ±800 1,438 5,000 Operational Dec 2006 Jun 2010 -4 Jinping – Sunan DC Sichuan Jiangsu ±800 2,090 7,200 Operational Dec 2009 Dec 2012 -5 Huainan –Shanghai UHV AC Anhui Shanghai 1,000 656 5,000 Operational Sep 2011 Aug 2013 -6 Nuozhadu-Guangdong HVDC Yunnan Guangdong ±800 1,451 5,000 Operational Dec 2011 Sep 2013 -7 Xiluodu-Guangdong HVDC project Yunnan Guangdong ±800 1,286 6,400 Operational Dec 2011 Oct 2013 -8 Hami - Zhengzhou UHVDC Xinjiang Henan ±800 2,300 7,500 Operational May 2012 Jan 2014 -9 Xiluodu-Zhejiang Jinhua UHV DC Sichuan Zhejiang ±800 1,653 8,000 Operational Jul 2012 Jul 2014 - Total (operating) 13,494 55,500
10 Zhangjiakou 500kV* Hebei North China 500 - 1,800 Constructing Apr 2014 - 201411 Huainan-Nanjing-Shanghai AC Jiangsu Shanghai 1,000 780 5,000 Constructing Jun 2014 - 201612 Ningdong-Zhejiang DC Ningxia Zhejiang ±800 1,720 8,000 Approved - - 201513 Jiuquan-Hunan DC Gansu Hunan ±800 2,400 8,000 Approved - - 201614 Ximeng -Shandong Jinan 1000kV AC IM East Shandong 1,000 1,146 9,000 Approved - - 201715 Hami - Chongqing DC Xinjiang Chongqing ±800 2,300 8,000 Pending - - 201516 Huaidong - Sichuan DC Xinjiang Sichuan ±1100 2,645 10,000 Pending - - 201517 Ordos Shanghai Miao-Shandong DC IM West Shandong ±800 1,200 8,000 Pending - - 201618 Ximeng – Jiangsu Taizhou DC IM East Jiangsu ±800 1,620 8,000 Pending - - 2017
19 Inner Mongolia West to Tianjin south AC IM West Tianjin 1,000 1,452 4,800 Pending - - 2017
20 Ximeng-Nanjing 1000kV AC IM East Jiangsu 1,000 2,838 9,400 Pending - - 2017 Total (constructing) 18,101 80,000Source: State Grid, news reports, NEA, Maybank Kim Eng Note: these projects mainly help with transmitting wind power to other provinces.* Not UHV as in definition. Kim Eng Securities
August 13, 2014 9
Chinese Wind Power
Strategic plan for wind power capacity growth Well-managed approvals Thanks to the centralized approval of projects since 2011, the pace of wind power generation installation has started to slow down. This is expected to allow grid infrastructure to catch up with renewable growth. As of 2013, the Chinese government has approved a total capacity of 134.3GW of projects — of which 77.6GW has been commissioned and connected to the grid and 56.7GW of projects are still under construction.
Better strategic choice of wind farm location We expect wind farm developers to continue to look for regions without high grid curtailment issues. We expect Huaneng Renewables to plan more projects in Guangdong, Yunnan, Guizhou and Sichuan as these areas do not suffer from curtailment problems. Also, advanced turbine technology can now help with development in low wind speed regions, such as some regions in Southern China, which could not be developed in the past. We also believe companies will wait for the commissioning of UHV transmission lines before embarking on aggressive developments.
Figure 22: China 12th FYP national wind pre-approved projects (2011-14)
Source: National Energy Administration, Maybank Kim Eng Securities
Figure 23: China cumulative wind project approvals as of 2013
Source: China Renewable Energy Engineering Institute, Maybank Kim Eng Securities
0
5
10
15
20
25
30
35
1st batch(Oct 2011)
2nd batch(Mar 2012)
3rd batch(Mar 2013)
4th batch(Feb 2014)
GW
47.862.7
77.6
33.9
44.0
56.7
0
20
40
60
80
100
120
140
160
2011 2012 2013
GW Commissioned and grid-connected Under construction
106.7
134.2
81.8
Better project locations in the pre-approval list of the 12th five-year plan will help increase the weighted average utilisation hours of the three companies in FY14E-16E, in our view.
August 13, 2014 10
Chinese Wind Power
Figure 24: China wind monthly power generation and YOY growth (2012-1H14)
Source: China Electricity Council, Maybank Kim Eng Securities
Figure 25: Grid-connected capacity and approved project pipeline by province (2013)
More projects approved by the NEA are now located in provinces with high utilisation hours and high IRRs.
August 13, 2014 11
Chinese Wind Power
IRR still decent despite potential tariff cut We believe the market is expecting wind power tariffs to be cut in 2014 or 2015 and share prices appear to have been reflecting this. However, even if tariffs are cut, we estimate the average IRR of wind power projects of three companies will remain attractive at around 14.7%. We expect new projects with an attractive IRR could still support the earnings growth of wind power developers.
The fixed feed-in tariff in 2009 based on four wind resource bases ranged from CNY0.51-0.61/kWh. We believe reduction in the feed-in tariffs will only happen in provinces with high IRRs, such as Fujian and Yunnan.
However, if tariffs are indeed cut, we expect this will only apply to new wind projects and there will be no impact to existing projects. Existing projects should still have a guaranteed fixed FiT (feed-in tariff) for the first 30,000 generation hours for wind and 20 years for solar. Also, in terms of the timeline, we believe there is a higher chance of wind feed-in tariffs being cut next year. As the renewable energy surcharge was raised last year from CNY0.008/kWh to CNY0.015/kWh, we believe this will allow the government to maintain the subsidy levels in 2014.
Source: National Energy Administration, NDRC, China Wind Energy Association, Maybank Kim Eng Note: Tables show the proportion of total capacity by company as end of 2013. Numbers in the provinces indicate utilisation hours in 2013 and percentages in the brackets are curtailment ratio in 1H14, according to the industry figures.
We expect tariff cuts for new projects in regions with high IRRs whilst we believe this will have limited impact on the overall portfolio IRRs of the three companies.
August 13, 2014 12
Chinese Wind Power
We estimate the onshore wind farm equity IRR to be 13% As the investment cost for wind power projects is relatively stable due to the steady price of wind turbines, we believe the major parameters to determine the equity IRR will be the utilization hours and feed-in tariffs. We estimate the onshore wind farm equity IRR to be 13% if we assumed utilization hours of 2,000 and a tariff of CNY0.58/kWh. We expect there is potential wind tariff cut in some regions with high IRRs. If we assume 10% cut in the five highest IRR regions, the average equity IRR of these regions will decrease from 25% to 19%, which remains decent in our view.
Figure 27: Weighted average equity IRR by company
Source: Maybank Kim Eng Note: Assume utilisation hours remain the same as 2013, 2014 new-build provincial breakdown comes from projects pre-approved in 3rd batch and 2015 new-build provincial breakdown comes from projects pre-approved in 4th batch.
Figure 28: China 1.5MW wind turbine bidding prices
Source: Maybank Kim Eng
0%
2%
4%
6%
8%
10%
12%
14%
16%
18%
Longyuan Huaneng Renewables Datang Renewable
2013 2014E 2015E
3,000
3,200
3,400
3,600
3,800
4,000
4,200
4,400
4,600
4,800
Q22010
Q32010
Q42010
Q12011
Q22011
Q32011
Q42011
Q12012
Q22012
Q32012
Q42012
Q12013
Q22013
Q32013
Q42013
Q12014
CNY/kW
We estimate the weighted average equity IRR of the three companies will increase with better project locations from FY13-15E.
August 13, 2014 13
Chinese Wind Power
Figure 29: Onshore wind farm equity IRR calculations Capacity 48 MW Utilisation hours 2,000 Tariff 0.58 CNY/kWh VAT rate 17% Investment cost 8,000 CNY/kW Capex 326.4 million VAT for capex 47.4 million Equity (20%) 76.8 million Bank Loan (80%) 307.2 million Interest rate 7.0% Construction period 12 months
We estimate the onshore wind project equity IRR is 13.2%, assuming tariff of CNY0.58/kWh and utilisation hours of 2,000 hours/yr.
August 13, 2014 14
Chinese Wind Power
New feed-in tariff for offshore wind projects could help boost installations Development of the offshore wind industry in China has been slow due to low profitability and high investment risks. We think it will be difficult to meet the government target of 5GW by 2015. China has commissioned around 428.6MW of offshore wind projects by the end of 2013, ~70% of which are intertidal projects. To speed up development, the NDRC recently introduced a fixed feed-in tariff of CNY0.75/kWh for intertidal projects and CNY0.85/kWh for near-shore wind farms. The new offshore tariff will only apply to projects that will be commissioned before 2017. From 2017 onwards, the government will adjust the tariff based on the construction costs at that time.
Figure 33: China commissioned offshore wind projects by type (2013)
Source: China Wind Energy Association, Maybank Kim Eng
We estimate the equity IRR will be around 12.7% for intertidal projects and 12.5% for near-shore projects. The equity IRR is lower than 13.2% of onshore wind farms, but still acceptable. However, equity IRR will be higher if projects are located in Shanghai as the Shanghai municipal government will give an additional subsidy of CNY0.2/kWh on top of the national subsidy for the first five years of operation. The Shanghai subsidy has an upper limit of CNY50m for each project annually.
Now that the government provides more certainty on the profitability of offshore projects with the fixed tariff, we expect to see more projects being announced this year. For example, we believe Longyuan has obtained approval for a total of 400MW of offshore wind projects in Nanri, Putian and Fujian in China. In the near term, we think this will benefit wind turbine manufacturers such as Goldwind (2208 HK, Not Rated), which has a good track record of large-scale turbines.
Figure 34: Comparison between onshore, intertidal and near-shore Onshore Intertidal Near-shore
Geographical description - Water depth 0-5m Water depth 5-30m National tariff (CNY/kWh) 0.51-0.61 0.75 0.85 Average utilisation hours 2,000 2,800 3,000 Investment costs (CNY/kW) 7,000-8,000 13,000-15,000 16,000-18,000 Construction period 12 months 12-18 months 18-24 months Equity IRR 13.2% 12.7% 12.5% Source: National Energy Administration, Maybank Kim Eng
intertidal70.1%
near-shore29.9%
We expect the new offshore feed-in tariff could help China meet its long-term target of 30GW in 2020.
August 13, 2014 15
Chinese Wind Power
Figure 35: Offshore (near-shore) wind farm equity IRR calculations Capacity 100 MW Utilisation hours 3,000 Tariff 0.85 CNY/kWh VAT rate 17% Investment cost 17,000 CNY/kW Capex 1,445 million VAT for capex 210.0 million Equity (20%) 340 million Bank Loan (80%) 1,360 million Interest rate 7.0% Construction period 12 months
We estimate the offshore wind project (near-shore) equity IRR is 12.5%, assuming investment cost of CNY 17,000/kW and utilisation hours of 3,000 hours/yr.
August 13, 2014 16
Chinese Wind Power
Figure 38: Offshore (intertidal) wind farm equity IRR calculations Capacity 100 MW Utilisation hours 2,800 Tariff 0.75 CNY/kWh VAT rate 17% Investment cost 14,000 CNY/kW Capex 1,190 million VAT for capex 172.9 million Equity (20%) 280 million Bank Loan (80%) 1,120 million Interest rate 7.0% Construction period 12 months
We estimate the offshore wind project (intertidal) equity IRR is 12.7%, assuming investment cost of CNY 14,000/kW and utilisation hours of 2,800 hours/yr.
August 13, 2014 17
Chinese Wind Power
Investment conclusion: Get on board Given the build-up of the UHV transmission network, we believe the sector is on track for a multi-year upcycle.
Furthermore, due to the lower utilization in 1H14 driven by low wind speeds, the sector has declined ~25% YTD, trading at a mere ~0.5x PEG. We recommend investors to OVERWEIGHT the wind power sector and for stock picks, prefer Huaneng Renewables and Longyuan over Datang Renewable, based on the following factors:
Exposure to wind curtailment area
Leverage on UHV network build-out
Capacity growth
Financial gearing
Longyuan Power (916 HK, BUY, TP: HKD11)
Forecast 64% EPS growth in 2014E.
Strongest balance sheet, we forecast 187% net gearing at end-FY14.
Coal-fired generation could help diversify wind speed uncertainties.
Huaneng Renewables (958 HK, BUY, TP HKD3.50)
Strong capacity growth, we forecast 32% growth in 2014 and 22% in 2015.
New transmission line helps wind curtailment ratio.
Improving asset quality as we expect more new projects in regions with high IRR.
Chance of share placement due to high capex.
Datang Renewable (1798 HK, HOLD, TP HKD1.10)
Relatively poor asset quality, we forecast the average curtailment rate will be 14.7% in 2014 due to high exposure to Jilin and Inner Mongolia.
We think asset quality will improve in 2017.
Weak balance sheet, we forecast net gearing reaching 421% at end 2014.
Figure 41: YTD share performance
Source: Bloomberg, Maybank Kim Eng
Figure 42: 12-month share performance
Source: Bloomberg, Maybank Kim Eng
-50%
-40%
-30%
-20%
-10%
0%
10%
Jan 14 Mar 14 May 14 Jul 14
Longyuan Huaneng RenewablesDatang Renewable Average
-60%
-40%
-20%
0%
20%
40%
60%
Jul 13 Oct 13 Jan 14 Apr 14 Jul 14
Longyuan Huaneng RenewablesDatang Renewable Average
The sector has declined ~25% YTD and we recommend investors to OVERWEIGHT the wind power sector.
August 13, 2014 18
Chinese Wind Power
Preference #1: prefer low exposure to high curtailment We prefer Longyuan and Huaneng Renewables as we forecast their wind curtailment ratios were low i.e. 10.4% and 9.1% in 2014E, compared with Datang Renewable’s 14.7% in 2014E. The reason is because Datang Renewable has the largest exposure to Jilin (11.3% of total capacity as of end-2013) and Inner Mongolia (43.8% of total capacity as of end-2013) where the curtailment ratios are high, especially 19.8% in Jilin in 1H2014 according to industry figures. Figure 43: Geographical distribution by company (2013)
Source: Maybank Kim Eng
Figure 44: Our forecast wind curtailment ratios by company
Source: Maybank Kim Eng Note: Assumes curtailment ratio in the region will be reduced by 70% with the new UHV lines become commissioned.
Figure 45: Our forecast wind utilisation hours by company
Source: Maybank Kim Eng
Figure 46: China wind power generation and national average wind utilisation hours (2009-16E)
Source: Historical: China Electricity Council, Forecast: Maybank Kim Eng
0%
20%
40%
60%
80%
100%
Longyuan HuanengRenewables
Datang Renewable
High grid curtailment regions Low grid curtailment regions
11.9GW 6.2GW 5.7GW
8%
10%
12%
14%
16%
18%
20%
22%
2012 2013 2014E 2015E 2016E
Longyuan Huaneng Renewables Datang Renewable
0
500
1,000
1,500
2,000
2,500
2012 2013 2014E 2015E 2016E
hoursLongyuan Huaneng Renewables Datang Renewable
1,500
1,600
1,700
1,800
1,900
2,000
2,100
2,200
0
50,000
100,000
150,000
200,000
250,000
300,000
2009 2010 2011 2012 2013 2014E 2015E 2016E
GWhPower generation Utilisation hours
We like Longyuan and Huaneng Renewables because of their smaller exposure to high curtailment regions.
August 13, 2014 19
Chinese Wind Power
Preference #2: prefer high exposure to future UHV grid We like Longyuan and Huaneng Renewables as we expect there will be a UHV export cable commissioned this year to export wind electricity from the Zhangbei wind bases in Hebei province. As Longyuan owns 8.2% of its total capacity in Hebei at the end of 2013, and for Huaneng Renewables 4.4%, we believe the two companies will benefit more than Datang Renewable.
Figure 47: Proportion of total capacity with future UHV transmission lines
Regions Commissioning date Longyuan Huaneng
Renewables Datang
RenewableHebei 2014 8.2% 4.4% 0.9%Xinjiang 2015 9.2% 3.2% 0.0%Gansu 2016 8.7% 0.0% 6.9%Inner Mongolia 2017 19.2% 27.6% 43.8%Source: National Energy Administration, Maybank Kim Eng
Figure 48: Wind power capacity breakdown (end of 2013) by company (MW)
We expect Longyuan and Huaneng Renewables will benefit most from the upcoming UHV transmission projects.
August 13, 2014 20
Chinese Wind Power
Preference #3: prefer higher capacity growth to support earnings growth We like Huaneng Renewables as it received lots of project pre-approvals in the 3rd batch and 4th batch. As a result, we forecast its new-build installed capacity will grow ~2000MW in 2014, compared to ~1900MW for Lonyuan and ~600MW for Datang Renewable.
Huaneng Renewables is catching up with Longyuan in terms of total capacity secured in the 4th batch of pre-approvals, while Datang Renewable has seen a declining amount of projects included in the latest batches of the national pre-approval list.
In terms of project location, all three companies were able to secure some pre-approvals in regions that are not subject to grid curtailment, such as Jiangsu, Fujian, Guizhou, Yunnan, Shanxi or Guangdong.
Figure 49: Wind pre-approval projects by province (MW)
Figure 50: New wind capacity forecast by company Figure 51: Last two batches of pre-approval projects by co.
Source: Maybank Kim Eng Source: NEA, Maybank Kim Eng
0
500
1,000
1,500
2,000
2,500
2013 2014E 2015E 2016E
MW LY HR DR
0
500
1,000
1,500
2,000
2,500
Longyuan HuanengRenewables
Datang Renewable
MW3rd batch 4th batch
We believe Huaneng Renewables will have the highest capacity growth as it received lots of pre-approvals in the 3rd batch and 4th batch.
August 13, 2014 21
Chinese Wind Power
Preference #4: prefer lower net gearing We prefer companies with a lower net gearing, as we think there is a lower risk of a possible share placement, and the interest expense burden will also be lower. Among the three, Longyuan’s net gearing was the lowest at 178% end-2013 whilst Datang Renewable’s was the highest at 411% end-2013. With such a high net gearing, we believe it is difficult for Datang Renewable to further gear up to boost its ROE, despite having a relatively low ROE compared to peers. Its ROE was around 2.6% at end-FY13, while Longyuan’s was around 6.8% and Huaneng Renewables’ was around 6.9% at end-FY13.
Figure 53: Huaneng R - cumulative installed capacity
Source: Maybank Kim Eng Source: Maybank Kim Eng
Figure 54: Datang Renewable - cumulative installed capacity Figure 55: Net gearing ratio by company (2013-15E)
Source: Maybank Kim Eng Source: Maybank Kim Eng
0
4,000
8,000
12,000
16,000
20,000
2013 2014E 2015E 2016E
MW
3 years CAGR =15.2%
0
4,000
8,000
12,000
16,000
2013 2014E 2015E 2016E
MW
3 years CAGR =23.2%
0
4,000
8,000
12,000
2013 2014E 2015E 2016E
MW
3 years CAGR =11.2%
0%
50%
100%
150%
200%
250%
300%
350%
400%
450%
FY13 FY14E FY15E
Longyuan HR DR
We estimate Longyuan will have the lowest net gearing ratio in FY14E-15E.
August 13, 2014 22
Chinese Wind Power
Our major assumptions and forecasts
Figure 56: Our major assumptions and forecasts
2012 2013 2014E 2015E Longyuan Total wind installed capacities (MW) 10,544 11,910 13,810 15,900 Consolidated wind gross power generation (GWh) 16,820 21,929 25,091 28,668 Consolidated wind net power generation (GWh) 16,027 20,565 23,530 26,884 Utilization hours (Wind) 1,985 2,111 2,145 2,158 Avg. wind power on-grid tariff (CNY/MWh)(Net VAT) 497 498 488 493 Total coal-fired installed capacities (MW) 1,875 1,875 1,875 1,875 Consolidated coal-fired gross power generation (GWh) 11,232 11,065 11,064 11,064 Consolidated coal-fired net power generation (GWh) 10,497 10,330 10,329 10,329 Utilization hours (coal-fired) 5,990 5,901 5,901 5,901 Average coal-fired on-grid tariff (CNY/MWh)(Net VAT) 386 383 371 364 Huaneng Renewables Total Installed capacities (MW) 5,458 6,221 8,221 10,021 Consolidated gross power generation (GWh) 8,402 11,142 13,327 17,052 Consolidated net power generation (GWh) 7,790 10,719 12,821 16,405 Utilization hours 1,774 2,029 2,096 2,118 Avg. wind power on-grid tariff (CNY/MWh)(Net VAT) 517 508 498 493 Datang Renewable Total installed capacities (MW) 5,669 5,719 6,319 7,159 Consolidated gross power generation (GWh) 8,437 10,704 11,262 13,414 Consolidated net power generation (GWh) 8,293 10,540 11,081 13,166 Utilization hours 1,752 2,002 2,022 2,040 Avg. wind power on-grid tariff (CNY/MWh)(Net VAT) 504 510 499 494 Source: Maybank Kim Eng
Figure 57: Our sensitivity analysis - FY14E net profit vs different parameters
Source: Maybank Kim Eng
How do we differ from consensus? The market may have worried too much about the low wind speeds in
1H14. Although it is difficult to predict the weather, we believe low wind speeds will not be a structural or fundamental factor for the sector in the medium or long term.
We also expect wind-turbine maintenance costs to increase but it will still be at a mid-single digit percentage of total operating cost. As such, we think the market has overreacted to this factor.
The offshore wind power tariff announced recently at CNY0.75/kWh for intertidal and CNY0.85/kWh near-shore were slightly below market expectations. However, we believe it could still give decent equity IRR, i.e. 12.7% for intertidal and 12.5% for near-shore.
-40%
-30%
-20%
-10%
0%
10%
20%
1% increase in utilizationhours
1% decrease in averagewind tariff
25bps increase in averageinterest rate
Longyuan HR DR
We estimate the net profit of Datang Renewable is most sensitive to different parameters.
We forecast strong earnings growth for Huaneng Renewables due to the growth in generation capacity. Compared to Longyuan, Huaneng Renewables’ average growth rate in the next three years is more decent. However, we forecast Datang Renewable’s EPS will remain the lowest due to the low flexibility of expansion limited by its weak balance sheet.
Longyuan HR DRWe forecast Datang Renewable’s net gearing will be the highest among the three companies, in the next three years.
August 13, 2014 25
Chinese Wind Power
Valuation Our target price (NPV=TP) is derived from the Discounted Cash Flow (DCF) methodology given the robust cash flow of wind power generation. However, sector valuations look undervalued. We use the DCF valuation method as the basis to calculate our target prices (NPV=TP) given the robust cash flow nature of wind power utilities compared to other sectors. We assume a 4% long-term terminal growth rate with an 8.4%-9.1% WACC.
Figure 64: DCF valuation for Longyuan Terminal value
Terminal Growth Rate 4.0% Terminal WACC 8.4% Estimated Free Cash Flow 10,142.8 Terminal Value 228,622.7 NPV of Terminal Value 125,662.8
DCF valuation
NPV of Forecasts 17,134.1 NPV of Terminal Value 125,662.8 Enterprise Value 142,796.9 Less: Net Debt (64,588.4) Less: Minority interest (7,489.0) Equity Value 70,719.6
No. Shares (millions) 8,036 Per Share Equity Value CNY8.80 Per Share Equity Value HKD11.00
Source: Maybank Kim Eng
Figure 65: DCF valuation for Huaneng Renewables Terminal value
Terminal Growth Rate 4.0% Terminal WACC 8.6% Estimated Free Cash Flow 6,495.0 Terminal Value 140,469.3 NPV of Terminal Value 76,092.6
DCF valuation
NPV of Forecasts (12,234.4) NPV of Terminal Value 76,092.6 Enterprise Value 63,858.2 Less: Net Debt (37,379.0) Less: Minority interest (1,200.6) Equity Value 25,278.6
No. Shares (millions) 9,029 Per Share Equity Value CNY2.80 Per Share Equity Value HKD3.50
Source: Maybank Kim Eng
We believe the robust cash flow of wind power generation will support the earnings growth of the three companies.
August 13, 2014 26
Chinese Wind Power
Figure 66: DCF valuation for Datang Renewable Terminal value
Terminal Growth Rate 4.0% Terminal WACC 9.1% Estimated Free Cash Flow 3,803.4 Terminal Value 74,977.8 NPV of Terminal Value 39,468.3
DCF valuation
NPV of Forecasts 9,335.3 NPV of Terminal Value 39,468.3 Enterprise Value 48,803.6 Less: Net Debt (40,177.6) Less: Minority interest (2,226.1) Equity Value 6,400.0
No. Shares (millions) 7,274 Per Share Equity Value CNY0.88 Per Share Equity Value HKD1.10
Source: Maybank Kim Eng
The FY14E P/E of Longyuan and Huaneng Renewables is around 15x. Although the P/E is higher than conventional Chinese IPPs, earnings growth potential is much higher. We forecast an average three-year 39% EPS CAGR for Longyuan, Huaneng Renewables and Datang Renewable. Based on this, we calculate the sector’s PEG is just ~0.52x, well below the fair level of 1x. We think the sector is still undervalued. Figure 67: PEG ratios Bloomberg Market Cap. Closing P/E CAGR PEG Company Name code (USDm) Price (LC) FY14E 3-year FY14E Wind Power Longyuan 916 HK 8,565.2 8.26 15.7 31% 0.50 Huaneng Renewables 958 HK 3,040.8 2.61 14.0 34% 0.41 Datang Renewable 1798 HK 1,107.5 1.18 33.4 52% 0.64 Average
21.0 39% 0.52
Source: Maybank Kim Eng
We think the sector is undervalued as the PEG of the sector is just ~0.52x.
August 13, 2014 27
Chinese Wind Power
Ratio-based valuations
P/E and P/B bands Figure 68: Longyuan forward P/E band (Bloomberg consensus estimates)
Figure 69: Longyuan - forward P/B band (Bloomberg consensus estimates)
Source: Bloomberg, Maybank Kim Eng Source: Bloomberg, Maybank Kim Eng
Source: Bloomberg, Maybank Kim Eng Source: Bloomberg, Maybank Kim Eng
Figure 72: Datang Renewable - forward P/E band (Bloomberg consensus estimates)
Figure 73: Datang Renewable - forward P/B band (Bloomberg consensus estimates)
Source: Bloomberg, Maybank Kim Eng Source: Bloomberg, Maybank Kim Eng
0
3
6
9
12
15
18
Dec 09 Jun 11 Dec 12 Jun 14 Dec 15
24x
HKD
20x
16x
12x
8x
3
5
7
9
11
13
Dec 09 Jun 11 Dec 12 Jun 14 Dec 15
2.5xHKD
2.0x
1.5x
1.0x
0
1
2
3
4
5
6
7
8
Jun 11 Dec 12 Jun 14 Dec 15
25x
HKD
20x
15x
10x
5x
0
1
2
3
4
5
Jun 11 Dec 12 Jun 14 Dec 15
2.0x
HKD
1.5x
1.0x
0.5x
0.0
1.0
2.0
3.0
4.0
5.0
6.0
7.0
Dec 10 Dec 11 Dec 12 Dec 13 Dec 14 Dec 15
50x
HKD
40x
30x
20x
10x
0.0
0.5
1.0
1.5
2.0
2.5
3.0
3.5
Dec 10 Dec 11 Dec 12 Dec 13 Dec 14 Dec 15
1.6x
HKD
1.2x
0.8x
0.4x
August 13, 2014 28
Chinese Wind Power
Figure 74: Peer comparisons (comparing with other sub-sectors) (all based on Bloomberg consensus forecasts) Bloomberg Market Cap. Closing P/E (x) P/B (x) DY (%) ROE (%)
Company Name code (USDm) Price (LC) FY14E FY15E FY14E FY15E FY14E FY15E FY14E FY15E Chinese IPPs China Resources Power* 836 HK 13,826 22.35 8.9 8.1 1.4 1.3 3.6 4.0 17.0 16.9 Huaneng Power* 902 HK 14,122 8.74 8.1 8.1 1.4 1.3 6.4 6.4 18.2 16.4 Datang Power* 991 HK 7,772 3.90 9.6 8.0 0.9 0.8 4.2 5.0 9.5 10.8 Huadian Power* 1071 HK 5,453 5.33 7.2 7.4 1.2 1.1 5.1 5.1 17.8 15.1 China Power International* 2380 HK 2,851 3.29 6.7 6.6 0.8 0.8 6.0 6.2 12.6 11.9 Average 8.1 7.6 1.2 1.1 5.0 5.3 15.0 14.2 City gas distributors HK & China Gas 3 HK 23,307 17.18 23.9 21.9 3.3 3.0 2.0 2.2 14.0 14.0 Beijing Enterprise 392 HK 12,162 73.40 18.5 15.1 1.6 1.5 1.4 1.8 9.0 10.1 China Gas* 384 HK 10,235 15.80 30.0 24.2 5.2 4.4 0.7 0.9 19.2 19.4 China Resources Gas* 1193 HK 7,403 25.80 21.0 17.5 3.5 3.0 1.0 1.2 17.5 17.8 ENN Energy* 2688 HK 8,307 59.45 23.1 19.4 4.5 3.8 1.2 1.4 20.9 20.8 Towngas China* 1083 HK 3,033 8.93 18.3 15.6 1.7 1.6 1.0 1.2 9.6 10.3 Average 22.5 19.0 3.3 2.9 1.2 1.5 15.0 15.4 HK power utilities CLP 2 HK 21,023 64.50 15.6 15.3 1.7 1.7 4.0 4.1 10.8 11.0 Power Assets* 6 HK 19,742 71.70 17.1 17.4 1.2 1.2 3.6 3.7 9.3 7.0 HKE Trust 2638 HK 5,951 5.22 15.0 15.1 0.9 0.9 7.1 7.6 9.3 6.1 Average 15.9 15.9 1.3 1.3 4.9 5.1 9.8 8.0 Solar Power GCL-Poly* 3800 HK 5,195 2.60 19.4 12.7 2.2 1.9 0.6 1.0 11.2 15.4 Hanergy Solar 566 HK 4,535 1.22 17.4 17.4 2.7 2.4 0.8 0.8 13.1 14.8 Singyes Solar 750 HK 1,181 13.18 10.6 8.5 2.2 1.8 1.0 1.2 23.2 23.5 United PV 686 HK 564 1.01 36.1 30.6 1.4 1.2 N/A N/A 2.5 5.2 Comtec Solar 712 HK 230 1.28 23.6 16.1 0.8 0.8 0.4 0.6 3.6 5.4 Solargiga 757 HK 164 0.40 N/A 0.2 N/A N/A N/A N/A N/A N/A Average 21.4 14.3 1.9 1.6 0.7 0.9 10.7 12.8 Wind Power Longyuan Power* 916 HK 8,564 8.26 17.3 14.1 1.6 1.4 1.1 1.4 9.3 10.4 Huadian Fuxin 816 HK 4,035 3.92 13.0 10.0 1.8 1.6 1.6 2.1 14.6 16.4 Goldwind 2208 HK 3,971 9.29 26.7 18.3 1.4 1.3 1.3 1.7 5.7 7.2 Huaneng Renewables* 958 HK 3,040 2.61 15.2 11.2 1.2 1.1 1.3 1.7 8.3 10.5 Beijing Jineng Clean Energy 579 HK 2,758 3.30 11.4 7.8 1.4 1.2 2.0 2.9 12.7 16.3 Datang Renewable* 1798 HK 1,107 1.18 21.3 12.3 0.7 0.7 0.6 1.5 2.9 5.0 China High Speed Transmission 658 HK 1,268 6.01 17.7 13.3 0.9 0.8 0.1 0.5 5.1 6.4 China Wind Power 182 HK 716 0.62 12.2 8.2 1.0 0.9 1.1 1.1 8.6 11.6 Average 16.9 11.9 1.2 1.1 1.1 1.6 8.4 10.5 Environmental protection and water utilities
China Everbright Int'l 257 HK 6,259 10.82 27.7 21.6 3.2 2.9 0.8 1.1 12.3 14.2 Guangdong Investment 270 HK 7,238 8.99 14.6 13.8 1.9 1.8 2.6 2.8 13.1 12.8 Beijing Water Enterprise 371 HK 5,900 5.28 27.8 21.8 3.1 2.8 1.3 1.6 11.6 13.3 Guodian Science and Technology 1296 HK 1,353 1.73 12.2 10.0 0.8 0.7 1.3 1.5 7.3 8.0 Tianjin Capital Environment 1065 HK 1,689 5.66 21.6 18.9 1.5 1.5 1.6 1.8 7.8 8.1 CT Environmental 1363 HK 1,165 6.26 24.5 18.5 5.4 4.5 0.7 0.8 24.5 26.1 Average 21.4 17.4 2.7 2.3 1.4 1.6 12.8 13.7 Power equipment Shanghai Electric 2727 HK 7,754 3.49 14.0 13.3 1.1 1.0 2.5 2.6 7.5 7.6 Dongfang Electric 1072 HK 4,123 14.04 10.8 10.5 1.1 1.0 1.5 1.6 11.6 10.7 Harbin Electric 1133 HK 966 5.44 8.6 7.9 0.4 0.4 1.7 1.9 5.4 5.6 Average 11.1 10.6 0.9 0.8 1.9 2.0 8.2 8.0 Source: Bloomberg, Maybank Kim Eng, *Covered by Kim Eng
August 13, 2014 29
Chinese Wind Power
Appendix I: Maintenance costs will only have minor impact on operating expenses
We expect to see increasing repair and maintenance expenses for wind operators as more and more projects built in 2011 will have their three-year warranty periods expire in 2014. However, we forecast maintenance costs will remain about 4.2% and 5.0% of total operating expenses in 2014E and 2015E.
In terms of maintenance cost per kWh, we estimate Longyuan’s will drop to CNY0.02/kWh from CNY0.024/kWh as the rise in power generation grows faster than its maintenance costs. For Huaneng Renewables we forecast an increase to CNY0.011/kWh from CNY0.008/kWh and for Datang Renewable, we forecast an increase to CNY0.015/kWh from CNY0.011/kWh. We think these are still in an acceptable range.
Figure 75: Proportion of repair and maintenance costs to total operating expenses by company (2012-15E)
Source: Maybank Kim Eng
Figure 76: Maintenance cost per kWh by company (2012-15E)
Source: Maybank Kim Eng
0%
1%
2%
3%
4%
5%
6%
2012 2013 2014E 2015E
Longyuan Huaneng Renewable Datang Renewable
0
0.01
0.02
0.03
2012 2013 2014E 2015E
CNY/kWhLongyuan Huaneng Renewable Datang Renewable
We expect the rising maintenance cost will only account for 4.2% and 5% of total operating expenses in FY14E and FY15E.
August 13, 2014 30
Chinese Wind Power
Appendix II: Wind power installation target
Wind power targeted to contribute around 7% of total installation by 2015 Wind power development has experienced fast growth in the last five years. We forecast the cumulative installation for onshore wind power will be 20% in 2014E and 15% in 2015E. In the 12th five-year plan, the government set a 95GW onshore cumulative installation target and we believe it will likely surpass the target. We forecast total onshore installation will reach 125GW at the end of 2015E.
Based on the government’s target, wind power capacity will comprise about 7% of total power generation capacity in China, vs 3% in 2010. However, the government targets total installation will reach 170GW for onshore and 30GW for offshore by 2020E.
Figure 77: Onshore cumulative wind power installation
Source: Maybank Kim Eng
Figure 78: 12th five-year plan
(GW) 2010 2015E target Coal 660 960 Hydro 220 290 Nuclear 10.8 40.0 Natural Gas 26.4 56.0 Wind 31.0 100.0fd Solar 0.9 21.0 Source: Maybank Kim Eng
Figure 79: China wind installation target by 2015 and 2020
2015 2020
Wind onshore target 95 170 Wind offshore target 5 30 Total 100 200 Source: National Energy Administration, Maybank Kim Eng Note: Grid-connected capacity only.
0%
10%
20%
30%
40%
50%
60%
70%
80%
0
20,000
40,000
60,000
80,000
100,000
120,000
140,000
160,000
180,000
2010 2011 2012 2013 2014E 2015E 2020E
MW cumulative capacity (LHS) YoY growth (RHS)
5 years CAGR: 6%
We estimate the cumulative wind power capacity will grow by 20% in 2014E and 15% in 2015E.
August 13, 2014 31
Chinese Wind Power
Figure 80: China power capacity (2010) Figure 81: China power capacity target (2015)
Source: NDRC, Maybank Kim Eng Source: NDRC, Maybank Kim Eng
Figure 82: China power capacity (2013) Figure 83: China power generation (2013)
Source: China Electricity Council, Maybank Kim Eng Source: China Electricity Council, Maybank Kim Eng
Coal69.5%
Hydro23.2%
Nuclear1.1%
Natural Gas2.8%
Wind3.3%
Solar0.1%
Coal65%
Hydro20%
Nuclear3%
Natural Gas4%
Wind7%
Solar1%
Hydro22.7%
Fossil Fuels70.0%
Nuclear1.2%
Wind6.1%
Hydro15.0%
Fossil Fuels80.3%
Nuclear2.1%
Wind2.6%
August 13, 2014 32
Chinese Wind Power
Appendix III: Wind speeds
Figure 84: Major provinces’ wind speeds and utilisation hrs YoY growth (1Q14)
Source: National Energy Administration, Bloomberg, Maybank Kim Eng Securities
Source: Bloomberg, Maybank Kim Eng Source: Bloomberg, Maybank Kim Eng
Appendix IV: Wind curtailment In the past few years, the wind installed capacity has increased at a faster rate than the development of the grid infrastructure capacity, resulting in delays in connecting wind farms to the grid. This kind of delay normally takes six to nine months to connect to the grid. However, even though the projects are connected to the grid physically, there have been some cases where the grid companies could refuse to purchase the wind power (ie grid curtailment). This had a negative impact on wind project developers when they could not sell the electricity to the grid. There are three reasons for the serious grid curtailment problem in China:
Uneven distribution of wind resources and power demand: Wind resources are located in the northern part of China, however there are not enough local power loads to consume the power generated from wind. Therefore the grid companies are reluctant to purchase the excess power from wind farms.
Intermittency of wind power causes high fluctuations to the grid: Wind power is not predictable so a sudden surge in wind generation could overload the power grid.
Poor inter-provincial grid transmission capacity for exporting the wind power to other provinces with high power demand.
Measures to deal with the curtailment problem in China:
Slower pace of wind project development: In October 2011, the Chinese government announced the “Pre-approval project lists for the development of 12th Five-Year Plan” to reduce the scale of wind project development in regions where the grid curtailment issue was serious. The top six curtailment regions include Heilongjiang, Jilin, Inner Mongolia, Liaoning, Gansu and Hebei.
Develop low-wind speed turbines to be able to generate power in the southern provinces of China with high power demand.
Build ultra-high-voltage transmission lines to transmit the wind power to other regions.
Use complementary and non-variable energy sources (such as hydro power stations) to fill temporary gaps between demand and wind generation.
Use storage system (such as pumped-hydro storage) to regulate the peaks and store the excess energy for later use.
0
2
4
6
8
10
12
Jan Feb Mar Apr May Jun Jul Aug Sep Oct Nov Dec
kms/hour 2012 2013 2014
0
2
4
6
8
10
12
Jan Feb Mar Apr May Jun Jul Aug Sep Oct Nov Dec
kms/hour 2012 2013 2014
Wind curtailment has become an issue because wind installed capacity has increased at a faster rate than the development of the grid infrastructure capacity.
August 13, 2014 34
Chinese Wind Power
Appendix V: Major risks
Lower-than-expected wind speeds
Potential share placement risk
Lack of improvement in the wind curtailment ratio
Lower than our expected generation and/or capacity growth
Potential feed-in tariff cut for wind power
Wind turbine price increase
Potential hike in maintenance costs for wind turbines
Potential downtime if wind turbines fail
Potential interest-rate hike
Corporate governance risk
August 13, 2014
Init
iati
on
CO
MPA
NY R
ESEA
RC
H |
SEE PAGE 62 FOR IMPORTANT DISCLOSURES AND ANALYST CERTIFICATIONS
China Longyuan Power (916 HK)
A safer bet Initiate at BUY with DCF-based target price of HKD11. We like
Longyuan as it faces less wind curtailment problems in termsof wind farm location vs Datang Renewable.
We forecast 64% EPS growth in 2014E, following a lowbenchmark in 2013 due to last year’s impairment loss, highO&M costs and higher tax rate.
Its coal-fired generation should provide more stable cashflow and could also diversify the risk of lower wind speed.Stronger balance sheet is also a positive.
What’s Our View We forecast Longyuan’s new capacity will increase by 16% to generate a decent 64% EPS growth in 2014E. On the back of the 3rd
(2013) and 4th (2014) batch of pre-approved wind capacity, weexpect the average IRR of Longyuan’s wind project portfolio willchange from 15.8% in 2013 to 16.5% in 2015 (if there is no tariff cut or 15.3% if there is one in 2015).
Its disappointing FY13 earnings provide a benchmark for Longyuanto record a decent EPS growth, in our view. We expect theimpairment losses in FY13 for its two biomass plants and a coalpower plant are unlikely to happen in 2014E. In fact, LY recentlyentered into an agreement to dispose its 52% interest in GuodianLiaocheng Biomass Power. We also believe last year’s high repairand maintenance costs and increase in tax rate have beenreflected in its share price. Longyuan’s 178% net gearing at the endof 2013 is the lowest among the three companies under ourcoverage. We believe the share-placement risk is relatively lowand the company has more flexibility for expansion.
Although its coal-fired power business will contribute to a lowerP/E, its more stable operating cash flow could help diversify therisk of wind speed fluctuation. Initiate at BUY with a DCF-based target price of HKD11.
We forecast 64% EPS growth in 2014 We forecast Longyuan’s capacity in 2014 will increase by 16% to 13.8GW. The decent capacity growth is supported by a strong pipeline of projects pre-approved in 2013 (3rd batch) and 1Q14 (4th batch). We calculate that Longyuan received the pre-approval of around 2.3GW in 2013 and around 1.6GW in 2014.
We estimate 88.5% of the two batches of new projects are located in low grid curtailment regions (ie curtailment ratio<3%), according to their distribution. We forecast the average of the curtailment ratio will drop to 9.9% at end-2015E, which is an improvement compared to our estimate of 11.8% at the end of 2013.
In fact, we also believe a good proportion of new capacity is in regions with higher IRR, such as Fujian and Yunnan. It could also help improve overall profitability in the long term.
With a strong pipeline of new wind power capacity with good locations, we forecast the core EPS will grow 64% in 2014E and 17% in 2015E. The decent EPS growth is also due to the low earnings benchmark in 2013. We believe the impairment losses for its biomass projects will not be repeated in 2014. In fact, LY recently entered into an agreement to dispose its 52% interest in Guodian Liaocheng Biomass Power.
Figure 91: Wind pre-approval projects by province (MW)
# Regions Longyuan (2013) Longyuan (2014) *Utilisation hours
We believe the curtailment ratio of Longyuan will drop from 11.8% in 2013 to 9.9% in 2015E with new projects to be located in low grid curtailment regions.
2013 1 Inner Mongolia 19.2% 10.8% 2,188 2 Heilongjiang 9.5% 15.5% 1,951 3 Xinjiang 9.2% 17.3% 2,582 4 Jiangsu 8.9% 0.0% 2,150 5 Gansu 8.7% 5.7% 1,806 6 Liaoning 8.4% 7.9% 1,934 7 Hebei 8.2% 14.6% 2,251 8 Yunnan 4.4% 1.5% 2,388 9 Fujian 4.2% 0.0% 2,666 10 Shanxi 3.4% 0.4% 2,220 11 Anhui 3.3% 0.0% 1,948 12 Jilin 2.9% 19.8% 1,660 13 Ningxia 2.3% 0.4% 2,084 14 Guizhou 2.1% 0.0% 2,060 15 Shaanxi 1.2% 1.8% 2,090 16 Zhejiang 1.2% 0.0% 1,950 17 Tianjin 1.1% 2.0% 2,006 18 Shandong 0.8% 1.2% 2,008 19 Hainan 0.8% 0.0% 2,239 20 Tibet 0.1% 0.0% N/A Total 100.0% Note: *Utilisation hours and curtailment ratio are based on industry figures. Source: Company data, National Energy Administration, Kim Eng Securities
We expect Longyuan’s new projects will be in regions with high IRRs and high utilisation hours.
August 13, 2014 38
China Longyuan Power
Figure 94: Our forecast of Longyuan’s core EPS and core EPS growth rate
Source: Maybank Kim Eng
Strongest balance sheet We forecast Longyuan’s net gearing will be 187% at the end of 2014, lower than its peers Datang Renewable and Huaneng Renewables. We believe the stronger balance sheet could provide expansion flexibility to Longyuan. We believe the share-placement risk is lower compared to its peers.
Figure 95: Longyuan’s net gearing
Source: Maybank Kim Eng
-40%
-30%
-20%
-10%
0%
10%
20%
30%
40%
50%
60%
70%
0.0
0.1
0.2
0.3
0.4
0.5
0.6
0.7
2013 2014E 2015E 2016E
CNY Core EPS (LHS) EPS growth (RHS)
172%
174%
176%
178%
180%
182%
184%
186%
188%
2012 2013 2014E 2015E
We forecast 64% EPS growth for Longyuan in FY14E.
August 13, 2014 39
China Longyuan Power
Coal-fired generation could help diversify wind speed uncertainties
As of end FY13, Longyuan had 539MW attributable or 1,875MW consolidated coal-fired capacity. Operating profit of its coal power business was CNY1,140, up 15.2% YoY, contributing around 19% of total. We believe the development of coal-fired power is not the focus but it could provide a more stable cash flow for Longyuan to diversify from fluctuations in wind power generation due to wind speed uncertainties.
Figure 96: Longyuan’s segment profit (2013)
Source: Company data, Maybank Kim Eng
Initiate at BUY, DCF-based TP HKD11 On the back of decent EPS growth and healthier balance sheet, we initiate at a BUY rating with a DCF-based target price of HKD11. We assume 8.4% WACC and 4% terminal growth rate.
Longyuan is now trading at FY14E P/E of 16x and P/B of 1.5x, which is attractive, in our view.
Figure 97: DCF valuation
Terminal Value Terminal Growth Rate 4.0% Terminal WACC 8.4% Estimated Free Cash Flow 10,142.8 Terminal Value 228,622.7 NPV of Terminal Value 125,662.8
DCF Valuation
NPV of Forecasts 17,134.1 NPV of Terminal Value 125,662.8 Enterprise Value 142,796.9 Less: Net Debt (64,588.4) Less: Minority interest (7,489.0) Equity Value 70,719.6
No. Shares (millions) 8,036 Per Share Equity Value CNY8.80 Per Share Equity Value HKD11.00
Source: Maybank Kim Eng
-1,000
0
1,000
2,000
3,000
4,000
5,000
6,000
Wind power business Coal power business Others
Longyuan is trading at 16x P/E in FY14E and 1.5x P/B.
August 13, 2014 40
China Longyuan Power
Figure 98: Sensitivity analysis, WACC against terminal growth
Change in Debt 8,067.0 (1,272.2) 10,000.0 5,000.0 5,000.0
Other invest/financing cash flow (1,364.4) (3,859.0) (3,248.1) (3,870.3) (4,370.2)
Effect of exch rate changes (13.2) (15.3) 0.0 0.0 0.0
Net cash flow 1,722.5 (2,366.0) 338.3 (115.5) 2,259.4
August 13, 2014 43
China Longyuan Power
FYE 31 Dec FY12A FY13A FY14E FY15E FY16E
Key Ratios
Growth ratios (%)
Revenue growth 4.2 10.6 4.7 8.5 9.5
EBITDA growth 20.3 6.7 26.2 15.8 11.7
EBIT growth 18.5 (0.7) 35.8 15.2 12.3
Pretax growth 4.0 (3.8) 50.1 16.5 15.7
Reported net profit growth 0.6 (21.0) 64.9 16.2 18.5
Core net profit growth 0.6 (21.0) 63.8 17.0 18.5
Profitability ratios (%)
EBITDA margin 56.3 54.3 65.5 69.9 71.3
EBIT margin 35.0 31.4 40.7 43.2 44.3
Pretax profit margin 21.2 18.5 26.5 28.4 30.0
Payout ratio 18.4 18.6 18.6 18.6 18.6
DuPont analysis
Net profit margin (%) 15.0 10.7 16.9 18.1 19.6
Revenue/Assets (x) 0.2 0.2 0.2 0.2 0.2
Assets/Equity (x) 3.7 3.6 3.5 3.3 3.2
ROAE (%) 9.4 6.8 10.2 10.7 11.3
ROAA (%) 2.6 1.9 2.9 3.2 3.5
Liquidity & Efficiency
Cash conversion cycle 107.9 78.2 21.7 71.3 102.4
Days receivable outstanding 139.8 138.4 123.4 121.3 120.8
Days inventory outstanding 49.8 51.5 80.7 110.9 124.0
Days payables outstanding 81.6 111.7 182.5 160.9 142.5
Dividend cover (x) 5.4 5.4 5.4 5.4 5.4
Current ratio (x) 0.5 0.4 0.3 0.3 0.3
Leverage & Expense Analysis
Asset/Liability (x) 1.5 1.5 1.5 1.6 1.6
Net debt/equity (%) 181.8 177.7 186.5 179.5 165.9
Net interest cover (x) 2.4 2.4 2.8 2.8 3.0
Debt/EBITDA (x) 6.0 5.5 5.2 4.8 4.6
Capex/revenue (%) 79.5 54.0 60.6 55.8 50.9
Net debt/ (net cash) 53,514.5 54,926.7 64,588.4 69,703.9 72,444.5
August 13, 2014
Init
iati
on
CO
MPA
NY R
ESEA
RC
H |
SEE PAGE 62 FOR IMPORTANT DISCLOSURES AND ANALYST CERTIFICATIONS
Huaneng Renewables Corporation (958 HK)
Fast growing player Initiate at BUY with a DCF-based target price of HKD3.50.
We forecast HR can achieve robust net profit growth due to new capacity.
Given strong exposure (~7.6% of total capacity) to Hebei andXinjiang provinces, we think HR’s utilisation hours willimprove with the expected transmission projects to startoperations in 2015.
What’s Our View We forecast HR’s EPS growth will reach 44% in 2014E and 36% in2015E. We calculate HR received pre-approvals for 1.3GW of projects in 2013 (3rd batch) and 1.7GW in 2014 (4th batch). This was more than the pre-approved capacity received by Longyuan andDatang Renewable in 2014. We forecast installed capacity willgrow 32% in 2014E and 22% in 2015E.
An estimated 4.4% of HR’s total capacity is located in Hebei. Weexpect a new 500kV transmission project connecting the Zhangbeiregion to the North China grid will be commissioned by the end of 2014, which could significantly reduce the wind curtailment ratioin Hebei. In 1H14, the wind curtailment ratio in Hebei provincewas about 14.6%.
In addition, we believe HR’s asset quality will improve in thecoming years as the 3rd and 4th batch of newly pre-approved projects are mostly located in regions with higher utilization hoursand should achieve a relatively high IRR. We calculate HR received299MW of pre-approved capacity in Yunnan and 387MW in Guizhouas well as 395MW in Sichuan. Yunnan should provide the highestIRR due to high tariffs and higher utilization hours. Guizhou andSichuan should also provide decent IRRs, in our opinion.
Although the placement risk is relatively high due to its aggressiveexpansion plans, we believe it is a good strategy to improve assetquality and boost its scale. Initiate at BUY with TP of HKD3.50.
Strong capacity growth We like Huaneng Renewables (HR) as we expect its net profit will grow robustly and we forecast it will rise 31% to CNY1,275m in 2014E and surge 36% to CNY1,729m in 2015E.
We calculate HR received 1.3GW of pre-approved capacity in 2013 (3rd batch) and 1.7GW in 2014 (4th batch). We expect construction of the new capacity will take one to two years before operations can commence.
Figure 106: Our forecast of Huaneng Renewables’ core EPS and EPS growth
We forecast the power generation capacity of Huaneng Renewables will increase 32% from 6.2GW in 2013 to 8.2GW in 2014E.
August 13, 2014 46
Huaneng Renewables Corporation
Transmission line to help wind curtailment ratio An estimated 4.4% of HR’s total capacity is in Hebei province. We also calculate HR received 97.5MW of pre-approved capacity in 2013 (3rd batch) and 148MW in 2014 (4th batch) in Hebei province.
According to official government data, the curtailment ratio in Hebei was high at 14.6% for 1H14 while the utilization hours were 2,251hours in 2013. However, we expect the curtailment ratio will improve significantly in 2015 as there will be a power transmission project connecting the Zhangbei wind bases to the Hebei South grid and to the North China grid. The transmission project is 500kV with 1,800MW transmission capacity and we expect it will be commissioned by the end of 2014 and start operations in 2015. This will directly reduce the surplus power in Hebei province and reduce the curtailment ratio.
Approximately 3.2% of HR’s projects are in Xinjiang province. In addition to the Hami – Zhengzhou line that has been in operation since Jan 2014, State Grid is also planning to build two more UHV transmission lines to help export wind power from Xinjiang province to central and southern provinces in China. These include a ±800DC transmission cable connecting Xinjiang and Chongqing with transmission capacity of 8GW and a ±1100DC transmission line connecting Xinjiang and Sichuan with transmission capacity of 10GW.
Figure 108: China UHV transmission projects that will transmit wind power
# Transmission line Start End Voltage
(kV) Length
(km)
Transmission capacity
(MW) Status Construction
start date Operational
date
Expected operation
date
1a Jindongnan-Nanyang-Jinmen AC Shanxi Hubei 1,000 640 2,800 Operational Aug 2006 Jan 2009 -1b Jindongnan-Nanyang-Jinmen AC Shanxi Hubei 1,000 - 2,200 Operational Jan 2011 Dec 2011 -2 Xiangjiaba – Shanghai HVDC Sichuan Shanghai ±800 1,980 6,400 Operational Dec 2007 Jan 2009 -3 Yunnnan – Guangdong HVDC Yunnan Guangdong ±800 1,438 5,000 Operational Dec 2006 Jun 2010 -4 Jinping – Sunan DC Sichuan Jiangsu ±800 2,090 7,200 Operational Dec 2009 Dec 2012 -5 Huainan –Shanghai UHV AC Anhui Shanghai 1,000 656 5,000 Operational Sep 2011 Aug 2013 -6 Nuozhadu-Guangdong HVDC Yunnan Guangdong ±800 1,451 5,000 Operational Dec 2011 Sep 2013 -7 Xiluodu-Guangdong HVDC project Yunnan Guangdong ±800 1,286 6,400 Operational Dec 2011 Oct 2013 -8 Hami - Zhengzhou UHVDC Xinjiang Henan ±800 2,300 7,500 Operational May 2012 Jan 2014 -9 Xiluodu-Zhejiang Jinhua UHV DC Sichuan Zhejiang ±800 1,653 8,000 Operational Jul 2012 Jul 2014 - Total (operating) 13,494 55,500 10 Zhangjiakou 500kV Hebei North China 500 - 1,800 Constructing Apr 2014 - 2014 11 Huainan-Nanjing-Shanghai AC Jiangsu Shanghai 1,000 780 5,000 Constructing Jun 2014 - 2016 12 Ningdong-Zhejiang DC Ningxia Zhejiang ±800 1,720 8,000 Approved - - 2015 13 Jiuquan-Hunan DC Gansu Hunan ±800 2,400 8,000 Approved - - 2016 14 Ximeng -Shandong Jinan 1000kV AC IM East Shandong 1,000 1,146 9,000 Approved - - 2017 15 Hami - Chongqing DC Xinjiang Chongqing ±800 2,300 8,000 Pending - - 2015 16 Huaidong - Sichuan DC Xinjiang Sichuan ±1100 2,645 10,000 Pending - - 2015 17 Ordos Shanghai Miao-Shandong DC IM West Shandong ±800 1,200 8,000 Pending - - 2016 18 Ximeng – Jiangsu Taizhou DC IM East Jiangsu ±800 1,620 8,000 Pending - - 2017 19 IM West to Tianjin south AC IM West Tianjin 1,000 1,452 4,800 Pending - - 2017 20 Ximeng-Nanjing 1000kV AC IM East Jiangsu 1,000 2,838 9,400 Pending - - 2017
Total (constructing) 18,101 80,000 Source: State Grid, news reports, NEA, Maybank Kim Eng
We believe the curtailment ratio of Huaneng Renewables will be reduced from 10.8% in 2013 to 8.5% in 2015E due to new UHV transmission lines.
August 13, 2014 47
Huaneng Renewables Corporation
Improving asset quality We believe HR’s asset quality will improve in the coming years as the newly pre-approved 3rd and 4th batch projects are mostly in regions with higher utilization hours and should achieve a relatively high IRR.
The provinces with higher profitability include Yunnan, Guizhou, Sichuan and Shanxi. We calculate HR’s new project pre-approvals in 2013 and 2014 include 395MW of projects in Sichuan, 387MW in Guizhou, and 299MW of projects in Yunnan.
Figure 109: Wind pre-approval projects by province (MW)
# Regions
Huaneng Renewables
(2013)
Huaneng Renewables
(2014) *Utilisation hours 2013
*Curtailment ratio 1H14
1 Sichuan 295.5 99 2,415 0.0% 2 Guizhou 245.5 141 2,060 0.0% 3 Shanxi 0 349.5 2,220 0.4% 4 Shaanxi 100 200 2,090 1.8% 5 Yunnan 299 0 2,388 1.5% 6 Chongqing 0 290 2,185 0.0% 7 Hebei 97.5 148 2,251 14.6% 8 Liaoning 49.5 163.5 1,934 7.9% 9 Shandong 49.5 99 2,008 1.2% 10 Guangxi 0 148.5 2,100 0.0% 11 Shanghai 48 47.5 2,282 0.0% 12 Guangdong 49.5 0 1,900 0.0% 13 Henan 49.5 0 2,202 0.0% Total 1,283.5 1,686.0 Source: National Energy Administration, Kim Eng Securities Note: *Utilisation hours and curtailment ratio are based on industry figures.
2013 1 Inner Mongolia 27.6% 10.8% 2,188 2 Liaoning 19.2% 7.9% 1,934 3 Shandong 14.3% 1.2% 2,008 4 Shanxi 9.5% 0.4% 2,220 5 Guizhou 7.7% 0.0% 2,060 6 Yunnan 7.6% 1.5% 2,388 7 Hebei 4.4% 14.6% 2,251 8 Guangdong 4.4% 0.0% 1,900 9 Xinjiang 3.2% 17.3% 2,582 10 Shanghai 1.0% 0.0% 2,282 11 Jilin 0.8% 19.8% 1,660 12 Shaanxi 0.3% 1.8% 2,090 Total 100.0% Source: Company data, National Energy Administration, Kim Eng Securities Note: *Utilisation hours and curtailment ratio are based on industry figures.
Chance of share placement due to high capex With a strong new project pipeline, we forecast HR’s capital expenditure will increase. We forecast the capex in 2014 and 2015 will be CNY13.9b. With high capital expenditure, we also forecast net gearing will increase to 251% at the end of FY14E and 273% at the end of FY15E vs 207% at the end of FY13. With high net gearing, we think the placement risk is higher.
Initiate at BUY with DCF-based HKD3.50 TP Huaneng Renewables announced a 1H14 net profit of CNY686m, up 2.9% YoY. It should be largely in line with the market expectations. Revenue in 1H14 was CNY2,996m, up 2.4% YoY. The small net profit growth was mainly due to the weak wind speeds in 1H14. We believe wind speed is difficult to predict, but when it normalizes, we expect strong earnings growth on the back of the capacity growth.
As we forecast HR’s net profit will grow robustly and its asset quality will improve, we initiate at BUY with a DCF-based target price of HKD3.50. We assume 8.6% WACC and 4% terminal growth rate.
HR is now trading at FY14E P/E of 14x and P/B of 1.2x, which is attractive, in our view.
Figure 112: DCF valuation Terminal Value
Terminal Growth Rate 4.0% Terminal WACC 8.6% Estimated Free Cash Flow 6,495.0 Terminal Value 140,469.3 NPV of Terminal Value 76,092.6
DCF Valuation
NPV of Forecasts (12,234.4) NPV of Terminal Value 76,092.6 Enterprise Value 63,858.2 Less: Net Debt (37,379.0) Less: Minority interest (1,200.6) Equity Value 25,278.6
No. Shares (millions) 9,029 Per Share Equity Value CNY2.80 Per Share Equity Value HKD3.50
Source: Maybank Kim Eng
Huaneng Renewables is now trading at 14x P/E and 1.2x P/BV in 2014E.
August 13, 2014 49
Huaneng Renewables Corporation
Figure 113: Sensitivity analysis, WACC against terminal growth
Change in Debt 4,263.0 2,709.4 6,000.0 7,000.0 5,000.0
Other invest/financing cash flow (4,534.8) (1,944.1) (1,033.3) (1,460.5) (1,948.1)
Effect of exch rate changes 0.8 (80.0) 0.0 0.0 0.0
Net cash flow (3,737.9) 549.6 (2,702.2) (318.9) (204.9)
August 13, 2014 52
Huaneng Renewables Corporation
FYE 31 Dec FY12A FY13A FY14E FY15E FY16E
Key Ratios
Growth ratios (%)
Revenue growth 26.0 44.0 21.2 25.5 18.4
EBITDA growth 7.5 23.1 23.2 26.9 19.2
EBIT growth (7.6) 25.5 25.0 28.9 19.8
Pretax growth (44.6) 56.1 45.4 36.4 25.5
Reported net profit growth (45.5) 59.1 43.6 35.7 24.8
Core net profit growth (45.5) 59.1 43.6 35.7 24.8
Profitability ratios (%)
EBITDA margin 94.0 80.4 81.7 82.6 83.2
EBIT margin 53.9 47.0 48.5 49.9 50.4
Pretax profit margin 15.7 17.0 20.4 22.1 23.5
Payout ratio 22.7 19.3 20.3 20.3 20.3
DuPont analysis
Net profit margin (%) 13.9 15.3 18.1 19.6 20.7
Revenue/Assets (x) 0.1 0.1 0.1 0.1 0.1
Assets/Equity (x) 4.5 4.3 4.7 5.0 5.0
ROAE (%) 4.8 6.9 8.9 11.1 12.5
ROAA (%) 1.1 1.6 2.0 2.3 2.5
Liquidity & Efficiency
Cash conversion cycle nm nm nm nm nm
Days receivable outstanding 237.5 192.8 164.8 162.3 166.5
Days inventory outstanding nm nm nm nm nm
Days payables outstanding nm nm nm nm nm
Dividend cover (x) 4.4 5.2 4.9 4.9 4.9
Current ratio (x) 0.6 0.5 0.3 0.3 0.3
Leverage & Expense Analysis
Asset/Liability (x) 1.3 1.3 1.3 1.3 1.3
Net debt/equity (%) 224.3 206.9 250.6 273.3 275.0
Net interest cover (x) 1.4 1.6 1.7 1.8 1.9
Debt/EBITDA (x) 8.0 7.1 6.8 6.3 5.9
Capex/revenue (%) 163.4 123.4 197.7 157.6 119.8
Net debt/ (net cash) 26,512.8 28,676.6 37,379.0 44,697.9 49,902.8
August 13, 2014
Init
iati
on
CO
MPA
NY R
ESEA
RC
H |
SEE PAGE 62 FOR IMPORTANT DISCLOSURES AND ANALYST CERTIFICATIONS
China Datang Corp Renewable Power (1798 HK)
It takes time Initiate at HOLD with DCF-based TP of HKD1.10.
We believe DR’s asset quality is relatively low compared toLongyuan and HR’s due to having the largest exposure to Inner-Mongolia and Jilin which have high curtailment ratios.
With a weak balance sheet, we expect the asset quality improvement will be slow, despite more new projects inmore profitable regions.
What’s New We think Datang Renewable’s asset quality is the worst compared to the other two wind power companies under our coverage as ithas a large exposure to some regions with high wind curtailmentratios and low utilization. ~44% of its total capacity was in Inner Mongolia and ~11% was in Jilin province at end-2013. We estimate the equity IRR in Inner Mongolia and Jilin will be relatively low at 11.1% and 7.5%, due to lower tariffs and utilization hours. According to industry figures, utilization hours in Jilin are thelowest among different provinces, at 1,660 hours in 2013.
We don’t think the overall utilization hours can improve in thenear term. Four UHV transmission lines connecting Inner Mongoliato the south or east are pending approval, commissioning is notexpected to start until 2017.
We forecast DR’s net gearing will rise to 421% at the end of FY14E,from 411% end-FY13. We believe its weak balance sheet will limitshort-term capacity growth. We calculate DR received pre-approval for wind farm capacity of around 1GW in the 3rd batch(2013) and 0.3GW in the 4th batch (2014), which are relatively small compared to its two peers. Although a large proportion ofnew capacity at some locations has higher IRR, such as Yunnan andShanxi, we expect improvement will remain slow.
Initiate at HOLD despite trading at cheap multiples, due to lower asset quality and weak balance sheet.
We think DR’s asset quality is relatively low as the company has heavy exposure to regions with low utilization hours or high wind curtailment ratios. For example at end-2013, it had 2,507MW of capacity (around 43.8% of its total) in Inner Mongolia, where the wind curtailment ratio is high at around 10.8%. It also has 648MW (around 11.3% of its total) in Jilin, where utilization hours were the lowest among different provinces in 2013 at around 1,660 hours, according to industry figures.
Figure 121: DR’s wind project exposure (2013)
# Regions Datang
Renewable *Curtailment ratio as
of 1H14 *Utilisation hours 2013 1 Inner Mongolia 43.8% 10.8% 2,099 2 Jilin 11.3% 19.8% 1,660 3 Shandong 8.7% 1.2% 2,008 4 Heilongjiang 7.0% 15.5% 1,951 5 Gansu 6.9% 5.7% 1,806 6 Liaoning 5.7% 7.9% 1,934 7 Ningxia 4.3% 0.4% 2,084 8 Shanxi 3.5% 0.4% 2,220 9 Shanghai 1.8% 0.0% 2,282 10 Henan 1.8% 0.0% 2,202 11 Yunnan 1.7% 1.5% 2,388 12 Shaanxi 1.7% 1.8% 2,090 13 Hebei 0.9% 14.6% 2,251 14 Guangdong 0.9% 0.0% 1,900 15 Guangxi 0.1% 0.0% 2,100 Total 100.0% Note: *Utilisation hours and curtailment ratio are based on industry figures. Source: Company data, National Energy Administration, Kim Eng Securities
We think asset quality will improve in 2017 There is a 1,000kV with 9,000MW capacity UHV cable connecting Inner Mongolia East to Shandong that has been approved and is expected to start operation in 2017. In fact, four more UHV transmission cables connecting Inner Mongolia (two lines from Inner Mongolia East and two from Inner Mongolia West) to the south or east, are pending approval. If they are approved, they will be expected to start in 2017, as well. With these transmission cables, we expect the wind curtailment ratio will drop and the utilization hours will also increase.
We believe Datang Renewable has low asset quality as we estimate it has around 76% of projects in regions with high curtailment ratios.
August 13, 2014 55
China Datang Corporation Renewable Power
Figure 122: China UHV transmission projects that will transmit wind power
# Transmission line Start End Voltage
(kV) Length
(km)
Transmission capacity
(MW) Status Construction
start date Operational
date
Expected operation
date
1a Jindongnan-Nanyang-Jinmen AC Shanxi Hubei 1,000 640 2,800 Operational Aug 2006 Jan 2009 -1b Jindongnan-Nanyang-Jinmen AC Shanxi Hubei 1,000 - 2,200 Operational Jan 2011 Dec 2011 -2 Xiangjiaba – Shanghai HVDC Sichuan Shanghai ±800 1,980 6,400 Operational Dec 2007 Jan 2009 -3 Yunnnan – Guangdong HVDC Yunnan Guangdong ±800 1,438 5,000 Operational Dec 2006 Jun 2010 -4 Jinping – Sunan DC Sichuan Jiangsu ±800 2,090 7,200 Operational Dec 2009 Dec 2012 -5 Huainan –Shanghai UHV AC Anhui Shanghai 1,000 656 5,000 Operational Sep 2011 Aug 2013 -6 Nuozhadu-Guangdong HVDC Yunnan Guangdong ±800 1,451 5,000 Operational Dec 2011 Sep 2013 -7 Xiluodu-Guangdong HVDC project Yunnan Guangdong ±800 1,286 6,400 Operational Dec 2011 Oct 2013 -8 Hami - Zhengzhou UHVDC Xinjiang Henan ±800 2,300 7,500 Operational May 2012 Jan 2014 -9 Xiluodu-Zhejiang Jinhua UHV DC Sichuan Zhejiang ±800 1,653 8,000 Operational Jul 2012 Jul 2014 - Total (operating) 13,494 55,500 10 Zhangjiakou 500kV Hebei North China 500 - 1,800 Constructing Apr 2014 - 2014 11 Huainan-Nanjing-Shanghai AC Jiangsu Shanghai 1,000 780 5,000 Constructing Jun 2014 - 2016 12 Ningdong-Zhejiang DC Ningxia Zhejiang ±800 1,720 8,000 Approved - - 2015 13 Jiuquan-Hunan DC Gansu Hunan ±800 2,400 8,000 Approved - - 2016 14 Ximeng -Shandong Jinan 1000kV AC IM East Shandong 1,000 1,146 9,000 Approved - - 2017 15 Hami - Chongqing DC Xinjiang Chongqing ±800 2,300 8,000 Pending - - 2015 16 Huaidong - Sichuan DC Xinjiang Sichuan ±1100 2,645 10,000 Pending - - 2015 17 Ordos Shanghai Miao-Shandong DC IM West Shandong ±800 1,200 8,000 Pending - - 2016 18 Ximeng – Jiangsu Taizhou DC IM East Jiangsu ±800 1,620 8,000 Pending - - 2017
19 Inner Mongolia West to Tianjin south AC
IM West Tianjin 1,000 1,452 4,800 Pending - - 2017
20 Ximeng-Nanjing 1000kV AC IM East Jiangsu 1,000 2,838 9,400 Pending - - 2017 Total (constructing) 18,101 80,000 Source: State Grid, news reports, NEA, Maybank Kim Eng
Weak balance sheet We forecast net gearing will rise to 421% at end-2014E from 411% at end-2013. The high net gearing has limited its growth potential, in our view. We believe the company has a conservative capex plan for 2014 and forecast it will be the lowest among the two peers.
In fact, we calculate its pre-approved projects in the 3rd batch and 4th batch are also smaller in scale to those operated by the other two companies under our coverage. Although most of DR’s pre-approved projects are at a more profitable level, such as those in Yunnan and Shanxi, their scale remains small compared to the current capacity.
Figure 123: Net gearing forecast
Source: Maybank Kim Eng
340%
350%
360%
370%
380%
390%
400%
410%
420%
430%
2012 2013 2014E 2015E
We believe the net gearing ratio of Datang Renewable will increase from 411% in 2013 to 421% in 2014E.
August 13, 2014 56
China Datang Corporation Renewable Power
Figure 124: Wind pre-approval projects by province (MW)
# Regions Datang (2013) Datang (2014) *Utilisation hours
2013 *Curtailment ratio
1H14 1 Shanxi 347 0 2,220 0.4% 2 Jiangsu 97.5 50 2,150 0.0% 3 Yunnan 147 0 2,388 1.5% 4 Hebei 145.5 0 2,251 14.6% 5 Jiangxi 104 0 2,225 0.0% 6 Shandong 49.5 48 2,008 1.2% 7 Anhui 0 50 1,948 0.0% 8 Liaoning 0 49.5 1,934 7.9% 9 Chongqing 49.5 0 2,185 0.0% 10 Hunan 49.5 0 2,000 0.0% 11 Guangxi 0 49.5 2,100 0.0% 12 Fujian 0 48 2,666 0.0% 13 Henan 48 0 2,202 0.0% 14 Guangdong 39 0 1,900 0.0% Total 1,076.5 295.0 Note: *Utilisation hours and curtailment ratio are based on industry figures. Source: National Energy Administration, Kim Eng Securities
Initiate at HOLD with TP of HKD1.10 DR announced that based on the preliminary estimates, it is expected to record a loss in the operating results in 1H14E vs CNY286m net profit in 1H13. The possible loss was mainly due to the worse wind resources which led to a decrease in overall power generation. However, we believe the recent share price weakness has already reflected the weak 1H14E results.
We think the company’s low trading multiples, eg 0.7x P/BV, are justified due to its lower profitability and earnings growth potential induced by the low quality of its assets.
Initiate at HOLD with a DCF-based TP of HKD1.10. We assume a 9.1% WACC and 4% terminal growth rate.
Figure 125: DCF valuation Terminal value
Terminal Growth Rate 4.0% Terminal WACC 9.1% Estimated Free Cash Flow 3,803.4 Terminal Value 74,977.8 NPV of Terminal Value 39,468.3
DCF valuation
NPV of Forecasts 9,335.3 NPV of Terminal Value 39,468.3 Enterprise Value 48,803.6 Less: Net Debt (40,177.6) Less: Minority interest (2,226.1) Equity Value 6,400.0
No. Shares (millions) 7,274 Per Share Equity Value CNY0.88 Per Share Equity Value HKD1.10
Source: Maybank Kim Eng
Figure 126: Sensitivity analysis, WACC against terminal growth
NGUYEN Thi Sony Tra Mi (84) 8 44 555 888 x 8084 [email protected] • Port operation • Pharmaceutical • Food & Beverage
August 13, 2014 62
Chinese Wind Power
APPENDIX I: TERMS FOR PROVISION OF REPORT, DISCLAIMERS AND DISCLOSURES
DISCLAIMERS
This research report is prepared for general circulation and for information purposes only and under no circumstances should it be considered or intended as an offer to sell or a solicitation of an offer to buy the securities referred to herein. Investors should note that values of such securities, if any, may fluctuateand that each security’s price or value may rise or fall. Opinions or recommendations contained herein are in form of technical ratings and fundamental ratings. Technical ratings may differ from fundamental ratings as technical valuations apply different methodologies and are purely based on price and volume-related information extracted from the relevant jurisdiction’s stock exchange in the equity analysis. Accordingly, investors’ returns may be less thanthe original sum invested. Past performance is not necessarily a guide to future performance. This report is not intended to provide personal investment advice and does not take into account the specific investment objectives, the financial situation and the particular needs of persons who may receive or read this report. Investors should therefore seek financial, legal and other advice regarding the appropriateness of investing in any securities or the investment strategies discussed or recommended in this report.
The information contained herein has been obtained from sources believed to be reliable but such sources have not been independently verified by Maybank Investment Bank Berhad, its subsidiary and affiliates (collectively, “MKE”) and consequently no representation is made as to the accuracy or completeness of this report by MKE and it should not be relied upon as such. Accordingly, MKE and its officers, directors, associates, connected parties and/or employees(collectively, “Representatives”) shall not be liable for any direct, indirect or consequential losses or damages that may arise from the use or reliance of this report. Any information, opinions or recommendations contained herein are subject to change at any time, without prior notice.
This report may contain forward looking statements which are often but not always identified by the use of words such as “anticipate”, “believe”, “estimate”, “intend”, “plan”, “expect”, “forecast”, “predict” and “project” and statements that an event or result “may”, “will”, “can”, “should”, “could” or “might” occur or be achieved and other similar expressions. Such forward looking statements are based on assumptions made and information currently available to usand are subject to certain risks and uncertainties that could cause the actual results to differ materially from those expressed in any forward looking statements. Readers are cautioned not to place undue relevance on these forward-looking statements. MKE expressly disclaims any obligation to update orrevise any such forward looking statements to reflect new information, events or circumstances after the date of this publication or to reflect the occurrence of unanticipated events.
MKE and its officers, directors and employees, including persons involved in the preparation or issuance of this report, may, to the extent permitted by law, from time to time participate or invest in financing transactions with the issuer(s) of the securities mentioned in this report, perform services for or solicitbusiness from such issuers, and/or have a position or holding, or other material interest, or effect transactions, in such securities or options thereon, or other investments related thereto. In addition, it may make markets in the securities mentioned in the material presented in this report. MKE may, to the extent permitted by law, act upon or use the information presented herein, or the research or analysis on which they are based, before the material is published.One or more directors, officers and/or employees of MKE may be a director of the issuers of the securities mentioned in this report.
This report is prepared for the use of MKE’s clients and may not be reproduced, altered in any way, transmitted to, copied or distributed to any other party inwhole or in part in any form or manner without the prior express written consent of MKE and MKE and its Representatives accepts no liability whatsoever for the actions of third parties in this respect.
This report is not directed to or intended for distribution to or use by any person or entity who is a citizen or resident of or located in any locality, state, country or other jurisdiction where such distribution, publication, availability or use would be contrary to law or regulation. This report is for distribution only under such circumstances as may be permitted by applicable law. The securities described herein may not be eligible for sale in all jurisdictions or to certain categories of investors. Without prejudice to the foregoing, the reader is to note that additional disclaimers, warnings or qualifications may apply based on geographical location of the person or entity receiving this report.
Malaysia
Opinions or recommendations contained herein are in the form of technical ratings and fundamental ratings. Technical ratings may differ from fundamental ratings as technical valuations apply different methodologies and are purely based on price and volume-related information extracted from Bursa Malaysia Securities Berhad in the equity analysis.
Singapore
This report has been produced as of the date hereof and the information herein may be subject to change. Maybank Kim Eng Research Pte. Ltd. (“Maybank KERPL”) in Singapore has no obligation to update such information for any recipient. For distribution in Singapore, recipients of this report are to contact Maybank KERPL in Singapore in respect of any matters arising from, or in connection with, this report. If the recipient of this report is not an accredited investor, expert investor or institutional investor (as defined under Section 4A of the Singapore Securities and Futures Act), Maybank KERPL shall be legally liable for the contents of this report, with such liability being limited to the extent (if any) as permitted by law.
Thailand
The disclosure of the survey result of the Thai Institute of Directors Association (“IOD”) regarding corporate governance is made pursuant to the policy of the Office of the Securities and Exchange Commission. The survey of the IOD is based on the information of a company listed on the Stock Exchange of Thailand and the market for Alternative Investment disclosed to the public and able to be accessed by a general public investor. The result, therefore, is from the perspective of a third party. It is not an evaluation of operation and is not based on inside information. The survey result is as of the date appearing in the Corporate Governance Report of Thai Listed Companies. As a result, the survey may be changed after that date. Maybank Kim Eng Securities (Thailand) PublicCompany Limited (“MBKET”) does not confirm nor certify the accuracy of such survey result.
Except as specifically permitted, no part of this presentation may be reproduced or distributed in any manner without the prior written permission of MBKET.MBKET accepts no liability whatsoever for the actions of third parties in this respect.
US
This research report prepared by MKE is distributed in the United States (“US”) to Major US Institutional Investors (as defined in Rule 15a-6 under the Securities Exchange Act of 1934, as amended) only by Maybank Kim Eng Securities USA Inc (“Maybank KESUSA”), a broker-dealer registered in the US (registered under Section 15 of the Securities Exchange Act of 1934, as amended). All responsibility for the distribution of this report by Maybank KESUSA in the US shall be borne by Maybank KESUSA. All resulting transactions by a US person or entity should be effected through a registered broker-dealer in the US. This report is not directed at you if MKE is prohibited or restricted by any legislation or regulation in any jurisdiction from making it available to you. You should satisfy yourself before reading it that Maybank KESUSA is permitted to provide research material concerning investments to you under relevantlegislation and regulations.
UK
This document is being distributed by Maybank Kim Eng Securities (London) Ltd (“Maybank KESL”) which is authorized and regulated, by the Financial Services Authority and is for Informational Purposes only. This document is not intended for distribution to anyone defined as a Retail Client under the Financial Services and Markets Act 2000 within the UK. Any inclusion of a third party link is for the recipients convenience only, and that the firm does not take anyresponsibility for its comments or accuracy, and that access to such links is at the individuals own risk. Nothing in this report should be considered as constituting legal, accounting or tax advice, and that for accurate guidance recipients should consult with their own independent tax advisers.
August 13, 2014 63
Chinese Wind Power
Disclosure of Interest Malaysia: MKE and its Representatives may from time to time have positions or be materially interested in the securities referred to herein and may further act as market maker or may have assumed an underwriting commitment or deal with such securities and may also perform or seek to perform investment banking services, advisory and other services for or relating to those companies.
Singapore: As of 13 August 2014, Maybank KERPL and the covering analyst do not have any interest in any companies recommended in this research report.
Thailand: MBKET may have a business relationship with or may possibly be an issuer of derivative warrants on the securities /companies mentioned in the research report. Therefore, Investors should exercise their own judgment before making any investment decisions. MBKET, its associates, directors, connected parties and/or employees may from time to time have interests and/or underwriting commitments in the securities mentioned in this report.
Hong Kong: KESHK may have financial interests in relation to an issuer or a new listing applicant referred to as defined by the requirements under Paragraph 16.5(a) of the Hong Kong Code of Conduct for Persons Licensed by or Registered with the Securities and Futures Commission.
As of 13 August 2014, KESHK and the authoring analyst do not have any interest in any companies recommended in this research report.
MKE may have, within the last three years, served as manager or co-manager of a public offering of securities for, or currently may make a primary market in issues of, any or all of the entities mentioned in this report or may be providing, or have provided within the previous 12 months, significant advice or investment services in relation to the investment concerned or a related investment and may receive compensation for the services provided from the companies covered in this report.
OTHERS Analyst Certification of Independence
The views expressed in this research report accurately reflect the analyst’s personal views about any and all of the subject securities or issuers; and no part of the research analyst’s compensation was, is or will be, directly or indirectly, related to the specific recommendations or views expressed in the report.
Reminder
Structured securities are complex instruments, typically involve a high degree of risk and are intended for sale only to sophisticated investors who are capable of understanding and assuming the risks involved. The market value of any structured security may be affected by changes in economic, financial and political factors (including, but not limited to, spot and forward interest and exchange rates), time to maturity, market conditions and volatility and the credit quality of any issuer or reference issuer. Any investor interested in purchasing a structured product should conduct its own analysis of the product and consult with its own professional advisers as to the risks involved in making such a purchase.
No part of this material may be copied, photocopied or duplicated in any form by any means or redistributed without the prior consent of MKE.
Definition of Ratings
Maybank Kim Eng Research uses the following rating system BUY Return is expected to be above 10% in the next 12 months (excluding dividends) HOLD Return is expected to be between - 10% to +10% in the next 12 months (excluding dividends) SELL Return is expected to be below -10% in the next 12 months (excluding dividends)
Applicability of Ratings
The respective analyst maintains a coverage universe of stocks, the list of which may be adjusted according to needs. Investment ratings are only applicable to the stocks which form part of the coverage universe. Reports on companies which are not part of the coverage do not carry investment ratings as we do not actively follow developments in these companies.
DISCLOSURES Legal Entities Disclosures
Malaysia: This report is issued and distributed in Malaysia by Maybank Investment Bank Berhad (15938-H) which is a Participating Organization of Bursa Malaysia Berhad and a holder of Capital Markets and Services License issued by the Securities Commission in Malaysia. Singapore: This material is issued and distributed in Singapore by Maybank KERPL (Co. Reg No 197201256N) which is regulated by the Monetary Authority of Singapore. Indonesia: PT Kim Eng Securities (“PTKES”) (Reg. No. KEP-251/PM/1992) is a member of the Indonesia Stock Exchange and is regulated by the BAPEPAM LK. Thailand: MBKET (Reg. No.0107545000314) is a member of the Stock Exchange of Thailand and is regulated by the Ministry of Finance and the Securities and Exchange Commission. Philippines: Maybank ATRKES (Reg. No.01-2004-00019) is a member of the Philippines Stock Exchange and is regulated by the Securities and Exchange Commission. Vietnam: Maybank Kim Eng Securities JSC (License Number: 71/UBCK-GP) is licensed under the State Securities Commission of Vietnam.Hong Kong: KESHK (Central Entity No AAD284) is regulated by the Securities and Futures Commission. India: Kim Eng Securities India Private Limited (“KESI”) is a participant of the National Stock Exchange of India Limited (Reg No: INF/INB 231452435) and the Bombay Stock Exchange (Reg. No. INF/INB 011452431) and is regulated by Securities and Exchange Board of India. KESI is also registered with SEBI as Category 1 Merchant Banker (Reg. No. INM 000011708) US: Maybank KESUSA is a member of/ and is authorized and regulated by the FINRA – Broker ID 27861. UK: Maybank KESL (Reg No 2377538) is authorized and regulated by the Financial Services Authority.
August 13, 2014 64
Chinese Wind Power
Malaysia Maybank Investment Bank Berhad (A Participating Organisation of Bursa Malaysia Securities Berhad) 33rd Floor, Menara Maybank, 100 Jalan Tun Perak, 50050 Kuala Lumpur Tel: (603) 2059 1888; Fax: (603) 2078 4194
Singapore Maybank Kim Eng Securities Pte Ltd Maybank Kim Eng Research Pte Ltd 9 Temasek Boulevard #39-00 Suntec Tower 2 Singapore 038989 Tel: (65) 6336 9090 Fax: (65) 6339 6003
London Maybank Kim Eng Securities (London) Ltd 5th Floor, Aldermary House 10-15 Queen Street London EC4N 1TX, UK Tel: (44) 20 7332 0221 Fax: (44) 20 7332 0302
New York Maybank Kim Eng Securities USA Inc 777 Third Avenue, 21st Floor New York, NY 10017, U.S.A. Tel: (212) 688 8886 Fax: (212) 688 3500
Stockbroking Business: Level 8, Tower C, Dataran Maybank, No.1, Jalan Maarof 59000 Kuala Lumpur Tel: (603) 2297 8888 Fax: (603) 2282 5136
Hong Kong Kim Eng Securities (HK) Ltd Level 30, Three Pacific Place, 1 Queen’s Road East, Hong Kong Tel: (852) 2268 0800 Fax: (852) 2877 0104
Indonesia PT Maybank Kim Eng Securities Plaza Bapindo Citibank Tower 17th Floor Jl Jend. Sudirman Kav. 54-55 Jakarta 12190, Indonesia Tel: (62) 21 2557 1188 Fax: (62) 21 2557 1189
India Kim Eng Securities India Pvt Ltd 2nd Floor, The International 16, Maharishi Karve Road, Churchgate Station, Mumbai City - 400 020, India Tel: (91) 22 6623 2600 Fax: (91) 22 6623 2604
Philippines Maybank ATR Kim Eng Securities Inc. 17/F, Tower One & Exchange Plaza Ayala Triangle, Ayala Avenue Makati City, Philippines 1200 Tel: (63) 2 849 8888 Fax: (63) 2 848 5738
Thailand Maybank Kim Eng Securities (Thailand) Public Company Limited 999/9 The Offices at Central World, 20th - 21st Floor, Rama 1 Road Pathumwan, Bangkok 10330, Thailand Tel: (66) 2 658 6817 (sales) Tel: (66) 2 658 6801 (research)
Vietnam Maybank Kim Eng Securities Limited 4A-15+16 Floor Vincom Center Dong Khoi, 72 Le Thanh Ton St. District 1 Ho Chi Minh City, Vietnam Tel : (84) 844 555 888 Fax : (84) 8 38 271 030
Saudi Arabia In association with Anfaal Capital Villa 47, Tujjar Jeddah Prince Mohammed bin Abdulaziz Street P.O. Box 126575 Jeddah 21352 Tel: (966) 2 6068686 Fax: (966) 26068787
South Asia Sales Trading Kevin Foy Regional Head Sales Trading [email protected] Tel: (65) 6336-5157 US Toll Free: 1-866-406-7447
North Asia Sales Trading Alex Tsun [email protected] Tel: (852) 2268 0228 US Toll Free: 1 877 837 7635


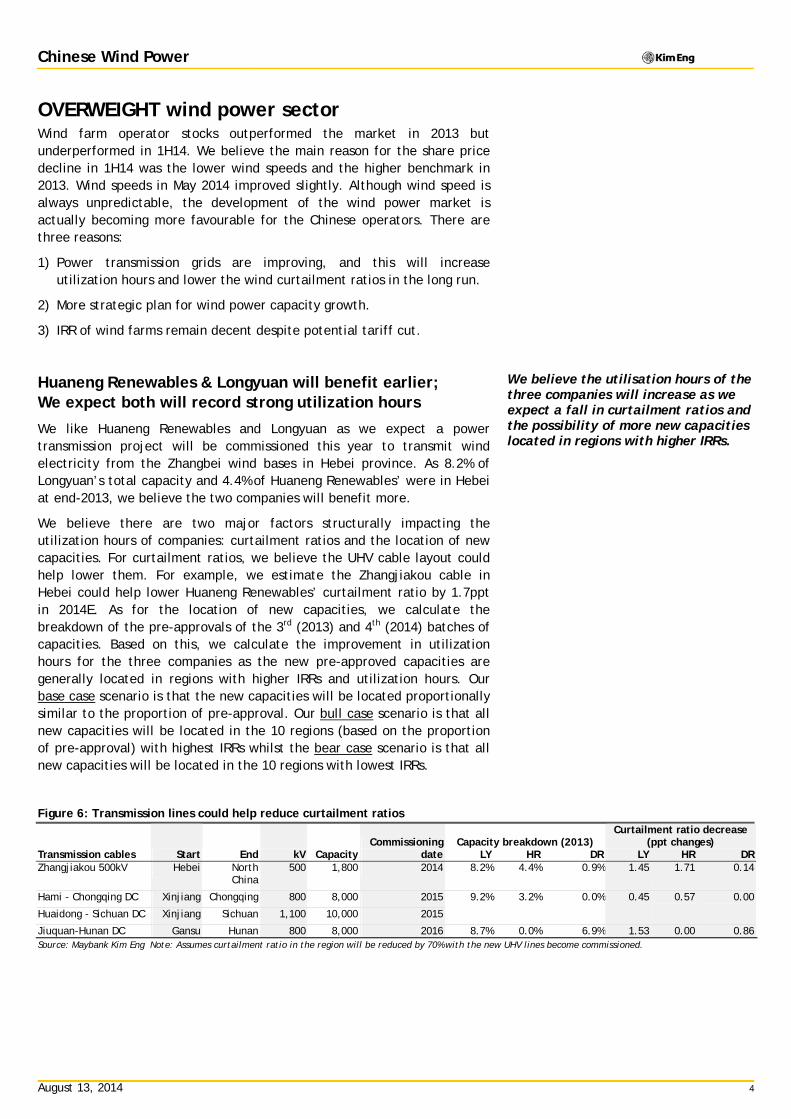


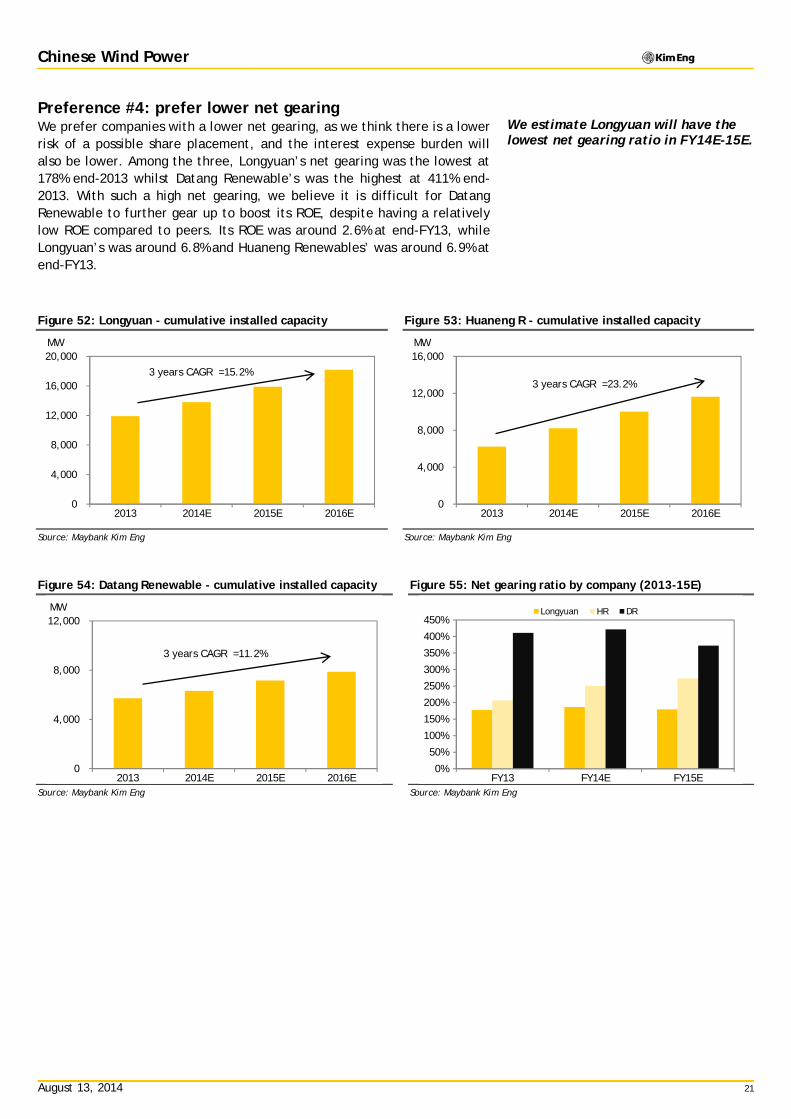
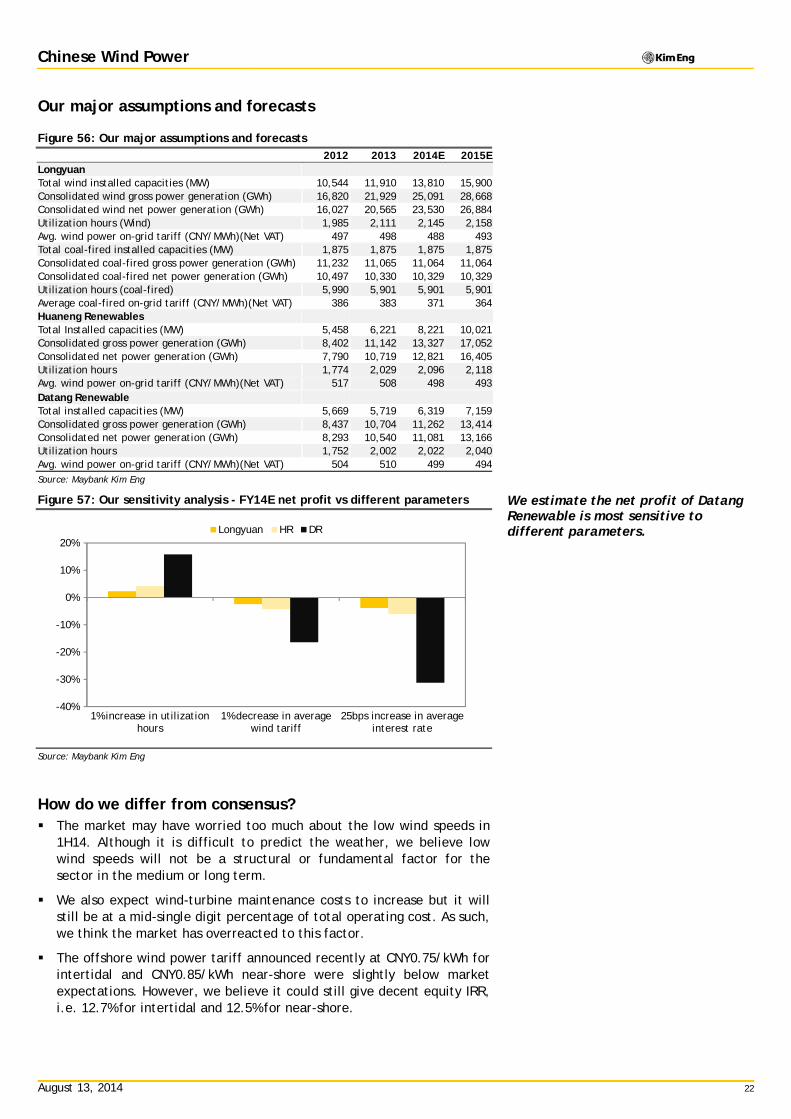


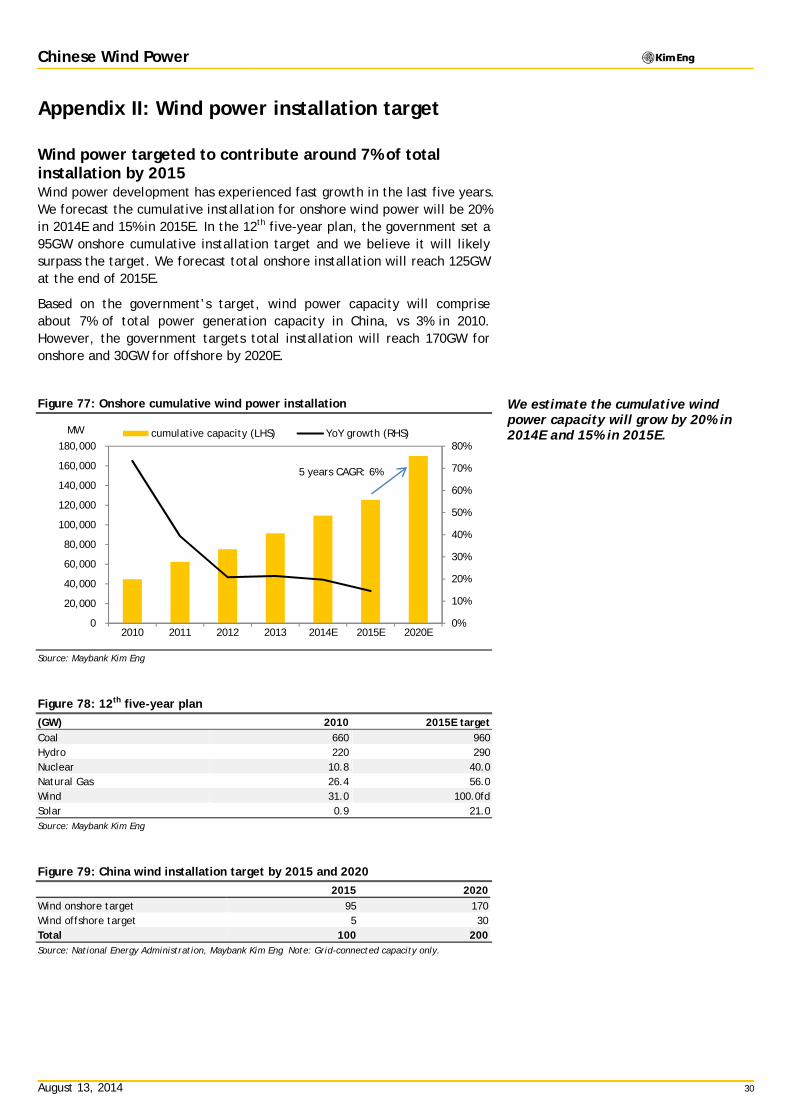
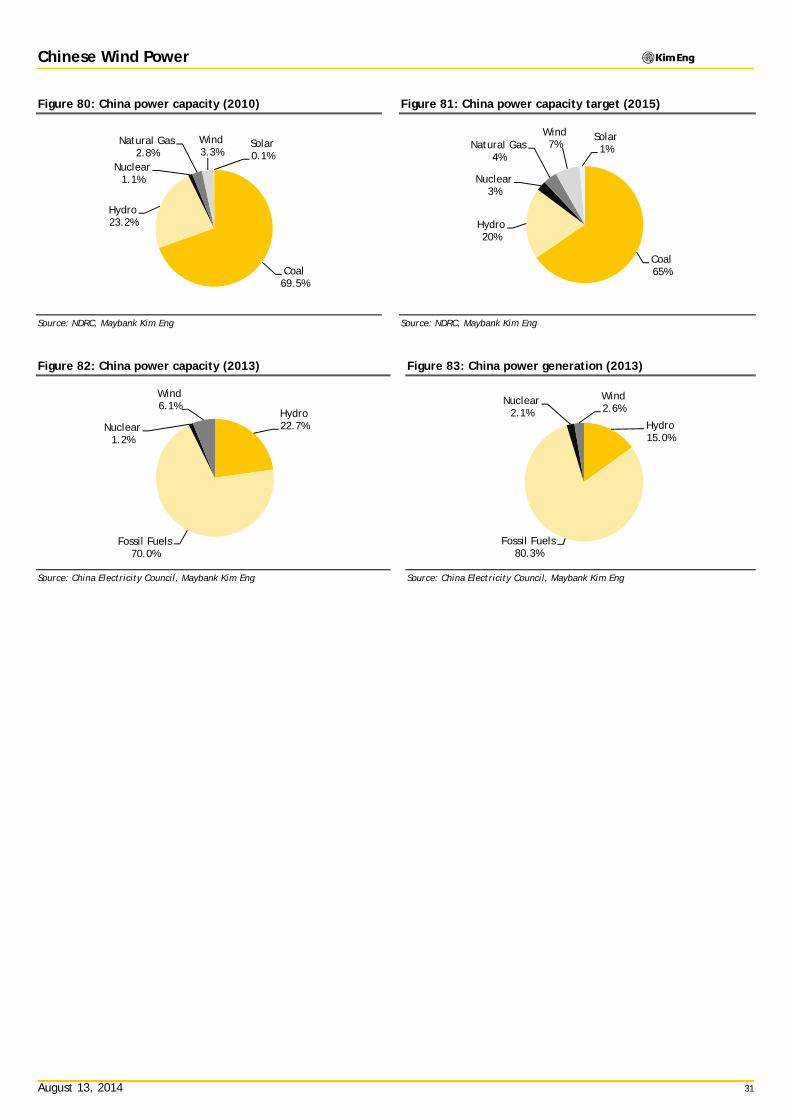


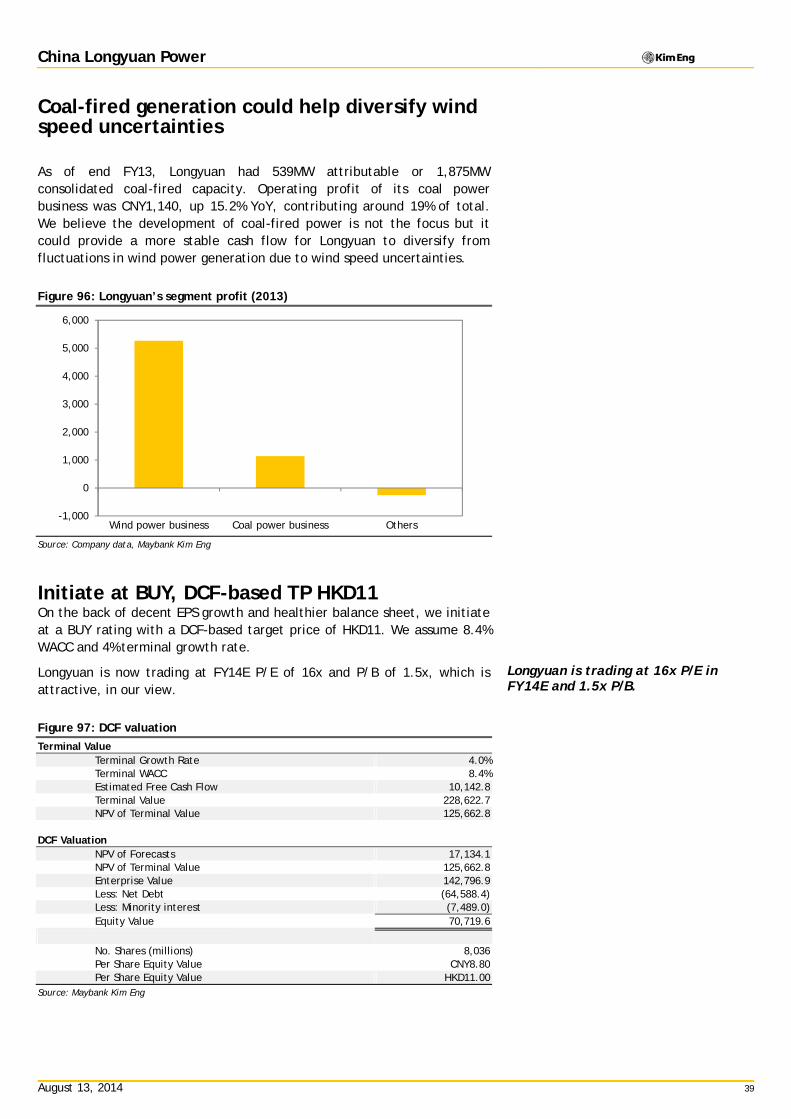


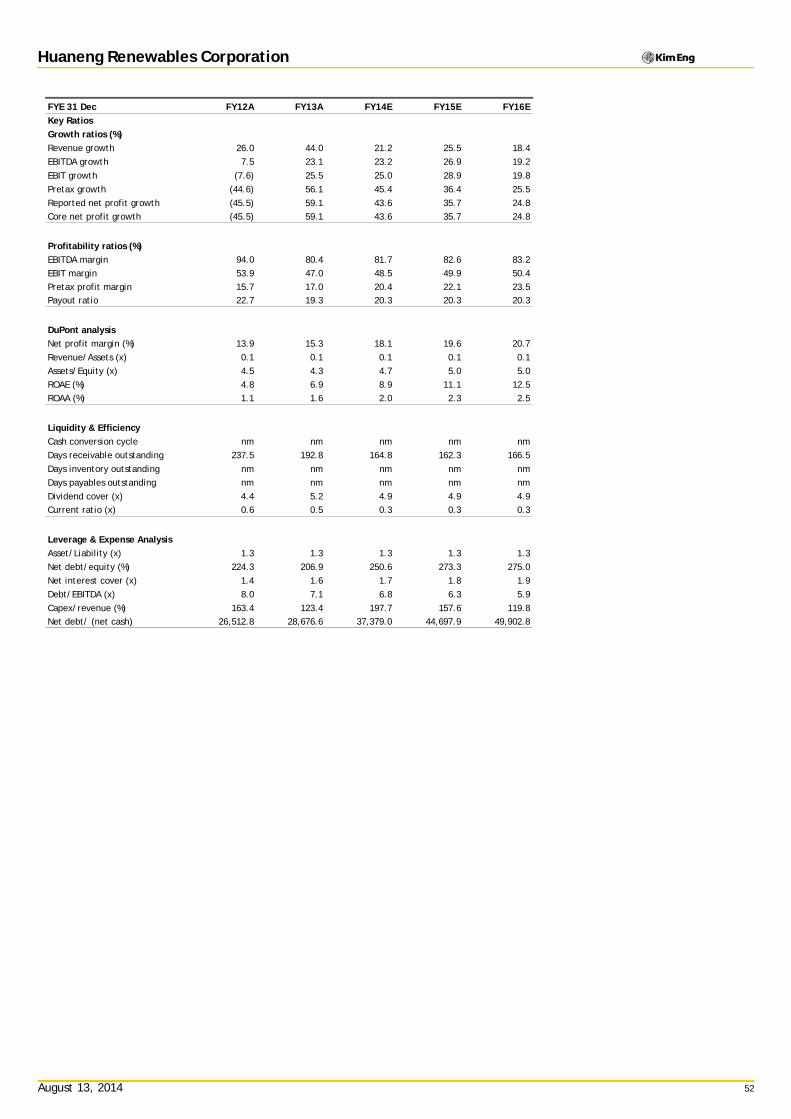


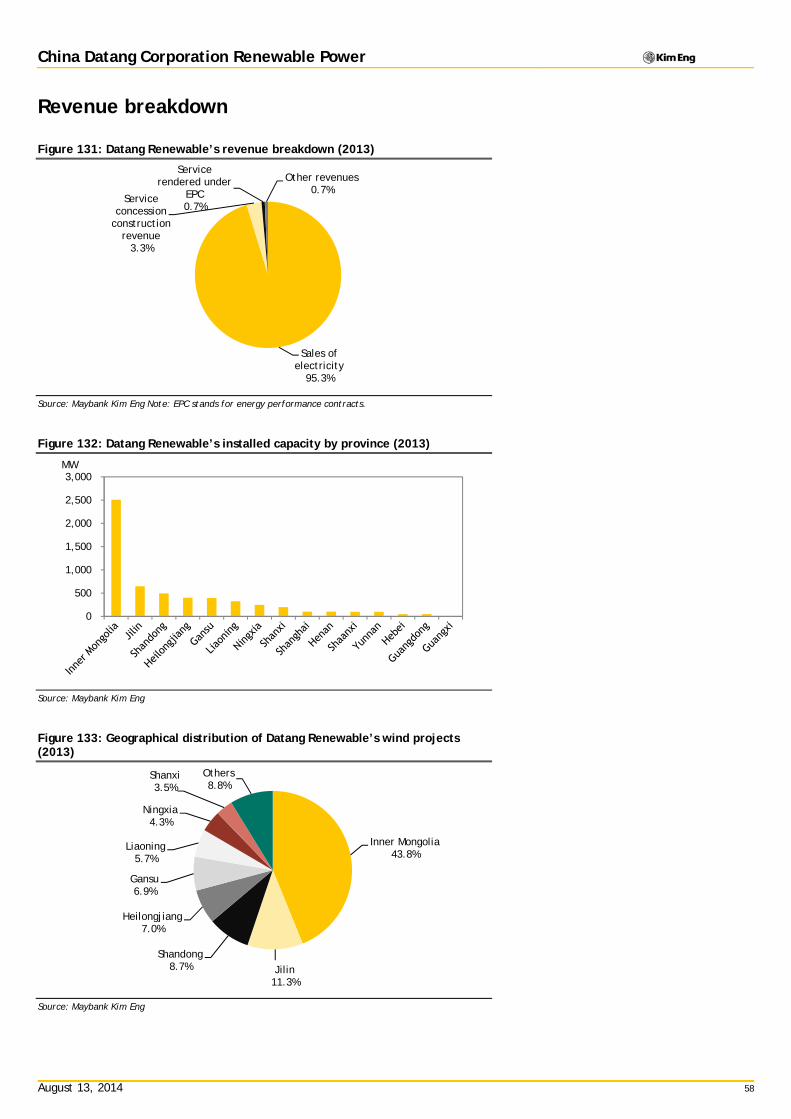

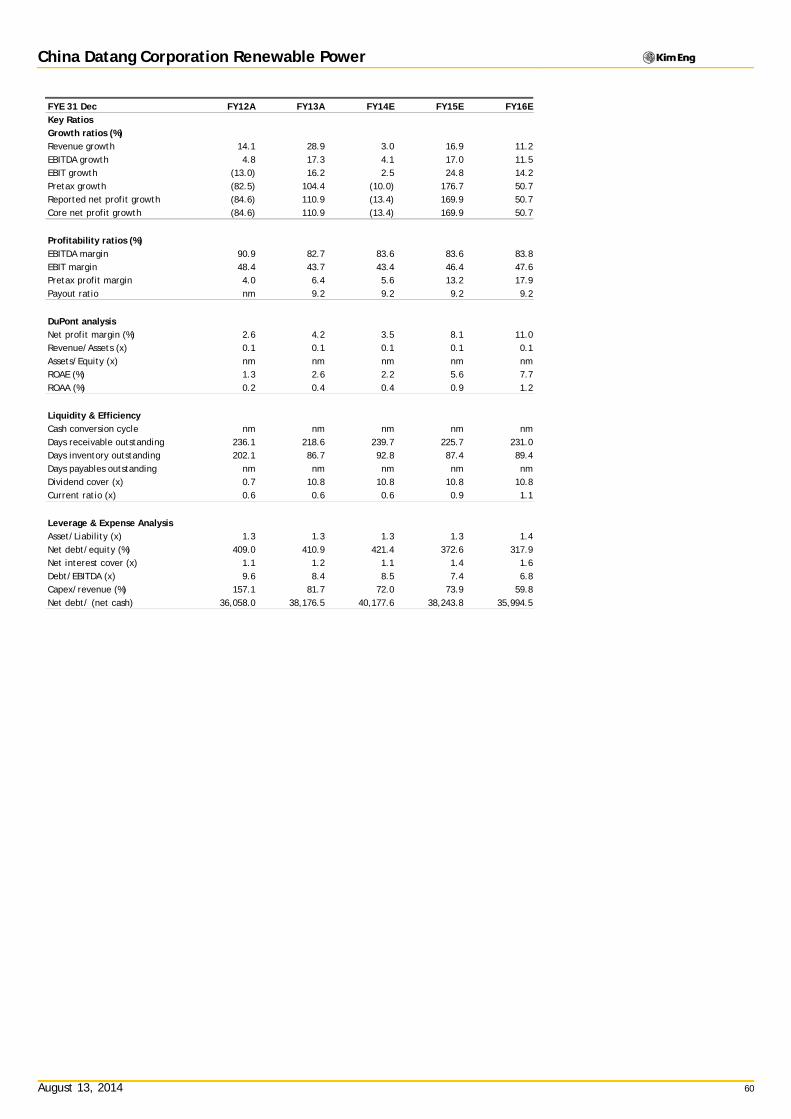


![Longyuan-Arrk (Macao) Pte Ltd v Show and Tell Productions Pte Ltd and Another Suit [2013] SGHC 160](https://static.documents.pub/doc/80x56/577cd7f61a28ab9e78a01604/longyuan-arrk-macao-pte-ltd-v-show-and-tell-productions-pte-ltd-and-another.jpg)


