44
Euro Chlor Risk Assessment for the Marine Environment OSPARCOM Region - North Sea Chloroform July 1997

Euro Chlor Risk Assessment for the Marine Environment OSPARCOM Region - North Sea
Chloroform
July 1997

Chloroform 02/07/97
2
EURO CHLOR RISK ASSESSMENT FOR THE MARINE ENVIRONMENT
Chloroform
OSPARCOM Region - North Sea
EXECUTIVE SUMMARY Euro Chlor has voluntarily agreed to carry out risk assessment of 25 chemicals related to the chlorine industry, specifically for the marine environment and according to the methodology laid down in the EU risk assessment Regulation (1488/94) and the Guidance Documents of the EU Existing Substances Regulation (793/93). This was done as a parallel exercise with the on-going European Risk Assessment the scope of which being broader and covering all compartments. The study consists of the collection and evaluation of data on effects and environmental concentrations. Basically, the effect data are derived from laboratory toxicity tests and exposure data from analytical monitoring programs. Finally the risk is indicated by comparing the “predicted environmental concentrations” (PEC) with the “predicted no effect concentrations” (PNEC), expressed as a hazard quotient for the marine aquatic environment. To determine the PNEC value, three different trophic levels are considered: primary producers (aquatic plants), primary consumers (invertebrates) and secondary consumers (fishes). In the case of chloroform (CLM3) 23 data for fish, 17 data for invertebrates and 10 data for algae have been evaluated according to the quality criteria recommended by the European authorities. Both acute and chronic toxicity studies have been taken into account and the appropriate assessment factors have been used to define a final PNEC value of 72 µg/l. All the monitoring data available indicate a progressive decrease of the chloroform concentration in surface waters since 1983 up to now. Most of the available monitoring data apply to rivers and estuary waters and were used to calculate PEC’s. The most recent data (1991-1995) support a typical PEC of 0.2 to 0.3 µg chloroform per litre of water and a worst case PEC of 5 to 11,5 µg chloroform per litre of water. The calculated PEC/PNEC ratios give a safety margin of 6 to 360 between the predicted no effect concentration and the exposure concentrations. Dilution within the sea would of course increase those safety margins. Moreover, as the available data on persistence of chloroform indicate a half-life in water of a few hours or days and as the bioaccumulation in marine organisms can be considered as negligible, it can be concluded that the present use of chloroform does not represent a risk to the aquatic environment.

Chloroform 02/07/97
3
1. INTRODUCTION: PRINCIPLES AND PURPOSES OF EURO CHLOR RISK ASSESSMENT
Within the EU a programme is being carried out to assess the environmental and human health risks for "existing chemicals", which also include chlorinated chemicals. In due course the most important chlorinated chemicals that are presently in the market will be dealt with in this formal programme. In this activity Euro Chlor members are cooperating with member state rapporteurs. These risk assessment activities include human health risks as well as a broad range of environmental scenarios.
Additionally Euro Chlor has voluntarily agreed to carry out limited risk assessments for 25 prioritised chemicals related to the chlorine industry. These compounds are on lists of concern of European Nations participating in the North Sea Conference. The purpose of this activity is to explore if chlorinated chemicals presently pose a risk to the marine environment especially for the North Sea situation. This will indicate the necessity for further refinement of the risk assessments and eventually for additional risk reduction programmes. These risk assessments are carried out specifically for the marine environment according to principles given in Appendix 1. The EU methodology is followed as laid down in the EU risk assessment Regulation (1488/94) and the Guidance Documents of the EU Existing Substances Regulation (793/93). The exercise consists of the collection and evaluation of data on effects and environmental concentrations. Basically, the effect data are derived from laboratory toxicity tests and exposure data from analytical monitoring programs. Where necessary the exposure data are backed up with calculated concentrations based on emission models. Finally the risk is indicated by comparing the "predicted environmental concentrations" (PEC) with the "predicted no effect concentrations" (PNEC), expressed as a hazard quotient for the marine aquatic environment.
2. DATA SOURCES
The data used in this risk assessment activity are primarily derived from the data given in the HEDSET (updated version of 10 Jan. 1996). Where necessary additional sources have been used. For interested parties the HEDSET is available at Euro Chlor. The references of the HEDSET and additional sources are given in chapter 10.

Chloroform 02/07/97
4
3. COMPOUND IDENTIFICATION 3.1 Description
CAS number : 67-66-3 EINECS : 200-663-8 IUPAC name : Chloroform
Chloroform is also known as trichloromethane and is sometimes abbreviated to CLM3.
Chloroform has the following formula: C H Cl3
Cl |
Cl - C - H |
Cl
3.2 EU labelling
According to Annex I of Directive 93/72/EEC (1.9.93 - 19th TPA), chloroform is classified Xn, R22-48/20/22, Xi, R38, Carc. Cat. 3, R40. This classification is applicable for both the pure compound and products containing > 20% chloroform.
Environmental labelling was discussed at the EU working group ; the proposition that chloroform should not be classified as “dangerous for the environment” according to the EU criteria was adopted.

Chloroform 02/07/97
5
4. PHYSICO-CHEMICAL PROPERTIES
Table 1 gives the major chemical and physical properties of the compound which were adopted for the purpose of this risk assessment.
Table 1: Physical and chemical properties of chloroform
Property Value
Molecular weight 119.38 g/mol
Aspect clear liquid
Melting point - 63.5 °C
Boiling point 60.5 - 61.2 °C
Density 1.476 - 1.478 g/cm3 (20°C)
Vapour pressure 211 hPa (20°C)
Log octanol-water partition coefficient 2 (25°C)
Koc (measured) 63.4 - 86.7 Water solubility
8 g/l (20°C)
Henry´s Law constant 314.84 Pa . m3/mol
5. COMPARTMENT OF CONCERN BY MACKAY LEVEL I MODEL
The risk assessment presented here focuses on the marine environment, with special attention for the North Sea conditions where appropriate. Although this risk assessment focuses only on one compartment, it should be borne in mind that all environmental compartments are inter-related.
An indication of the partitioning tendency of a compound can be defined using Mackay level I calculation obtained through the ENVCLASS software distributed by the "Nordic Council of Ministers". This model describes the ultimate distribution of the compound in the environment (Mackay et al., 1990 - Pederson et al., 1994).
It should be recognized, however, that this model takes no account of transfer rates between compartments, the compartment into which the chemical is discharged, or any removal processes within compartments. Hence it is not designed to predict environmental concentrations for the purpose of risk assessment.
The results of such a calculation for chloroform are given in Table 2.

Chloroform 02/07/97
6
Table 2 : Results of a Mackay level I calculation for chloroform
Compartment %
Air 99.09
Water 0.89
Soil 0.01
Sediment 0.01
(See Appendix 2 for details of calculations) 6. USE AND APPLICATIONS 6.1 Main uses Chloroform is mainly used in the European Union to the extent of 90-95 % as
feedstock for the manufacture of other chemicals. The main application is the manufacture of HCFC 22 and through this substance, chloroform is also an important building block for fluorinated polymers and copolymers. Other applications as feedstock are in the synthesis of dyestuffs, pharmaceutical products and pesticides.
Chloroform is also used as a solvent, for example in the extraction of penicillin and other antibiotics, and for pesticides, fats, oils, rubbers, alkaloids and waxes.
6.2 Production and sales The chloroform sales and uses in Europe for 1995 are estimated as follows (t/y) :
Feedstock 240,259 Others including process agent in pharmaceuticals, agrochemicals, etc.
12,428
Europe is a net exporter of chloroform in the range of 20 to 30,000 tonnes per year.
Chloroform is produced in Belgium, France, Germany, Italy, Spain and the UK. The total capacity in the European Union is estimated at 316,000 tonnes. 6.3 Applicable regulations In the E.U. the chloroform emissions in water are governed by the EC Directive
88/347 which requires an emission limit of 1 mg/l in the process effluent. The surface water quality objective defined by the same Directive is 12 µg/l. The last draft of quality objectives for surface waters, for the 132 substances of Annex I of Directive 764/76 indicates for chloroform a quality objective of 10 µg/l.

Chloroform 02/07/97
7
7. EFFECT ASSESSMENT
As a first approach, this chapter only considers the following three trophic levels: primary producers (aquatic plants), primary consumers (invertebrates) and secondary consumers (fish). The effects on other organisms are only discussed when indicated.
The evaluation of the data was conducted according to the quality criteria recommended by the European authorities (Commission Regulation 1488/94/EEC). The evaluation criteria are given in Appendix 1.
Data from all available sources, including company data and data from the open literature, were collected and incorporated into the HEDSET for chloroform, including their references (updated version of 1/96). A summary of all data is given in Appendix 3. In total 23 different data points on fish, 17 different data points on aquatic invertebrates and 10 different data points on algae including cyanaobacteria have been evaluated. For each trophic level only one data point was considered valid for risk assessment purposes. For each of these taxonomic categories 9, 8 and 6 should be considered with care, and 13, 8 and 3 data respectively were judged as not valid or not assignable for the risk assessment.
It is necessary to distinguish the acute studies (LC50/EC50) from chronic studies (NOEC/EC10). In the tables presented in Appendix 3, the data are ranked based on class (fish, invertebrates, algae), criterion (LC50/EC50, NOEC/EC10), environment (freshwater/ saltwater) and validity (1, 2, 3, 4). In the case of chloroform, only a few valid acute toxicity data and no results from long-term studies in marine species are available. Available data in marine species do not indicate a marked difference in the sensitivity of marine and freshwater species towards chloroform exposure. Therefore data from freshwater organisms are regarded as relevant for a risk assessment for the marine compartment and are discussed together with the data from marine species of the respective trophic level. The three trophic levels are reviewed hereafter. The reference numbers are those listed in the Table of Appendix 3 and given in Appendix6.
7.1 Fish Eight species of fish were tested in acute tests over at least 96 hours including one marine fish species and early life stages. For nearly all studies the description of methods and/or results was incomplete or the original studies were not available. QSAR data were not considered. LC50-values in the range of 18 - 300 mg/l were determined. Analytical monitoring was conducted in the experiments of Anderson et al., (1980) and mentioned by Pearson and McConnell, (1975). However, only an abstract of the study of Anderson et al. was available and the analysis results of Pearson and McConnell, (1975) were not reported.

Chloroform 02/07/97
8
The lowest acute toxicity value in fish is observed for Oncorhynchus mykiss and Lepomis macrochirus with a 96 hour - LC50 of 18 mg/l (Anderson et al., 1980).
Three prolonged studies were carried out in fish and were considered to be not valid for risk assessment: A study in Poecilia reticulata was carried out over 14 days and was considered to be not a suitable long term study in fish because of the short test duration (Könemann, 1981). In 2 other studies in rainbow trout (Birge et al., 1979) and in Pimephales promelas (Black et al., 1982) the survival of eggs and embryo-larval stages was tested. The test method is not validated and the reproducibility and variability of results unknown. Information on control groups is scarce. A factor of > 5000 was found between concentrations with 95 and 56% survival which is an extremely high range for a substance-related toxic effect. A NOEC was not given and cannot be derived from available data due to a lack in reporting and the wide spaced concentrations. The results were not considered for risk assessment and threshold values derived from these studies were disregarded.
No valid NOEC data are available for fish.
7.2 Invertebrates
EC50-values in Daphnia magna after exposure to at least 48 hours were in the range of 24.5 - 353 mg/l. The EC50-values for 2 other species were in the same range. The lowest valid EC50 of 29 mg/l was determined by LeBlanc, (1980) in a static test according to EPA-guidelines without analytical monitoring (48 hours exposure). The general test procedure was described sufficiently. Methodical variations were described for insoluble and volatile substances. Following the worst case approach the study was accepted for risk assessment. Studies which are considered to be of higher validity showed EC50-values which are a factor 2 to 3 above the values reported by LeBlanc, (1980). An acute toxicity study on oyster larvae (Crassostrea virginica) is available (Stewart et al., 1979); An EC50-48h of ca. 1 mg/l has been found. The validity of this study is however questionable as, from analytical measurements most of the test material had disappeared through volatilisation. It has therefore to be used with care. The lowest acute toxicity value for invertebrates is observed for Crassostrea virginica with a 48 hour - EC50 of 1 mg/l (Stewart et al., 1979).
The lowest NOEC value in crustacea was the 11 day-NOEC for mortality (3.4 mg/l) in Ceriodaphnia dubia in the study of Cowgill et al., (1991). However, in this study the 9-day-EC50 for mortality was 235 mg/l and the NOEC´s for reproduction parameters (progeny, number of broods and brood size) were 120 mg/l and far above the reported NOEC for mortality. The study gives no information on the definition of the NOEC for mortality. Mortality values for single tested concentrations or the concentration-effect relationship were not reported. The low NOEC value reported in this study seems to be

Chloroform 02/07/97
9
highly unlikely and may be e.g. the result of an inappropriate statistical method and/or accidental mortality in one of the low concentrations. The NOEC values for reproduction and mortality in Daphnia magna were 120 - 200 mg/l in the same test system. Test method and organism are not standardised and no analytical monitoring has been carried out. Actual test concentrations may have been below the concentrations reported. The NOEC value of 3.4 mg/l was considered to be not valid for risk assessment. A NOEC of 6.3 mg/l was observed in a 21-day reproduction study in Daphnia magna according to OECD-guidelines with analytical monitoring (Kühn et al., 1989) and was considered to be valid for risk assessment.
The lowest NOEC for reproduction was observed with Daphnia magna exposed to chloroform over 21 days and was 6.3 mg/l (Kühn et al., 1989).
7.3 Algae
Studies were carried out in 7 species of algae. The lowest IC50-value after 72 hours exposure was 13.3 mg/l based on biomass in Chlamydomonas reinhardii in freshwater (Brack and Rottler, 1994). The value was accepted for risk assessment. The result is one to two orders of magnitude lower than the results of other reliable studies which may be explained by the higher sensitivity of test method and organism used in Brack and Rottler, (1994), but may be also due to the non standard methodology. The test system employed an elevated level of CO2 which may have affected the sensitivity of the algae. The lowest acute toxicity value in algae was an IC50 of 13.3 mg/l after 72 hours exposure (Brack and Rottler., 1994).
NOEC-values (EC10) from algae tests over at least 72 hours are accepted as prolonged aquatic toxicity data, since several generations are exposed during this time period. NOEC-values for algae species and cyanobacteria are available and were considered. The lowest NOEC was 3.61 mg/l (72 hour growth rate in Chlamydomonas reinhardtii in Brack and Rottler, 1994). The value was considered to be acceptable for risk assessment. The low NOEC in comparison to other algae tests was considered to be primarily due to the high sensitivity of the test organism.
The lowest NOEC value for algae was 3.6 mg/l after 72 hours exposure (Brack and Rottler, 1994).
7.4 PNEC for marine environment
From an evaluation of the available toxicity data for aquatic organisms, it is reasonable to conclude that the sensitivity of both marine and freshwater algae, invertebrates (anthropods) and fish to chloroform is quite similar. Furthermore, the difference of sensitivity between those trophic levels is low (factor of

Chloroform 02/07/97
10
about 2). Among them, the lowest acute toxicity value was the EC50 of 13.3 mg/l for algae (Brack and Rottler, 1994). However, if one takes into account the toxicity data on oyster larvae: EC50-48 h = 1 mg/l (Steward et al., 1979) which is the lowest for acute studies, the derived PNEC is 1 µg/l. The lowest acceptable NOEC value following prolonged exposure was the NOEC of 3.6 mg/l in algae. An assessment factor of 50 for results from prolonged studies was chosen because valid data from 2 trophic levels were available and the most sensitive species (algae) was included. The PNEC derived from prolonged toxicity data is 72.2 µg/l.
A summary of the valid data selected for the derivation of PNEC values at different levels is given in Table 3. This table exemplifies the PNEC values derived from acute, chronic and ecosystem studies. It is generally aknowledged that the latter are closer to real world than the former. Therefore the more reliable value should be in the lower end of the table. As far as the North Sea is concerned, acute effect studies are not relevant because of the absence of local sources.
The final PNEC which is calculated for this risk assessment is 72 µg/l.
7.5 Bioaccumulation Bioaccumulation of chloroform in aquatic species is unlikely in view of its physical,
chemical and biological properties. The following bioconcentration factors (BCF) have been reported for freshwater fish: Cyprinus Carpio 4 - 13 (Anderson et al., 1980) Lepomis macrochirus 1.6 - 2.5 (Barrow et al., 1978) Oncornhyncus mykiss 3.34 - 10.35 (Anderson et al., 1980) The octanol water partition coefficient is small (logKow = 2) (BUA, 1985). Under these conditions the bioaccumulation through the food chain is highly unlikely. 7.6 Persistence As indicated by the Henry’s law constant, chloroform entering aquatic systems would
be transferred to the atmosphere through volatilization. A half life of 3.7 hours can be calculated from this constant using a water current of 1m/sec a wind speed of 3m/sec and 1m depth (Lyman et al., 1982). A field monitoring in the Rhine River gave a half life of 1.2 day (Roeteman et al., 1980).
In the atmosphere, indirect photolysis (reaction with O H radicals) occurs with a half
life of approximately 15 to 23 weeks (Kloepffer, 1990 - Pearson et McConnell, 1975). No effect of chloroform can be expected on stratospheric ozone depletion and global

Chloroform 02/07/97
11
warming as a half life of at least one year is necessary to expect such effects. Chloroform is not listed in the substances concerned by the Montreal Protocol on
substances affecting the ozone layer. Chloroform has a negligible tropospheric ozone creation potential in the atmosphere.
7.7 Conclusion It can be deduced from the above information that chloroform is not a “persistent,
toxic and liable to bioaccumulate substance as mentioned by the Oslo and Paris Conventions for the Prevention of Marine Pollution (OSPARCOM) according to the criteria currently under discussion and especially those defined by UN-ECE, Euro Chlor and CEFIC.

Chloroform 02/07/97
12
Table 3 :Summary of ecotoxicity data selected relevant for the PNEC derivation
with appropriate assessment factors for chloroform.
Available valid data
Assessment factor
Comments
1 short-term EC50 from each trophic level (fish, daphnia, algae)
1000
PNEC: 1 µg/l
lowest toxicity value: IC50 = 13.3 mg/l in “Chlamydomonas reinhardtii” (Brack & Rottler, 1994) LC50 = 1 mg/l in “Crassostrea virginica”(Stewart et al., 1979) LC50 = 18 mg/l in “Oncorhynchus mykiss” and “Lepomis macrochirus” (Anderson et al., 1980)
2 long-term NOEC from species of 2 trophic levels (most sensitive included)
50
PNEC: 72 µg/l
lowest toxicity value NOEC = 3.6 mg/l in “Chlamydomonas reinhardtii” (Brack & Rottler, 1994) NOEC = 6.3 mg/l in “Daphnia magna” (Kühn et al., 1989)
Field studies
case by case
No data

Chloroform 02/07/97
13
8. EXPOSURE ASSESSMENT
Chloroform in the environment is only partly due to industrial production (emissions from production and use). It has been shown that halomethanes are formed by marine biological activity (Su and Goldberg, 1976 - Yung et al., 1975).
It is also well known that the drinking water disinfection contributes to the formation of chloroform and other halomethanes in marked amounts especially in the municipal waste water treatments (Yung et al., 1975 - Edwards et al., 1982 - Rook, 1974, 1975).
Therefore the use of PEC-models based on production volumes will give no reliable data. Measured concentrations should be used preferably for the risk assessment.
Thus the exposure assessment is essentially based on exposure data from analytical
monitoring programs. Chloroform has been measured in a number of water systems. These levels in surface waters (river water and marine waters are detailed in
Appendix 4. References for the available monitoring data can be found in HEDSET Data Sheet for chloroform (updated version 1/96). Additional sources have been also used. All the references are given in Appendix 7.
As it is generally not specified if the location of sampling is close to a source of
emission (production or processing), it is assumed that the lower levels correspond to the background “regional” concentrations and the higher to contaminated areas or “local” concentrations, considered as worst cases.
8.1 Marine water and estuaries In coastal waters and estuaries, observed concentrations are in a range from 0.004 µg/l
up to 11.5 µg/l (worst case). Typical recent monitoring data for chloroform in coastal waters and estuaries which are part of the OSPARCOM region are given hereafter and illustrated on the North Sea map in Appendix 5.
Elbe estuary (D) < 0.01-0.09 µg/l 1993 Weser estuary (D) < 0.02-0.2 µg/l 1993 Rhine estuary (NL) 0.005-0.091 µg/l 1992 Schelde/Maas (NL) 0.06-0.15 µg/l 1993 Tees estuary (UK) < 0.01-11.5 µg/l 1992 Solent estuary < 0.01-7.5 µg/l 1991 Other UK estuaries < 0.025-1.5 µg/l 1995 Seine estuary (F) < 1µg/l (*) 1995 NE Atlantic Ocean 0.008 µg/l 1972 Ostsee coasts (D) 0.06-0.17 µg/l 1983 The symbol < indicates that the value is under the detection limit of the analytical
method.

Chloroform 02/07/97
14
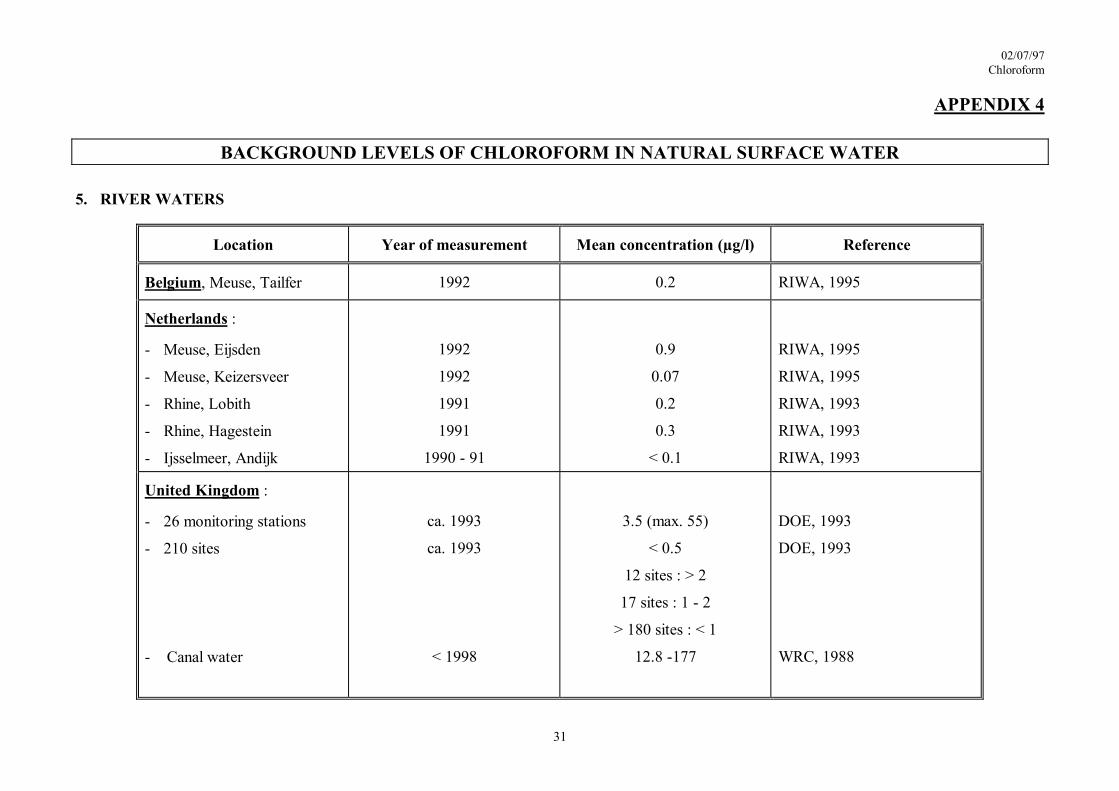
8.2 River waters Background levels of chloroform in typical river in non industrialized area are in
general lower than 0.5 µg/l. In industrialized rivers or in the vicinity of the municipal waste water treatment emissions, local concentrations up to 10 µg/l were measured (worst case).
9. RISK ASSESSMENT CONCLUSIONS
In the risk characterisation of chloroform for the aquatic organisms, the PNEC is compared to the PEC.
A PNEC of 72 µg/l was obtained for aquatic species exposed to chloroform.
In coastal waters and estuaries, chloroform is observed up to 11.5 µg/l (worst case) but a typical water concentration in estuaries is less than 0.2 µg/l. Due to the high volatility of chloroform and its fast evaporation from the water compartment, the concentration of chloroform in the North Sea is lower than the measured concentration in estuaries.
A typical river water concentration below 0.5 µg/l was derived from the measured levels, while in industrial areas or in the vicinity of municipal waste water treatments, local concentrations up to 10 µg/l were measured (worst case).

Chloroform 02/07/97
15
These monitoring values allow to calculate the PEC/PNEC ratios which are summarized in Table 4 hereafter.
Table 4 : Calculation of PEC/PNEC ratios for chloroform
Type of water
PEC level
PEC/PNEC
Coastal water / Estuaries • worst case • typical River waters: • worst case • typical
11.5 µg/l 0.2 µg/l
10 µg/l 0.5 µg/l
0.16 0.0028
0.139 0.007
These calculated ratios which do not take into account any dilution factor within the sea correspond to a safety margin of 6 to 360 between the aquatic effect and the exposure concentration so that the present use of chloroform should not represent a risk to the aquatic environment. In addition, as stated previously there is no sign of accumulation neither in the biosphere nor in the hydrosphere.
It has also to be pointed out that the worst case values of the recently measured
concentrations of chloroform in surface waters are below the limit of 40 µg/l for trihalogenic organo compounds in drinking water as recommended by the German authorities and the European Union Draft Directive Revision (1995) on drinking water quality are compatible with the quality objective defined by the EC Directive 88/347. The conclusion of this risk assessment is supported by a recent IPCS report (IPCS, 1994) which stated: “Levels of chloroform in surface water are generally low and would not be expected to present a hazard for aquatic organisms”.

Chloroform 02/07/97
16
10. REFERENCES 10.1 General References
Barrows M.E., Petrocelli, S.R., Macek, K.J., Carroll, J.J. (1978): Bioconcentration and elimiation of selected water pollutants by bluegill sunfish (Lepomis macrochirus) in dynamics, exposure and hazard assessment of toxic chemicals; R. Hague Ed.; Ann Arbor, Science 379-392, Ann Aarbor Michigan
Anderson D.R. and Lustry F.W. (1980) Acute toxicity and bioaccumulation of chloroform to four species of fresh waterfish. Batelle Pacific Nortwest Laboratory-
NUREG/CR.089 PNL-3046 Richland Washington, USA BUA (Oct. 1985) Report I - Chloroform - German Chemical Society Edwards et al., (Sept 1982), Chemistry and Industry, p 714 IARC (1979) Monograph on the Evaluation of the Carcinogenic Risk of Chemicals to
Humans; Some halogenated hydrocarbons Vol. 20, Lyon, France IPCS (Geneva 1994) Chloroform Health and Safety Guide Nr. 87, World Health
Organization Kloepffer, W., Daniel, B (1990): Reaktions-Konstanten zum abiotischen Abbau von organischen Chemikalien in der Atmosphäre R. 67.233-4 Battelle-Institut, Frankfurt
am Main Lyman et al., (1982) Handbook of chemical property estimation methods. Environmental behavior of Organocompounds. New York McGraw-Hill Bokk Co. 960 Pearson, McConnell (1975). Proc Roy Soc London Serv. B 189, 305-332 Mackay, D., Patterson, S. (1990); Fugacity models; in: Karcher, W. Devillers, J. (Eds); Practical applications of quantitative structure-activity relations in environmental
chemistry and toxicology : 433-460 Pearson, McConnell (1975). Proc Roy Soc London Serv. B 189, 305-332 Pedersen, F., Tyle, H. Niemelä, J.R., Guttman, B., Lander, L., Wederbrand, A. (1994); Environmental Hazard Classification - Data Collection and interpretation guide;
TemaNord1994:589 Roeteman et al (1980) Chemosphere, 231-249 Rook, (1974) Water Tr. Exam, 234-243 Rook, (1975) Vom Wasser, 55-67

Chloroform 02/07/97
17
Su and Goldberg, (1976) in Wisdon and Duce (eds.): Environmental concentrations
and fluxes of some halocarbons, Lexington Books Yung et al., (1975) Geophys. Res. Lett. 2, 397-399 10.2 References for ecotoxicity data: see Appendix 6. Those references are used in Appendix 3. 10.3 References for monitoring data: see Appendix 7. Those references are used in Appendix 4.

18
APPENDIX 1 02/07/97
Chloroform
Environmental quality criteria for assessment of ecotoxicity data
The principal quality criteria for acceptance of data are that the test procedure should be well described (with reference to an official guideline) and that the toxicant concentrations must be measured with an adequate analytical method. Four cases can be distinguished and are summarized in the following table (according to criteria defined in IUCLID system).
Table : Quality criteria for acceptance of ecotoxicity data
Case
Detailed
description of the test
Accordance
with scientific guidelines
Measured
concentration
Conclusion: reliability
level I
+
+
+
[1] : valid without
restriction
II
±
±
±
[2] :
valid with restrictions; to be considered with
care
III
insufficient or -
-
-
[3] :
invalid IV
the information to give an adequate opinion
is not available
[4] :
not assignable The selected validated data LC50, EC50 or NOEC are divided by an assessment factor to determine a PNEC (Predicted No Effect Concentration) for the aquatic environment. This assessment factor takes into account the confidence with which a PNEC can be derived from the available data: interspecies- and interlaboratory variabilities, extrapolation from acute to chronic effects,... Assessment factors will decrease as the available data are more relevant and refer to various trophic levels.

Chloroform 02/07/97
APPENDIX 2
19
Ultimate distribution in the environment according to Mackay level I model (details of calculation)

Chloroform 02/07/97
APPENDIX 3
20
Species
Criterium (LC/EC50
NOEC/LOEC)
Concentration
(mg/l)
Validity
Species
Criterium (LC/EC50
NOEC/LOEC)
Concentration
(mg/l) Validity
CHLOROFORM
FISH LC50/EC50 STUDIES
1. FRESHWATER 2. SALTWATER
Oncorhynchus mykiss LC50 18 2 Limanda limanda LC50 28 1 Lepomis macrochirus
LC50
18
2
Micropterus salmoides
LC50
51
2 Ictalurus punctatus
LC50
75
2
Poecilia reticulata
LC50
102
2 Pimephales promelas
LC50
103
2
Pimephales promelas
LC50
129
2 Pimephales promelas
LC50
171
2
Poecilia reticulata
LC50
300
2 INVERTEBRATES LC50/EC50 STUDIES
1. FRESHWATER 2. SALTWATER
Daphnia magna EC50, immobility 29 2 Crassostrea virginica EC50 mortality 1 2 Daphnia magna EC50, immobility 65.7 2 Daphnia magna EC50, immobility 79 2 NOEC/LOEC STUDIES
1. FRESHWATER 2. SALTWATER
Daphnia magna NOEC, reproduct + mortality)
13 1
Daphnia magna EC50, length NOEC, length
60 15
2
Daphnia magna LC50, mortality NOEC, mortality NOEC, progeny NOEC, brood no
290 120 120 200
2

Chloroform 02/07/97
APPENDIX 3
21
Species
Criterium (LC/EC50
NOEC/LOEC)
Concentration
(mg/l)
Validity
Species
Criterium (LC/EC50
NOEC/LOEC)
Concentration
(mg/l) Validity
NOEC, broodsize 120 Ceriodaphnia dubia LC50, mortality
NOEC, mortality NOEC, progeny NOEC, brood no NOEC, broodsize
235 3.4 200 200 200
2
AQUATIC PLANTS
1. FRESHWATER 2. SALTWATER
Chlamydomonas rein IC50, biomass IC10, biomass
13.3 3.6
1 Skeletonema costatum IC50, biomass IC50, growth rate NOEC, biomass NOEC, growth rate
437 477
216
216
2
Scenedesmus subsp IC50, biomass IC50, growth rate
560 950
2 Skeletonema cost IC50, growth rate
> 32 2
Scenedesmus quad IC50, growth rate LOEC, growth rate
>1100 1100
2 Thalassiosira pseud IC50, growth rate
> 32 2
Microcystis aerugin IC50, growth rate LOEC, growth rate
> 185 185
1,2-DICHLOROETHANE
FISH LC50/EC50 STUDIES
1. FRESHWATER 2. SALTWATER
Pimephales promlelas LC50 116 1 Limanda limanda LC50 115 2 Pimephales promelas LC50 118 1 Lepomis macrochirus LC50 94 2 Micropterus salmoides LC50 66 2

Chloroform 02/07/97
APPENDIX 3
22
Species
Criterium (LC/EC50
NOEC/LOEC)
Concentration
(mg/l)
Validity
Species
Criterium (LC/EC50
NOEC/LOEC)
Concentration
(mg/l) Validity
Poecilia reticulata LC50 106 2 NOEC/LOEC STUDIES
1. FRESHWATER 2. SALTWATER
Pimephales promelas NOEC LOEC
29 59
1
Oncorhynchus kisutch NOEC LOEC
56 150
2
INVERTEBRATES LC50/EC50 STUDIES
1. FRESHWATER 2. SALTWATER
Daphnia magna EC50 LC50
155-183 268-315
1 Artemia salina EC50 94 1
Daphnia magna EC50 150 2 Artemia salina EC50 36 2 Daphnia magna EC50 324 2 Artemia salina EC50 320 2 Eliminius modestus EC50 186 2 NOEC/LOEC STUDIES
1. FRESHWATER 2. SALTWATER
Daphnia magna NOEC LOEC
11 21
1
AQUATIC PLANTS
1. FRESHWATER 2. SALTWATER
Scenedesmus subspicatus EC50 189 2 1,1,2-TRICHLOROETHANE
FISH LC50/EC50 STUDIES
1. FRESHWATER 2. SALTWATER

Chloroform 02/07/97
APPENDIX 3
23
Species
Criterium (LC/EC50
NOEC/LOEC)
Concentration
(mg/l)
Validity
Species
Criterium (LC/EC50
NOEC/LOEC)
Concentration
(mg/l) Validity
Jordanella floridae LC50 45.12 1 Pleuronectes platessa LC50 43 1 Pimephales promelas LC50 81.6 1 Pleuronectes platessa LC50 34-50 1 Poecilia reticulata LC50 70-85 1 Pleuronectes platessa LC50 60 1 Peocilia reticulata LC50 40-75 1 Gobius minutus LC50 43 1 Lepomis macrochirus LC50 40 2 Pleuronectes platessa LC50 36-43 1 Peocilia reticulata LC50 94.45 2 Pleuronectes platessa LC50 55 2 Gobius minutus LC50 43 1 Pleuronectes platessa LC50 27 2 Pleuronectes platessa LC50 6 2 Pleuronectes platessa LC50 125 2 Pleuronectes platessa LC50 55 2 NOEC/LOEC STUDIES
1. FRESHWATER 2. SALTWATER
Jordanella floridae NOEC 18.16 1 Pleuronectes platessa NOEC 3 1 Jordanella floridae NOEC 29 1 Pimephales promelas NOEC 15 1 INVERTEBRATES LC50/EC50 STUDIES
1. FRESHWATER 2. SALTWATER
Daphnia magna EC50 LC50
78-81 174-186
1 Artemia salina EC50 72 1
Daphnia magna EC50 43 1 Artemia salina EC50 52 1 Daphnia magna EC50 70-75 1 Artemia salina EC50 43 1 Daphnia magna EC50 43 1 Crangon crangon EC50 42 1 Dreissena polymorpha (mollusc) EC50 320 1 Chaetogammarus
marinus EC50 82 1
Dreissena polymorpha (mollusc) EC50 190 1 Chaetogammarus marinus
EC50 62 1
Dreissena polymorpha (mollusc) EC50 140 1 Chaetogammarus EC50 50 1

Chloroform 02/07/97
APPENDIX 3
24
Species
Criterium (LC/EC50
NOEC/LOEC)
Concentration
(mg/l)
Validity
Species
Criterium (LC/EC50
NOEC/LOEC)
Concentration
(mg/l) Validity
marinus Lymnaea stagnalis (mollusc) EC50 140 2 Palaemonetes varians EC50 43 1 Daphnia magna EC50 18 2 Temora longicornus EC50 43 1 Daphnia magna EC50 19 2 Mytilus edulis
(mollusc) EC50 110 1
Daphnia magana EC50 23 2 Mytilus edulis (mollusc)
EC50 80 1
Lymnaea stagnalis (mollusc) EC50 170 2 Mytilus edulis (mollusc)
EC50 65 1
Ophryotricha diadema (aunelide)
EC50 190 1
Ophryotricha diadema (aunelide)
EC50 200 2
Crepidula fornicata EC50 170 2 Crangon crangon EC50 43 2 Palaemonetes varians EC50 43 2 Artemia salina EC50 62 2 Artemia salina EC50 40 2 Artemia salina EC50 36 2 Chaetogammarus
marinus EC50 48 2
Chaetogammarus marinus
EC50 48 2
Chaetogammarus marinus
EC50 41 2 NOEC/LOEC STUDIES
1. FRESHWATER 2. SALTWATER
Daphnia magna NOEC NOEC
26 13
1 1
Artemia salina NOEC 10 1
Daphnia magna NOEC NOEC
18 32
1 1
Ophryotricha labronica NOEC 150 1

Chloroform 02/07/97
APPENDIX 3
25
Species
Criterium (LC/EC50
NOEC/LOEC)
Concentration
(mg/l)
Validity
Species
Criterium (LC/EC50
NOEC/LOEC)
Concentration
(mg/l) Validity
Daphnia magna NOEC 18 1 Ophryotricha labronica NOEC 50 1 Lymnaea stagnalis (mollusc) NOEC 10 1 Ophryotricha labronica LOEC 75 1 AQUATIC PLANTS
1. FRESHWATER 2. SALTWATER
Chlorella pyrenoidosa EC50 170 1 Chlamydomonas sp EC50 260 1 Scenedesmus subspicatus EC50 200 1 Chlorella sp EC50 200 1 1 EC50
LOEC 57
26.3 1 Dunaliella sp EC50 200 1
Phaeodactylum tricornutum
EC50 60 1
TRICHLOROETHYLENE
FISH LC50/EC50 STUDIES
1. FRESHWATER 2. SALTWATER
Jordanella floridae (American flagfish)
LC50 28.3 1 Cyprinodon variegatus LC50 52 2
Pimephales promelas LC50 44 2 Limanda limanda (Dab)
LC50 16 2
Pimephales promelas LC50 40.7 2 Jordanella floridae (American flagfish)
LC50 63.1 2 NOEC/LOEC STUDIES
1. FRESHWATER 2. SALTWATER
Jordanella floridae (American flagfish)
MATC 11 1
INVERTEBRATES LC50/EC50 STUDIES

Chloroform 02/07/97
APPENDIX 3
26
Species
Criterium (LC/EC50
NOEC/LOEC)
Concentration
(mg/l)
Validity
Species
Criterium (LC/EC50
NOEC/LOEC)
Concentration
(mg/l) Validity
1. FRESHWATER 2. SALTWATER
Daphnia magna EC50 20.8 1 Elminius modestus (mollusc)
LC50 20 2
Mysidopsis bahia EC50 14 2 AQUATIC PLANTS
1. FRESHWATER 2. SALTWATER
Chlamydomonas reinhardtii EC50 NOEC
36.5 12.3
1 Skeletonema costatum EC50 95 2
TETRACHLOROETHYLENE
FISH LC50/EC50 STUDIES
1. FRESHWATER 2. SALTWATER
Jordanella floridae LC50 8.4 1 Limanda limanda LC50 5 2 Pimephales promelas LC50 18.4 1 Cyprinodon variegatus LC50 52 2 Pimephales promelas LC50 21.4 1 Pimephales promelas LC50 23.8 1 Salmo gairdneri LC50 5 1 Jordanella floridae LC50 24 2 Lepomis macrochirus LC50 13 2 Leuciscus idus LC50 130 2 Poecilia retuculata LC50 17.8 2

02/07/97 Chloroform
27
APPENDIX 4
BACKGROUND LEVELS OF CHLOROFORM IN NATURAL SURFACE WATER
1. OPEN SEA
Location Year of measurement Mean concentration (µg/l) Reference
Atlantic ocean: North-Eastern Atlantic Between Madeira-Gibraltar (31°N-14°W) West African coast (25°N-18°W)
1972
1985
1985
0.008
0.0016
0.0016
Murray et al, 1973 Ernst, 1983 Class et al, 1986 Class et al, 1986

02/07/97 Chloroform
28
APPENDIX 4
BACKGROUND LEVELS OF CHLOROFORM IN NATURAL SURFACE WATER
2. COASTAL WATERS AND ESTUARIES
Location Year of measurement Mean concentration (µg/l) Reference
Netherlands/Belgium border, Schelde estuary (Doel)
1993 0.15 MVW, 1994
Netherlands: - Rhine estuary - Schelde/Maas
1992 1993
0.005-0.091 <0.06-0.15
Krijsell et al, 1993 MVW, 1994
United Kingdom: - River estuaries - Estuarine water - Solent estuary - Mersey estuary - Humber and Poole estuaries - Tees estuary - Tyne, Weer and Southampton estuaries - Liverpool estuary - Other estuaries (Tweed, Bristol channel, Falmouth,…)
1993-95 < 1988 < 1991 1987-90
1992 1992 1992
1992 1992
< 0.025-1.5 < 0.02-2.4 0.01-7.5 2.7-70
<0.010-0.0364 <0.010-11.5 <0.10-0.242
0.0283-0.0889
<0.010
MAFF, 1995; NRA, 1996 WRC, 1988 Bianchi et al, 1991 Rogers et al, 1992 Dawes et al, 1994 Dawes et al, 1994 Dawes et al, 1994 Dawes et al, 1994 Dawes et al, 1994

02/07/97 Chloroform
29
APPENDIX 4
BACKGROUND LEVELS OF CHLOROFORM IN NATURAL SURFACE WATER
3. COASTAL WATERS AND ESTUARIES
Location Year of measurement Mean concentration (µg/l) Reference
France, Seine estuary
1995 < 1 Agence de Bassin Seine Normandie, 1995

02/07/97 Chloroform
30
APPENDIX 4
BACKGROUND LEVELS OF CHLOROFORM IN NATURAL SURFACE WATER
4. COASTAL WATERS AND ESTUARIES
Location Year of measurement Mean concentration (µg/l) Reference
Germany: - Ostsee coasts -Nordsee coasts - Unterelbe, Scharhoern - Elbe mouth, St Margarethen - Weser mouth, Bremerhaven
1983 1983
1981-82 1993 1993
0.06-0.17 0.56-3.8
0.04 <0.01-0.09 <0.02-0.20
Hellmann, 1984 Hellmann, 1984 Ballschmiter et al, 1988 Gewässergütebericht Elbe, 1994 Arbeitsgemeinschaft zur Reinhaltung der Weser, 1994
Sweden, Stenungsund 1988 0.0054-0.0148 Abrahamsson et al, 1989
02/07/97 Chloroform
31
APPENDIX 4
BACKGROUND LEVELS OF CHLOROFORM IN NATURAL SURFACE WATER
5. RIVER WATERS
Location Year of measurement Mean concentration (µg/l) Reference
Belgium, Meuse, Tailfer 1992 0.2 RIWA, 1995
Netherlands :
- Meuse, Eijsden
- Meuse, Keizersveer
- Rhine, Lobith
- Rhine, Hagestein
- Ijsselmeer, Andijk
1992
1992
1991
1991
1990 - 91
0.9
0.07
0.2
0.3
< 0.1
RIWA, 1995
RIWA, 1995
RIWA, 1993
RIWA, 1993
RIWA, 1993
United Kingdom :
- 26 monitoring stations
- 210 sites
- Canal water
ca. 1993
ca. 1993
< 1998
3.5 (max. 55)
< 0.5
12 sites : > 2
17 sites : 1 - 2
> 180 sites : < 1
12.8 -177
DOE, 1993
DOE, 1993
WRC, 1988

02/07/97 Chloroform
32
APPENDIX 4
BACKGROUND LEVELS OF CHLOROFORM IN NATURAL SURFACE WATER
6. RIVER WATERS
Location Year of measurement Mean concentration (µg/l) Reference
Switzerland :
- Rhine, Basel
- Typical river
- Typical lake
ca. 1982
1981 - 83
ca. 1984
1.19
0.062 (max. 1)
< 0.01
Ballschmiter et al, 1988
Fahrni, 1985
Fahrni, 1985
France :
- Seine River (Poses,Honfleur)
1995
< 1
Agence de Bassin
Seine-Normandie, 1995

02/07/97 Chloroform
33
APPENDIX 4
BACKGROUND LEVELS OF CHLOROFORM IN NATURAL SURFACE WATER
7. RIVER WATERS
Location Year of measurement Mean concentration (ng/m3)
Reference
Germany, Rhine :
- Constanz-Emmerich profile
- Karlsruhe
- Worms
- Koblenz
- Düsseldorf
- Bimmen
- Hessen
- Bad-Honnef
- Köln
- Wiesbaden
1983
1991
1991
1991
1991
1991
1985 - 89
1986
1994
1994
2
0.1
1.17
0.40
0.23
0.15
2.6 (max. 9)
max. 0.4
max. 0.39
max. 0.40
Ballschmiter et al, 1988
Fleig et al, 1991
Fleig et al, 1991
Fleig et al, 1991
Fleig et al, 1991
Fleig et al, 1991
Ott, 1990
Gewässergütebericht, 1986
ARW, 1994
ARW, 1994

02/07/97 Chloroform
34
APPENDIX 4
BACKGROUND LEVELS OF CHLOROFORM IN NATURAL SURFACE WATER
8. RIVER WATERS
Location Year of measurement Mean concentration (ng/m3)
Reference
Germany, Rhine affluents :
- Main, Hessen
- Sieg
- Wupper
- Ruhr
- Ruhr (Duisburg bis Wildshaven)
- Emscher
- Main, Kahl am Main
1985 - 89
1986
1986
1986
1984
1986
1989
3.8 (max. 12)
< 0.1
max. 0.4
max. 0.1
0.15 - 15
max. 0.1
3.17
Ott, 1990
Gewässergütebericht, 1986
Gewässergütebericht, 1986
Gewässergütebericht, 1986
Ballschmiter et al, 1988
Gewässergütebericht, 1986
Bayerisches Landesamt für Wasserwirtschaft, 1991

02/07/97 Chloroform
35
APPENDIX 4
BACKGROUND LEVELS OF CHLOROFORM IN NATURAL SURFACE WATER
9. RIVER WATERS
Location Year of measurement Mean concentration (µg/l) Reference
Germany, Elbe :
- Elbe
- Schnackenburg
- Geesthacht
- Wedel
- Scharhoern
- Hamburg Hafen
1988
1990
1981
1981
1981
1983 - 85
0.94 (max. 2.7)
0.595
0.594
0.450
0.168
1.54
Malle, 1990
ARGE Elbe, 1991
Wassergütestelle Elbe, 1980 - 82
Wassergütestelle Elbe, 1980 - 82
Wassergütestelle Elbe, 1980 - 82
Freie und Hansestadt Hamburg, 1988
Germany, Donau :
- Böfinger Halde
- Jochenstein
1989
1989
< 1.017
0.908
Bayerisches Landesamt für Wasserwirtschaft, 1991
Bayerisches Landesamt für Wasserwirtschaft, 1991

02/07/97 Chloroform
36
APPENDIX 4
BACKGROUND LEVELS OF CHLOROFORM IN NATURAL SURFACE WATER
10. RIVER WATERS
Location Year of measurement Mean concentration (µg/l) Reference
Germany :
- Unterweser
- Inn, Kirschdorf am Inn
- Salzach, Laufen
- Regnitz, Hausen
- Sächsische Saale, Joditz
1985 - 87
1989
1989
1989
1989
0.56 (max. 5)
< 0.16
< 1.592
< 0.177
< 0.131
Bohlen et al, 1989
Bayerisches Landesamt für Wasserwirtschaft, 1991
Bayerisches Landesamt für Wasserwirtschaft, 1991
Bayerisches Landesamt für Wasserwirtschaft, 1991
Bayerisches Landesamt für Wasserwirtschaft, 1991

02/07/97 Chloroform
37
APPENDIX 4
BACKGROUND LEVELS OF CHLOROFORM IN NATURAL SURFACE WATER
11. RIVER WATERS
Location Year of measurement Mean concentration (µg/l) Reference
- Mosel, border Luxemburg/Germany
- Weser
- Ems
- Bodensee
- Bodensee, Lindau
- Bodensee, Überlingen
1984
1991
1991
1984 - 90
1983
1983
0.5 - 1.1
0.04
0.06
0.01 - 0.029
0.1
< 0.05
Gewässergütebericht, 1986
Niedersächsisches Landesamt für Wasser und Abfall, 1992
Niedersächsisches Landesamt für Wasser und Abfall, 1992
Landesanstalt für Umweltschutz Baden-Württemberg, 1992
Ballschmiter et al, 1988
Ballschmiter et al, 1988

Chloroform 02/07/97
APPENDIX 5
38
NORTH SEA MONITORING DATA ON CHLOROFORM
Seine
Somme
Schelde
Rhine
IjsselEms
Weser Elbe
Tyne
Tees
Humber
Mersey
Thames Meuse
NORTHSEA
BALTICSEA
CHANNEL
OSTSEE
Forth
Tay
MorayDornoch
Solway
The Wash
Solent
Severn
ARCTICSEA
NE Atlantic0.008 µg/l
(1972)0.06-0.17 µg/l
(1983)
<0.02-0.2 µg/l(1993)
< 0.01-0.09 µg/l(1993)0.005-0.091 µg/l
(1992)
0.06-0.15 µg/l(1993)
< 1 µg/l(1995)
0.01-7.5 µg/l(1991)
< 0.025-1.5 µg/l(1995)
< 0.01-11.5 µg/l(1992)
Figure 1: North Sea monitoring data on chloroform

02/07/97 CLM3
39
APPENDIX 6
REFERENCES FOR ECOTOXICITY DATA
Abernethy, A.M., Bobra, W.Y., Shiu, P.G., Wells and Mackay.(1986) Acute lethal toxicity of hydrocarbons and chlorinated hydrocarbons to two planktonic crustaceans: the key role of organism-partitioning. Aquatic Toxicity, 8, 163-174, Anderson, D.R., Lustry E.B. (1980) Acute Toxicity and bioaccumulation of chloroform to four species of fresh water fish. Batelle Pacific Nortwest Laboratory-Report, PNL-3046, Order-No. NUREG/CR-0893, 46 pp. Richland Washington, USA Bentley, R.E., (1975), U.S. EPA contract no. WA-6-99-1414-B Black, J.A., Birge, W.J., McDonnell, W.E., Westerman, A.G., Ramey, B.A., Bruser, D.M. (1982) The aquatic toxicity of organic compounds to embryo-larval stages of fish and amphibians; Res; Rep. Lexington Ky, Univ. Kentucky. Water Resources Res. Instit. 133, 61pp - NTIS PB 82-224601 Birge, W. J., Black, J.A., Bruser, D.M.(1979), Toxicity of organic chemicals to embryo-larval stages of fish, Lexington KY, Univ. Kentucky, Thomas Hunt Morgan School of Biol. Sciences. U.S. Department of Commerce, NTIS PB 80-101637 Blum, D.J.W., Speece, R.E. (1991) Quantitative structure activity relationships for chemical toxicity to environmental bacteria. Ecotoxicol. Environ. Saf. 22, 198-224 Brack, W., Rottler, H. (1994) Toxicity testing of highly volatile chemicals with green algae ESPR-Environ. Sci. & Pollut. Res. 1, 223-228 Bringmann, G., Kühn, R. (1977) Limiting values for the damaging action of water pollutants to bacteria (Pseudomonas putida) and green algae (Scenedesmus quadricauda) in the cell multiplication inhibition test. Z. Wasser Abwasser Forsch. 10, 87-98 Bringmann, G., Kühn, R. (1978) Limiting values for the noxious effects of water pollutant material to blue algae (Microcystis aerugimosa) and green alage (Scenedesmus quadricauda) in cell propagation tests. Vom Wasser 50, 45-60 Bringmann, G. Kühn, R. (1980) Comparaison of the toxicity thresholds of water pollutants to bacteria, algae and protozoa in the cell multiplication, inhibition test. Water Res. 14, 231-241 Canton, J.H., (1984) Unpublished results in Basis document chloroform, 1986 Cherkin, A. Catchpool, J.F. (1964) Temperature Dependence of anesthesia of goldfish. Science, Vol 144, 1460 pp. Cowgill, U.M. Milazzo, D.P., Landenberger, B.D. ( 1989) Toxicity for nine benchmark chemicals to Skeletomena costatum, a marine diatom. Environ. Toxicology and Chemstry, Vol. 8, pp. 451-455

02/07/97 CLM3
40
APPENDIX 6
Cowgill, U.M., Milazzo, D.P. (1991) The sensitivity of Ceriodaphnia dubia and Daphnia magna to seven chemicals utilizing the three-brood test. Arch. Environ. Contam. Toxicol., 20, 211-17 Erickson, S.J., Freeman, A.E. (1977) Toxicity screening of fifteen chlorinated and brominated compounds using species of marine phytoplankton. Water chlorination; Environmental impact and health effects, Vol. 2, pp. 307-310 Foster, G.D., Tullis, R.E. (1985) Quantitative structure activity relationships with osmotically stressed Artimia salina nauplii. Environ. Pollut. Series A., 38,273-81 Gersich, F.M., Blanchard, F.A., Applegath, S.L., Park, C.N., (1986) The precision of daphnid (Daphnia magna straus 1820) static acute toxicity tests. Arch. Environ. Contam. Toxicol. 15, 741-749 Hermens, J. Canton H. Jansen, P. De Jong, R. (1984) Quantitative structure activity , relationships and toxicity studies of mixtures of chemicals with anaesthetic potency: acute lethal and sublethal toxicity to Daphnia magna. Aquat. Toxicol. 5, 143-154 Hermens, J. Broerkhuyzen , E. Canton, H; Wegeman, R. (1985) Quantitative structure activity, relationships and mixture toxicity studies of alcohols and chlorohydrocarbons; Effects on growth of Daphnia magna. Aquat. Toxicol.6, 209-217 Hutchinson, T.C. et al., (1980) The corr. of the box. To algae of (halogenated) hydrocarbons with their phys.-chem. Prop. In:Hydroc. and Halog. In the aquat. Environ. Afgan & mackay (eds), Plenum Press, N.Y., 577-586 - RIVM, 1993, Report No. 679101 008 Juhnke, L. Lüdemann, D. (1978) Ergebnisse der Untersuchung von 200 chemischen Verbindungen auf akute Fishtoxizität mit dem Goldorfentest. Zeitung für Wasser- und Abwasser Forschung 11, Jahrgang, 161-164 Könemann, G. (1981) Quantitative structure activity relationships in fish toxicity studies. Toxicol. 19, pp. 209-221 Knie, J. Kälke, A. Juhnke, I. Schiller, W. (1983) Ergebnisse der Unterschung von chemischen Stoffen mit vier Biotests. Dtsch. Gewässerk. Mitteil., 27, pp. 77-79 Kühn, R. Pattard, M. Pernak, K.D., Winter A. (1989) Results of the harmful effects of water pollutants to Daphnia magna in the 21 days reproduction. Water Res. Vol. 23, 4, pp. 501-510 Kühn, R. Pattard, M. (1990) Results of the harmful effects of water pollutants to green algae (Scenedesmus subspicatus) in the cell multiplication inhibition test. Water. Res. Vol. 24, No 1, pp. 31-38 LeBlanc, G. (1980), Acute toxicity of priority pollutants to water flea (Daphnia magna); Bull. Environ. Contam. Toxicol. 24, 684-691

02/07/97 CLM3
41
APPENDIX6
Mattice, J.S., Tsai, S.C., Burch, M.B., Beauchamps, J.J. ( 1981) Toxicity of Trihalomethanes to Common Carp. Embryos. Trans. Am. Fish. Soc. 110, 261-269 Mayes, M.A., Alexander, H.C., Dill, D.C., (1983) A study to assess the influence on the response of fathead minnows in static acute toxicity tests. Bull. Environ. Contam. Toxicol. 31, 139-147 MITI (1992) Biodegradation and bioaccumulation data of existing chemicals based on thje Chemical Substances Control Law, CITI, (ed.) Jap. Chem. Ind. Ecol. - Toxicol. And Inf. Center 1,27-28 Pearson, C.R. (1975) Chlorinated C1 and C2 hydrocarbons in the marine environment. Proc. Roy. Soc. London. Series B. 189,305-332 Robinson, A.B., Manly, K.F., Anthony, M.P., Catchpool, J.F., Pauling, L. (1965) Anesthesia of artemia larvae: Method for quantitative study; Science 149, 1255-58 Stewart et al. (1979). Marine Pollution Bull.,10, 166-169 Schubert (1979) Toxizität von Organohalogenverbindungen gegenüber Bakterien und Abbaubarkeit Forschungsbericht (03 7123), 211-218 US. EPA (1978) Contract No. 68-01-4646 US. EPA (1980) 440/5-80-033, NTIS, Springfield

02/07/97 CLM3
42
APPENDIX 7
REFERENCES FOR MONITORING DATA
Abrahamsson, K. Drijssen, D., Jogebrant, G., Krijsell, M. (1989) Halocarbon concentration in Askeröfjorden related to the water exchange and inputs from the petrochemicals site at Stenungssund; Vatten 45, 3-8 Agence de Bassin Seine-Normandie (1995) Arbeitsgemeinschaft zur Rheinhaltung der Weser - Gütebericht 1993 - Published 1994 Arge Elbe (1991); Arbeitsgemeinschaft für Rheinhaltung der Elbe: Wasser gütedaten der Elbe von Schackenburg bis zur Zee - Zahlen tafel 1990 ARW (1994) - Annual Report No 51 Ballschmiter, K., Haltrich, W. Kühn, W. Niemitz, W. (1988); HVO-Studie - Halogenorganischen Verbindungen in Wässern. Fachgruppe Wässerchemie in der GDCh. Druck; Integra-Services GMbH, Berlin Bayerisches Landesamt für Wasserwirtschaft (1991) ; Unveröffentliche Unterlagen, persönliche Mitteilung, E. Bach vom 8.7.1991 Bianchi, A.P., Varney, M.S., Philips, J. (1991); Analysis of volatile organic compounds in estuarine sediments using dynamic headspace and gas chromatography-mass spectrometry; Chromatogr., 542: 413-450 Bohlen, H; Hicke, K; Ströbel, A.O., Zierott, M., Thiemann, W. (1989); Die Belastung der Unterweser im Immissionmessungen halogenierter Verbindungen in Hamburg; VDI-Berichte, 745, 209-234 Class, T. Ballschmiter, K. ( 1986); Chemistry of organic traces in air, VI : distribution of chlorinated C1- and C4- hydrocarbons in air over the Northern and Southern Atlantic Ocean; Chemosphere, 15, 413-427 Dawes, V.J., Waldock, M.J. (1994) Measurements of volatile organic compounds at UK national monitoring plan stations, Marine Pollution Bulletin, 28, 291-398 DOE (1993): Personal communication in environmental hazard assessment: TSD/22-1994 Ernst, W. (1983); Organische Spurenstoffe im Meer; Chem. Techn. Lab. 31, 880-888 Fahrni, H.P. ( 1985); Leichtflüchtige chlorierte Kohlenwasserstoffe in Schweizer Gewässern; Schriftenreihe Umweltschutz Nr 39 des Schweizer Bundesamtes für Umweltschutz, Bern
02/07/97 CLM3
43
APPENDIX 7
Fleig, M., Brauch, H.J., (1991); Vorkomen wichtiger organischer Mikroveruntreinigungen in Rhein unter Berücksischtung des Zusammenhangs von Einzelstoffanalytik und Summenparametern sowie der Trinkwasserrelevanz, Forschungsvorhaben, 6. Nicht publizierter Zwischenbericht an die IKSR, DVGW-Forschungstelle am Engler-Bute-Institut der Universität, (1. Halbjahr 1991) Freie und Hansestadt Hamburg (Umweltbehörde): Bericht über die Belastung von Gewässern und Boden in Hamburg mit chlorierten Kohlenwasserstoffen (CKW), Hamburger Umweltberichte 23/88 Gewässergütenberciht (1986); Herausgeber; Landesamt für Wasser und Abfall Nordheim-Westfalen; Düsseldorf, 1987 Gewässergütebericht Elbe (1994) mit Zahlentafeln Ed. Internationale zum Schutz der Elbe, Magdeburg Nov 1994, Author : Dr. H. Reincke Hellmann, H. (1984); Leichtflüchtige Chlorkohlenwasserstoffe in den Gewässern der Bundesrepublik Deutschland: Aufreten und Bilanz; Haustechnik-Bauphysik-Umwelttechnik- Gesundsheits-Ingenieur, 105,269 Krysell, M., Nightingale, P.D. (1993) Low molecular weight halocarbons in the Humber and Rhine estauries determined using a new purge and trap gas chromatographic method. Continental Shell Research Landesanstalt für Umweltschutz Baden-Württenburg: Unveröffenlichte Daten, persönliche Mitteilung. U; Wurster vom 2.1.1992. In TSD/22 (1994). Environmental assessment Chloroform; DOE, UK Malle, K.G. (1990); Vergleich von Elbe und Rhein. Gegenüberstellung der Gütendaten; UWSF. Umweltchem. Oekotox., 2, 92-96 MAFF-Ministry of Agriculture; Fisheries and Food. Aquatic Environment Monitoring Report NO 44, 11993 Data, Published in 1995 Murray, A.J., Riley, J.P. (1973); Occurrence of some chlorinated aliphatic hydrocarbons in the environment; Nature 242, 37-28 MVW - Ministerie van Verkeer en Waterstaat (1994); Meetwaarden in Schelde, Doel 1993 Niedersächsisches Landesamt für Wasser und Abfall; Unveröffentliche Daten, persönliche Mitteiling D; Steffen vom 31.1.1992. In TSD/22 (1994) Environmental assessment Chloroform; DOE, UK NRA- National Rivers Authority. River Tees Environmental Quality Standard Monitoring. 1995 Data. Published in 1996

02/07/97 CLM3
44
APPENDIX 7
Ott, W. (1990); Orientierende Messungen auf gefährliche organische Stoffe in hessischen Oberflächengewässern; Untersuchungszeittraum 1985 bis 1989. In Umwelt: Politik-Technik-Recht; Verlag E. Schmidt, Berlin, 273-281 RIWA (1993); Samenwerkenkende Rijn- en Mass- waterleidingbedrijven. Samenstelling van het Rijnwater in 1990-91, Delft RIWA (1995); Association des Services d’Eau du Rhin et de la Meuse. Tome B: Meuse 1993, Amsterdam, 1995 Rogers, H.R., Crathorme, B. Watts; C.D. (1992); Sources and fat organic contaminants in the Mersey estuary: volatile, organohalogen compounds. Marine Pollution Bulletin 24, 82-91 Wassergütenstelle Elbe (1980-82); Chlorierte Kohlenwasserstoffe. Daten der Elbe, von Schnackenburg bis zur Zee. Hrg. Arbeitsgemeinschaft für die Rheinhaltung der Elbe, Hamburg WRC (1988); Personal communication. In TSD/22 (1994). Environmental assessment: Chloroform, Doe, UK


