Page 1
http://www.bio-protocol.org/e1464 Vol 5, Iss 9, May 05, 2015
Chlorophyll Fluorescence Measurements in Arabidopsis Plants Using a Pulse-amplitude-modulated (PAM) Fluorometer
Reiko Motohashi1* and Fumiyoshi Myouga2
1Agriculture Department, Shizuoka University, Shizuoka, Japan; 2RIKEN Center for Sustainable
Resource Science, Yokohama, Japan *For correspondence: [email protected]
[Abstract] In this protocol, to analyze PSII activity in photosynthesis, we measure the Fv/Fm
(Fv=Fm ± Fo) value (Fo and Fm are the minimum and maximum values of chlorophyll
fluorescence of dark-adapted leaves, respectively). Fv/Fm is a reliable marker of photo- inhibition
(Krause et al., 1988). Chlorophyll fluorescence in leaves was measured at room temperature
using a photosynthesis yield analyzer (MINI- PAM, Walz, Effeltrich, Germany) and a
pulse-amplitude-modulated (PAM) fluorometer (TEACHING-PAM, Walz, Effeltrich, Germany).
Materials and Reagents
1. Arabidopsis plants Note: We plated Nossen ecotype seeds that had been surface-sterilized on germination
medium (GM) agar plates (Motohashi et al., 2003) containing 1% sucrose, with the
appropriate selection agent (antibiotic or herbicide) per specific genotype. Plants were
kept at 4 °C for 3 days to improve germination rates and then grown in lighted growth
chambers (CF-405, TOMY-Seiko, Tokyo, Japan) with approximately 75 μmol photon/m2/s
at 22 °C under a 16 h-light /8-h dark cycle (long-day conditions) for 3 weeks.
Equipment
1. Photosynthesis yield analyzer (Walz, MINI- PAM) (the equipment used in this protocol)
(Figure 1).
Compact design and easy operation are the most outstanding features of the MINI-PAM.
This device is in particular well-suited for determination of quantum yield and
photosynthetic electron transport rate (ETR). A flexible 5.5 mm glass fiberoptic was
attached in the system and it can provide considerable high actinic intensities of white light.
An optional 2 mm plastic fiberoptic (MINI-PAM/F1) is also used by excellent signal
quality and can be attached to the cover of an optional gas-exchange system for
measuring both CO2 and H2O exchange as well as fluorescence. For an exact measuring
Copyright © 2015 The Authors; exclusive licensee Bio-protocol LLC. 1
Page 2
http://www.bio-protocol.org/e1464 Vol 5, Iss 9, May 05, 2015 quantum flux density and temperature at precisely the fluorescence measuring spot, a
useful leaf-clip holder is available as an accessory (Arabidopsis Leaf-Clip Holder, model:
2060-B). This leaf clip holder is especially developed for small leaves like an Arabidopsis
leaf. With the help of the leaf clip holder, the photosynthetic active radiation (PAR) can be
measured and an apparent electron transport rate (ETR) is calculated.
A simple explanation of the equipment used can be found at the following URL
(http://www.walz.com/downloads/manuals/mini-pam-II/MINI-PAM-II_Broschure.pdf). It
should be noted that the current equipment being sold is the MINI-PAM II.
Figure 1. Photosynthesis yield analyzer
2. Pulse-amplitude-modulated (PAM) fluorometer (TEACHING-PAM) (Walz) (alternative
equipment which can be used to measure chlorophyll fluorescence)
Note: It is noted here that the MINI- PAM and TEACHING-PAM were developed for
beginners; advanced researchers may utilize the larger PAM-2000 fluorometer
(essentially the same instrument) to yield additional and more detailed results.
Procedure
Protocol for using the MINI-PAM as referenced from the official instruction manual
(TEACHING-PAM has a similar protocol and as such is not included here). Basically the most
relevant fluorescence parameters of MINI-PAM are automatically obtained by a single key
operation within a second and up to 4,000 data sets are stored for future analysis:
(For reference, information regarding the MINI-PAM-II can be downloaded from the following
URL: http://www.walz.com/downloads/manuals/mini-pam-II/MINI-PAM-II_Broschure.pdf.)
1. Plants grown normally for 3 weeks are dark-adapted for 20 min before chlorophyll
fluorescence measurements. *In our case, dark-adapted means the plants are kept either
Copyright © 2015 The Authors; exclusive licensee Bio-protocol LLC. 2
Page 3
http://www.bio-protocol.org/e1464 Vol 5, Iss 9, May 05, 2015 in a dark drawer (for plated plants) or covered with a large box (for potted plants), in both
cases in rooms with dark curtains and no artificial light sources.
2. Setup the MINI-PAM components. Additional peripheral components were connected to
the four sockets at the side of the MINI-PAM Main Control Unit. PIN-assignments of “LEAF
CLIP”, “RS 232”, “OUTPUT” and “CHARGE” indicate a Leaf Clip holder 2030-B, Computer
control, Chart recorder and Battery Charger, respectively. The MINI-PAM was conceived
as a typical stand-alone instrument for field experiments. Thus the actual measurement of
the most relevant YIELD-parameter (quantum yield of photochemical energy conversion)
just connected the fiberoprtics and leaf clip holder without conjunction with a PC and the
WinControl software. So this protocol introduces the basic operation of the MINI-PAM
without using computer control.
3. Activate the MINI-PAM by pressing the “ON” button. Under standard conditions, the
measuring light is on automatically.
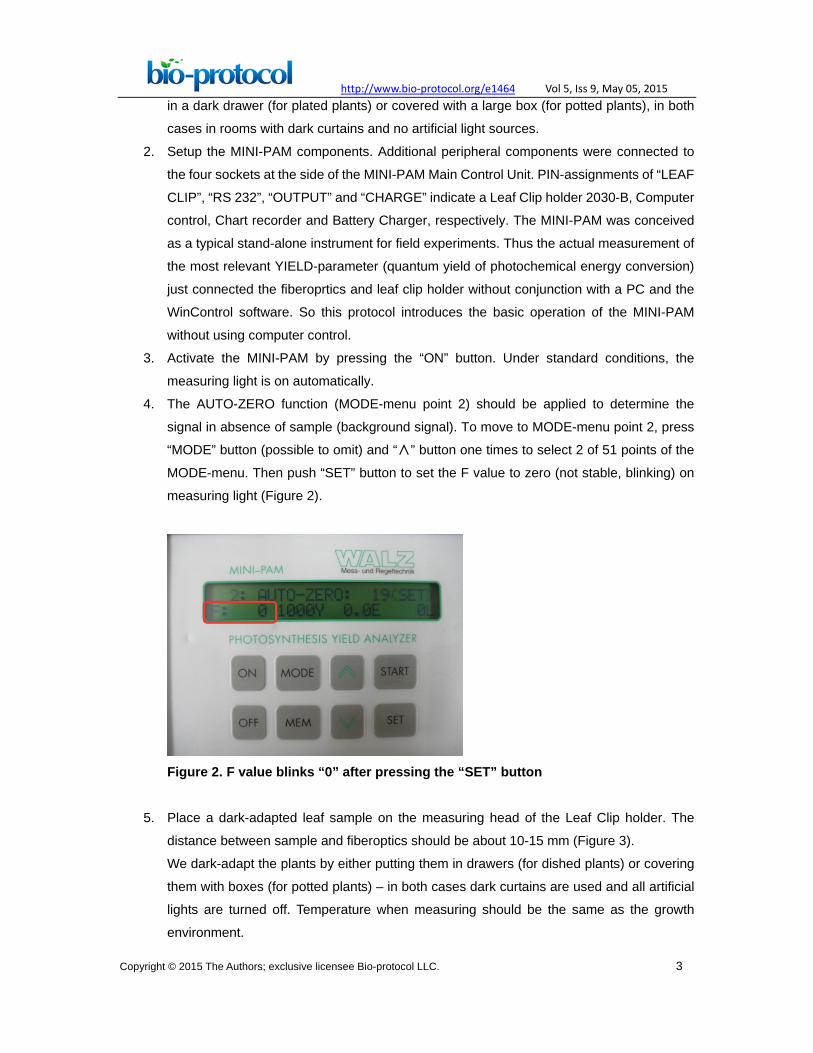
4. The AUTO-ZERO function (MODE-menu point 2) should be applied to determine the
signal in absence of sample (background signal). To move to MODE-menu point 2, press
“MODE” button (possible to omit) and “∧” button one times to select 2 of 51 points of the
MODE-menu. Then push “SET” button to set the F value to zero (not stable, blinking) on
measuring light (Figure 2).
Figure 2. F value blinks “0” after pressing the “SET” button
5. Place a dark-adapted leaf sample on the measuring head of the Leaf Clip holder. The
distance between sample and fiberoptics should be about 10-15 mm (Figure 3).
We dark-adapt the plants by either putting them in drawers (for dished plants) or covering
them with boxes (for potted plants) – in both cases dark curtains are used and all artificial
lights are turned off. Temperature when measuring should be the same as the growth
environment.
Copyright © 2015 The Authors; exclusive licensee Bio-protocol LLC. 3
Page 4
http://www.bio-protocol.org/e1464 Vol 5, Iss 9, May 05, 2015
Figure 3. A photo of the leaf clip holder and fiberoptics
6. Just press the “START” button. Measuring the fluorescence parameters is proceeding
automatically within seconds (see below).
a. the minimum fluorescence in dark-adapted state (Fo) is sampled (displayed as ...F).
b. a saturation pulse is applied.
c. a saturation pulse induced maximum fluorescence in dark-adapted state (Fm) is
sampled (displayed as …M).
d. YIELD=(Fm-Fo)/Fm=Fv/Fm is calculated and shown on the display as …Y.
e. When you use the Leaf Clip holder, the photosynthetically active radiation (PAR) and
temperature at the same spot of a leaf where fluorescence is measured is also
sampled (displayed as …L and …C, respectively).
f. The apparent rate of electron transport (ETR) =YIELD x PAR x 0.5 x ETR-factor (0.84)
is calculated (displayed as …E).
7. The parameter indicated by the above is shown to a screen after measurement (Figure 4).
The obtained data are stored in the MEMORY.
Arabidopsis plants under normal growth condition shows an Fv/Fm value between 0.75 to
0.85. (If Fm/Fv is not between 0.75 and 0.85, it is highly likely that the sample Arabidopsis
plants are in poor health or not properly grown.)
Figure 4. A photo of the machine display after measurement
Copyright © 2015 The Authors; exclusive licensee Bio-protocol LLC. 4
Page 5
http://www.bio-protocol.org/e1464 Vol 5, Iss 9, May 05, 2015
8. If you want to know only the Fv/Fm value, following analysis is not needed.
On the other hand, when leaf is illuminated, its fluorescence yield can change between Fo
and Fm, which can be assessed after well dark-adaptation. Lower Fm value under light
conditions may be caused either by photochemical quenching or by non-photochemical
quenching (NPQ). The quenching coefficients are defined as follows:
qP=(Fm’-F)/(Fm’-Fo)
qN=(Fm-Fm’)/(Fm-Fo)
NPQ=(Fm-Fm’)/Fm’
A saturation pulse induced maximum fluorescence during light adaptation (Fm’) is
sampled (displayed as …M).
9. These quenching coefficients need to sample four values (Fo, Fm, F and Fm’). Others are
calculated values by using these four parameters. The value of Fo and Fm were
previously measured by using a dark-adapted leaf sample. Thus, these values need to
store in the MINI-PAM system.
10. The MODE-menu point 25 (Fo and Fm) should be applied to store the values of Fo and
Fm (Figure 5). This function to sample Fo and Fm of a dark-adapted leaf by use of the
SET-key. The stored Fo and Fm values are used for determination of qP, qN and NPQ.
Figure 5. A photo of the display when setting Fo and Fm (“Mode” menu 25)
11. Then light adapted leaf samples are prepared. A same as a dark-adapted leaf sample,
press the “START” button on procedure 6. Measuring the fluorescence parameters under
light condition is proceeding automatically within seconds and calculated qP, qN and NPQ
as well as YIELD (Fv’/Fm’), ETR and PAR. The obtained data are stored in the MEMORY.
12. Recall on display via MEM-key. Push “MEM” button and select measured sample by using
“∧” and “∨” button.
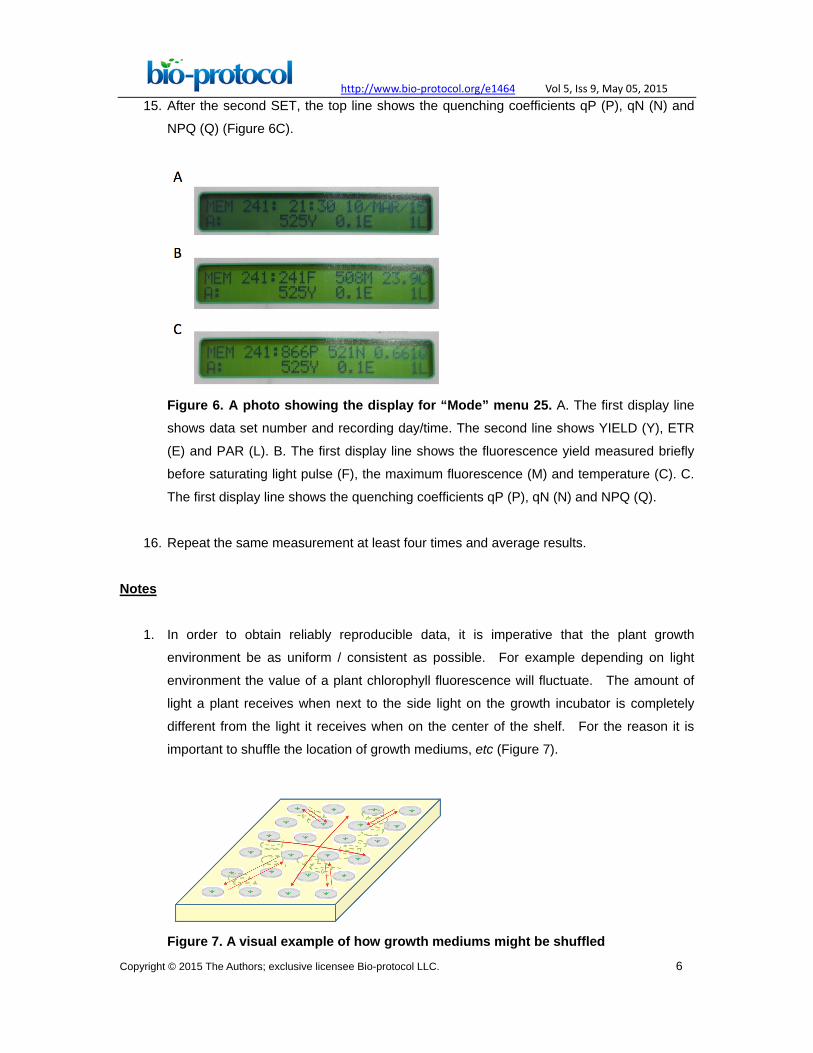
13. In the top line it can be seen the data set number and recording day time (Figure 6A). The
bottom line shows YIELD (Y), ETR (E) and PAR (L).
14. More information of data set can be displayed by pushing “SET” button. After the first SET,
the top line shows the fluorescence yield measured briefly before the saturating light pulse
(F), the maximum fluorescence (M) and temperature (C) (Figure 6B).
Copyright © 2015 The Authors; exclusive licensee Bio-protocol LLC. 5
Page 6
http://www.bio-protocol.org/e1464 Vol 5, Iss 9, May 05, 2015 15. After the second SET, the top line shows the quenching coefficients qP (P), qN (N) and
NPQ (Q) (Figure 6C).
Figure 6. A photo showing the display for “Mode” menu 25. A. The first display line
shows data set number and recording day/time. The second line shows YIELD (Y), ETR
(E) and PAR (L). B. The first display line shows the fluorescence yield measured briefly
before saturating light pulse (F), the maximum fluorescence (M) and temperature (C). C.
The first display line shows the quenching coefficients qP (P), qN (N) and NPQ (Q).
16. Repeat the same measurement at least four times and average results.
Notes
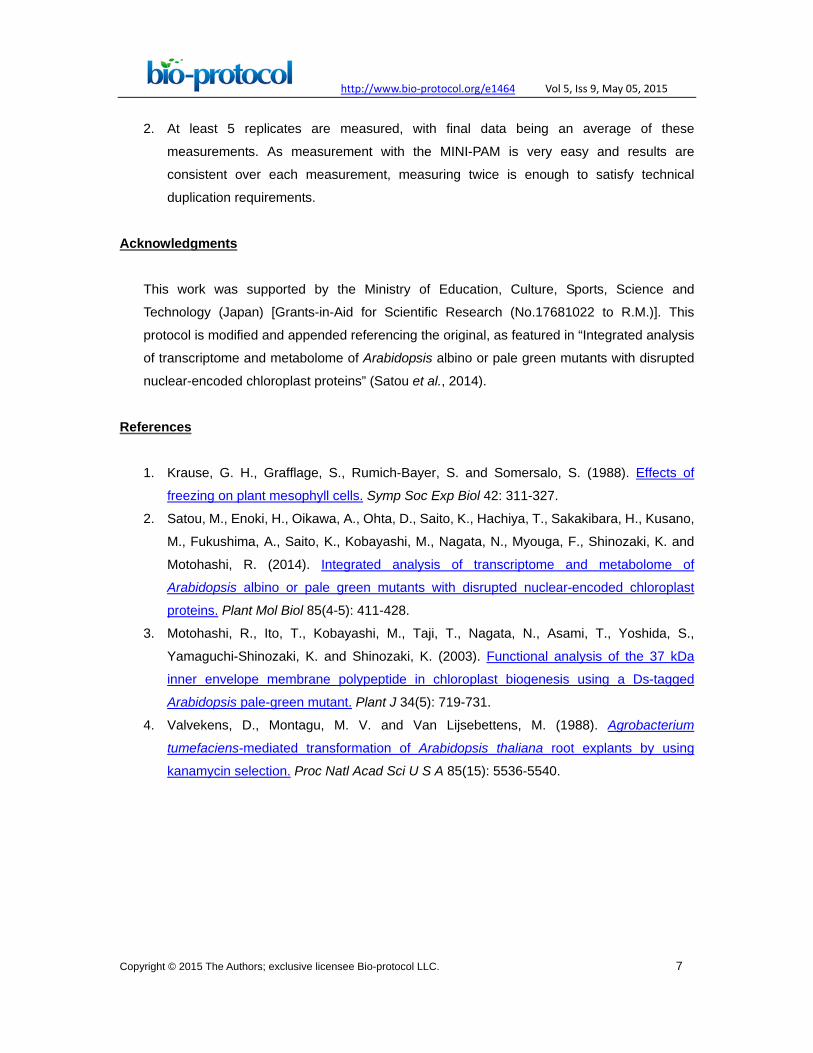
1. In order to obtain reliably reproducible data, it is imperative that the plant growth
environment be as uniform / consistent as possible. For example depending on light
environment the value of a plant chlorophyll fluorescence will fluctuate. The amount of
light a plant receives when next to the side light on the growth incubator is completely
different from the light it receives when on the center of the shelf. For the reason it is
important to shuffle the location of growth mediums, etc (Figure 7).
Figure 7. A visual example of how growth mediums might be shuffled
Copyright © 2015 The Authors; exclusive licensee Bio-protocol LLC. 6
Page 7
http://www.bio-protocol.org/e1464 Vol 5, Iss 9, May 05, 2015
2. At least 5 replicates are measured, with final data being an average of these
measurements. As measurement with the MINI-PAM is very easy and results are
consistent over each measurement, measuring twice is enough to satisfy technical
duplication requirements.
Acknowledgments
This work was supported by the Ministry of Education, Culture, Sports, Science and
Technology (Japan) [Grants-in-Aid for Scientific Research (No.17681022 to R.M.)]. This
protocol is modified and appended referencing the original, as featured in “Integrated analysis
of transcriptome and metabolome of Arabidopsis albino or pale green mutants with disrupted
nuclear-encoded chloroplast proteins” (Satou et al., 2014).
References
1. Krause, G. H., Grafflage, S., Rumich-Bayer, S. and Somersalo, S. (1988). Effects of
freezing on plant mesophyll cells. Symp Soc Exp Biol 42: 311-327.
2. Satou, M., Enoki, H., Oikawa, A., Ohta, D., Saito, K., Hachiya, T., Sakakibara, H., Kusano,
M., Fukushima, A., Saito, K., Kobayashi, M., Nagata, N., Myouga, F., Shinozaki, K. and
Motohashi, R. (2014). Integrated analysis of transcriptome and metabolome of
Arabidopsis albino or pale green mutants with disrupted nuclear-encoded chloroplast
proteins. Plant Mol Biol 85(4-5): 411-428.
3. Motohashi, R., Ito, T., Kobayashi, M., Taji, T., Nagata, N., Asami, T., Yoshida, S.,
Yamaguchi-Shinozaki, K. and Shinozaki, K. (2003). Functional analysis of the 37 kDa
inner envelope membrane polypeptide in chloroplast biogenesis using a Ds-tagged
Arabidopsis pale-green mutant. Plant J 34(5): 719-731.
4. Valvekens, D., Montagu, M. V. and Van Lijsebettens, M. (1988). Agrobacterium
tumefaciens-mediated transformation of Arabidopsis thaliana root explants by using
kanamycin selection. Proc Natl Acad Sci U S A 85(15): 5536-5540.
Copyright © 2015 The Authors; exclusive licensee Bio-protocol LLC. 7