13
CHM 326 Discovery Lab: Silver Nanoparticle Films: Synthesis and Characterization Department of Chemistry December 2002 Katie Groom, Eugene Kwan, Alioska Orozco
| Date post: | 16-Dec-2015 |
| Category: |
Documents |
| Upload: | tara-harward |
| View: | 215 times |
| Download: | 0 times |
CHM 326 Discovery Lab:
Silver Nanoparticle Films: Synthesis and Characterization
Department of ChemistryDecember 2002
Katie Groom, Eugene Kwan, Alioska Orozco
1.0543 g of TOABin 50 mL toluene
0.1750 g AgNO3 in 25 mL deionized water
stir for 20 minutesorganic phase
aqueous phase
isolate and centrifugeorganic phase
0.0427 g NaBH4
in 25 mL deionizedwater
2) Work up with:0.1 M H2SO4
1 M Na2CO3
deionized water
1) Stir for 2 hours
Ag colloid
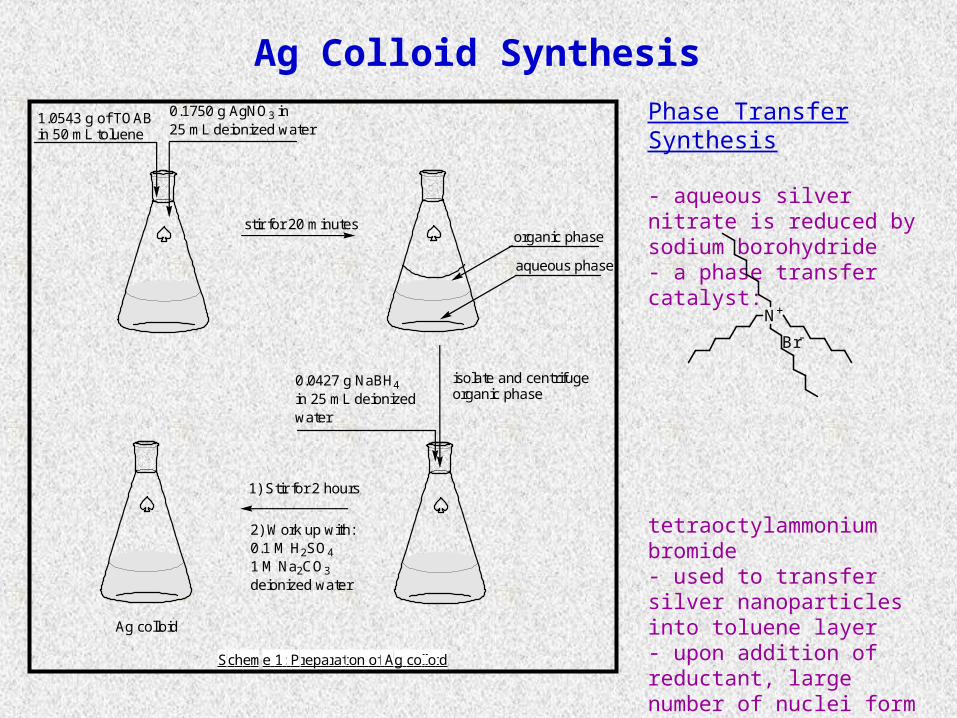
Scheme 1: Preparation of Ag colloid
Ag Colloid Synthesis
Phase Transfer Synthesis
- aqueous silver nitrate is reduced by sodium borohydride- a phase transfer catalyst:
tetraoctylammonium bromide- used to transfer silver nanoparticles into toluene layer- upon addition of reductant, large number of nuclei form- newly reduced silver forms on nuclei to form spherical particles- synthesis is sensitive to cleanliness; all glassware was cleaned in 3:1 HCl:HNO3
N+
Br-

Transmission Electron Microscopy (TEM) of Colloid
False Color Micrograph of Ag Colloid Ellipse Fitting to Nanoparticles
- electron micrograph shows dark (red) regions where electron density is high; colloid drop-cast- grainy background is a polymer matrix; raw image is 1024x1024 8-bit grayscale false colored- grayscale is 0-bit thresholded and fitted with NIST software (ImageJ) to ellipses- size distribution is based on the average of the major and minor axes; approximates spheres- particles adopt roughly spherical shape to minimize surface energy

4 5 6 7 8 9 10 11 12 13 14 15 16 17 18 19 200
5
10
15
20
25
30
35
40
45
50
55
60
65
0%
5%
10%
15%
20%
25%
30%
35%
40%
45%
50%
55%
60%
65%
Particle Counts % of Total Counts
Ag Nanoparticle Size Distribution
Pe
rce
nta
ge o
f T
otal
Par
ticl
es
Nu
mbe
r o
f P
arti
cle
s
Particle Size (nm)
300 350 400 450 500 550 600 650 700 750 800
-0.2
0.0
0.2
0.4
0.6
0.8
1.0
1.2
1.4
1.6
1.8
2.0
2.2
2.4
2.6
2.8
3.0 416
solvent: toluene
Ag Colloid UV-Vis Spectrum
Ab
sorb
anc
e (a
.u.)
Wavelength (nm)
Determining Ag Colloid SizeNanoparticle UV-vis SpectrumNanoparticle Size Distribution
plasmon resonance: broad due to polydisperse size distribution
- size distribution is left-truncated: only particles where S/N > ~3 are shown- indicates highly polydisperse colloid; apparently there are many tiny particles left- most particles are small; roughly half of resolved particles are between 4 and 5 nm- black squares indicate the normalized integral of the corresponding size bin- two dimensional particle density ~ 3.3 x 10¹⁴ particles/m2 - synthesis needs optimization!

8 7 6 5 4 3 2 1 0
0.0
0.2
0.4
0.6
0.8
1.0
1.2
1.4
1.6
toluene ArH toluene CH3
399.11 MHz, SW=6000 Hz, 160 transientsApodization: Exponential LB (resolution enhance)Linear Prediction (2x), Zero F ill (2x)
Proton NMR of Ag Nanoparticles
nanoparticles
tetraoctylammoniumbromide
Inte
nsi
ty (a
.u.)
(ppm)
140 120 100 80 60 40 20 0
0
1
2
3
4
5
6
7
75.45 MHz, SW=18798 Hz, 750 transientsApodization: Exponential LB (S/N enhance)Linear Prediction (2x), Zero Fill (2x)
Carbon-13 NMR of Ag Nanoparticles
(d8)-toluene
tetraoctylammoniumbromide
nanoparticles
Inte
nsity
(a.u
.)
(ppm)
1H and 13C NMR Characterization of Colloid
- both spectra indicate the presence of tetraoctylammonium bromide (TOAB)- supports hypothesis that colloid is surrounded by TOAB micelles- spectra taken in deuterated toluene, methanol
300 MHz Proton Spectrum 75 MHz Carbon Spectrum

Cur
rent
(m
A)
reduction
oxidation
Potential vs. (V)
Cyclic Voltammetry (CV) Experimental Setup
Time (s)
Potential (V)
triangular sweep vs. reference electrode potential
Potential (vs. Ag/AgCl, V)
peaks show redox reactions
Electrochemical Setup Triangular Voltage Sweep
- current is monitored as a function of potential- potential is monitored between working electrode and reference electrode- small current passes between working and counter electrode
Ag,Ag/Cl referenceelectrode
Pt working electrode
Pt counterelectrode
Resulting Profile: Sample CV
- to examine solutions, different electrode surfaces, potentials, and electrolytes can be used- to examine surfaces, easily reversible electrochemical redox couples are used as probes

Cyclic Voltammetry of Ag Colloid
-0.6 -0.8 -1.0 -1.2 -1.4 -1.6 -1.8 -2.0 -2.2-2
0
2
4
6
8
10
12
14
increasing amounts ofag colloid added tocv sample solution
Conditions:Solvent: 3:1 toluene:acetonitrileSupp. Electrolyte: Bu
4NBF
4
Working Electrode: PtCounter Electrode: PtReference Electrode: Ag/AgClScan Speed: 250 mV/secScans: 5 eachiR Compensation: ActiveDegassing: N
2 purge, 60 sec
a few dropsCell Resistance: 3075
a few more dropsCell Resistance: 3075
CV: Effect of Colloid Additions+1.0 mLCell Resistance: 3673
+0.5 mLCell Resistance: 3344
Curr
ent (
x 10
-5 A
)
Voltage (V)
-colloid solution probed by CV
- Pt working electrode used
- small additions of silver colloid cause shift in old peak positions and the appearance of new peaks
- new peaks probably due to redox behavior of TOAB
- note increased TOAB concentration and increased uncorrected cell resistance with successive colloid additions

into
1/2 inch x 3/4 inch ITO slide
heat solution at 80 degrees for 20
minutes
place slide into 110 degree oven
for10 minutes
silanized ITO slide
25 mL beaker containing a 2% (vol.)
solution of 3-aminopropyl-diethoxysilane in toluene
into
20 mL vial containingconcentrated Ag colloid
solution for 24 hours
Silanized slidewith first layer of Ag
colloid
Scheme 2: Silanization of ITO slide
Silanized slidewith first layer of Agcolloid 20 mL vial containing
0.5mM solution of dithiolsolution in absolute
ethanol for 10 minutes
into Return slide to vialcontaining Ag solution
Result: Assemblyof layer 2
Note: Additional layers formed by the same process shown above.
Scheme 3: Layer by layer assembly of molecularly linked Ag nanoparticles
Layer by Layer Assembly of Films
- contaminants and physisorbed particles were removed from slides with thorough rinsing; this ensured successful monolayer deposition- to obtain optimum deposition, slides were immersed in the Ag colloid for 24 hours for each layer- following immersion in the Ag colloid, layer formation was monitored by UV-vis spectroscopy- slides were initially yellow in color, progressing to a purple appearance as more layers were added

300 400 500 600 700 8000.00
0.05
0.10
0.15
0.20
0.25
0.30
0.35
0.40
0.45
0.50
0.55
0.60
0.65
layer 5
layer 4
layer 3
layer 2
layer 1
UV-Vis Spectra of Layer-by-Layer Growth on ITO (Ethanedithiol)
Ab
sorb
an
ce (
a.u
.)
Wavelength (nm)
300 350 400 450 500 550 600 650 700 750 800-0.10
-0.05
0.00
0.05
0.10
0.15
0.20
0.25
0.30
0.35
0.40
layer 5
layer 4
layer 3
layer 2layer 1
UV-Vis Spectra of Layer-by-Layer Growth on Glass (Ethanedithol)
Ab
so
rba
nce
(a
.u.)
Wavelength (nm)
UV-vis Spectroscopy: Monitoring Layer Formation
- as more layers are added, absorbance maximum increases- corresponding to an increase in the amount of material that is present on the slides
Ethanedithiol Linker on ITO Ethanedithiol Linker on Glass

300 400 500 600 700 800
0.00
0.05
0.10
0.15
0.20
0.25
0.30
0.35
0.40
0.45
0.50
0.55
0.60
0.65
0.70
0.75
0.80
0.85
layer 5
layer 4
layer 3
layer 2
layer 1
UV-Vis Spectra of Layer-by-Layer Growth on ITO (Octanedithiol)
Ab
sorb
an
ce
(a.u
.)
Wavelength (nm)
300 350 400 450 500 550 600 650 700 750 800-0.1
0.0
0.1
0.2
0.3
0.4
0.5
0.6
0.7
layer 5
layer 4
layer 3
layer 2
layer 1
UV-Vis Spectra of Layer-by-Layer Growth on Glass (Octanedithiol)
Ab
sorb
an
ce
(a.u
.)
Wavelength (nm)
Octanedithiol Linker on ITO Octanedithiol Linker on Glass
UV-vis Spectroscopy: Monitoring Layer Formation
- compare peak positions with ethanedithiol linkers- octanedithiol linked slides are considerably blue-shifted compared to ethanedithol slides

1 2 3 4 50.05
0.10
0.15
0.20
0.25
0.30
0.35
0.40
0.45
0.50
0.55
0.60
0.65
0.70
0.75
0.80
0.85Slide Growth Monitoring - Absorbance Maxima
Ab
sor
ban
ce
Ma
xim
um (a
.u.)
Number of Immersions (Layers)
Slide 1 - ITO/Ethanedithiol Slide 2 - ITO/Ethanedithiol Slide 3 - ITO/Octanedithiol Slide 4 - ITO/Octanedithiol Slide 5 - Glass/Ethanedithiol Slide 6 - Glass/Octanedithiol
1 2 3 4 5360
380
400
420
440
460
480
500
520
540
560Slide Growth Monitoring - Redshif ting
aggregation
Loc
atio
n o
f A
bs
orb
an
ce
Ma
xim
um
(n
m)
Number of Immersions (Layers)
Slide 1 - ITO/Ethanedithiol Slide 2 - ITO/Ethanedithiol Slide 3 - ITO/Octanedithiol Slide 4 - ITO/Octanedithiol Slide 5 - Glass/Ethanedithiol Slide 6 - Glass/Octanedithiol
Monitoring Layer Formation: Absorbance Maximum
- an increase in the absorbance maximum corresponds to an increase in the amount of material after each successive layer- as more layers are added, the peak red-shifts, indicating an increase in inter-nanoparticle coupling- absorbances for each layer roughly follow Beer’s Law; constant amounts are added per layer- nonzero intercept indicates new material may end up partially being deposited in the previous layer- particle films are disordered
Ethanedithiol Linker on ITO Ethanedithiol Linker on Glass

Ag,Ag/Cl referenceelectrode
Ag counterelectrode
slide
Slide Preparation for Cyclic Voltammetry (CV)
- redox chemistry occurs at small window- window is small to ensure that mass transport is rate limiting- epoxy is insulating- alligator clip “punches through” layers to ITO coat- current travels down ITO and through film
- slide is used as the working electrode in a CV setup- positive feedback iR compensation is required to correct the film resistance- corrected resistances are approximately metallic- uncorrected cell resistance can be a measure of the slide conductivity
Electrochemical Slide Preparation
Cyclic Voltammetry Setup

-1.2 -1.0 -0.8 -0.6 -0.4 -0.2 0.0 0.2 0.4 0.6 0.8
-5
-4
-3
-2
-1
0
1
2
3
4
5
6
7
8
Work ing Electrode: Octanedithiol Layers on ITOCell Resistance: 193 , Scan Speed: 500 mV/sec
Working Electrode: ITO on glassCell Resistance: 190 Scan Speed: 100 mV/sec
Conditions:Solvent: 0.1 M aqueous Na
2SO
4
Redox Probe: 1 mM hydroquinoneCounter Electrode: PtReference Electrode: Ag/AgCliR Compensation: ActiveDegassing: N
2 purge, 60 sec
and Self-Assembled Layers (Octanedithiol)CV: Comparison of Hydroquinone Redox on ITO
Vo
ltag
e (x
10-4
A)
Voltage (V)
CV Characterization of Octanedithiol Layers
Acknowledgements:- procedures, TEM images, and general help: Paul Trudeau - use of CV: Andrei Yudin- lab space: Al-Amin Dhirani, Dan Mathers - NMR: Tim Burrow- miscellaneous: Jordan Dinglasan, Dan Mathers, Chem Store Staff
- hydroquinone, a well-known reversible redox couple, used as an electrochemical probe to study surface- black CV is on Pt; red CV is on octanedithiol slide- note change in peak position and intensity- quasi-reversible profile is consistent with a reversible redox couple on a metallic surface- iR compensation required


