COMPREHENSIVE HOUSING MARKET ANALYSIS As of October 1, 2012 U.S. Department of Housing and Urban Development Office of Policy Development and Research Santa Ana-Anaheim-Irvine, California Pacific Ocean Los Angeles San Diego Riverside San Bernardino Orange Housing Market Area Summary The Santa Ana-Anaheim-Irvine Housing Market Area (HMA) (hereafter, the Santa Ana HMA), along the Pacific coast in southern California, is part of the Los Angeles-Long Beach-Santa Ana metropoli- tan area. The HMA, which is coterminous with Orange County, is divided into two submarkets. The North Orange County submarket encompasses the principal cities of Santa Ana and Anaheim, and the South Orange County submarket encompasses the principal city of Irvine. The HMA is a center for tourism, health care, and technology production. Economy Economic conditions have strength- ened in the Santa Ana HMA since 2011. Nonfarm payrolls increased by 22,000 jobs, or 1.6 percent, to nearly 1.39 million jobs during the 12 months ending September 2012, with the most significant growth occurring in the professional and business services, leisure and hospitality, and wholesale and retail trade sectors. Nonfarm payroll jobs are expected to increase by an average of 1.1 percent a year during the 3-year forecast period, led by expansion in industries related to professional and business services, health care, and tourism. Sales Market Sales housing market conditions are currently balanced in the HMA. During the 12 months ending September 2012, home sales increased 9 percent, to 30,800 homes. During the forecast period, demand is expected for 7,650 new homes (Table 1). The 470 homes currently under construction and some of the 19,500 other vacant units in the HMA that may reenter the market will satisfy a portion of the demand. Rental Market Rental housing market conditions in the HMA are currently tight, with a 4.8-percent vacancy rate. Growth in renter households since 2010 outpaced both the construction of rental units and the conversion of single-family homes to rental units. During the fore- cast period, demand is expected for 11,225 new rental units in the HMA; the 2,900 rental units currently under construction will meet a portion of that demand (Table 1). Market Details Economic Conditions ...............2 Population and Households .....5 Housing Market Trends ............8 Data Profiles ...........................16 Total demand 7,650 11,225 3,600 5,300 4,050 5,925 Under construction 470 2,900 180 1,175 290 1,725 * Santa Ana-Anaheim-Irvine HMA. Notes: Total demand represents estimated production necessary to achieve a balanced market at the end of the forecast period. Units under construction as of October 1, 2012. A portion of the estimated 19,500 other vacant units in the HMA will likely satisfy some of the forecast demand. Source: Estimates by analyst Santa Ana HMA* North Orange County Submarket South Orange County Submarket Sales Units Rental Units Sales Units Rental Units Sales Units Rental Units Table 1. Housing Demand in the Santa Ana HMA,* 3-Year Forecast, October 1, 2012, to October 1, 2015
Transcript
C O M P R E H E N S I V E H O U S I N G M A R K E T A N A L Y S I S
As of October 1, 2012U.S. Department of Housing and Urban Development Office of Policy Development and Research
Santa Ana-Anaheim-Irvine, California
Pacific Ocean
Los Angeles
San Diego
Riverside
San Bernardino
Orange
Housing Market Area
Summary
The Santa Ana-Anaheim-Irvine Housing Market Area (HMA) (hereafter, the Santa Ana HMA), along the Pacific coast in southern California, is part of the Los Angeles-Long Beach-Santa Ana metropoli-tan area. The HMA, which is coterminous with Orange County, is divided into two submarkets. The North Orange County submarket encompasses the principal cities of Santa Ana and Anaheim, and the South Orange County submarket encompasses the principal city of Irvine. The HMA is a center for tourism, health care, and technology production.
Economy Economic conditions have strength-ened in the Santa Ana HMA since 2011. Nonfarm payrolls increased by 22,000 jobs, or 1.6 percent, to nearly 1.39 million jobs during the 12 months ending September 2012, with the most significant growth occurring in the professional and business services, leisure and hospitality, and wholesale and retail trade sectors. Nonfarm payroll jobs are expected to increase by an average of 1.1 percent a year during the 3-year forecast period, led by expansion in industries related to professional and business services, health care, and tourism.
Sales MarketSales housing market conditions are currently balanced in the HMA. During the 12 months ending September 2012,
home sales increased 9 percent, to 30,800 homes. During the forecast period, demand is expected for 7,650 new homes (Table 1). The 470 homes currently under construction and some of the 19,500 other vacant units in the HMA that may reenter the market will satisfy a portion of the demand.
Rental MarketRental housing market conditions in the HMA are currently tight, with a 4.8-percent vacancy rate. Growth in renter households since 2010 outpaced both the construction of rental units and the conversion of single-family homes to rental units. During the fore- cast period, demand is expected for 11,225 new rental units in the HMA; the 2,900 rental units currently under construction will meet a portion of that demand (Table 1).
* Santa Ana-Anaheim-Irvine HMA.Notes: Total demand represents estimated production necessary to achieve a balanced market at the end of the forecast period. Units under construction as of October 1, 2012. A portion of the estimated 19,500 other vacant units in the HMA will likely satisfy some of the forecast demand.Source: Estimates by analyst
Santa Ana HMA*
North Orange County Submarket
South Orange County Submarket
SalesUnits
RentalUnits
SalesUnits
RentalUnits
SalesUnits
RentalUnits
Table 1. Housing Demand in the Santa Ana HMA,* 3-Year Forecast, October 1, 2012, to October 1, 2015
Sa
nta
An
a-A
na
he
im-I
rv
ine
, C
A •
CO
MP
RE
HE
NS
IVE
HO
US
ING
MA
RK
ET
AN
ALY
SIS
2Economic Conditions
The Santa Ana HMA serves as an employment center for tour-
ism, health care, and the production of aerospace and medical technology in southern California. The largest private employers in the HMA are The Walt Disney Company, Saint Joseph Health, and The Boeing Company, with 22,000, 12,050, and 7,700 em-ployees, respectively (Table 2). The HMA has led southern California in economic recovery and expansion since 2011, after the employment de- cline in the HMA that started during 2007. Employment conditions strengthened in the HMA during the
12 months ending September 2012, when nonfarm payrolls increased by 22,000 jobs, or 1.6 percent, compared with the number of jobs recorded during the previous 12-month period, to nearly 1.39 million jobs (Table 3). By comparison, employment growth in southern California as a whole during the past year was slower, increasing by an average of 1.3 percent. A decline of 3,775 jobs, or 1.7 percent, divided nearly equally between the govern-ment sector and the construction subsector, partially offset the growth in nonfarm payrolls in the HMA dur-ing the 12 months ending September 2012. The declines resulted in part from the closure of redevelopment agencies throughout California, lead- ing to declines in state government subsector jobs, and in part from tight mortgage-lending standards that con- tinued to restrict development. Despite the reductions in jobs in the government sector and the construction subsector, the recent overall gain is a significant improvement from the employment contraction that occurred from 2007 through 2010, when the HMA lost an average of 41,300 nonfarm payroll jobs, or 2.8 percent, annually.
Employment began to recover in the HMA during 2011. Significant expan-sions during the 12 months ending September 2012 occurred in the profes-sional and business services, leisure and hospitality, and wholesale and retail trade sectors, which increased by a combined 19,900 jobs and accounted for 90 percent of total payroll growth. As economic conditions improved, the average unemployment rate declined to 7.8 percent during the 12 months ending September 2012, down from 8.9 percent during the previous 12 months. The current unemployment rate is less than the 10.8-percent
Name of Employer Nonfarm Payroll Sector Number of Employees
The Walt Disney Company Leisure & hospitality 22,000University of California, Irvine Government 21,300Saint Joseph Health Education & health services 12,050The Boeing Company Manufacturing 7,700Bank of America Corporation Financial activities 6,300Yum! Brands, RSC Wholesale & retail trade 6,300Kaiser Permanente® Education & health services 5,975Target Corporation Wholesale & retail trade 5,525Cedar Fair Entertainment Company Leisure & hospitality 5,200California State University, Fullerton Government 5,175
* Santa Ana-Anaheim-Irvine HMA.Note: Excludes local school districts. Sources: Orange County Business Journal, 2011; California Employment Development Department
Table 2. Major Employers in the Santa Ana HMA*
* Santa Ana-Anaheim-Irvine HMA.Notes: Based on 12-month averages through September 2011 and September 2012. Numbers may not add to totals because of rounding.Source: U.S. Bureau of Labor Statistics
Table 3. 12-Month Average Nonfarm Payroll Jobs in the Santa Ana HMA,* by Sector
12 MonthsEnding
September 2011
12 MonthsEnding
September 2012
Percent Change
Total nonfarm payroll jobs 1,364,000 1,386,000 1.6Goods-producing sectors 222,200 222,100 0.0
and business services, education and health services, and leisure and hospitality sectors.
The professional and business ser - vices sector, which added the most jobs during the past year, is the largest sector in the HMA, accounting for 18 percent of all jobs (Figure 3). During the 12 months ending September 2012, employment in the professional and business services sector increased by 7,500 jobs, or 3.1 percent, up from the 4,625-job, or 1.9-percent, increase during the previous 12-month period and a significant improvement from the average annual loss of 8,675 jobs, or 6.9 percent, from 2007 through 2010. Employment growth in the past year was partially the result of expan-sions in the professional, scientific, and technical services subsector, which increased by 1,675 jobs, or 1.5 percent. Payroll increases in these subsectors are expected to continue during the next year. According to the California
average rate recorded for California and the 10.6-percent average rate recorded for southern California. See Figure 1 for trends in the labor force, resident employment, and the average unemployment rate in the HMA and Figure 2 for nonfarm payroll sector growth from 2000 to the current date. Employment growth during the next 3 years is expected to occur from expansions in the professional
* Santa Ana-Anaheim-Irvine HMA.Source: U.S. Bureau of Labor Statistics
Figure 1. Trends in Labor Force, Resident Employment, and Unem-ployment Rate in the Santa Ana HMA,* 2000 Through 2011
Labo
r fo
rce
and
resi
dent
em
ploy
men
t
Une
mpl
oym
ent r
ate
1,775,000
1,675,000
1,575,000
1,475,000
1,375,000
1,275,000
2000
2002
2004
Labor force Resident employment Unemployment rate
10.0
8.0
6.0
4.0
2.0
0.0
2006
2001
2003
2005
2007
2009
2010
2011
2008
Figure 2. Sector Growth in the Santa Ana HMA,* Percentage Change, 2000 to Current
* Santa Ana-Anaheim-Irvine HMA.Note: Current is based on 12-month averages through September 2012.Source: U.S. Bureau of Labor Statistics
Total nonfarm payroll jobs
Goods-producing sectors
Mining, logging, & construction
Manufacturing
Service-providing sectors
Information
Financial activities
Professional & business services
Education & health services
Government
Other services
Leisure & hospitality
Transportation & utilities
Wholesale & retail trade
– 30 20– 20 10– 10 0– 40– 50 504030
Sa
nta
An
a-A
na
he
im-I
rv
ine
, C
A •
CO
MP
RE
HE
NS
IVE
HO
US
ING
MA
RK
ET
AN
ALY
SIS
4
Employment Development Depart ment (EDD), employment announcements in web development and computer systems analysis totaled 2,850 during September 2012, an increase of 6.0 percent from the 2,700 jobs announced a year ago.
Despite the HMA enduring two eco- nomic downturns during the past dec-ade, the education and health services sector continues to provide stability to the HMA economy. During the 12 months ending September 2012, the education and health services sector increased by 2,200 jobs, or 1.4 percent, compared with the increase of 3,125 jobs, or 2.0 percent, recorded during the previous 12 months. More than 90 percent of the growth in the sector was attributable to gains in the healthcare and social assistance subsector, where additional growth is expected during the next 3 years. According to the EDD, UnitedHealth Group, in the South Orange County submarket, announced 396 job open- ings during September 2012. In addi-tion, Kaiser Permanente®, the second largest employer in the education and health services sector, with 5,975 em-ployees, is constructing a $461 million hospital that will be complete by
October 2012, adding approximately 500 jobs in the North Orange County submarket. Children’s Hospital of Orange County is undertaking a $562 million expansion of its hospital facilities, also in the North Orange County submarket, that will add 400 jobs when complete in 2013.
The leisure and hospitality sector is the third largest sector in the econo-my. The Santa Ana HMA is home to the Anaheim Convention Center, the largest exhibition facility on the west coast, and two of the most visited amusement parks in the world. On average, the HMA receives 43 million visitors who spend approximately $7 billion dollars annually, according to the Anaheim/Orange County Visitor & Convention Bureau. Apart from the decline in employment in the leisure and hospitality sector that averaged 3,900 jobs, or 2.2 percent, an-nually during 2009 and 2010, payroll growth in the sector was steady during most of the 2000s, increasing by an average of 4,450 jobs, or 2.9 percent, annually. During the 12 months end- ing September 2012, employment in the leisure and hospitality sector increased by 6,700 jobs, or 3.9 per- cent, more than during the growth
Figure 3. Current Nonfarm Payroll Jobs in the Santa Ana HMA,* by Sector
* Santa Ana-Anaheim-Irvine HMA.Note: Based on 12-month averages through September 2012.Source: U.S. Bureau of Labor Statistics
Government 10.7%
Leisure & hospitality 12.9%
Other services 3.1%
Education & health services 11.6%
Professional & business services 18.3%
Wholesale & retail trade 16.2%
Manufacturing 11.2%
Mining, logging, & construction 4.9%
Information 1.7%
Transportation & utilities 2.0%
Financial activities 7.6%
Economic Conditions Continued
Sa
nta
An
a-A
na
he
im-I
rv
ine
, C
A •
CO
MP
RE
HE
NS
IVE
HO
US
ING
MA
RK
ET
AN
ALY
SIS
5Economic Conditions Continued
years of the 2000s and up from the increase of 3,925 jobs, or 2.3 percent, during the previous 12-month period. In addition to The Walt Disney Company, Cedar Fair Entertainment Company, owner of the Knott’s Berry Farm amusement park, is among the largest employers in the sector, with 5,200 employees. Employment growth is expected to continue during the next 3 years. During 2012, The Walt Disney Company expanded its Disney California Adventure® theme park, in the North Orange County submarket, which will add 1,000 per-manent jobs during 2012 and 2013 in addition to the 2,000 jobs The Walt Disney Company added during 2011.
Furthermore, as a result of increased hotel occupancy during the past year, construction is expected to begin on two luxury hotels in the Anaheim GardenWalk mall, near Disneyland® Resort in the North Orange County submarket. The hotels are expected to add a combined 1,300 permanent positions when complete within the next 5 years.
During the 3-year forecast period, as the economy continues to improve, nonfarm payrolls are expected to in-crease 1.1 percent, or by 15,300 jobs, a year. Approximately 60 percent of employment growth is expected to occur in the North Orange County submarket.
Population and Households
The population of the Santa Ana HMA was estimated at more
than 3.07 million as of October 1, 2012. This total reflects an average increase of approximately 25,300, or 0.8 percent, annually since July 1, 2011, which was up from the average increase of 17,500, or 0.6 percent, annually from 2007 through 2010, when employment con- ditions were weak. The increase in the population since 2011 is also up from the average of 14,800, or 0.5 percent, annually from 2001 through 2006, when lending standards were lenient and net out-migration occurred from the North Orange County submarket to neighboring Los Angeles, San Bernardino, and Riverside Counties, where housing was relatively more affordable. During 2011, population growth began to increase as employ-ment conditions started to improve,
leading to an average net in-migration of 4,500 people annually compared with the net out-migration of 7,700 people annually recorded from 2007 through 2010. During the next 3 years, net in-migration is expected average 5,425 people annually as employment conditions continue to improve.
Since 2011, net natural increase (res- ident births minus resident deaths) has accounted for approximately 80 percent of the population growth in the HMA, averaging 20,800 people annually compared with the average of 30,500 people, or all the population growth, recorded from 2007 through 2010. Net natural increase is expect-ed to decline slightly during the next 3 years, to 20,600 people annually. Approximately 65 percent of the HMA population resides in the North Orange County submarket. Since
Sa
nta
An
a-A
na
he
im-I
rv
ine
, C
A •
CO
MP
RE
HE
NS
IVE
HO
US
ING
MA
RK
ET
AN
ALY
SIS
6
Figure 5. Components of Population Change in the Santa Ana HMA,* 2000 to Forecast
* Santa Ana-Anaheim-Irvine HMA.Sources: 2000 and 2010—2000 Census and 2010 Census; current and forecast—estimates by analyst
Net natural change Net migration
2000 to 2010 2010 to Current Current to Forecast
Ave
rage
ann
ual c
hang
e
30,000
25,000
20,000
15,000
10,000
5,000
0
– 5,000
– 10,000
– 15,000
Population Households
* Santa Ana-Anaheim-Irvine HMA.Sources: 2000 and 2010—2000 Census and 2010 Census; current and forecast—estimates by analyst
Figure 4. Population and Household Growth in the Santa Ana HMA,* 2000 to Forecast
2000 to 2010 2010 to Current Current to Forecast
Ave
rage
ann
ual c
hang
e
30,000
25,000
20,000
15,000
10,000
5,000
0
2011, the population of the submarket increased by an average of 11,500, or 0.6 percent, annually compared with the average annual increase of 9,725, or 0.5 percent, recorded from 2007 through 2010. Net out-migration in the submarket has slowed to average approximately 3,500 people annually since 2011 compared with the average net out-migration of 8,875 people re- corded annually from 2007 through 2010. Similarly, the population in the South Orange County submarket has increased by an average of 13,800, or 1.4 percent, a year since 2011 compared with the average annual increase of 7,750, or 0.8 percent, recorded from 2007 through 2010. Population growth in the submarket since 2011 was attributable, in part, to an average net in-migration of 8,000 people annually compared
with an average net in-migration of 1,175 people annually from 2007 through 2010.
During the next 3 years, as economic conditions continue to strengthen, population growth in the North Orange County and South Orange County submarkets is expected to increase by averages of 11,650 and 14,000 people, or 0.6 and 1.3 percent, annually, respectively. In the HMA as a whole, the population is expected to increase by an average of 26,000, or 0.8 percent, annually during the 3-year forecast period. The population of the HMA is expected to reach 3.15 million by the end of the forecast period. See Figure 4 for population and household growth in the HMA and Figure 5 for the components of population change in the HMA from 2000 through the forecast period.
The number of households in the Santa Ana HMA has increased by 6,100, or 0.6 percent, annually since 2010, up slightly from the average increase of 5,750, or 0.6 percent, an- nually during the 2000s. Household growth in the North Orange County submarket during the 2000s was lim - ited because of significant net out- migration, as households sought to purchase relatively more affordable housing in neighboring counties dur - ing the housing boom. Since 2010, net out-migration from the submarket has slowed as employment conditions have improved, and the number of households has increased by an aver - age of 3,075, or 0.5 percent, annually compared with an average increase of 1,100 households, or 0.2 percent, annually from 2000 through 2010, when net out-migration in the sub - market was greatest. Conversely, the household growth rate in the South Orange County submarket has slowed
Population and Households Continued
Sa
nta
An
a-A
na
he
im-I
rv
ine
, C
A •
CO
MP
RE
HE
NS
IVE
HO
US
ING
MA
RK
ET
AN
ALY
SIS
7Population and Households Continued
the household growth rate that has continued since 2010. Household growth in the submarket has increased by an average of 3,100, or 0.8 percent, annually since 2010, but the household growth rate is down from an average of 4,650, or 1.3 percent, annually from 2000 through 2010.
During the 3-year forecast period, the number of households in the North Orange County submarket is expected to increase by an average of 2,575, or 0.4 percent, annually, slightly less than the average annual increase during the 2010-to-current period, as net out- migration is expected to remain stable during the forecast. In the South Or - ange County submarket, the number of households is expected to increase by an average of 3,775, or 1.0 percent, annually, reflecting an increase in net in-migration to the South Orange County submarket during the forecast. Combined household growth in the two submarkets is expected to result in nearly 1.03 million households in the HMA by the end of the forecast period. See Tables DP-1, DP-2, and DP-3, at the end of this report, for household growth by tenure in the HMA and in each submarket from 2000 through the current date. See Figures 6 and 7 for the number of households by tenure in each sub - market since 2000.
since 2010 compared with the growth rate recorded during the 2000s, but it remains higher than the growth rate in the North Orange County submar-ket. During the early-to-mid 2000s, strong employment conditions sup - ported significant net in-migration in the South Orange County submarket, and the number of households ex - panded at a faster pace. By the end of the 2000s, weaker employment conditions and tighter lending stand - ards reduced net in-migration to the submarket, leading to a slowing of
Sources: 2000 and 2010—2000 Census and 2010 Census; current—estimates by analyst
Figure 7. Number of Households by Tenure in the South Orange County Submarket, 2000 to Current
Renter Owner
2000 2010 Current
250,000
200,000
150,000
100,000
50,000
0
Figure 6. Number of Households by Tenure in the North Orange County Submarket, 2000 to Current
Sources: 2000 and 2010—2000 Census and 2010 Census; current—estimates by analyst
Renter Owner
2000 2010 Current
400,000
350,000
300,000
250,000
200,000
150,000
100,000
50,000
0
Sa
nta
An
a-A
na
he
im-I
rv
ine
, C
A •
CO
MP
RE
HE
NS
IVE
HO
US
ING
MA
RK
ET
AN
ALY
SIS
8Housing Market Trends
Sales Market—North Orange County SubmarketThe North Orange County submarket includes the principal city of Santa Ana and the cities of Anaheim and Huntington Beach. Much of the sub- market has been built out since the 1980s, and new home developments are typically on infill parcels, former oil fields, or redeveloped land. The elimination of redevelopment agencies in 2011 is expected to lead to future difficulties in the development of new housing, especially on a large scale, for years to come. According to Hanley Wood, LLC, approximately one-half of new and existing home sales in the Santa Ana HMA occurred in this sub- market during the 12 months ending September 2012.
The home sales market in the submar-ket is currently balanced. The current estimated owner vacancy rate is 1.2 percent, down from 1.3 percent in April 2010 because of improvement in the existing home sales market as the economy strengthened and because of the transition of some single-family detached and attached homes from owner to renter occupancy. Accord-ing to data from Hanley Wood, LLC, from 2007 through 2010, new and existing home sales declined at an average annual rate of 6 percent, or 2,100 homes, to total 15,500 homes sold compared with the average of 24,000 homes sold annually dur- ing 2005 and 2006. Home sales are starting to improve. During the 12 months ending September 2012, home sales increased by 1,150, or 7 percent, to 16,250 homes sold compared with the 15,100 homes sold during the 12 months ending September 2011. From 2007 through 2010, the average home sales price declined 5 percent a year, to $503,200, compared with the
average price of $630,800 recorded during 2005 and 2006. Average new and existing home sales prices declined by $1,900, or less than 1 percent, to $442,100 during the 12 months ending September 2012 compared with the prices recorded during the previous 12-month period.
REO (Real Estate Owned) sales de- clined as a percentage of total existing home sales. During the 12 months ending September 2012, 3,850 REO homes sold in the North Orange County submarket, representing 25 percent of existing home sales com- pared with the 4,100 REO sales re- corded during the previous 12-month period, representing 28 percent of existing home sales. The current ratio of REO sales to existing sales is greater than the 18 percent recorded between 2007 and 2010 and the less than 1 percent a year during 2005 and 2006. According to Hanley Wood, LLC data, approximately 60 percent of all REO sales in the HMA during the 12 months ending September 2012 were in the submarket. The decline in REO sales partially resulted from an increase in short sales. According to the California Association of REAL-TORS®, 66 percent of distressed sales in California in September 2012 were short sales compared with 44 percent of distressed sales in September 2011.
The lack of vacant land, the high price of new homes, and tight mortgage lending standards are the main reasons for the low volume of new home sales. According to data from Hanley Wood, LLC, from 2007 through 2010, new home sales declined at an average an- nual rate of 6 percent, or 90 homes, to 1,175 homes sold compared with the
Sa
nta
An
a-A
na
he
im-I
rv
ine
, C
A •
CO
MP
RE
HE
NS
IVE
HO
US
ING
MA
RK
ET
AN
ALY
SIS
9
average of 1,525 homes sold annually during 2005 and 2006. During the 12 months ending September 2012, new home sales decreased by 130, or 20 percent, to 530 new homes sold com- pared with the 660 new homes sold during the previous 12-month period. From 2007 through 2010, the aver- age new home sales price declined by $48,700, or 6 percent, a year to $572,600 compared with the aver- age annual sales price of $767,600 recorded during 2005 and 2006. Dur- ing the 12 months ending September 2012, the average new home sales price increased by $90,800, or 16 percent, to $670,000 compared with the average new home sales price of $579,200 recorded during the previous 12-month period. Blackstone, a 795- home master-planned community in Brea, has completed 150 single-family homes since 2011, and prices cur-rently start at $550,000. Full comple-tion of the Blackstone community is expected during 2017.
Condominiums have represented approximately 25 percent of all new and existing home sales in the sub- market since 2005, according to data from Hanley Wood, LLC. From 2007 to 2010, condominium sales averaged 3,800 units a year. In 2005 and 2006, when lending practices were less stringent, condominium sales aver- aged 6,100 units a year. During the 12 months ending September 2012, con- dominium sales increased 1.4 percent, to 3,500 units sold, and the average sales price for a unit decreased 18 percent, to $276,900, compared with the corresponding figures recorded during the previous 12 months. Con- dominiums currently selling in this submarket include The Bungalows at Pacific Shores, in Huntington Beach, with prices starting at $605,000.
The level of distressed housing in the HMA is low compared with that of other counties in California. Accord-ing to LPS Applied Analytics, as of September 2012, 4.5 percent of home loans in the HMA were 90 or more days delinquent, were in foreclosure, or transitioned into REO, down from 6.1 percent in September 2011 and the 10th lowest rate among counties statewide. The September 2012 level of distressed housing was 17,750 homes, a decrease of 7,650 homes, or 30 percent, compared with the num- ber of distressed homes recorded in September 2011. Based on data from Hanley Wood, LLC, an estimated 60 percent of distressed homes in the HMA were in the North Orange County submarket.
Despite improved sales market con- ditions, single-family homebuilding activity, as measured by the number of single-family homes permitted, remains at low levels. From 2007 through 2010, an average of 640 homes were permitted a year, down from an average of 2,150 homes per- mitted annually from 2000 through 2006. According to preliminary data, permits were issued for 700 homes during the 12 months ending Septem-ber 2012, unchanged compared with the number permitted during the same period a year earlier. Figure 8 shows the number of single-family building permits issued in the sub- market from 2000 to the current date.
During the next 3 years, demand is estimated for 3,600 new sales units in the submarket (Table 1). The 180 homes currently under construction and some of the estimated 7,500 other vacant units in the submarket that may return to the sales housing market will satisfy a portion of the
Housing Market TrendsSales Market—North Orange County Submarket Continued
Sa
nta
An
a-A
na
he
im-I
rv
ine
, C
A •
CO
MP
RE
HE
NS
IVE
HO
US
ING
MA
RK
ET
AN
ALY
SIS
10
demand. Demand is expected to be stronger during the second and third years of the forecast period because
of increased net in-migration and greatest in the $525,000-to-$614,999 price range (Table 4).
Housing Market TrendsSales Market—North Orange County Submarket Continued
Note: The 180 homes currently under construction and a portion of the estimated 7,500 other vacant units in the submarket will likely satisfy some of the forecast demand.Source: Estimates by analyst
Table 4. Estimated Demand for New Market-Rate Sales Housing in the North Orange County Submarket, October 1, 2012, to October 1, 2015
Rental Market—North Orange County Submarket
the current date because growth in renter households outpaced growth in available rental properties. Economic contraction and stringent mortgage lending standards from 2007 through 2010 led to an increased preference for renting. Coincidentally, apartment construction activity from 2008 through the current date occurred at low levels. The apartment market is tighter than the overall rental market. According to Reis, Inc., during the third quarter of 2012, the apartment vacancy rate was 3.3 percent, down from 4.4 percent during the third quarter of 2011 and slightly less than the 3.5-percent rate for the Santa Ana
The rental housing market in the North Orange County submarket is currently tight. The current estimated rental vacancy rate is 4.7 percent, down from 5.7 percent in the 2010 Census (Figure 9). The vacancy rate decreased from 2010 through
Sources: 2000 and 2010—2000 Census and 2010 Census; current—estimates by analyst
2000 Current2010
2.4
4.7
5.76.0
4.0
2.0
0.0
Figure 9. Rental Vacancy Rates in the North Orange County Submarket, 2000 to Current
2000
2001
2002
2003
2004
2005
2006
Figure 8. Single-Family Building Permits Issued in the North Orange County Submarket, 2000 to 2012
Notes: Includes townhomes. Includes data through September 2012.Sources: U.S. Census Bureau, Building Permits Survey; estimates by analyst
3,000
2,500
2,000
1,500
1,000
500
0
2008
2009
2010
2011
2012
2007
Sa
nta
An
a-A
na
he
im-I
rv
ine
, C
A •
CO
MP
RE
HE
NS
IVE
HO
US
ING
MA
RK
ET
AN
ALY
SIS
11Housing Market TrendsRental Market—North Orange County Submarket Continued
HMA. The third quarter 2012 vacancy rates were lowest in the cities of Buena Park, Huntington Beach, Orange, and Santa Ana, at 1.8, 2.6, 1.9, and 3.0 percent, respectively. During the third quarter of 2012, average effective apart- ment rents in the submarket increased 4 percent, to nearly $1,400, from the same quarter a year ago, which is a similar increase as recorded for the HMA. In Buena Park, Huntington Beach, Orange, and Santa Ana, the average effective apartment rents were $1,350, $1,425, $1,525 and $1,450; they increased from 2 to 6 percent from the previous year.
More than 90 percent of all multifam-ily units constructed in the submarket since 2011 were apartments compared with approximately 75 percent of units built from 2000 to 2010. Multifamily construction activity, as measured by the number of units permitted, began to slow during 2008 because of the re-cession and tighter lending standards. From 2008 through 2011, an average of 730 units were permitted annually compared with the average of 1,950 units permitted annually from 2000 through 2007 (Figure 10). Based on preliminary data, multifamily
construction activity increased by approximately 450 units, or 48 percent, to 1,375 units during the 12 months ending September 2012 compared with multifamily construc-tion activity during the previous 12 months. Essex Skyline at MacArthur Place in Santa Ana, with 349 units, is one of the newest apartment develop-ments, completed in 2010. Apartments under construction or in planning are mostly concentrated in Santa Ana and Huntington Beach, including the 74-unit Station District, the 300-unit The Marke at South Coast Metro, and the 467-unit Bella Terra. Station District is expected to be complete by January 2013. Bella Terra, which was originally planned as a condominium project, is expected to be complete by the third quarter of 2013. The Marke at South Coast Metro began construc-tion in August 2012 and is expected to be complete by the end of 2013. Apartment rents in the submarket for newly constructed one-, two-, and three-bedroom units start at $1,700, $2,100, and $2,600, respectively.
During the 3-year forecast period, demand is expected for 5,300 new market-rate rental units in the North Orange County submarket (Table 1). The 1,175 units currently under con- struction will satisfy a portion of rental housing demand during the first year of the forecast period. Demand is expected to be stronger during the second and third years of the forecast because of increased net in-migration. Table 5 shows the estimated demand for new market-rate rental housing in the submarket by rent level and the number of bedrooms.
2012
2000
2001
2002
2003
2004
2005
2006
Figure 10. Multifamily Building Permits Issued in the North Orange County Submarket, 2000 to 2012
Notes: Excludes townhomes. Includes data through September 2012.Sources: U.S. Census Bureau, Building Permits Survey; estimates by analyst
3,500
3,000
2,500
2,00
1,500
1,00
500
0
2008
2009
2010
2011
2007
Sa
nta
An
a-A
na
he
im-I
rv
ine
, C
A •
CO
MP
RE
HE
NS
IVE
HO
US
ING
MA
RK
ET
AN
ALY
SIS
12
Sales Market—South Orange County Submarket
The sales housing market in the South Orange County submarket includes homes that are relatively newer than the homes in the North Orange County Submarket. Most homes in the South Orange County submarket have been built since 1980. According to Hanley Wood, LLC, more than 65 percent of new home sales in the Santa Ana HMA during the 12 months ending September 2012 occurred in this submarket, slightly more than the average of 60 percent from 2005 through 2010. New sales housing in the submarket during the next 3 years is expected to be built primarily on large parcels of vacant land in master-planned communities. New home construc-tion during the past 3 years has been concentrated in Irvine, the largest city in the submarket, which accounts for approximately 60 percent of all homes built in the submarket during the past 3 years, up from 40 percent from 2000 to 2010.
The new and existing home sales mar - ket in the submarket is currently bal-anced. The current estimated owner vacancy rate is 1.5 percent, down from 1.6 percent in April 2010 because the existing home sales market is improv-ing and the volume of distressed prop- erties declined. According to data
from Hanley Wood, LLC, from 2007 through 2010, new and existing home sales declined at an average annual rate of 10 percent, or by 2,200 homes, to total 12,300 homes sold compared with the average of 21,000 homes sold annually during 2005 and 2006. During the 12 months ending Sep-tember 2012, home sales increased by 1,350, or 10 percent, to 14,700 homes sold compared with the 13,350 homes sold during the previous 12-month period. The average new and existing home sales price increased by $5,900, or 0.9 percent, to $665,100 during the 12-month period ending September 2012 compared with the average price recorded during the previous 12 months. By comparison, from 2007 through 2010, the average home sales price declined by $27,700, or 3 percent, annually to $722,700 compared with the average sales price of $833,500 a year during 2005 and 2006.
The number of new home sales is cur - rently low compared with the number of new home sales during 2005 and 2006. According to data from Hanley Wood, LLC, from 2007 through 2010, home sales declined by an average of 560 homes, or 16 percent, annually to 1,300 homes sold compared with the average of 3,550 homes sold annually during 2005 and 2006. During the
Housing Market TrendsRental Market—North Orange County Submarket Continued
Notes: Numbers may not add to totals because of rounding. The 1,175 units currently under construction will satisfy some of the estimated demand.Source: Estimates by analyst
Zero Bedrooms One Bedroom Two Bedrooms Three or More Bedrooms
Monthly GrossRent ($)
Units of Demand
Monthly GrossRent ($)
Units of Demand
Monthly Gross Rent ($)
Units of Demand
Monthly Gross Rent ($)
Units of Demand
Table 5. Estimated Demand for New Market-Rate Rental Housing in the North Orange County Submarket, October 1, 2012, to October 1, 2015
1,400 to 1,599 420 1,700 to 1,899 1,475 2,100 to 2,299 1,475 2,600 to 2,799 3701,600 or more 110 1,900 to 2,099 420 2,300 to 2,499 420 2,800 to 2,999 110
2,100 or more 210 2,500 or more 210 3,000 or more 55Total 530 Total 2,125 Total 2,125 Total 530
Sa
nta
An
a-A
na
he
im-I
rv
ine
, C
A •
CO
MP
RE
HE
NS
IVE
HO
US
ING
MA
RK
ET
AN
ALY
SIS
13
12 months ending September 2012, new home sales decreased by 550, or 35 percent, to 1,000 homes sold compared with the 1,550 homes sold during the previous 12-month period. New home sales are down because stricter lending standards make it dif - ficult for prospective buyers to qualify for mortgages, especially for single-family detached homes. From 2007 through 2010, the average new home sales price declined by $20,500, or 2 percent, a year to $840,200 compared with the average $922,300 new home sales price recorded during 2005 and 2006. The average new home sales price increased by $20,250, or 3 per - cent, to $657,650 during the 12 months ending September 2012 compared with the average price recorded during the previous year. The Branches, in The Village of Woodbury in Irvine, will open in early 2013 with 48 single-family detached homes priced beginning at $900,000. Orange County Great Park, in Irvine, will have more than 10,000 homes when it is fully built out. The first 726 new homes are currently under construction. Home sales prices will range from $600,000 to more than $1 million. It will be at least a decade before all the homes in Orange County Great Park are complete.
Approximately 40 percent of all REO sales in the HMA during the 12 months ending September 2012 were in the South Orange County submarket. REO sales in the submar-ket averaged 2,300 a year from 2007 through 2010 and 80 a year in 2005 and 2006. During the 12 months ending September 2012, 2,575 REO homes sold in the submarket, representing 19 percent of existing home sales
compared with the 2,750 REO sales during the previous 12-month period, representing 23 percent of existing home sales.
Condominiums represent approx-imately 44 percent of all new and existing home sales in the submarket since 2005, according to data from Hanley Wood, LLC. Condominium sales averaged 5,350 units a year from 2007 through 2010. By comparison, in 2005 and 2006, condominium sales averaged 9,700 a year. During the 12 months ending September 2012, con-dominium sales increased 7 percent, to 6,000 units sold, and the average sales price for a unit decreased 12 percent, to $374,700, compared with the corresponding figures recorded during the previous 12 months. Prices for newly completed condominium units in The Village of Woodbury, in Irvine, and in Citrus Park, in Tustin, start in the mid-$300,000s.
Single-family home construction activity, as measured by the number of single-family homes permitted, improved as sales market conditions strengthened during the past year. The number of homes permitted averaged 1,000 a year from 2007 through 2010 compared with the average of 3,350 homes permitted annually from 2000 through 2006. Based on preliminary data, during the 12 months ending September 2012, the number of single-family homes permitted in- creased to 1,100, up 2 percent from the 1,075 homes permitted during the same period a year earlier. Figure 11 shows the number of single-family building permits issued in the submar-ket from 2000 to the current date.
Housing Market TrendsSales Market—South Orange County Submarket Continued
Sa
nta
An
a-A
na
he
im-I
rv
ine
, C
A •
CO
MP
RE
HE
NS
IVE
HO
US
ING
MA
RK
ET
AN
ALY
SIS
14
During the next 3 years, demand is expected for 4,050 new market-rate homes in the submarket (Table 1). The 290 homes currently under con- struction and some of the estimated 12,000 other vacant units in the sub-market that may return to the sales housing market will satisfy a portion of the demand. Demand is expected to be stronger during the second and third years of the forecast period be- cause of increased net in-migration and greatest in the $340,000-to-$449,999 price range. Table 6 illustrates the es - timated demand for new market-rate sales housing in the submarket by price range.
2000
2001
2002
2003
2004
2005
2006
Figure 11. Single-Family Building Permits Issued in the South Orange County Submarket, 2000 to 2012
Notes: Includes townhomes. Includes data through September 2012.Sources: U.S. Census Bureau, Building Permits Survey; estimates by analyst
Note: The 290 homes currently under construction and a portion of the estimated 12,000 other vacant units in the submarket will likely satisfy some of the fore-cast demand.Source: Estimates by analyst
Table 6. Estimated Demand for New Market-Rate Sales Housing in the South Orange County Submarket, October 1, 2012, to October 1, 2015
Rental Market—South Orange County Submarket
an average of 3,150 annually, that out - paced the increase in rental housing units, an average of 2,150 annually. The market for apartments is tight and is tighter than the overall rental housing market. According to data from Reis, Inc., during the third quar - ter of 2012, the apartment vacancy rate averaged 3.6 percent, down from 4.3 percent during the third quarter of 2011. The average effective apartment rent, which increased by $50, or 2.9 percent, to $1,800 during the same period, is 16 percent more than the current average effective rent for the Santa Ana HMA as a whole. The tightest segment of the submarket is the city of Newport Beach, with a vacancy rate of 1.8 percent in the
Rental housing market conditions in the South Orange County submarket are currently balanced. The estimated 5.0-percent vacancy rate is down from the 6.2-percent rate recorded in 2010 (Figure 12). The tightening of rental market conditions since 2010 resulted from an increase in renter households,
Housing Market TrendsSales Market—South Orange County Submarket Continued
Sources: 2000 and 2010—2000 Census and 2010 Census; current—estimates by analyst
2000 Current2010
4.25.0
6.2
8.0
6.0
4.0
2.0
0.0
Figure 12. Rental Vacancy Rates in the South Orange County Submarket, 2000 to Current
Sa
nta
An
a-A
na
he
im-I
rv
ine
, C
A •
CO
MP
RE
HE
NS
IVE
HO
US
ING
MA
RK
ET
AN
ALY
SIS
15
third quarter of 2012. The average effective apartment rent in Newport Beach was $2,075, an increase of $100, or 5 percent, from the third quarter of 2011.
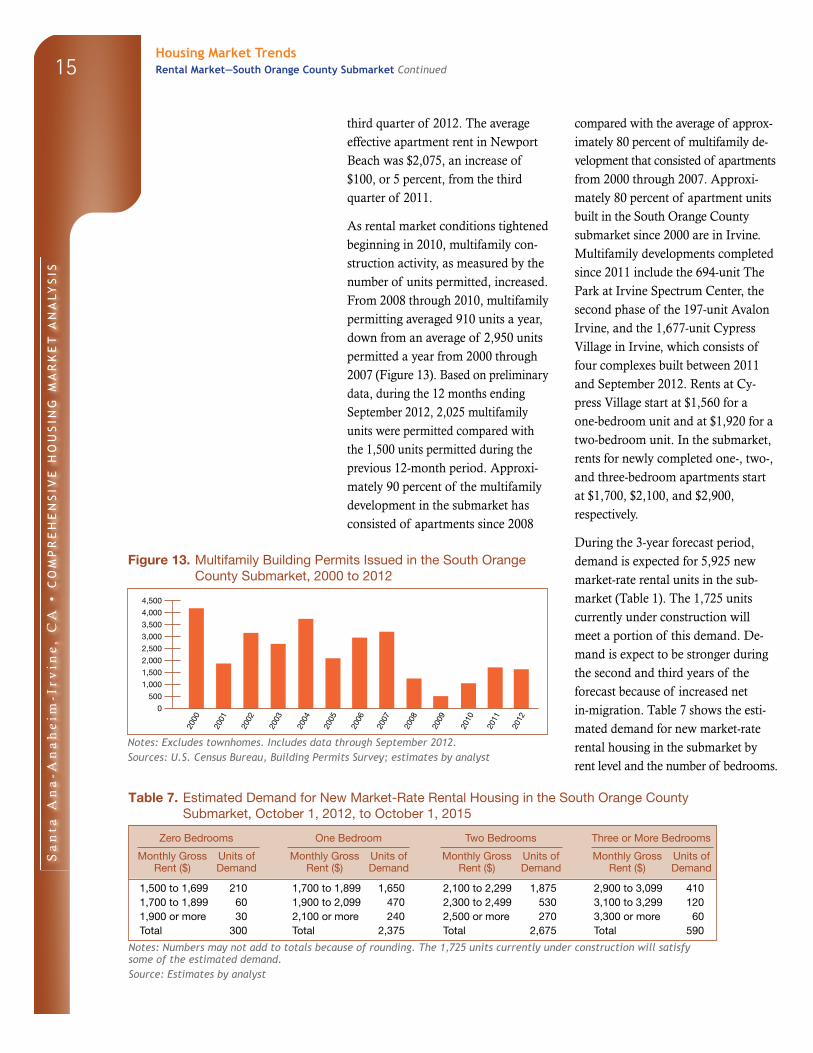
As rental market conditions tightened beginning in 2010, multifamily con- struction activity, as measured by the number of units permitted, increased. From 2008 through 2010, multifamily permitting averaged 910 units a year, down from an average of 2,950 units permitted a year from 2000 through 2007 (Figure 13). Based on preliminary data, during the 12 months ending September 2012, 2,025 multifamily units were permitted compared with the 1,500 units permitted during the previous 12-month period. Approxi-mately 90 percent of the multifamily development in the submarket has consisted of apartments since 2008
compared with the average of approx - imately 80 percent of multifamily de - velopment that consisted of apart ments from 2000 through 2007. Approxi-mately 80 percent of apartment units built in the South Orange County submarket since 2000 are in Irvine. Multifamily developments completed since 2011 include the 694-unit The Park at Irvine Spectrum Center, the second phase of the 197-unit Avalon Irvine, and the 1,677-unit Cypress Village in Irvine, which consists of four complexes built between 2011 and September 2012. Rents at Cy - press Village start at $1,560 for a one-bedroom unit and at $1,920 for a two-bedroom unit. In the submarket, rents for newly completed one-, two-, and three-bedroom apartments start at $1,700, $2,100, and $2,900, respectively.
During the 3-year forecast period, demand is expected for 5,925 new market-rate rental units in the sub- market (Table 1). The 1,725 units currently under construction will meet a portion of this demand. De- mand is expect to be stronger during the second and third years of the forecast because of increased net in-migration. Table 7 shows the esti - mated demand for new market-rate rental housing in the submarket by rent level and the number of bedrooms.
Housing Market TrendsRental Market—South Orange County Submarket Continued
2012
2000
2001
2002
2003
2004
2005
2006
Figure 13. Multifamily Building Permits Issued in the South Orange County Submarket, 2000 to 2012
Notes: Excludes townhomes. Includes data through September 2012.Sources: U.S. Census Bureau, Building Permits Survey; estimates by analyst
4,500
4,000
3,500
3,000
2,500
2,000
1,500
1,000
500
0
2008
2009
2010
2011
2007
Notes: Numbers may not add to totals because of rounding. The 1,725 units currently under construction will satisfy some of the estimated demand.Source: Estimates by analyst
Zero Bedrooms One Bedroom Two Bedrooms Three or More Bedrooms
Monthly GrossRent ($)
Units of Demand
Monthly GrossRent ($)
Units of Demand
Monthly Gross Rent ($)
Units of Demand
Monthly Gross Rent ($)
Units of Demand
Table 7. Estimated Demand for New Market-Rate Rental Housing in the South Orange County Submarket, October 1, 2012, to October 1, 2015
1,500 to 1,699 210 1,700 to 1,899 1,650 2,100 to 2,299 1,875 2,900 to 3,099 4101,700 to 1,899 60 1,900 to 2,099 470 2,300 to 2,499 530 3,100 to 3,299 1201,900 or more 30 2,100 or more 240 2,500 or more 270 3,300 or more 60Total 300 Total 2,375 Total 2,675 Total 590
Sa
nta
An
a-A
na
he
im-I
rv
ine
, C
A •
CO
MP
RE
HE
NS
IVE
HO
US
ING
MA
RK
ET
AN
ALY
SIS
16
* Santa Ana-Anaheim-Irvine HMA.
Notes: Numbers may not add to totals because of rounding. Employment data represent annual averages for 2000, 2010, and the 12 months through September 2012. Median family incomes are for 1999, 2009, and 2010.
Sources: U.S. Census Bureau; U.S. Department of Housing and Urban Development; estimates by analyst
Table DP-1. Santa Ana HMA* Data Profile, 2000 to Current
Average Annual Change (%)
2000 2010 Current 2000 to 2010 2010 to Current
Total resident employment 1,429,109 1,440,368 1,490,000 0.1 2.0
Unemployment rate 3.5 9.5 7.8
Nonfarm payroll jobs 1,388,900 1,353,700 1,386,000 – 0.3 1.4
Total population 2,846,289 3,010,232 3,076,000 0.6 0.9
Total households 935,287 992,781 1,008,000 0.6 0.6
Owner households 574,456 588,313 588,100 0.2 0.0
Percent owner 61.4% 59.3% 58.3%
Renter households 360,831 404,468 420,100 1.1 1.5
Percent renter 38.6% 40.7% 41.7%
Total housing units 969,484 1,048,907 1,057,000 0.8 0.3
Owner vacancy rate 0.9% 1.4% 1.4%
Rental vacancy rate 3.0% 5.9% 4.8%
Median family income $64,611 $86,100 $84,200 2.9 – 1.1
Data Profiles
Note: Numbers may not add to totals because of rounding.
Sources: U.S. Census Bureau; U.S. Department of Housing and Urban Development; estimates by analyst
Table DP-3. South Orange County Submarket Data Profile, 2000 to Current
Average Annual Change (%)
2000 2010 Current 2000 to 2010 2010 to Current
Total population 860,878 993,869 1,030,000 1.4 1.4
Total households 325,892 372,462 380,200 1.3 0.8
Owner households 223,324 236,424 236,300 0.6 0.0
Percent owner 68.5% 63.5% 62.2%
Rental households 102,568 136,038 143,900 2.9 2.3
Percent renter 31.5% 36.5% 37.8%
Total housing units 344,512 398,307 403,400 1.5 0.5
Owner vacancy rate 1.0% 1.6% 1.5%
Rental vacancy rate 4.2% 6.2% 5.0%
Note: Numbers may not add to totals because of rounding.
Sources: U.S. Census Bureau; U.S. Department of Housing and Urban Development; estimates by analyst
Table DP-2. North Orange County Submarket Data Profile, 2000 to Current
Average Annual Change (%)
2000 2010 Current 2000 to 2010 2010 to Current
Total population 1,985,411 2,016,363 2,046,000 0.2 0.6
Total households 609,395 620,319 628,000 0.2 0.5
Owner households 351,132 351,889 351,800 0.0 0.0
Percent owner 57.6% 56.7% 56.0%
Rental households 258,263 268,430 276,200 0.4 1.1
Percent renter 42.4% 43.3% 44.0%
Total housing units 624,972 650,600 653,500 0.4 0.2
Owner vacancy rate 0.8% 1.3% 1.2%
Rental vacancy rate 2.4% 5.7% 4.7%
Sa
nta
An
a-A
na
he
im-I
rv
ine
, C
A •
CO
MP
RE
HE
NS
IVE
HO
US
ING
MA
RK
ET
AN
ALY
SIS
17
Data Definitions and Sources
2000: 4/1/2000—U.S. Decennial Census
2010: 4/1/2010—U.S. Decennial Census
Current date: 10/1/2012—Analyst’s estimates
Forecast period: 10/1/2012–10/1/2015—
Analyst’s estimates
Demand: The demand estimates in the analysis
are not a forecast of building activity. They are
the estimates of the total housing production
needed to achieve a balanced market at the end
of the 3-year forecast period given conditions on
the as-of date of the analysis, growth, losses, and
excess vacancies. The estimates do not account
for units currently under construction or units in
the development pipeline.
Other Vacant Units: In the U.S. Department of
Housing and Urban Development’s (HUD’s)
analysis, other vacant units include all vacant
units that are not available for sale or for rent.
The term therefore includes units rented or sold
but not occupied; held for seasonal, recreational,
or occasional use; used by migrant workers; and
the category specified as “other” vacant by the
Census Bureau.
Building Permits: Building permits do not neces-
sarily reflect all residential building activity that
occurs in an HMA. Some units are constructed
or created without a building permit or are issued
a different type of building permit. For example,
some units classified as commercial structures are
not reflected in the residential building permits.
As a result, the analyst, through diligent fieldwork,