1 Department of Biological Sciences, PurdueUniversity, West Lafayette, Indiana, United States of America,2 Weldon School of Biomedical Engineering, PurdueUniversity, West Lafayette, Indiana, United States ofAmerica, 3 Knight Cancer Institute, Oregon Health & ScienceUniversity, Portland, Oregon, United States ofAmerica, 4 Department of Cell, Developmental & Cancer Biology, Oregon Health & ScienceUniversity,Portland, Oregon, United States of America, 5 Division of Hematology, Washington University School ofMedicine, St. Louis, Missouri, United States of America, 6 Center for Cancer Research, PurdueUniversity,West Lafayette, Indiana, United States of America
Since the advent of tyrosine kinase inhibitors (TKIs) such as imatinib, nilotinib, and dasati-nib, chronic myelogenous leukemia (CML) prognosis has improved greatly. However, ~30±40% of patients develop resistance to imatinib therapy. Althoughmost resistance is causedby mutations in the BCR-ABL kinase domain, 50±85% of these patients develop resistancein the absence of newmutations. In these cases, targeting other pathways may be neededto regain clinical response. Using label-free Raman spectromicroscopy, we evaluated anumber of leukemia cell lines and discovered an aberrant accumulation of cholesteryl ester(CE) in CML, which was found to be a result of BCR-ABL kinase activity. CE accumulationin CML was found to be a cancer-specific phenomenon as untransformed cells did not accu-mulate CE. Blocking cholesterol esterification with avasimibe, a potent inhibitor of acyl-CoAcholesterol acyltransferase 1 (ACAT-1), significantly suppressed CML cell proliferation inBa/F3 cells with the BCR-ABLT315I mutation and in K562 cells rendered imatinib resistantwithout mutations in the BCR-ABL kinase domain (K562R cells). Furthermore, the com-bination of avasimibe and imatinib caused a profound synergistic inhibition of cell prolifera-tion in K562R cells, but not in Ba/F3T315I. This synergistic effect was confirmed in a K562Rxenograft mouse model. Analysis of primary cells from a BCR-ABLmutation-independentimatinib resistant patient by mass cytometry suggested that the synergy may be due todownregulation of the MAPK pathway by avasimibe, which sensitized the CML cells to imati-nib treatment. Collectively, these data demonstrate a novel strategy for overcoming BCR-ABLmutation-independent TKI resistance in CML.
PLOSONE | https://doi.org/10.1371/journal.pone.0179558 July 18, 2017 1 / 15
maintained in the same medium as mentioned above. [19,20] K562R cell lines, which display
IM resistance in the absence of BCR-ABL mutations, were initially generated by culturing
naïve K562 cells with FGF2 and imatinib, as described previously.[21] Resistant K562R cells
were maintained in 0.5–1 μM imatinib. Multiple K562R cell lines were generated and tested
for similar behavior. Sequencing of the BCR-ABL and FGFR3 genes in K562R revealed no
mutations.
Inhibitors and reagentsImatinib (free base) for use in the in-vitro assays was purchased from ChemieTek and dis-
solved in DMSO. Avasimibe and imatinib mesylate (for in vivo experiments) were purchased
from SelleckChem. Imatinib mesylate was dissolved in water, while Avasimibe was always dis-
solved in DMSO.
Cell viability assaysCells were plated at 4000 cells per well on Day 0. Cell viability after treatment for 72 hours was
measured by intensity of luminescent signal as read by a SpectraMax M5 Plate Reader using
the ATP assay Cell Titer Glo reagent from Promega. Luminescent signal for each condition
was then normalized to the wells with no inhibitor. Control and treatment wells were always
treated with DMSO to equalize total volume across all wells. Combination index was analyzed
by the Chou-Talalay method using CompuSyn software.[22]
Mass cytometrySingle-cell protein analysis was performed using a CyTOF2 instrument at the Washington
University School of Medicine Immunomonitoring Laboratory according to previously pub-
lished procedures.[23] All metal-conjugated antibodies were purchased from Fluidigm. Cells
were treated with 1μM imatinib for 30 minutes or 10μM avasimibe for 4 hours. The full anti-
body panel used for analysis of patient samples is detailed in S1 Table. Data analysis was per-
formed using Cytobank as described previously,[23] with specific gating strategies detailed in
S4 Fig. Further analysis was performed using viSNE.[24] Details on gating of viSNE figures
can be found in S6 Fig.
Patient samplesAll patient samples were obtained with written consent according to a protocol approved by
the Washington University Human Studies Committee (WU no. 01–1014). All CML patient
samples had wild-type BCR-ABL (data not shown).
MousemodelsAll animal experiments were conducted following a protocol approved by the Purdue Animal
Care and Use Committee (PACUC). 4–6 week old athymic nude mice from Harlan Laborato-
ries were subcutaneously inoculated with 5x10⁶ K562R cells per mouse. Mice were anesthe-
tized using isoflurane inhalation when injection was performed. Every effort was made to
minimize suffering. Tumor volumes were measured using a caliper and calculated as 1/2 × L ×W2, where L stands for the length, and W for the width in mm. Mice were divided into four
groups (n = 8 each group) once average tumor volume reached approximately 100 mm3.
One group received only DMSO vehicle, one group received IM+ DMSO, one group received
avasimibe alone, and the fourth group received a combination of avasimibe and IM. Avasi-
mibe was administered daily by intraperitoneal injection at a dose of 7.5 mg/kg, and IM was
Targeting mutation-independent resistant CML
PLOSONE | https://doi.org/10.1371/journal.pone.0179558 July 18, 2017 3 / 15
pact, Angewandte Physik & Elektronik GmbH). The pump and Stokes beams were tuned to
830 nm and 1090 nm, respectively. The pump and Stokes pulse trains were collinearly over-
lapped and directed into a laser-scanning microscope (FV300, Olympus). A 60X water-immer-
sion objective lens (UPlanSApo, Olympus) was used to focus the laser into a sample. An oil
condenser of 1.4 numerical aperture (NA) was used to collect the signal in a forward direction.
The typical acquisition time for a 512 x 512 pixels SRL image was 1.12 second. Images were
processed using ImageJ. To quantify the LD area fraction, the LDs were picked up by applying
an intensity threshold. This same threshold was applied for each sample for one experiment.
The percentage of LDs area out of the total cellular area was measured.
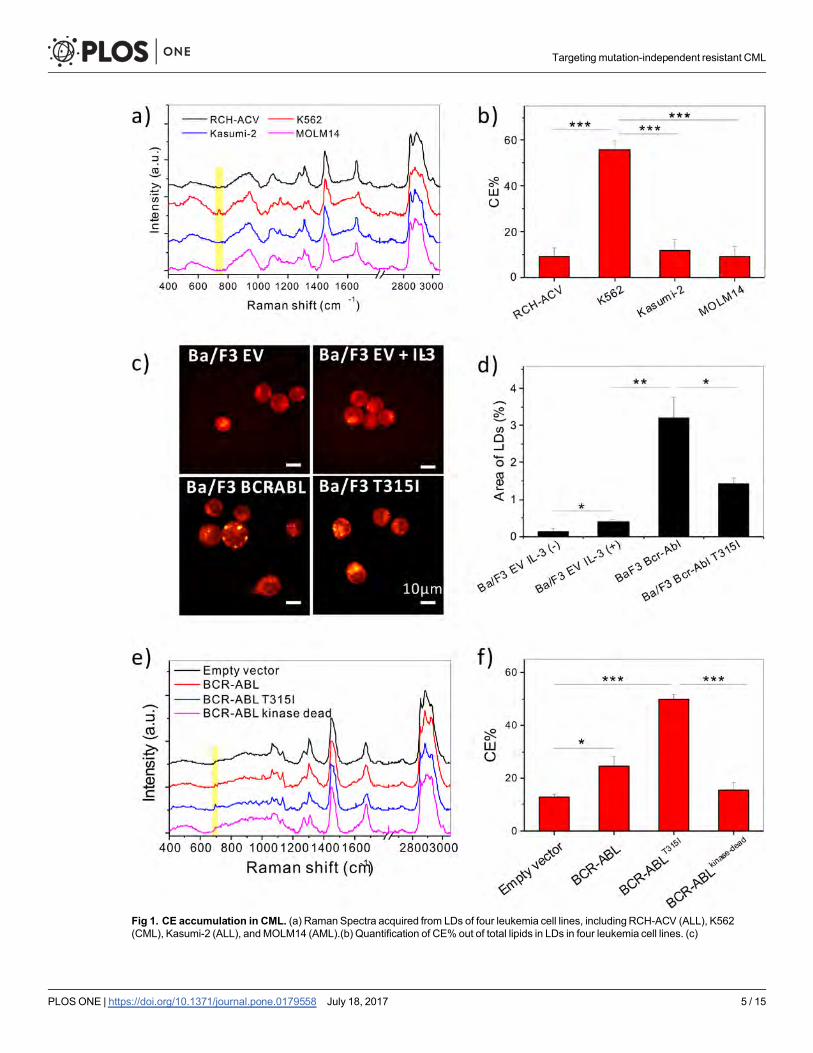
ResultsAbnormal CE accumulation in chronic myeloid leukemia (CML) is drivenby BCR-ABLTo characterize the lipid metabolism in leukemia cells, Raman spectral analysis was performed
on a variety of well-characterized leukemia cell lines, including MOLM14 (AML), RCH-ACV
(ALL), Kasumi-2 (ALL), and K562 (CML) cells. An abnormal accumulation of CE was identi-
fied in K562 cells, as evidenced by the peak at Raman shift of 702cm-1 from cholesterol ring
vibration [16] (Fig 1A). Quantitative analysis revealed a 50% level of CE in the lipid droplets of
K562 cells, but only around 10% in the other leukemia cell lines examined (Fig 1B).
Considering the correlation between BCR-ABL activation and CE accumulation in CML,
we hypothesized that BCR-ABL drives CE accumulation. To assess whether BCR-ABL was
necessary and sufficient to cause CE accumulation, a murine interleukin-3 dependent pro-B
cell line Ba/F3 was used. Ba/F3 cells overexpressing BCR-ABLWT, BCR-ABLT315I, or empty
vector (control) were subjected to SRS imaging to visualize LD accumulation in the three cell
lines (Fig 1C). Ba/F3 cells transduced with empty vector showed no accumulation of LDs,
regardless of whether they were stimulated with IL-3 for 48 hours. On the other hand, Ba/F3
BCR-ABLWT and Ba/F3 BCR-ABLT315I cells had LD accumulation even without IL-3 stimula-
tion (Fig 1C and 1D). Through Raman spectral analysis, these LDs were found to be mainly
Targeting mutation-independent resistant CML
PLOSONE | https://doi.org/10.1371/journal.pone.0179558 July 18, 2017 4 / 15
Fig 1. CE accumulation in CML. (a) Raman Spectra acquired from LDs of four leukemia cell lines, includingRCH-ACV (ALL), K562(CML), Kasumi-2 (ALL), andMOLM14 (AML).(b) Quantification of CE% out of total lipids in LDs in four leukemia cell lines. (c)
Targeting mutation-independent resistant CML
PLOSONE | https://doi.org/10.1371/journal.pone.0179558 July 18, 2017 5 / 15
ficantly more CE than empty vector controls. In contrast, 32D cells overexpressing BCR-
ABLkinase-dead did not induce accumulation of CE compared to empty vector control (Fig 1E
and 1F), indicating BCR-ABL kinase activity is necessary for CE accumulation. SRS Imaging
of 32D cells revealed that BCR-ABL kinase activity was required for LD accumulation in these
cells as well (S1C Fig). Treatment with avasimibe was sufficient to remove CE in Ba/F3 BCR-
ABLWT cells (S1D and S1E Fig), suggesting the potential of targeting cholesterol metabolism
in BCR-ABL driven CML.
Avasimibe resensitizes BCR-ABLmutation-independent imatinib-resistant CML in vitroTo test whether CE accumulation occurs in BCR-ABL mutation-independent IM resistant
CML, the K562R cell line was established.[21] This cell line was rendered imatinib-resistant by
BCR-ABL independent mechanisms, and is grown without loss of viability in 1μM imatinib.
SRS imaging was used to visualize the LDs in individual K562R cells, as compared to K562.
SRS imaging showed noticeable LD accumulation in both cell lines (Fig 2A). Raman spectral
analysis on individual lipid droplets confirmed a high percentage of CE in their LDs (Fig 2B).
To test whether avasimibe could overcome imatinib resistance in CML, K562R cells dis-
playing BCR-ABL mutation-independent resistance were treated with avasimibe and imatinib.
The combination of avasimibe and imatinib at a 10:1 fixed concentration ratio in K562R cells
yielded a significant reduction in cell viability at all concentrations tested (Fig 2C and 2D). The
combination index (CI) as defined by the Chou-Talalay method[22] indicated a strong syner-
gistic effect between avasimibe and imatinib (S2 Fig). This synergy was unique to BCR-ABL
mutation-independent imatinib resistant K562R cells, as the combination of avasimibe and
imatinib did not show a synergistic effect in naïve K562 cells (Fig 2E and 2F) or BCR-ABL
dependent imatinib resistant Ba/F3 BCR-ABLT315I cells (S2 and S3 Figs).
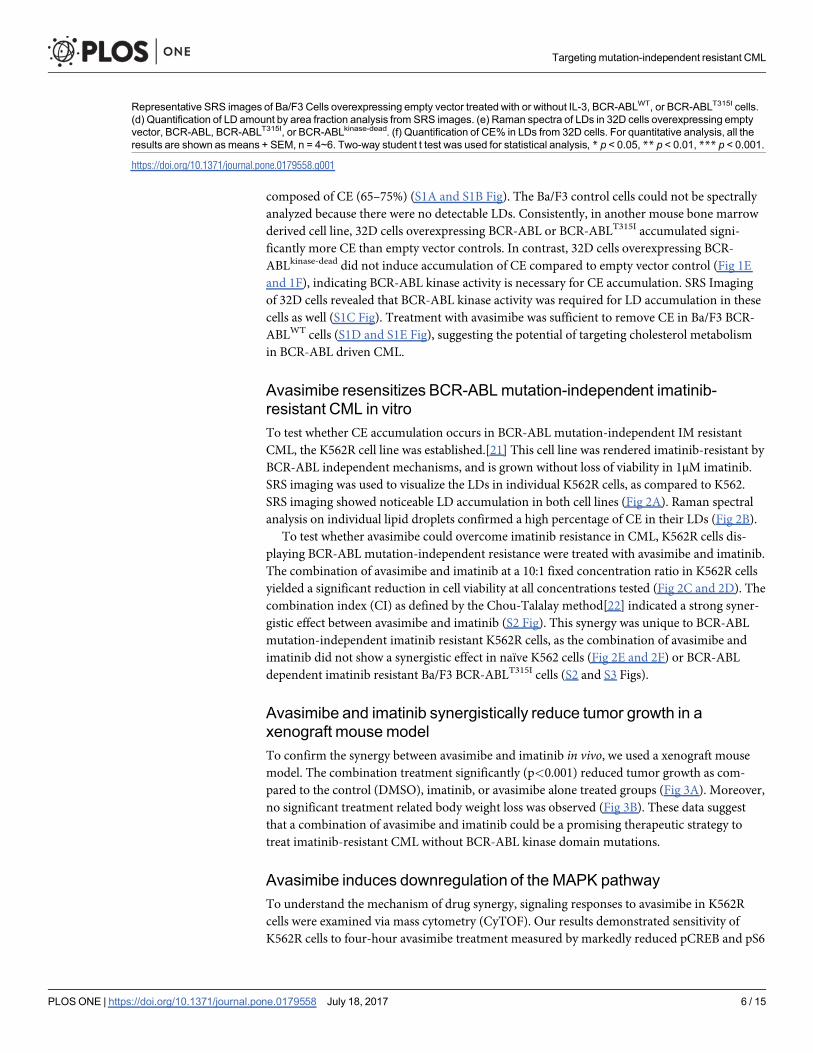
Avasimibe and imatinib synergistically reduce tumor growth in axenograft mousemodelTo confirm the synergy between avasimibe and imatinib in vivo, we used a xenograft mouse
model. The combination treatment significantly (p<0.001) reduced tumor growth as com-
pared to the control (DMSO), imatinib, or avasimibe alone treated groups (Fig 3A). Moreover,
no significant treatment related body weight loss was observed (Fig 3B). These data suggest
that a combination of avasimibe and imatinib could be a promising therapeutic strategy to
treat imatinib-resistant CML without BCR-ABL kinase domain mutations.
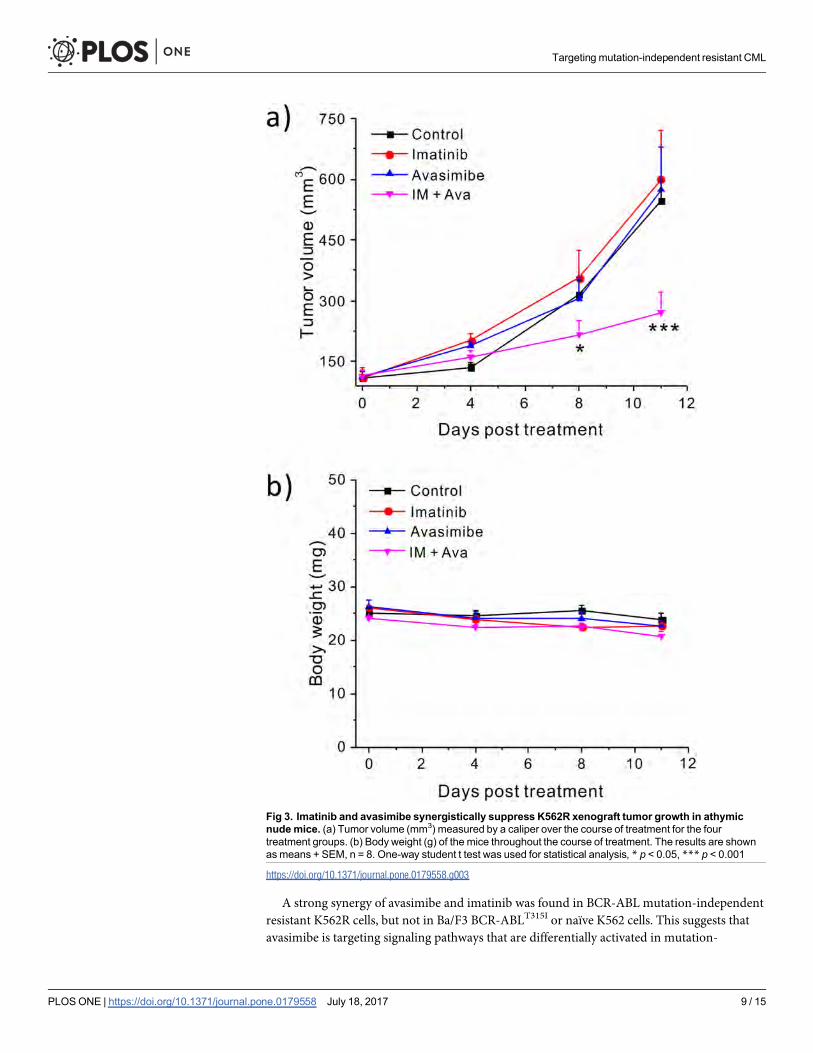
Avasimibe induces downregulation of the MAPK pathwayTo understand the mechanism of drug synergy, signaling responses to avasimibe in K562R
cells were examined via mass cytometry (CyTOF). Our results demonstrated sensitivity of
K562R cells to four-hour avasimibe treatment measured by markedly reduced pCREB and pS6
Representative SRS images of Ba/F3 Cells overexpressing empty vector treated with or without IL-3, BCR-ABLWT, or BCR-ABLT315I cells.(d) Quantification of LD amount by area fraction analysis from SRS images. (e) Raman spectra of LDs in 32D cells overexpressing emptyvector, BCR-ABL, BCR-ABLT315I, or BCR-ABLkinase-dead. (f) Quantification of CE% in LDs from 32D cells. For quantitative analysis, all theresults are shown asmeans + SEM, n = 4~6. Two-way student t test was used for statistical analysis, * p < 0.05, ** p < 0.01, *** p < 0.001.
https://doi.org/10.1371/journal.pone.0179558.g001
Targeting mutation-independent resistant CML
PLOSONE | https://doi.org/10.1371/journal.pone.0179558 July 18, 2017 6 / 15
Fig 2. Imatinib and avasimibe show a significant synergy in inhibiting viability of K562R cells. (a) Representative SRSimages of K562 and K562R cells. (b) Quantification of CE% in LDs of K562 and K562R cells. The results are shown as means+ SEM, n = 6. Two-way student t test was used for statistical analysis; n.s. indicates no significance. (c) 3D contour plot withcolormap (d) linear plot of K562R cells treated with imatinib, avasimibe, or combination of imatinib and avasimibe at a molarconcentration ratio of 1: 10 (IM: Ava) for 72 hours. (e) 3D contour plot with colormap (f) linear plot of K562 cells treated with imatinib,
Targeting mutation-independent resistant CML
PLOSONE | https://doi.org/10.1371/journal.pone.0179558 July 18, 2017 7 / 15
levels (Fig 4A). These findings implicated the MAPK pathway as a downstream target of avasi-
mibe, which has been previously suggested.[15] To further investigate this, we performed mass
cytometry screening of primary cells obtained from four BCR-ABL-independent resistant
(RCML) and four imatinib-sensitive CML patients (SCML). We measured a number of phos-
pho-markers (S1 Table) including five MAPK pathway proteins: p-p38, pCREB, pS6, pERK1/
2, and pMAPKAP2. Phosphorylation of all MAPK proteins except pCREB were significantly
reduced by imatinib in sensitive CML patients (Fig 4B). In contrast, no significant reduction
in phosphorylation of the individual MAPK proteins was observed in resistant patients (Fig
4B). In addition, by performing a pooled analysis of the MAPK proteins, we determined that
imatinib differentially affected sensitive but not resistant patients (p = .0013) (Fig 4B). With
combination treatment, a significant difference in pERK levels was observed for resistant ver-
sus sensitive patients (Fig 4C), and a trend toward greater sensitivity was observed for pCREB,
pS6, and p-p38 (but not pMAPKAP2) (Fig 4D, S5 Fig). These results collectively show that
imatinib is sufficient to inhibit MAPK in sensitive patients, but combination therapy is capable
and required to inhibit MAPK pathway proteins in resistant patients.
Due to the fact that K562R cells proliferate unhindered in lower concentrations of imatinib,
we investigated the effect of lower-dose imatinib in combination with avasimibe on cell signal-
ing in normal bone marrow as well as peripheral blood from a resistant (RCML1) patient and
a sensitive (SCML4) patient, which were selected based upon sample availability. Mass cytome-
try analysis revealed that Lin- CD34+ CD38− cells in the imatinib-sensitive patient were pro-
foundly sensitive to imatinib treatment, while combination treatment provided minimal
additional effect on the levels of eight intracellular signaling markers (Fig 4E). Combination
therapy also had minimal effect in normal bone marrow. The resistant patient’s cells also dis-
played sensitivity to imatinib as measured by pCRKL levels (canonical downstream target of
BCR-ABL), suggesting that the resistance was indeed through BCR-ABL-independent mecha-
nisms. However, in the resistant patient, imatinib treatment led to increased levels of p-p65/
NFκB, p-p38/MAPK in hematopoietic stem and progenitor cells (Fig 4E and 4F, S7 Fig). Ava-
simibe treatment reversed the effect of imatinib, leading to reduced p-p65/NFκB and p-p38
levels in multiple progenitor populations (Fig 4E and 4F, S7 Fig). In the presence of imatinib,
49.7% of the cells were positive for p-p38 and/or p-p65/NFκB, while the addition of avasimbe
to imatinib led to a reduction in the number of positive cells to 10.39% (Fig 4F). To understand
the effect of treatment across the hematopoietic spectrum, viSNE[24], a dimensionality reduc-
tion tool, was used to demonstrate activation of p-p65/NFκB, p-p38, and pCREB broadly
across the myeloid spectrum as a result of imatinib treatment, which was reversed by combina-
tion treatment (S6 and S7 Figs).
DiscussionThis study identifies CE accumulation as a unique feature of CML cells that could be a poten-
tial leukemia-specific target in future therapy. Constitutive BCR-ABL kinase activity was
found to be sufficient and necessary to cause CE and LD accumulation. Prior clinical trials
with the ACAT-1 inhibitor avasimibe to assess safety in atherosclerosis patients have demon-
strated that this drug can be safely administered with minimal toxicity.[26] Our data suggest
that avasimibe could specifically target cancer cells with minimal toxicity to blood cells lacking
BCR-ABL.
avasimibe, or combination of imatinib and avasimibe at a molar concentration ratio of 1: 10 (IM: Ava) for 72 hours.Viability wasmeasured using the Cell Titer Glo assay, with all viabilities normalized to no inhibitor treatment group. The results are shown asmeans + SEM, n = 3.
https://doi.org/10.1371/journal.pone.0179558.g002
Targeting mutation-independent resistant CML
PLOSONE | https://doi.org/10.1371/journal.pone.0179558 July 18, 2017 8 / 15
A strong synergy of avasimibe and imatinib was found in BCR-ABL mutation-independent
resistant K562R cells, but not in Ba/F3 BCR-ABLT315I or naïve K562 cells. This suggests that
avasimibe is targeting signaling pathways that are differentially activated in mutation-
Fig 3. Imatinib and avasimibe synergistically suppress K562R xenograft tumor growth in athymicnudemice. (a) Tumor volume (mm3) measured by a caliper over the course of treatment for the fourtreatment groups. (b) Body weight (g) of the mice throughout the course of treatment. The results are shownasmeans + SEM, n = 8. One-way student t test was used for statistical analysis, * p < 0.05, *** p < 0.001
https://doi.org/10.1371/journal.pone.0179558.g003
Targeting mutation-independent resistant CML
PLOSONE | https://doi.org/10.1371/journal.pone.0179558 July 18, 2017 9 / 15
Fig 4. Avasimibe downregulates the MAPKpathway. (a) Contour biaxials of pS6 (y-axis) and pCREB (x-axis) gated on pCRKL+ cells collected by CyTOF in K562R cells. Cells were treated for 0 or 4 hours with10μMavasimibe. (b) Effect of 30 minute 5μMimatinib treatment on sensitive and resistant patients normalized to the basal condition on the pooledMAPK pathway proteins
Targeting mutation-independent resistant CML
PLOSONE | https://doi.org/10.1371/journal.pone.0179558 July 18, 2017 10 / 15
independent resistant CML compared to imatinib-naïve CML, or CML where resistance is a
result of a BCR-ABL kinase-domain point mutation. However, it is worth noting that avasi-
mibe monotherapy was sufficient to significantly inhibit Ba/F3T315I and naïve K562 cell
growth, which is consistent with their increased CE storage. It should be noted, however, that
the data does not specifically support a role for CE in causing imatinib resistance, as both
naïve K562 and K562R accumulate CE.
Mass cytometric analysis showed the effect of avasimibe on the MAPK pathway, which may
contribute to the synergy of the two drugs specifically in resistant CML. MAPK has been
shown to be a key regulator of BCR-ABL-independent imatinib resistance.[7] The mass
cytometry results showed that imatinib alone is more potent in reducing MAPK protein phos-
phorylation in imatinib-sensitive patients than in resistant patients. This could be a result of
MAPK activity in resistant patients being by driven by BCR-ABL independent mechanisms. In
addition, our data showed that combination treatment had a stronger suppressive effect on the
MAPK pathway in resistant patients, which could explain why K562R cells but not K562 cells
respond synergistically to combination therapy.
Characterization of the mechanism of drug synergy by mass cytometry in a lower concen-
tration of imatinib also revealed that the NFκB pathways may be another important regulator
of BCR-ABL mutation-independent imatinib resistance. The NFκB pathway is known to have
significant cross-talk with the MAPK pathway[27], which means that the NFκB effect is likely
to be a result of MAPK activity. Thus, avasimibe could potentially resensitize resistant cells to
imatinib treatment by inhibiting MAPK and NFκB activity while also causing free cholesterol
mediated toxicity.[15] The synergistic inhibition of p-p38/MAPK and NFκB in IM-resistant
patient samples by combination treatment provides a potential mechanism for our observed
synergy in viability assays. Our data from the K562R xenograft mouse model further showed
that inhibiting only BCR-ABL with imatinib or only MAPK/cholesterol esterification with ava-
simibe is not sufficient, but combination therapy significantly attenuated tumor growth. That
finding is correlated with the fact that combination therapy was required to achieve decreased
phosphorylation of all measured MAPK proteins in our mass cytometry experiments.
Together, these results suggest that therapies targeting multiple drivers of leukemic prolifera-
tion may be needed to achieve a deeper treatment response in BCR-ABL mutation-indepen-
dent resistant CML.
In summary, our data show that the combination of avasimibe and imatinib synergistically
suppresses BCR-ABL mutation-independent imatinib-resistant CML proliferation by target-
ing cancer-specific CE accumulation, MAPK, and native BCR-ABL signaling. This drug
combination is clinically relevant, as both of these drugs have been evaluated in clinical trials
to assess their safety in humans. This approach also suggests the potential for combining
together (All) and individually. Error bars represent standard deviation of fold change in each group of patients. T-tests wereconducted comparing fold change in resistant patients to sensitive patients (p-values shown) and for general reduction inphosphorylation (*- p<0.05) (c-d) Bar graphs showing fold change of median protein expression after 10μM avasimibe andcombination therapy normalized to 5μM imatinib in resistant and sensitive CML patients (n = 4 for all groups except SCML3wasomitted in the pERK group because zero pERK signal was observed). Imatinib treatment was for thirty minutes while avasimibetreatment was for four hours. (e) Heatmaps of CyTOF screens of non-lymphoid CD34+ CD38− cells from cryopreserved bonemarrow from a normal patient (top), cryopreserved bulk PBMCs from an imatinib-sensitive patient (middle), and cryopreservedbulk PBMCs from an imatinib-resistant patient without a BCR-ABL kinase domainmutation (bottom). Cells were treated with noinhibitor, 1μM imatinib, 10μMavasimibe, or imatinib plus avasimibe at the same concentrations. Imatinib stimulationwas done for30 minutes, while avasimibe stimulationwas done for four hours. Heatmap tile color represents arcsinh ratio of mediansnormalized to the basal condition for each patient, see Bendall et al. 2011[23] for details. (f) Biaxials of p-p65/NFκB on the x-axisversus p-p38/MAPK on the y-axis in Lin- CD34+ CD38− collected by CyTOF from the resistant patient. Each plot represents one ofthe four stimulation conditions: basal (top left), imatinib (top right), avasimibe (bottom left), and imatinib + avasimibe (bottom right).The contour represents cell density.
https://doi.org/10.1371/journal.pone.0179558.g004
Targeting mutation-independent resistant CML
PLOSONE | https://doi.org/10.1371/journal.pone.0179558 July 18, 2017 11 / 15
marker signal intensity, with red being the maximum intensity.
(DOCX)
S1 Table. Detailed information about the antibody panels used for the CyTOF experiments
presented in this manuscript.
(XLSX)
AcknowledgmentsThis work was partially supported by a grant from Walther Cancer Foundation to JXC.
This work was supported by NIH grant K08HL106576 to STO. Support for patient sample
collection and processing was provided by NIH grant P01CA101937. Technical support was
provided by the Alvin J. Siteman Cancer Center Tissue Procurement Core Facility, Flow
Cytometry Core, and Immunomonitoring Laboratory, which are supported by NCI Cancer
Center Support Grant P30CA91842. The Immunomonitoring Laboratory is also supported by
the Andrew M. and Jane M. Bursky Center for Human Immunology and Immunotherapy
Programs. The authors thank C. Miner and O. Malkova for assistance with mass cytometry
experiments.
Author ContributionsConceptualization: SB JL STO JXC.
Data curation: SB JL.
Formal analysis: SB JL.
Funding acquisition: STO JXC.
Investigation: SB JL.
Methodology: SB JL ET JWT STO JXC.
Project administration: SB JL STO JXC.
Resources: ET JWT AZ STO JXC.
Supervision: STO JXC.
Validation: SB JL.
Visualization: SB JL STO JXC.
Writing – original draft: SB JL.
Writing – review & editing: SB JL ET JWT STO JXC.
References1. HochhausA, O'Brien SG, Guilhot F, Druker BJ, Branford S, Foroni L, et al. (2009) Six-year follow-up of
patients receiving imatinib for the first-line treatment of chronicmyeloid leukemia. Leukemia 23: 1054±1061. https://doi.org/10.1038/leu.2009.38 PMID: 19282833
2. Ai J, Tiu RV (2014) Practical management of patients with chronicmyeloid leukemiawho develop tyro-sine kinase inhibitor-resistant BCR-ABL1mutations. Ther Adv Hematol. Sage UK: London,England. pp. 107±120. https://doi.org/10.1177/2040620714537865
3. Michallet M, TulliezM, Corm S, GardembasM, Huguet F, Oukessou A, et al. (2010)Management ofchronicmyeloid leukaemia in clinical practice in France: results of the French subset of patients fromthe UNIC study. Curr Med Res Opin 26: 307±317. https://doi.org/10.1185/03007990903479299PMID:19961284
Targeting mutation-independent resistant CML
PLOSONE | https://doi.org/10.1371/journal.pone.0179558 July 18, 2017 13 / 15
4. Thielen N, van der Holt B, Cornelissen JJ, Verhoef GE, Gussinklo T, Biemond BJ, et al. (2013) Imatinibdiscontinuation in chronic phasemyeloid leukaemia patients in sustained complete molecular response:a randomised trial of the Dutch-Belgian Cooperative Trial for Haemato-Oncology (HOVON). Eur J Can-cer 49: 3242±3246. https://doi.org/10.1016/j.ejca.2013.06.018 PMID: 23876833
5. Bixby D, TalpazM (2009)Mechanisms of resistance to tyrosine kinase inhibitors in chronicmyeloid leu-kemia and recent therapeutic strategies to overcome resistance. ASH Education ProgramBook 2009:461±476.
6. Chen Y-f, Fu L-w (2011)Mechanisms of acquired resistance to tyrosine kinase inhibitors. Acta PharmSin B 1: 197±207.
7. Ma L, Shan Y, Bai R, Xue L, Eide CA, Ou J, et al. (2014) A therapeutically targetablemechanism ofBCR-ABL±independent imatinib resistance in chronicmyeloid leukemia. Sci Transl Med 6: 252ra121±252ra121. https://doi.org/10.1126/scitranslmed.3009073PMID: 25186176
8. Currie E, Schulze A, Zechner R, Walther Tobias C, Farese Robert V Jr (2013) Cellular Fatty AcidMetabolism andCancer. Cell Metab 18: 153±161. https://doi.org/10.1016/j.cmet.2013.05.017PMID:23791484
9. Santos CR, Schulze A (2012) Lipidmetabolism in cancer. FEBS J 279: 2610±2623. https://doi.org/10.1111/j.1742-4658.2012.08644.x PMID: 22621751
10. Menendez JA, LupuR (2007) Fatty acid synthase and the lipogenic phenotype in cancer pathogenesis.Nat Rev Cancer 7: 763±777. https://doi.org/10.1038/nrc2222 PMID: 17882277
11. Li J, Cheng J-X (2014) Direct Visualization of De novo Lipogenesis in Single Living Cells. ScientificReports 4: 6807. https://doi.org/10.1038/srep06807 PMID: 25351207
12. Antalis C, Arnold T, Rasool T, Lee B, Buhman K, Siddiqui R (2010) High ACAT1 expression in estrogenreceptor negative basal-like breast cancer cells is associated with LDL-induced proliferation. BreastCancer Res Treat 122: 661±670. https://doi.org/10.1007/s10549-009-0594-8 PMID: 19851860
13. MulasMF, Abete C, Pulisci D, Pani A, Massidda B, DessõÁS, et al. (2011) Cholesterol esters as growthregulators of lymphocytic leukaemia cells. Cell Prolif 44: 360±371. https://doi.org/10.1111/j.1365-2184.2011.00758.x PMID: 21645151
14. Bemlih S, Poirier MD, El Andaloussi A (2010) Acyl-coenzyme A: cholesterol acyltransferase inhibitorAvasimibe affect survival and proliferation of glioma tumor cell lines. Cancer Biol Ther 9: 1025±1032.PMID: 20404512
15. Li J, Gu D, Lee SS, Song B, Bandyopadhyay S, Chen S, et al. (2016) Abrogating cholesterol esterifica-tion suppresses growth andmetastasis of pancreatic cancer. Oncogene 35: 6378±6388. https://doi.org/10.1038/onc.2016.168 PMID: 27132508
16. Yue S, Li J, Lee S-Y, Lee Hyeon J, Shao T, Song B, et al. (2014) Cholesteryl Ester AccumulationInduced by PTEN Loss and PI3K/AKT Activation UnderliesHuman Prostate Cancer Aggressiveness.Cell Metab 19: 393±406. https://doi.org/10.1016/j.cmet.2014.01.019 PMID: 24606897
17. Lee SS-Y, Li J, Tai JN, Ratliff TL, Park K, Cheng J-X (2015) Avasimibe Encapsulated in Human SerumAlbumin Blocks Cholesterol Esterification for Selective Cancer Treatment. ACS Nano 9: 2420±2432.https://doi.org/10.1021/nn504025aPMID: 25662106
18. Bemlih S, Poirier MD, El Andaloussi A (2010) Acyl-coenzyme A: cholesterol acyltransferase inhibitorAvasimibe affect survival and proliferation of glioma tumor cell lines. Cancer Biol Ther 9: 1025±1032.PMID: 20404512
19. Johnson KJ, Griswold IJ, O'Hare T, Corbin AS, LoriauxM, Deininger MW, et al. (2009) A BCR-ABLmutant lacking direct binding sites for the GRB2, CBL and CRKL adapter proteins fails to induce leuke-mia in mice. PLoSONE 4: 0007439.
20. La RoseÂe P, Corbin AS, Stoffregen EP, Deininger MW, Druker BJ (2002) Activity of the Bcr-Abl KinaseInhibitor PD180970 against Clinically Relevant Bcr-Abl Isoforms That Cause Resistance to ImatinibMesylate (Gleevec, STI571). Cancer Res 62: 7149. PMID: 12499247
21. Traer E, Javidi-Sharifi N, Agarwal A, Dunlap J, English I, Martinez J, et al. (2014) Ponatinib overcomesFGF2-mediated resistance in CML patients without kinase domainmutations. Blood 123(10): 1516±1524. https://doi.org/10.1182/blood-2013-07-518381 PMID: 24408322
22. Chou T-C (2010) Drug CombinationStudies and Their Synergy Quantification Using the Chou-TalalayMethod. Cancer Res 70: 440±446. https://doi.org/10.1158/0008-5472.CAN-09-1947PMID: 20068163
23. Bendall SC, Simonds EF, Qiu P, Amir E-aD, Krutzik PO, Finck R, et al. (2011) Single-Cell Mass Cytom-etry of Differential Immune andDrug Responses Across a HumanHematopoietic Continuum. Science332: 687±696. https://doi.org/10.1126/science.1198704 PMID: 21551058
24. Amir E-aD, Davis KL, TadmorMD, Simonds EF, Levine JH, Bendall SC, et al. (2013) viSNE enablesvisualization of high dimensional single-cell data and reveals phenotypic heterogeneity of leukemia. NatBiotech 31: 545±552.
Targeting mutation-independent resistant CML
PLOSONE | https://doi.org/10.1371/journal.pone.0179558 July 18, 2017 14 / 15